Exhibit 99.5

| 4TH QUARTER AND FULL YEAR RESULTS 15 MAY 2003 |
| Agenda Overview - Peter Macdonald, CEO Financial Review - Phillip Morley, CFO Operating Review - Peter Macdonald, CEO Questions and Answers |
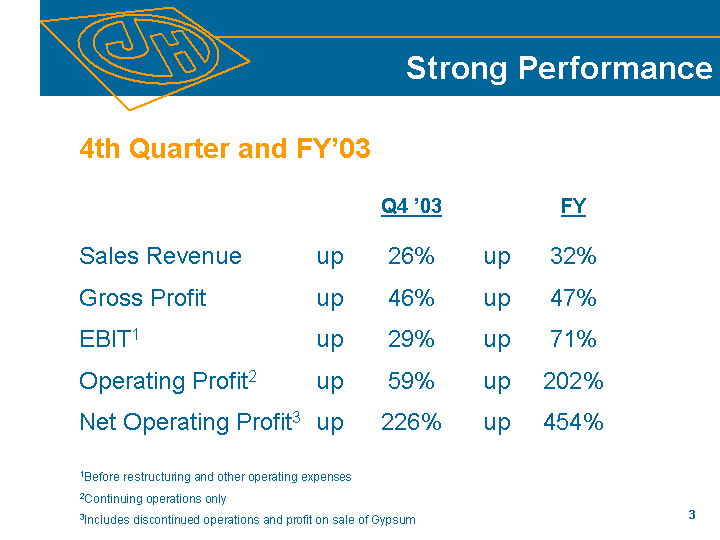
| Strong Performance 4th Quarter and FY'03 454% up 226% up Net Operating Profit3 202% up 59% up Operating Profit2 71% up 29% up EBIT1 47% up 46% up Gross Profit 32% up 26% up Sales Revenue FY Q4 '03 1Before restructuring and other operating expenses 2Continuing operations only 3Includes discontinued operations and profit on sale of Gypsum |
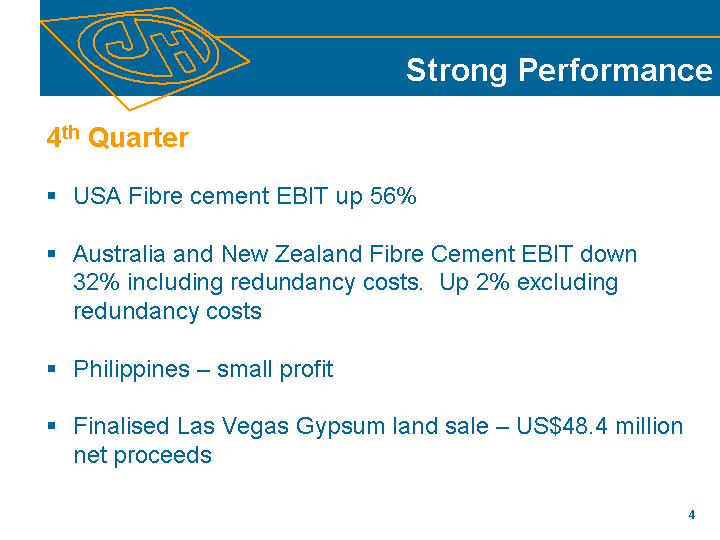
| Strong Performance 4th Quarter USA Fibre cement EBIT up 56% Australia and New Zealand Fibre Cement EBIT down 32% including redundancy costs. Up 2% excluding redundancy costs Philippines - small profit Finalised Las Vegas Gypsum land sale - US$48.4 million net proceeds |
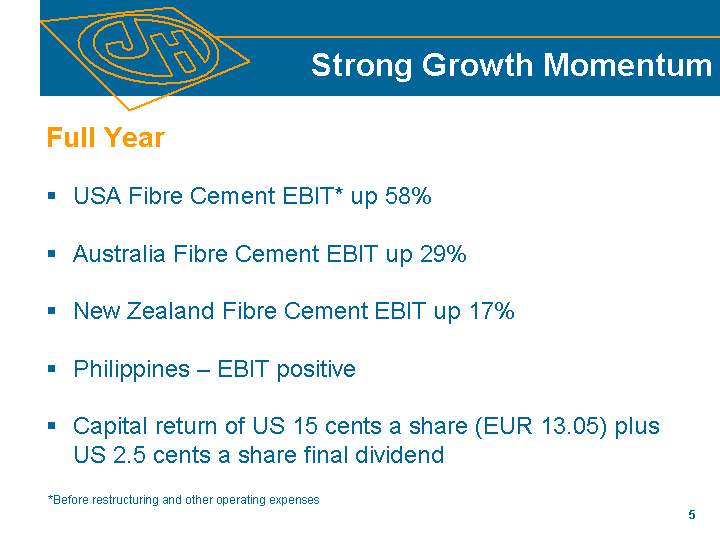
| Strong Growth Momentum Full Year USA Fibre Cement EBIT* up 58% Australia Fibre Cement EBIT up 29% New Zealand Fibre Cement EBIT up 17% Philippines - EBIT positive Capital return of US 15 cents a share (EUR 13.05) plus US 2.5 cents a share final dividend *Before restructuring and other operating expenses |
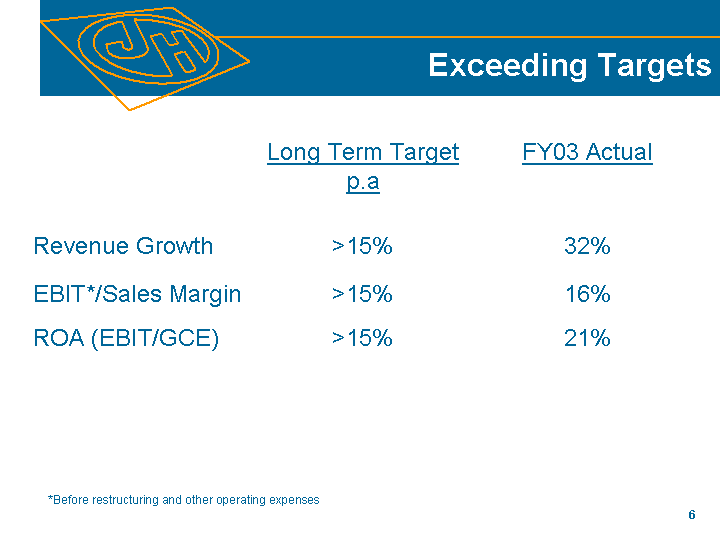
| Exceeding Targets Long Term Target p.a FY03 Actual Revenue Growth >15% 32% EBIT*/Sales Margin >15% 16% ROA (EBIT/GCE) >15% 21% *Before restructuring and other operating expenses |
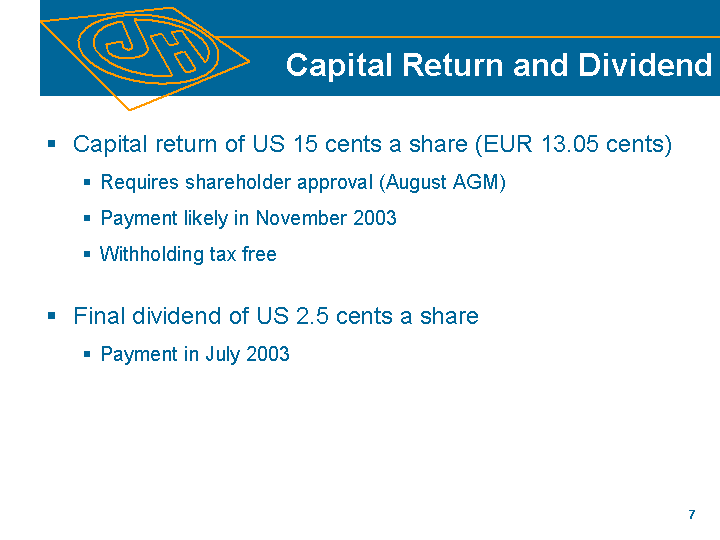
| Capital Return and Dividend Capital return of US 15 cents a share (EUR 13.05 cents) Requires shareholder approval (August AGM) Payment likely in November 2003 Withholding tax free Final dividend of US 2.5 cents a share Payment in July 2003 |
| Financial Review Phillip Morley, CFO |
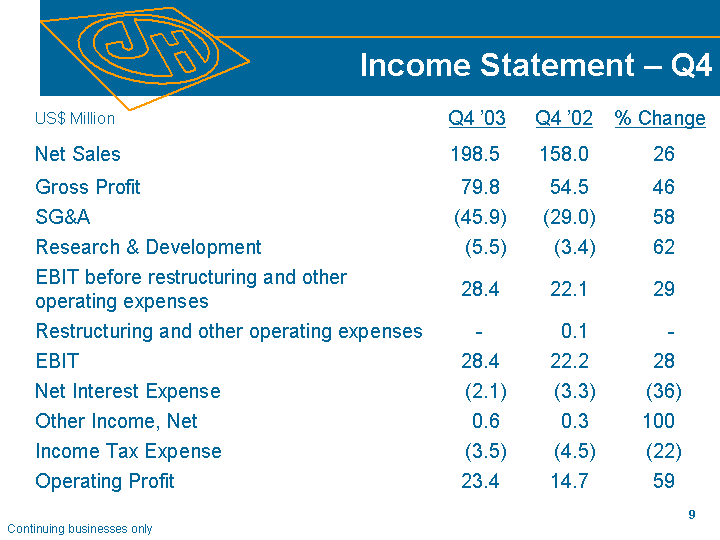
| Income Statement - Q4 US$ Million Q4 '03 Q4 '02 % Change Net Sales 198.5 158.0 26 Gross Profit 79.8 54.5 46 SG&A (45.9) (29.0) 58 Research & Development (5.5) (3.4) 62 EBIT before restructuring and other operating expenses 28.4 22.1 29 Restructuring and other operating expenses - 0.1 - EBIT 28.4 22.2 28 Net Interest Expense (2.1) (3.3) (36) Other Income, Net 0.6 0.3 100 Income Tax Expense (3.5) (4.5) (22) Operating Profit 23.4 14.7 59 Continuing businesses only |
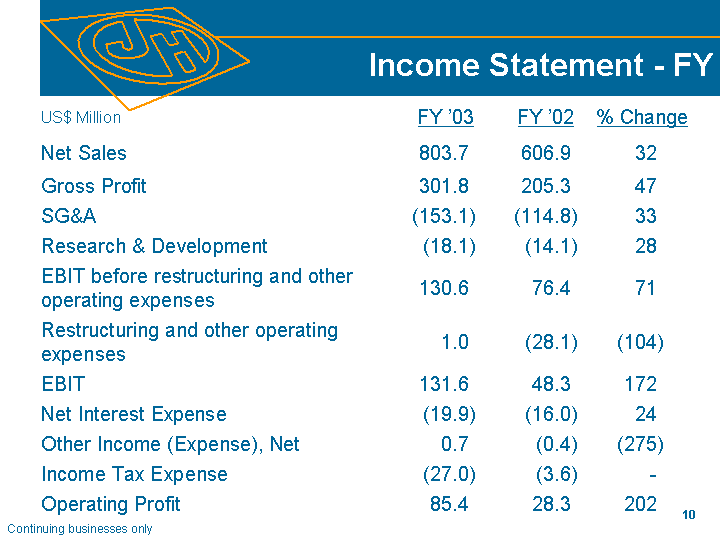
| Income Statement - FY US$ Million FY '03 FY '02 % Change Net Sales 803.7 606.9 32 Gross Profit 301.8 205.3 47 SG&A (153.1) (114.8) 33 Research & Development (18.1) (14.1) 28 EBIT before restructuring and other operating expenses 130.6 76.4 71 Restructuring and other operating expenses 1.0 (28.1) (104) EBIT 131.6 48.3 172 Net Interest Expense (19.9) (16.0) 24 Other Income (Expense), Net 0.7 (0.4) (275) Income Tax Expense (27.0) (3.6) - Operating Profit 85.4 28.3 202 Continuing businesses only |
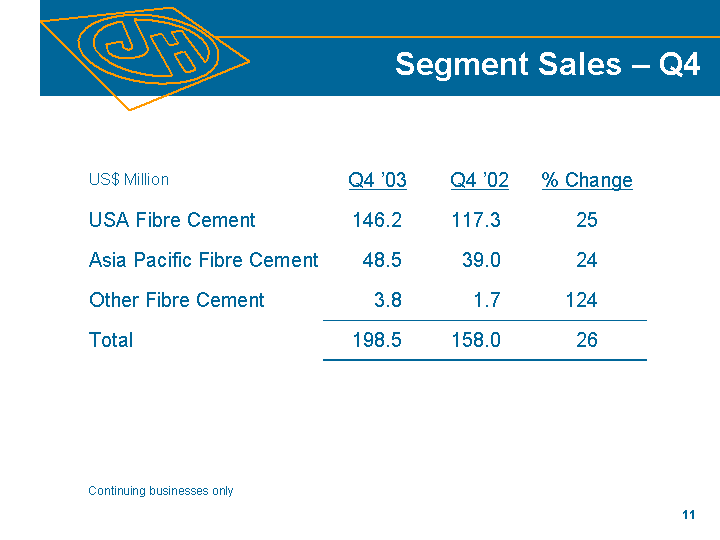
| Segment Sales - Q4 US$ Million Q4 '03 Q4 '02 % Change USA Fibre Cement 146.2 117.3 25 Asia Pacific Fibre Cement 48.5 39.0 24 Other Fibre Cement 3.8 1.7 124 Total 198.5 158.0 26 Continuing businesses only |
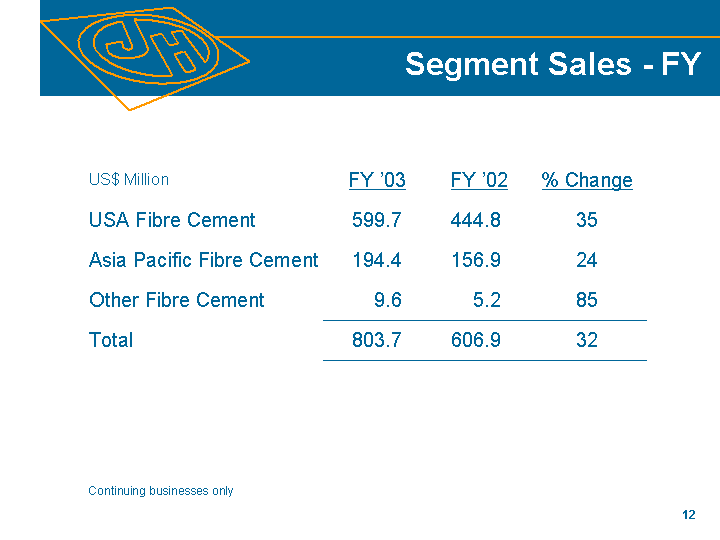
| Segment Sales - FY US$ Million FY '03 FY '02 % Change USA Fibre Cement 599.7 444.8 35 Asia Pacific Fibre Cement 194.4 156.9 24 Other Fibre Cement 9.6 5.2 85 Total 803.7 606.9 32 Continuing businesses only |

| EBIT - Q4 US$ Million Q4 '03 Q4 '02 % Change USA Fibre Cement 37.8 24.2 56 Asia Pacific Fibre Cement 4.9 6.6 (26) Other Fibre Cement (2.5) (2.2) (14) R & D (4.1) (2.7) (52) Total Segment EBIT 36.1 25.9 39 Corporate Costs (7.7) (3.7) (108) Total EBIT 28.4 22.2 28 Continuing businesses only |
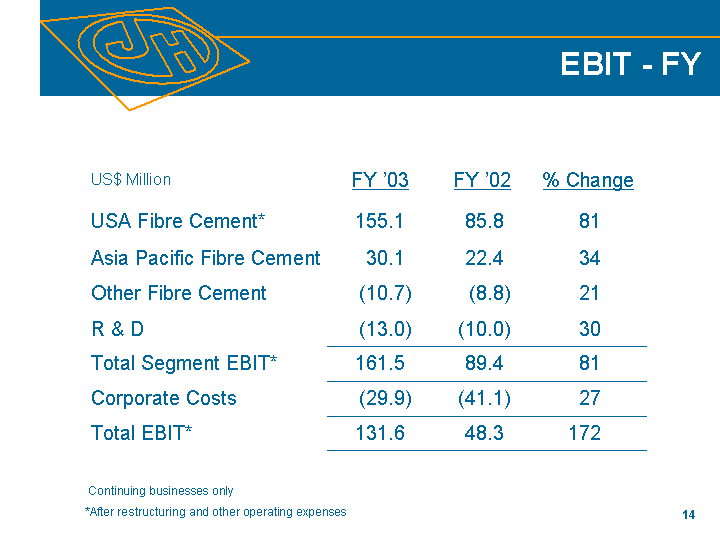
| EBIT - FY US$ Million FY '03 FY '02 % Change USA Fibre Cement* 155.1 85.8 81 Asia Pacific Fibre Cement 30.1 22.4 34 Other Fibre Cement (10.7) (8.8) 21 R & D (13.0) (10.0) 30 Total Segment EBIT* 161.5 89.4 81 Corporate Costs (29.9) (41.1) 27 Total EBIT* 131.6 48.3 172 Continuing businesses only *After restructuring and other operating expenses |
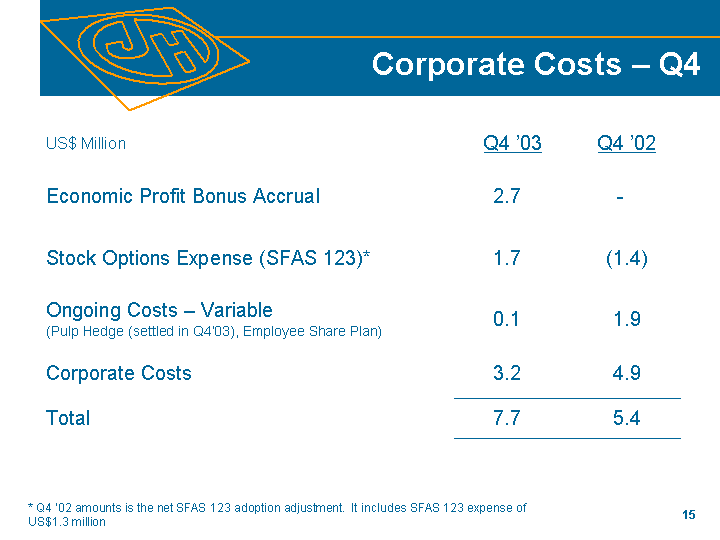
| Corporate Costs - Q4 US$ Million Q4 '03 Q4 '02 Economic Profit Bonus Accrual 2.7 - Stock Options Expense (SFAS 123)* 1.7 (1.4) Ongoing Costs - Variable (Pulp Hedge (settled in Q4'03), Employee Share Plan) 0.1 1.9 Corporate Costs 3.2 4.9 Total 7.7 5.4 * Q4 '02 amounts is the net SFAS 123 adoption adjustment. It includes SFAS 123 expense of US$1.3 million |
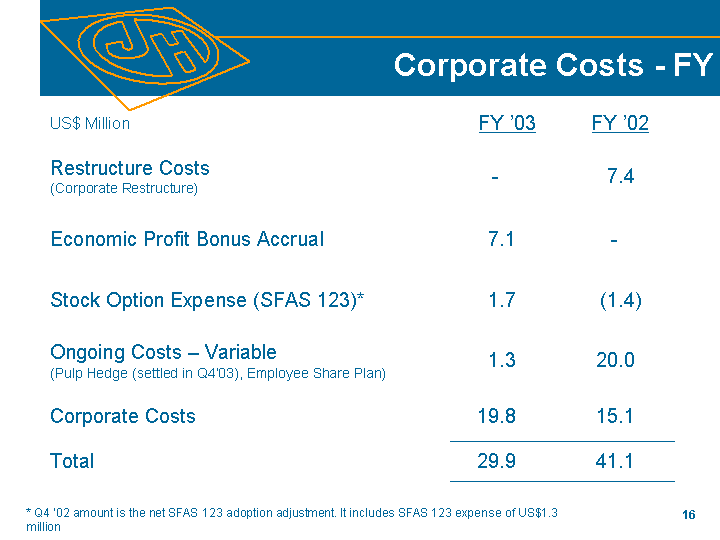
| Corporate Costs - FY US$ Million FY '03 FY '02 Restructure Costs (Corporate Restructure) - 7.4 Economic Profit Bonus Accrual 7.1 - Stock Option Expense (SFAS 123)* 1.7 (1.4) Ongoing Costs - Variable (Pulp Hedge (settled in Q4'03), Employee Share Plan) 1.3 20.0 Corporate Costs 19.8 15.1 Total 29.9 41.1 * Q4 '02 amount is the net SFAS 123 adoption adjustment. It includes SFAS 123 expense of US$1.3 million |
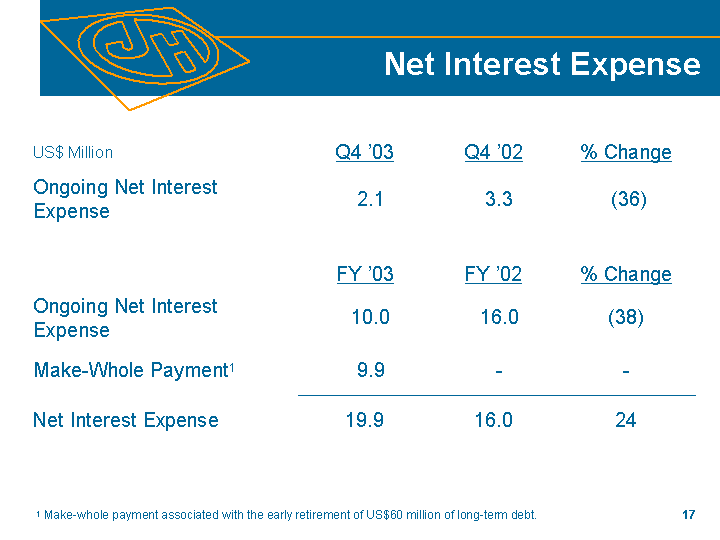
| Net Interest Expense US$ Million Q4 '03 Q4 '02 % Change Ongoing Net Interest Expense 2.1 3.3 (36) FY '03 FY '02 % Change Ongoing Net Interest Expense 10.0 16.0 (38) Make-Whole Payment1 9.9 - - Net Interest Expense 19.9 16.0 24 1 Make-whole payment associated with the early retirement of US$60 million of long-term debt. |
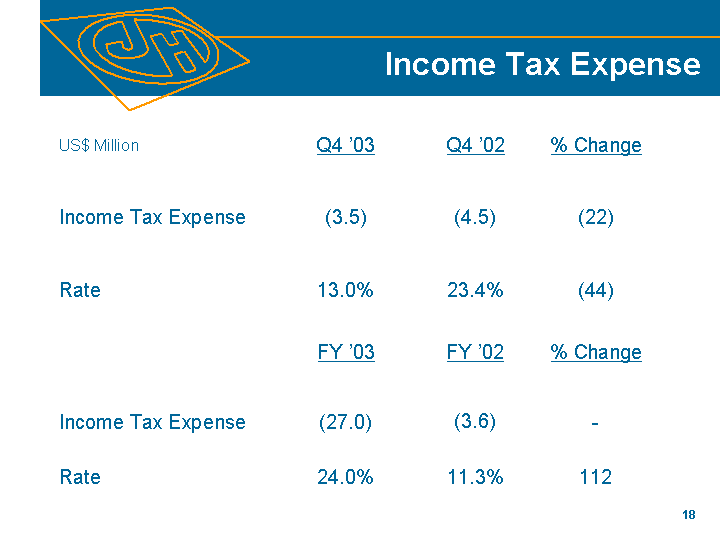
| Income Tax Expense US$ Million Q4 '03 Q4 '02 % Change Income Tax Expense (3.5) (4.5) (22) Rate 13.0% 23.4% (44) FY '03 FY '02 % Change Income Tax Expense (27.0) (3.6) - - Rate 24.0% 11.3% 112 |
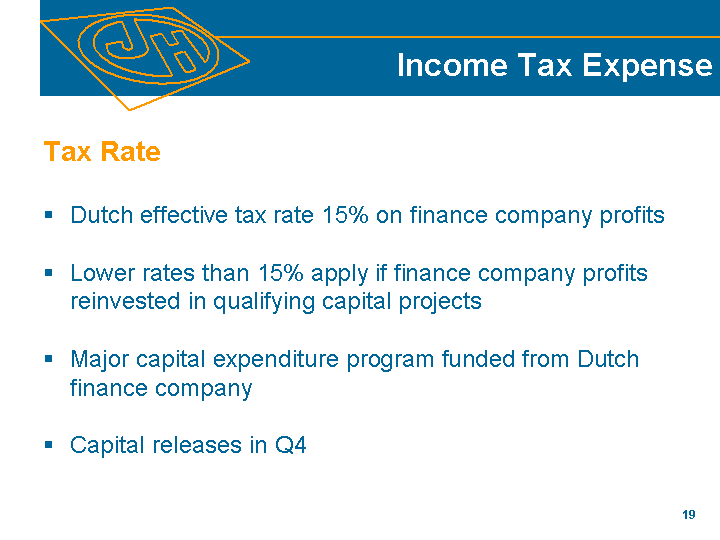
| Income Tax Expense Tax Rate Dutch effective tax rate 15% on finance company profits Lower rates than 15% apply if finance company profits reinvested in qualifying capital projects Major capital expenditure program funded from Dutch finance company Capital releases in Q4 |
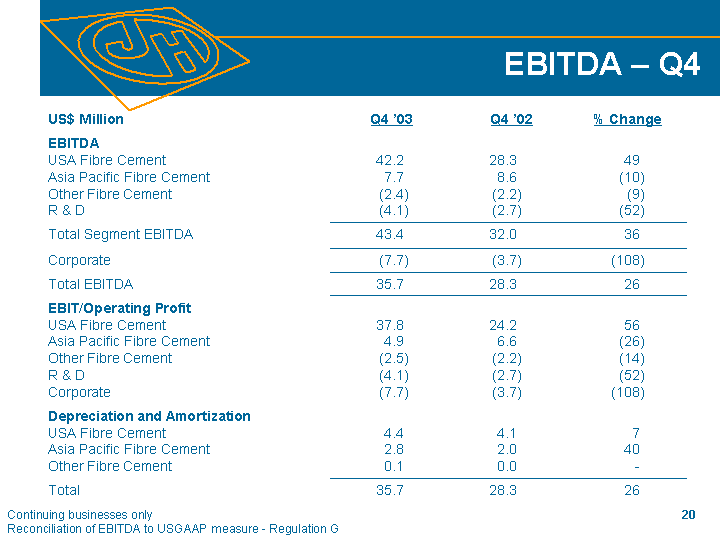
| EBITDA - Q4 Continuing businesses only Reconciliation of EBITDA to USGAAP measure - Regulation G US$ Million Q4 '03 Q4 '02 % Change EBITDA USA Fibre Cement Asia Pacific Fibre Cement Other Fibre Cement R & D 42.2 7.7 (2.4) (4.1) 28.3 8.6 (2.2) (2.7) 49 (10) (9) (52) Total Segment EBITDA 43.4 32.0 36 Corporate (7.7) (3.7) (108) Total EBITDA 35.7 28.3 26 EBIT/Operating Profit USA Fibre Cement Asia Pacific Fibre Cement Other Fibre Cement R & D Corporate 37.8 4.9 (2.5) (4.1) (7.7) 24.2 6.6 (2.2) (2.7) (3.7) 56 (26) (14) (52) (108) Depreciation and Amortization USA Fibre Cement Asia Pacific Fibre Cement Other Fibre Cement 4.4 2.8 0.1 4.1 2.0 0.0 7 40 - Total 35.7 28.3 26 |
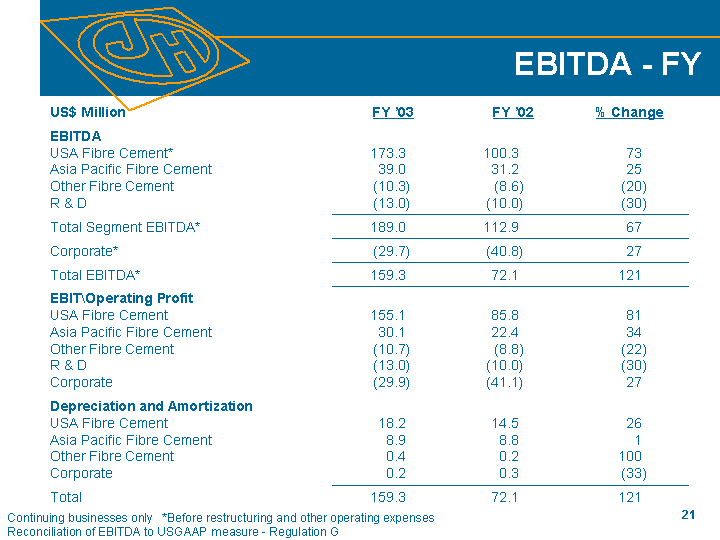
| EBITDA - FY US$ Million FY '03 FY '02 % Change EBITDA USA Fibre Cement* Asia Pacific Fibre Cement Other Fibre Cement R & D 173.3 39.0 (10.3) (13.0) 100.3 31.2 (8.6) (10.0) 73 25 (20) (30) Total Segment EBITDA* 189.0 112.9 67 Corporate* (29.7) (40.8) 27 Total EBITDA* 159.3 72.1 121 EBIT\Operating Profit USA Fibre Cement Asia Pacific Fibre Cement Other Fibre Cement R & D Corporate 155.1 30.1 (10.7) (13.0) (29.9) 85.8 22.4 (8.8) (10.0) (41.1) 81 34 (22) (30) 27 Depreciation and Amortization USA Fibre Cement Asia Pacific Fibre Cement Other Fibre Cement Corporate 18.2 8.9 0.4 0.2 14.5 8.8 0.2 0.3 26 1 100 (33) Total 159.3 72.1 121 Continuing businesses only *Before restructuring and other operating expenses Reconciliation of EBITDA to USGAAP measure - Regulation G |
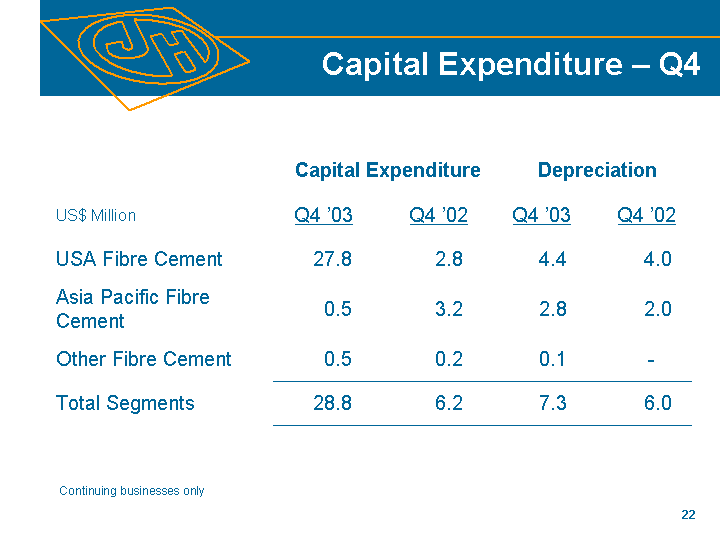
| Capital Expenditure - Q4 Capital Expenditure Capital Expenditure Depreciation Depreciation US$ Million Q4 '03 Q4 '02 Q4 '03 Q4 '02 USA Fibre Cement 27.8 2.8 4.4 4.0 Asia Pacific Fibre Cement 0.5 3.2 2.8 2.0 Other Fibre Cement 0.5 0.2 0.1 - Total Segments 28.8 6.2 7.3 6.0 Continuing businesses only |
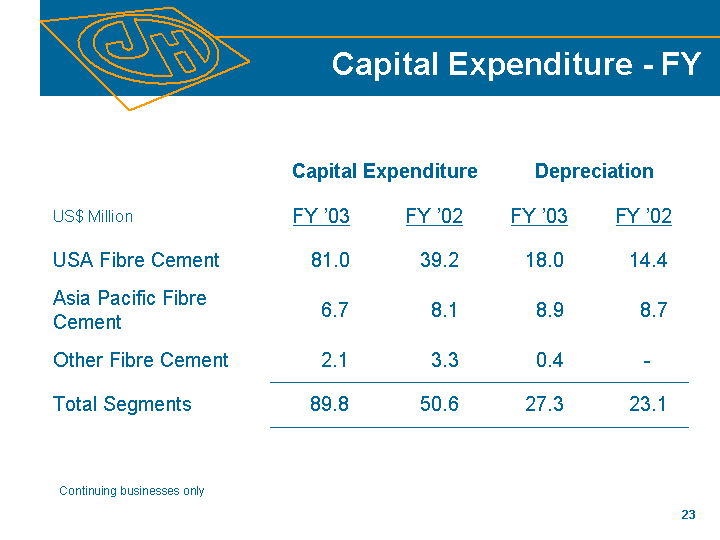
| Capital Expenditure - FY Capital Expenditure Capital Expenditure Depreciation Depreciation US$ Million FY '03 FY '02 FY '03 FY '02 USA Fibre Cement 81.0 39.2 18.0 14.4 Asia Pacific Fibre Cement 6.7 8.1 8.9 8.7 Other Fibre Cement 2.1 3.3 0.4 - Total Segments 89.8 50.6 27.3 23.1 Continuing businesses only |
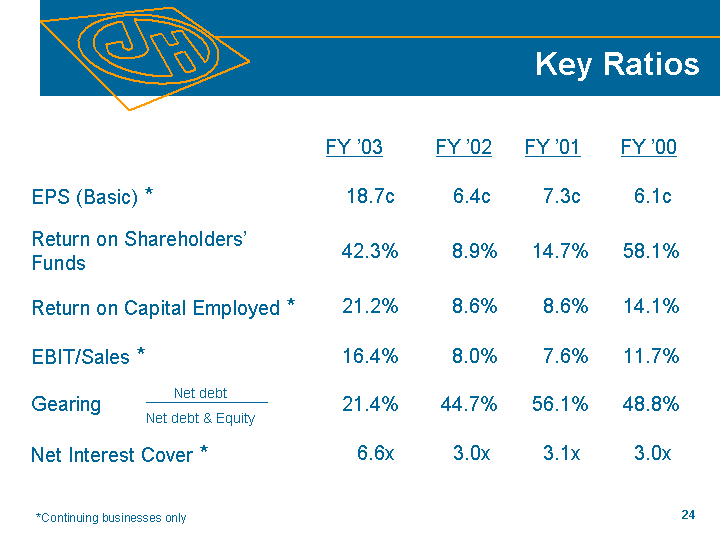
| Key Ratios FY '03 FY '02 FY '01 FY '00 EPS (Basic) * 18.7c 6.4c 7.3c 6.1c Return on Shareholders' Funds 42.3% 8.9% 14.7% 58.1% Return on Capital Employed * 21.2% 8.6% 8.6% 14.1% EBIT/Sales * 16.4% 8.0% 7.6% 11.7% Gearing 21.4% 44.7% 56.1% 48.8% Net Interest Cover * 6.6x 3.0x 3.1x 3.0x *Continuing businesses only |

| Economic Profit US$ Million FY'03 FY'02* NOPAT 111.3 55.01 Average Capital 627.6 583.7 WACC Rate 9.8% 9.8% Capital Charge 61.5 57.2 Economic Profit 49.8 (3.7) *Restated using updated WACC Rate for FY'03; USGAAP; excluding Gypsum 1Restated for stock compensation |
| Operating Review Peter Macdonald, CEO |
| USA Fibre Cement |
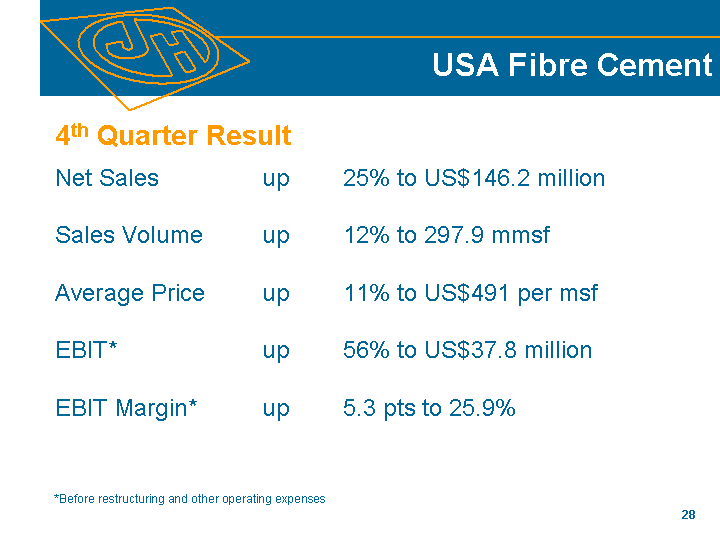
| USA Fibre Cement 4th Quarter Result Net Sales up 25% to US$146.2 million Sales Volume up 12% to 297.9 mmsf Average Price up 11% to US$491 per msf EBIT* up 56% to US$37.8 million EBIT Margin* up 5.3 pts to 25.9% *Before restructuring and other operating expenses |
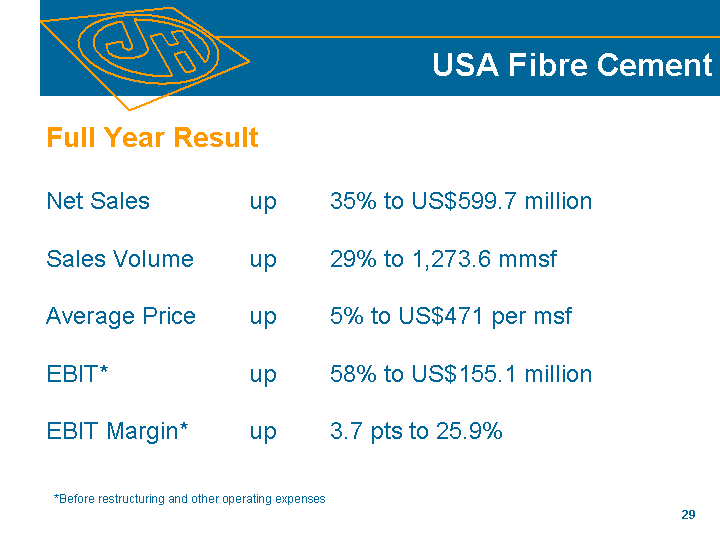
| USA Fibre Cement Full Year Result Net Sales up 35% to US$599.7 million Sales Volume up 29% to 1,273.6 mmsf Average Price up 5% to US$471 per msf EBIT* up 58% to US$155.1 million EBIT Margin* up 3.7 pts to 25.9% *Before restructuring and other operating expenses |
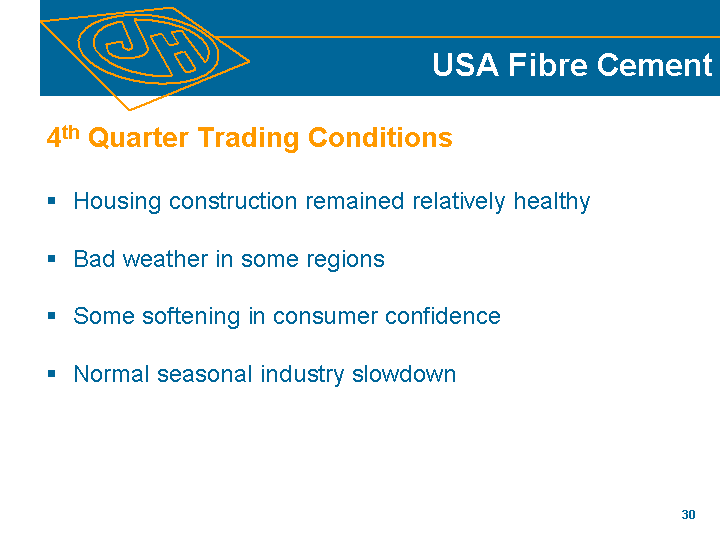
| USA Fibre Cement 4th Quarter Trading Conditions Housing construction remained relatively healthy Bad weather in some regions Some softening in consumer confidence Normal seasonal industry slowdown |
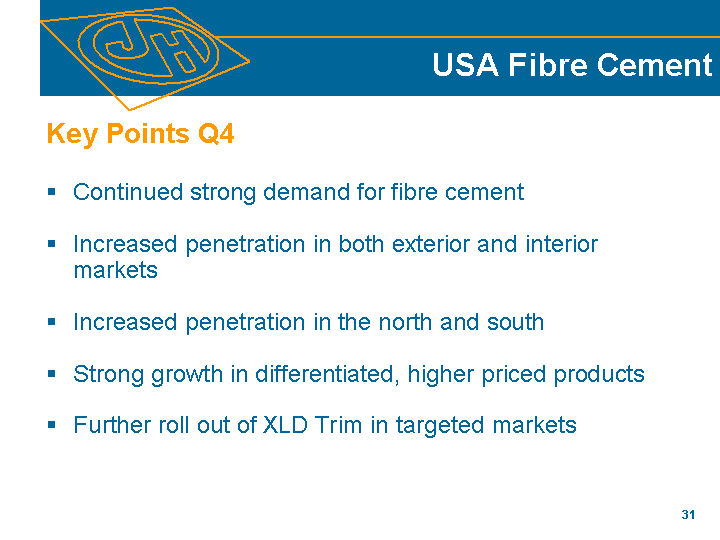
| USA Fibre Cement Key Points Q4 Continued strong demand for fibre cement Increased penetration in both exterior and interior markets Increased penetration in the north and south Strong growth in differentiated, higher priced products Further roll out of XLD Trim in targeted markets |
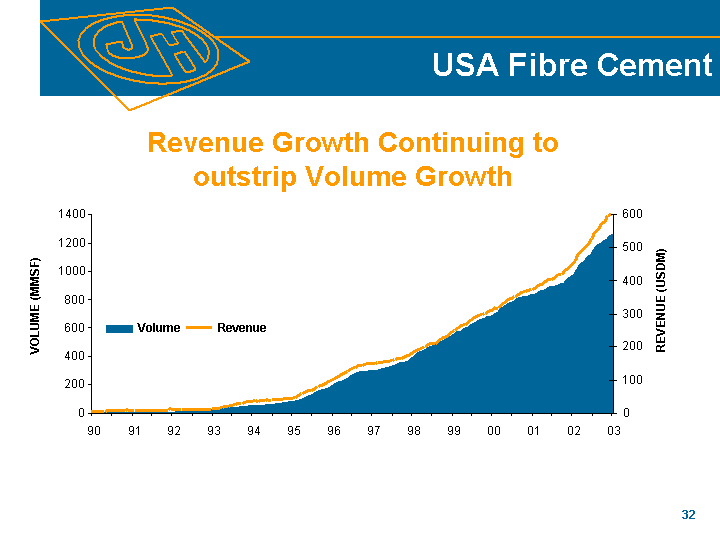
| USA Fibre Cement 0 200 400 600 800 1000 1200 1400 90 91 92 93 94 95 96 97 98 99 00 01 02 03 VOLUME (MMSF) 0 100 200 300 400 500 600 REVENUE (USDM) Volume Revenue Revenue Growth Continuing to outstrip Volume Growth |
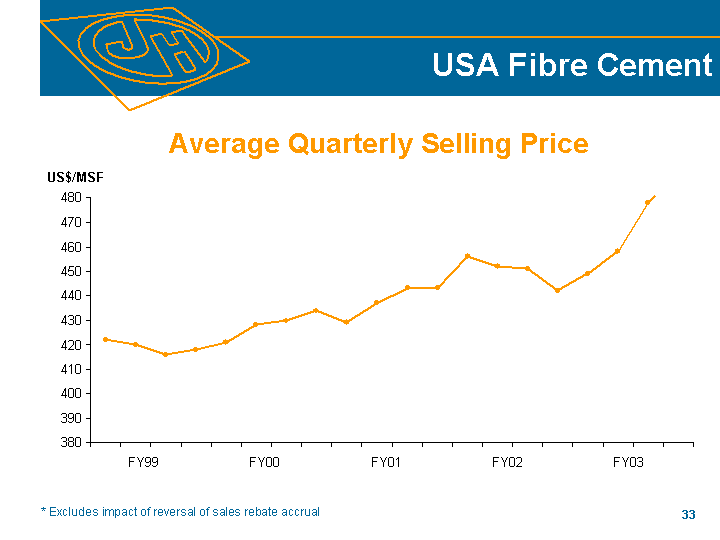
| USA Fibre Cement * Excludes impact of reversal of sales rebate accrual US$/MSF 380 390 400 410 420 430 440 450 460 470 480 FY99 FY00 FY01 FY02 FY03 Average Quarterly Selling Price |
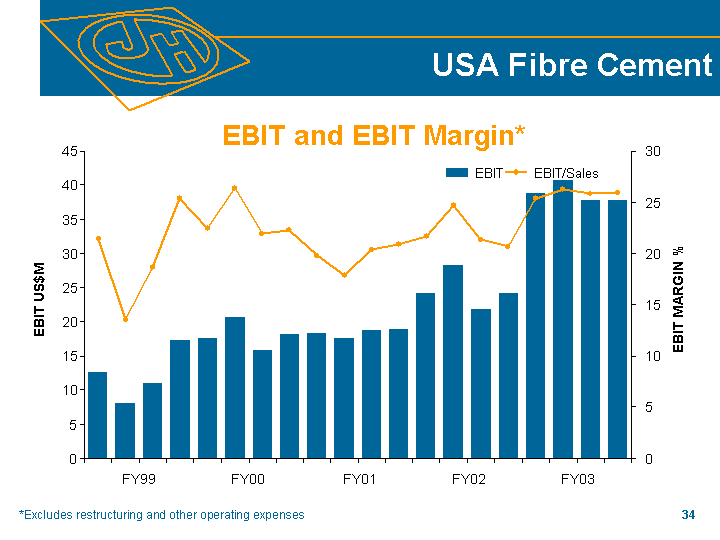
| USA Fibre Cement *Excludes restructuring and other operating expenses 0 5 10 15 20 25 30 35 40 45 FY99 FY00 FY01 FY02 FY03 EBIT US$M 0 5 10 15 20 25 30 EBIT MARGIN % EBIT EBIT/Sales EBIT and EBIT Margin* |
| USA Fibre Cement Strategy Aggressively grow market for fibre cement Grow our overall market position while defending our share in existing market segments Offer products with superior value to that of our competitors, introducing differentiated products to reduce direct price competition Optimise earnings with desired rate of market penetration |
| USA Fibre Cement Outlook Continued growth in primary demand Housing construction to remain healthy over short-term Approvals up, inventories low, house prices high and interest rates low Consumer confidence lifted from lows Fundamental drivers of housing suggest strong demand over medium to longer-term Further market share gains in the north, south and across product range Strong growth in differentiated, higher priced products |
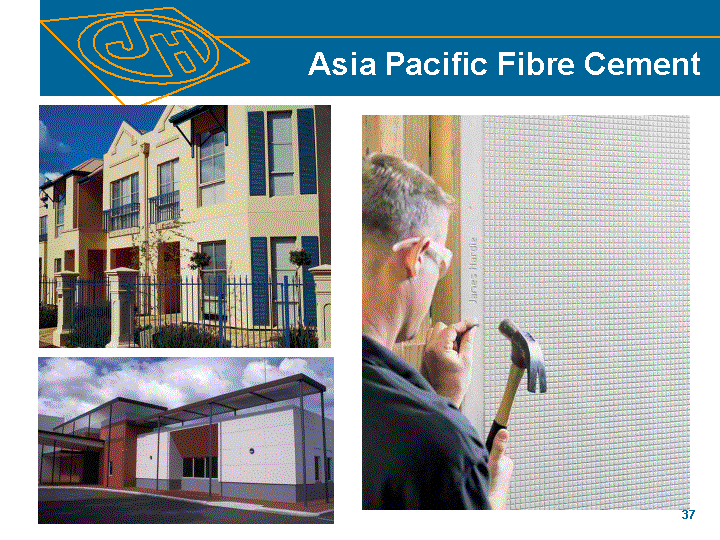
| Asia Pacific Fibre Cement |
| Asia Pacific Fibre Cement 4th Quarter Result Net Sales up 24% to US$48.5 million Sales Volume up 12% to 92.0 mmsf EBIT down 26% to US$4.9 million EBIT Margin down 6.8 pts to 10.1% |
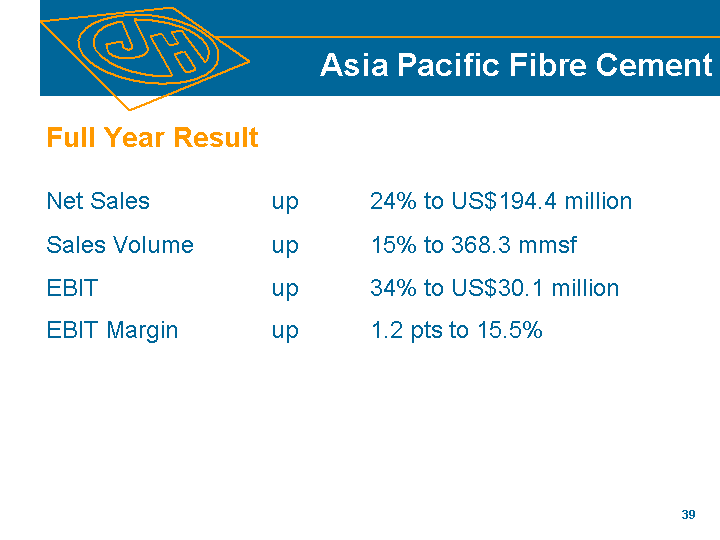
| Asia Pacific Fibre Cement Full Year Result Net Sales up 24% to US$194.4 million Sales Volume up 15% to 368.3 mmsf EBIT up 34% to US$30.1 million EBIT Margin up 1.2 pts to 15.5% |
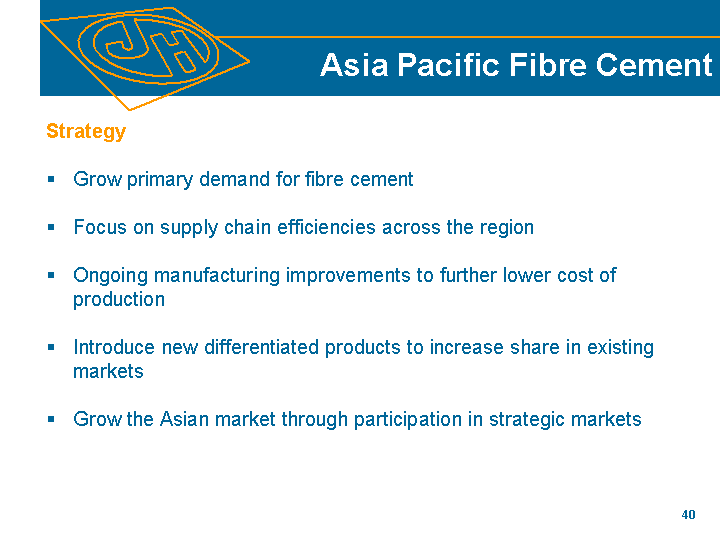
| Asia Pacific Fibre Cement Strategy Grow primary demand for fibre cement Focus on supply chain efficiencies across the region Ongoing manufacturing improvements to further lower cost of production Introduce new differentiated products to increase share in existing markets Grow the Asian market through participation in strategic markets |
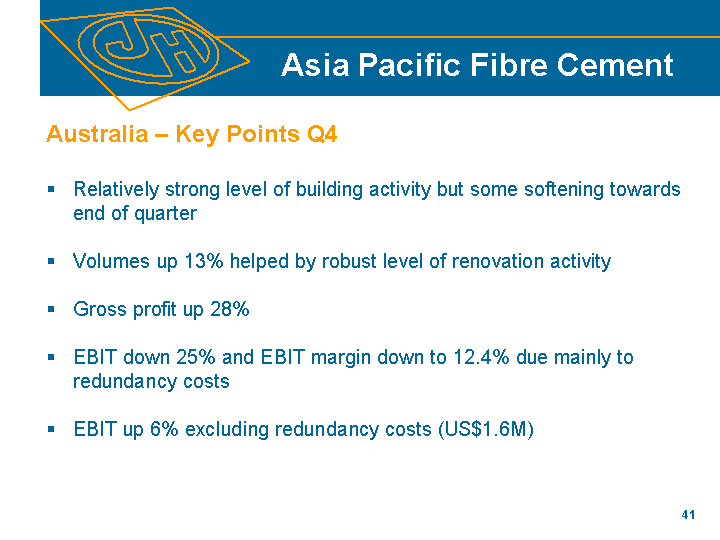
| Asia Pacific Fibre Cement Australia - Key Points Q4 Relatively strong level of building activity but some softening towards end of quarter Volumes up 13% helped by robust level of renovation activity Gross profit up 28% EBIT down 25% and EBIT margin down to 12.4% due mainly to redundancy costs EBIT up 6% excluding redundancy costs (US$1.6M) |
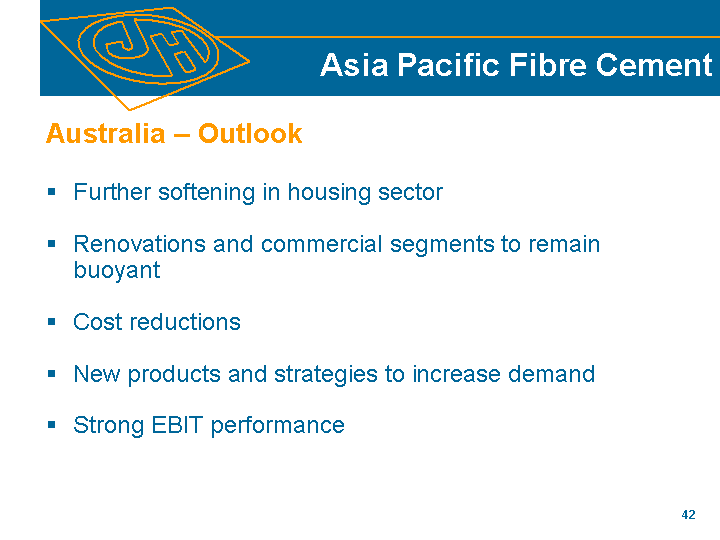
| Asia Pacific Fibre Cement Australia - Outlook Further softening in housing sector Renovations and commercial segments to remain buoyant Cost reductions New products and strategies to increase demand Strong EBIT performance |
| Asia Pacific Fibre Cement New Zealand - Key Points Residential building activity remained healthy Increased penetration in key markets helped lift volumes 27% Further strong growth in Linea(r) weatherboard cladding and trim products Non residential building activity remained soft but panel sales continued to be strong Gross profit up 19% EBIT down 61% and EBIT margin down to 4.1% due mainly to redundancy costs ($0.6M) EBIT down 15% excluding redundancy costs (US$0.6M) |
| Asia Pacific Fibre Cement New Zealand - Outlook Healthy residential building activity to continue in short term, but some softening expected late in year Increase sales of differentiated, higher price products Further weakness in non-residential segment Cost reductions Strong EBIT performance |
| Asia Pacific Fibre Cement Philippines - Key Points Slower construction activity due to higher material prices and regional economic uncertainty Domestic volumes up 8% for quarter, 27% for full year Continued growth in domestic demand helped lift total volumes 3% Further market share taken from plywood Export demand remained weak for quarter, export volumes down 38%, full year down 54% Improved manufacturing performance Small operating profit for the quarter and full year |
| Asia Pacific Fibre Cement Philippines - Outlook Construction activity to slow due to continued regional economic uncertainty Further growth in domestic sales Export sales to remain weak More manufacturing cost improvements |
| Business Portfolio Strategy Business portfolio balanced to achieve short and long term growth USA expected to double between 2002 - 2007 Growth and attractive returns from ANZ Numerous opportunities for growth > 5 years Asset mix reflects this |
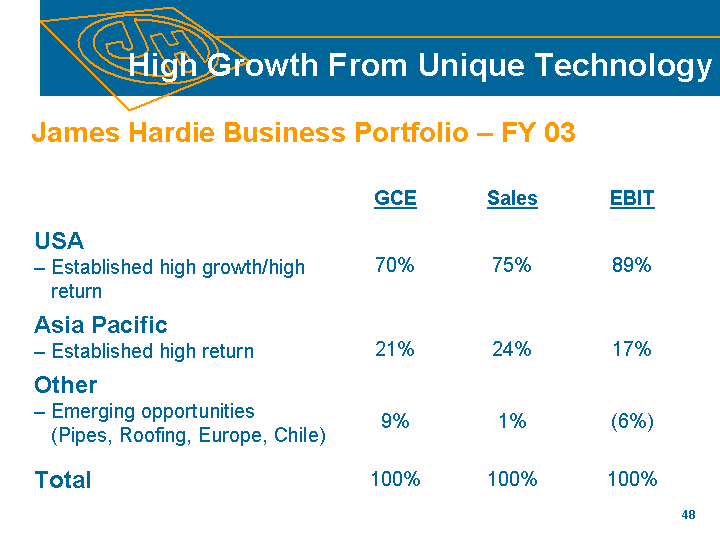
| High Growth From Unique Technology James Hardie Business Portfolio - FY 03 GCE Sales EBIT USA - - Established high growth/high return 70% 75% 89% Asia Pacific - - Established high return 21% 24% 17% Other - - Emerging opportunities (Pipes, Roofing, Europe, Chile) 9% 1% (6%) Total 100% 100% 100% |
| Other Fibre Cement Chile Fibre Cement - Key Points Continued penetration of domestic market Normal seasonal increase in construction activity Revenue and volumes more than doubled despite weaker economic conditions Prices remained low due to competitive pressures |
| Other Fibre Cement Chile Fibre Cement - Outlook Further penetration of the domestic market Continued strong growth in sales revenue and volumes Increased sales of differentiated, higher price products |
| Other Fibre Cement FRC Pipes - Key Points Continued to penetrate the south-east market Sales more than doubled Lower costs and improved manufacturing performance Increased output - particularly large diameter pipes Prices continue to be affected by competition |
| Other Fibre Cement FRC Pipes - Outlook Continued market penetration as awareness increases Further improvements in manufacturing costs and performance Competitive pressures to keep prices weak |
| Roofing Roofing Pilot plant completed and being commissioned Plant located at Fontana, California - 25mmsf Field product testing has commenced First woodshake sales expected in June |
| Europe Initially pursuing a low cost, low risk strategy Products imported from US Selling into UK and France Initial products: Backerboard, Plank and Trim |

| Research and Development Key driver of growth Core projects engineered raw materials product formulations engineering and process technologies lightweight and durable products for all climates Sustainable competitive advantage continuing to be built |
| Outlook The fundamental drivers of future demand in North America suggest that the housing sector should remain healthy over the medium to long-term In the short term, the strong results achieved in the past year are continuing into the first quarter In Asia Pacific, there are initiatives in place to address some softening in building activity Overall, the prospects for another good year are very encouraging |
| Disclaimer Notes Unless otherwise stated, results are for continuing operations only and comparisons are of the 4th quarter of the current fiscal year versus the 4th quarter of the prior fiscal year. This Management Presentation forms part of a package of information about the company's results. It should be read in conjunction with the other parts of this package, including Management's Discussion and Analysis (MD&A), a Media Release and Results at a Glance document. Management has used EBIT before restructuring and other operating expenses because this measure provides a more accurate indication of operating performance. Presentation of this line item is not required under US GAAP. Refer to the MD&A for information reconciling this measure to the comparable US GAAP measure. Disclaimer This presentation contains forward-looking statements. Words such as "believe,'' "anticipate,'' "plan,'' "expect,'' "intend,'' "target,'' "estimate,'' "project,'' "predict,'' "forecast,'' "guideline,'' "should,'' "aim'' and similar expressions are intended to identify forward-looking statements but are not the exclusive means of identifying such statements. Forward-looking statements involve inherent risks and uncertainties. We caution you that a number of important factors could cause actual results to differ materially from the plans, objectives, expectations, estimates and intentions expressed in such forward-looking statements. These factors, which are further discussed in our reports submitted to the Securities and Exchange Commission on Forms 20-F and 6-K and in our other filings, include but are not limited to: competition and product pricing in the markets in which we operate; general economic and market conditions; compliance with, and possible changes in, environmental and health and safety laws; dependence on cyclical construction markets; the supply and cost of raw materials; our reliance on a small number of product distributors; the consequences of product failures or defects; exposure to environmental or other legal proceedings; and risks of conducting business internationally. We caution you that the foregoing list of factors is not exclusive and that other risks and uncertainties may cause actual results to differ materially from those contained in forward-looking statements. Forward-looking statements speak only as of the date they are made. |
| 4TH QUARTER AND FULL YEAR RESULTS 15 MAY 2003 |