
Exhibit 99.1
Appendix 4D
James Hardie Industries N.V.
ABRN 097 829 895
Results for the 2nd Quarter and Half Year ended 30 September 2003
Contents
| 1. | Media Release |
| 2. | Results at a Glance |
| 3. | Management’s Discussion and Analysis for 2nd Quarter and Half Year |
| 4. | Consolidated Financial Statements |
| 5. | Management Presentation |
The above results documents comprise the information required by Rule 4.2A and the statement required by rule 4.2C.2.
The information contained in the above documents should be read in conjunction with the James Hardie 2003 Annual Report which can be found on the company website at www.jameshardie.com.
Incorporated in The Netherlands with corporate seat in Amsterdam. The liability of members is limited.

| 13 November 2003 | Analyst and Media enquiries, please contact Greg Baxter on Tel: 61 2 8274 5377 Mob: 0419 461 368 or Steve Ashe on Tel: 61 2 8274 5246 Mob: 0408 164 011 |
2nd Qtr Operating Profit Up 43% to US$32.8m
Half Year Operating Profit up 45% to US$65.7m
James Hardie today announced a 43% increase in 2nd quarter operating profit from continuing operations to US$32.8 million for the three months ended 30 September 2003.
Among the 2nd quarter highlights, net sales increased 24%, gross profit was up 26% and EBIT2 increased 35% to US$47.9 million.
The USA Fibre Cement business was again the standout performer lifting sales 24% and EBIT2 32% compared to the same period a year ago. In Asia Pacific, EBIT2 increased 16%.
The 2nd quarter result lifted half year operating profit from continuing operations to US$65.7 million. EBIT2 from our USA Fibre Cement segment was up 36% for the half and Asia Pacific Fibre Cement was up 15% for the half.
Basic earnings per share from continuing operations increased 54% from US 5.0 cents to US 7.2 cents for the 2nd quarter and 46% from US 9.9 cents to US 14.5 cents for the half year.
The half year net operating profit including discontinued operations of US$67.5 million includes income of US$1.8 million primarily related to the sale of our New Zealand Building Systems business on 30 May 2003. The net operating profit including discontinued operations for the half year of the previous year includes a profit of US$55.1 million primarily related to the sale of our Gypsum business.
2nd Quarter and Half Year at a Glance
| US$ Million | Q2FY04 | Q2FY03 | %+ / (-) | HYFY04 | HYFY03 | %+ / (-) | ||||||||||||||||||
Net Sales |
$ | 251.6 | $ | 202.1 | 24 | $ | 493.1 | $ | 396.7 | 24 | ||||||||||||||
Gross Profit |
92.4 | 73.6 | 26 | 181.7 | 142.1 | 28 | ||||||||||||||||||
EBIT2 |
47.9 | 35.6 | 35 | 96.2 | 70.7 | 36 | ||||||||||||||||||
Net Interest Expense |
(2.4 | ) | (2.5 | ) | (4 | ) | (4.7 | ) | (5.4 | ) | (13 | ) | ||||||||||||
Income Tax Expense |
(9.4 | ) | (9.9 | ) | (5 | ) | (22.5 | ) | (20.0 | ) | 13 | |||||||||||||
Operating Profit from continuing operations3 |
32.8 | 23.0 | 43 | 65.7 | 45.4 | 45 | ||||||||||||||||||
Net Operating Profit including discontinued
operations4 |
32.8 | 24.6 | 33 | 67.5 | 100.5 | (33 | ) | |||||||||||||||||
Unless otherwise stated, results are for continuing operations only and comparisons are of the 2nd quarter of the current
fiscal year versus the 2nd quarter of the prior fiscal year
Commentary
James Hardie’s CEO, Peter Macdonald said: “The second quarter result mirrors the strong performance of the first quarter and prospects for the balance of the year remain encouraging.
“The outlook for housing construction in North America is positive and it now appears likely that housing starts will finish the year at a new record high.
“We are continuing to penetrate both the exterior and interior product markets of the USA without sacrificing margin, and this is resulting in strong top line growth,” Mr Macdonald said.
USA Fibre Cement – Continued Strong Growth and Higher Margins
Net sales increased 24% to US$191.4 million in the 2nd quarter due to a 16% increase in sales volume to 390.5 million square feet and a 7% increase in the average selling price to US$490 per thousand square feet.
Strong growth continued in both the exterior and interior product markets.
Average selling prices were again up due to sales of higher-priced, differentiated products increasing as a proportion of total sales.
Strong revenue growth and further progress on costs lifted EBIT 32% to US$53.7 million for the quarter and 36% to US$107.8 million for the half. The EBIT margin for the quarter increased to 28.1% and was 28.5% for the half.
During the quarter, the new line to produce the pre-painted ColorPlus™ Collection was commissioned at our plant in Illinois, and we continued to ramp up the recently upgraded capacity at the plant at Blandon, Pennsylvania and the new panel production line at our plant in Waxahachie, Texas.
Australia and New Zealand Fibre Cement – Higher Net Sales
Net sales increased 17% to US$47.8 million for the quarter due to a favourable exchange difference. New housing activity in Australia was weaker compared to the same period a year ago but was above industry expectations. In New Zealand, housing activity was affected by poor weather in some regions.
EBIT was up 2% for the quarter and 8% for the half. The EBIT margin was 18.0% for the quarter and 18.5% for the half.
Philippines – Small Operating Profit
The Philippines recorded a small operating profit in both the quarter and the half year due to increased sales and manufacturing cost savings.
Chile – Small Operating Profit
The business recorded a small operating profit for both the quarter and the half year as sales more than doubled.
| Media Release: James Hardie - 2nd Quarter and Half Year Results FY04 | 2 | |
USA Hardie® Pipe – Strong Growth and Manufacturing Efficiencies
Strong top line growth continued as the business further penetrated its target market in Florida, USA increasing share to an estimated 20%. More manufacturing efficiency gains were achieved. However, the business continued to incur losses.
Europe
Awareness of our backer and siding products increased among distributors, builders and contractors following their launch in the U.K. and French markets in the first quarter. Market response to these products has been favourable and the rate of penetration is in line with our expectations.
Artisan Roofing
Plant testing and market trials continued during the quarter following the commissioning of our plant in June 2003. Sales of our new generation of fibre cement roofing products are expected to begin in the third quarter.
Interim Dividend
The Board has declared an interim dividend of US 2.5 cents a share. The dividend will be paid on 16 December 2003 to shareholders registered on 27 November 2003.
Outlook
In North America, the current level of housing activity is expected to continue, buoyed by low mortgage rates, strong house prices, an improving economy, low inventories of new homes for sale and large backlogs or orders for homes to be built.
Indicators of future activity, including housing starts, permits and builder confidence, all remain at high levels.
The National Association of Home Builders announced in September 2003 that “Housing production for 2003 should easily surpass last year’s very healthy 1.71 million and will likely approach the 1.8 million mark”. This follows housing start numbers exceeding a seasonally adjusted rate of 1.8 million for the past four months.
Further strong top-line growth and profitability is expected as our USA Fibre Cement business continues to penetrate the northern and southern regions of the country and the exterior and interior product markets.
In Australia and New Zealand, the commercial and renovations segments should remain strong but no improvement in new residential housing is expected. A better operating result is expected in the third quarter following the manufacturing performance of our Rosehill, NSW plant returning to more acceptable levels at the end of the second quarter and strong demand for higher-priced differentiated products such as Linea® weatherboards in New Zealand.
In the Philippines, building and construction activity is expected to increase as seasonal conditions become more favourable. Further share growth and manufacturing cost savings are expected.
In Chile, recent signs of improved construction activity are expected to continue. Further market penetration and share growth is expected as awareness of our expanded product range continues to grow.
| Media Release: James Hardie - 2nd Quarter and Half Year Results FY04 | 3 | |
The USA Hardie® Pipe business is continuing to increase production to meet growing demand, improve operating efficiency and reduce costs.
In Europe, demand for our products is expected to grow as awareness among builders, contractors and distributors increases.
Overall, the strong growth momentum evident in the first half is continuing into the third quarter and there is no sign of any near-term threat to highly satisfactory results overall for the full year.
We are comfortable with the current range of analysts’ forecasts of operating profit from continuing operations for the 2004 fiscal year of between US$118 million and US$131 million*.
Ends.
Media/Analysts call:
Greg Baxter – Executive Vice President
Telephone: 61 2 8274 5377
Mobile: 0419 461 368
Email: [email protected]
Or
Steve Ashe
Vice President Investor Relations
Telephone: 61 2 8274 5246
Mobile: 0408 164 011
Email: [email protected]
Facsimile: 61 2 8274 5218
The release and the accompanying MD&As and management presentation, along with the audio webcast of the presentation, are available at www.jameshardie.com
| * | Range includes forecasts from: ABN Amro (date of forecast 7/11/03), CSFB (31/10/03), Deutsche (30/10/03), JPMorgan (31/10/03), Merrill Lynch (30/10/03), Goldman Sachs JBWere (30/10/03), UBS 30/10/03, Citigroup SB (31/10/03), Macquarie (31/10/03) |
| Media Release: James Hardie - 2nd Quarter and Half Year Results FY04 | 4 | |
Notes
| 1. | This media release forms part of a package of information about the company’s results. It should be read in conjunction with the other parts of this package, including Management’s Discussion and Analysis (MD&A), a Management Presentation, a Financial Report and a Results at a Glance document. |
| 2. | EBIT is defined as operating income. EBIT margin is defined as EBIT as a percentage of our net sales. We believe EBIT and EBIT margin to be relevant and useful information as these are the primary measures used by our management to measure the operating profit or loss of our business. EBIT is one of several metrics used by our management to measure the cash generated from our operations, excluding the operating cash requirement of our interest and income taxes. Additionally, EBIT is believed to be a primary measure and terminology used by our Australian investors. EBIT and EBIT margin should be considered in addition to, but not as a substitute for, other measures of financial performance reported in accordance with accounting principles generally accepted in the United States of America. EBIT and EBIT margin, as we have defined them, may not be comparable to similarly titled measures reported by other companies. |
The use of EBIT and EBIT margins in this document are equivalent to the US GAAP measures of operating income and operating income margin.
| 3. | Operating profit from continuing operations is equivalent to the US GAAP measure of income from continuing operations. |
| 4. | Net operating profit including discontinued operations is equivalent to the US GAAP measure of net income. |
Disclaimer
This media release contains forward-looking statements. Words such as
“believe,’’ “anticipate,’’ “plan,’’ “expect,’’ “intend,’’ “target,’’
“estimate,’’ “project, “ “predict, “ “forecast,’’ “guideline,’’ “should,’’
“aim’’ and similar expressions are intended to identify forward-looking
statements but are not the exclusive means of identifying such statements.
Forward-looking statements involve inherent risks and uncertainties. We
caution you that a number of important factors could cause actual results to
differ materially from the plans, objectives, expectations, estimates and
intentions expressed in such forward-looking statements. These factors, which
are further discussed in our reports submitted to the Securities and Exchange
Commission on Forms 20-F and 6-K and in our other filings, include but are
not limited to: competition and product pricing in the markets in which we
operate; general economic and market conditions; compliance with, and
possible changes in, environmental and health and safety laws; dependence on
cyclical construction markets; the supply and cost of raw materials; our
reliance on a small number of product distributors; the consequences of
product failures or defects; exposure to environmental, asbestos or other
legal proceedings; and risks of conducting business internationally. We
caution you that the foregoing list of factors is not exclusive and that
other risks and uncertainties may cause actual results to differ materially
from those contained in forward-looking statements. Forward-looking
statements speak only as of the date they are made.
| Media Release: James Hardie - 2nd Quarter and Half Year Results FY04 | 5 | |

2nd Quarter and Half Year — 30 September 2003
| 2nd QTR FY04 | HY04 | |||||||||||||||||||
James Hardie |
||||||||||||||||||||
| Net Sales | Up | 24% | to | US$251.6 | Up | 24% | to | US$493.1 | ||||||||||||
| EBIT2 | Up | 35% | to | US$47.9 | Up | 36% | to | US$96.2 | ||||||||||||
| Operating Profit3 | Up | 43% | to | US$32.8 | Up | 45% | to | US$65.7 | ||||||||||||
| Net Operating Profit1,4 | Up | 33% | to | US$32.8 | Down | 33% | to | US$67.5 | ||||||||||||
EBIT Margin2 |
Up |
1.4pts |
to |
19.0% | Up |
1.7pts |
to |
19.5% | ||||||||||||
USA Fibre Cement |
||||||||||||||||||||
| Net Sales | Up | 24% | to | US$191.4 | Up | 23% | to | US$378.2 | ||||||||||||
| EBIT2 | Up | 32% | to | US$53.7 | Up | 36% | to | US$107.8 | ||||||||||||
EBIT Margin2 |
Up |
1.8pts |
to |
28.1% | Up |
2.6pts |
to |
28.5% | ||||||||||||
| Volume | Up | 16% | to | 390.5mmsf | Up | 15% | to | 778.0mmsf | ||||||||||||
Asia Pacific Fibre Cement |
||||||||||||||||||||
| Net Sales | Up | 22% | to | US$54.8 | Up | 23% | to | US$104.9 | ||||||||||||
| EBIT2 | Up | 16% | to | US$9.4 | Up | 15% | to | US$18.0 | ||||||||||||
EBIT Margin2 |
Down |
0.8pt |
to |
17.2% | Down |
1.0pt |
to |
17.2% | ||||||||||||
| Volume | Up | 9% | to | 104.5mmsf | Up | 11% | to | 202.7mmsf | ||||||||||||
Key Ratios |
||||||||||||||||||||
| Earnings Per Share (Basic) | 14.5cents | |||||||||||||||||||
EBIT Margin2 |
19.5% |
|||||||||||||||||||
Return on Shareholders
Funds1, 5 |
28.3% |
|||||||||||||||||||
Return on Capital
Employed5 |
28.7% |
|||||||||||||||||||
Gearing |
13.0% |
|||||||||||||||||||
Net Interest Cover
(EBIT2 / Net interest expense) |
20.5x |
|||||||||||||||||||
All comparisons are against the 2nd quarter or half year of the previous fiscal year. All dollar amounts are in US$ millions. Results are for continuing businesses only unless otherwise stated. Note: This document should be read in conjunction with other 2nd quarter and half year results materials including a Media Release, a Management’s Discussion and Analysis, a Management Presentation and a Financial Report.
| 1 | Includes discontinued operations | |
| 2 | EBIT is defined as operating income. EBIT margin is defined as EBIT as a percentage of our net sales. We believe EBIT and EBIT martin to be relevant and useful information as these are the primary measures used by our management to measure the operating profit or loss of our business. EBIT is one of several metrics used by our management to measure the cash generated from our operations, excluding the operating cash requirement of our interest and income taxes. Additionally, EBIT is believed to be a primary measure and terminology used by our Australian investors. EBIT and EBIT margin should be considered in addition to, but not as a substitute for, other measure of financial performance reported in accordance with accounting principles generally accepted in the United States of America. EBIT and EBIT margin, as we have defined them, may not be comparable to similarly titled measures reported by other companies. | |
| 3 | Operating profit from continuing operations is equivalent to the US GAAP measure of income from continuing operations | |
| 4 | Net operating profit including discontinued operations is equivalent to the US GAAP measure of net income | |
| 5 | Annualised |

| 13 November 2003 | Analyst and media enquiries, please contact Greg | |
| Baxter on Tel: 61 2 8274 5377 Mobile: 0419 461 | ||
| 368 or Steve Ashe on Tel: 61 2 8274 5246 | ||
| Mobile: 0408 164 011 |
James Hardie Industries N.V.
Results for 2nd Quarter Ended 30 September 2003
| US GAAP - US$ Millions | Three Months Ended 30 September | ||||||||||||
| FY 2004 | FY 2003 | % Change | |||||||||||
Net Sales |
|||||||||||||
USA Fibre Cement |
$ | 191.4 | $ | 154.7 | 24 | ||||||||
Asia Pacific Fibre Cement |
54.8 | 44.9 | 22 | ||||||||||
Other Fibre Cement |
5.4 | 2.5 | 116 | ||||||||||
Total Net Sales |
251.6 | 202.1 | 24 | ||||||||||
Net Sales |
$ | 251.6 | $ | 202.1 | 24 | ||||||||
Cost of goods sold |
(159.2 | ) | (128.5 | ) | 24 | ||||||||
Gross profit |
92.4 | 73.6 | 26 | ||||||||||
Selling General & Administrative expenses |
(38.9 | ) | (33.5 | ) | 16 | ||||||||
Research and Development expenses |
(5.6 | ) | (4.5 | ) | 24 | ||||||||
EBIT2 |
47.9 | 35.6 | 35 | ||||||||||
Net interest expense |
(2.4 | ) | (2.5 | ) | (4 | ) | |||||||
Other expense, net |
(3.3 | ) | (0.2 | ) | — | ||||||||
Operating profit from continuing operations before
income taxes3 |
42.2 | 32.9 | 28 | ||||||||||
Income tax expense |
(9.4 | ) | (9.9 | ) | (5 | ) | |||||||
Operating Profit From Continuing Operations4 |
$ | 32.8 | $ | 23.0 | 43 | ||||||||
Net Operating Profit Including Discontinued Operations5 |
$ | 32.8 | $ | 24.6 | 33 | ||||||||
Tax rate |
22.3 | % | 30.1 | % | |||||||||
Volume (mmsf) |
|||||||||||||
USA Fibre Cement |
390.5 | 337.7 | 16 | ||||||||||
Asia Pacific Fibre Cement |
104.5 | 95.5 | 9 | ||||||||||
Average sales price per unit (per msf) |
|||||||||||||
| USA Fibre Cement | US$490 | US$458 | 7 | ||||||||||
Asia Pacific Fibre Cement |
A$795 | A$860 | (8 | ) | |||||||||
Unless otherwise stated, results are for continuing operations only and comparisons are of the
2nd quarter of the current fiscal year versus the 2nd quarter of the prior fiscal years.
Total Net Sales
Total net sales increased 24% compared to the same quarter of the previous year, from US$202.1 million to US$251.6 million.
Net sales from USA Fibre Cement increased 24% from US$154.7 million to US$191.4 million due to continued strong growth in sales volumes and higher selling prices.
Net sales from Asia Pacific Fibre Cement increased 22% from US$44.9 million to US$54.8 million due mainly to favourable exchange differences.
Net sales from Other Fibre Cement increased 116% from US$2.5 million to US$5.4 million as the Chilean flat sheet business and the USA-based Hardie® Pipe business continued to grow.
USA Fibre Cement
Net sales increased 24% from US$154.7 million to US$191.4 million.
Sales volume increased 16% from 337.7 million square feet to 390.5 million square feet, due to strong growth in primary demand for fibre cement and a favourable housing construction market.
Residential housing activity remained healthy during the quarter buoyed by low mortgage rates, strong house prices, low inventory levels of new homes for sale and improved consumer confidence.
Strong growth continued in both the interior and exterior product markets and in the northern and southern regions of the country as our products continued to take share from alternative materials.
The average net selling price increased 7% compared to the same quarter of the previous year from US$458 per thousand square feet to US$490 per thousand square feet. This was due to an increased proportion of sales of higher-priced, differentiated products and a price increase in some regions implemented in the first quarter of this fiscal year.
In the exterior products market, there was continued strong growth in sales of higher-priced, differentiated products such as vented soffits, Heritage® panels, the ColorPlus™ Collection of pre-painted siding and Harditrim® XLD™. Our share of the interior cement board market continued to increase.
During the quarter, we continued to ramp-up the recently upgraded Blandon, Pennsylvania plant acquired from Cemplank in December 2001, and the 160 mmsf panel production line at our Waxahachie, Texas plant. Also during the quarter, we commissioned our new proprietary pre-finishing line at our Peru, Illinois plant. This is expected to significantly reduce painting costs for our ColorPlus™ Collection of exterior siding, and help accelerate our market penetration in the northern region.
Asia Pacific Fibre Cement
Net sales for this segment increased 22% from US$44.9 million to US$54.8 million. Sales volume increased 9% from 95.5 million square feet to 104.5 million square feet.
| James Hardie 2nd Quarter FY04 MD&A | 2 |
Australia and New Zealand Fibre Cement
Net sales increased 17% from US$40.8 million to US$47.8 million. In Australian dollars, net sales decreased 3%.
The decrease in local currency net sales was due to a 2% fall in sales volume from 79.6 million square feet to 78.2 million square feet, and a 1% decrease in the average net selling due mainly to a change in product mix. The decrease in sales volume reflects lower than expected sales performance, and reduced fence sales compared to the same quarter last year, when we experienced higher sales due to the effect of sales to repair storm-damaged fences in Western Australia.
In Australia, new residential housing commencements were weaker compared to the same period last year. The impact of this was partly offset by continuing strong residential renovation and commercial construction activity.
FRC pipes continued to penetrate its targeted market, increasing sales volumes by 26% compared to the same period last year. A new pipe standard was released by Standards Australia during the quarter that will enable our fibre cement pipe to compete more effectively against steel reinforced concrete pipes.
In New Zealand, new residential housing starts continued at high levels although some regions were affected by poor weather. Non-residential construction activity was slightly weaker compared to the same period last year.
Philippines Fibre Cement
Net sales increased 64% from US$4.2 million to US$6.9 million. In local currency, net sales increased 74% due to a 64% increase in sales volume compared to the same quarter of the previous year, from 16.1 million square feet to 26.4 million square feet, and a higher average net selling price.
Domestic market conditions improved in the first half of the quarter compared to the first quarter of this fiscal year, but later softened following signs of political instability.
The average selling price increased 6% compared to the same quarter of the previous year due to a more favourable sales mix.
Other Fibre Cement
Chile Fibre Cement
Our Chilean business continued to penetrate the domestic flat sheet market and build awareness of its product range.
Net sales increased 157% compared to the same quarter last year due to a 97% increase in sales volume and a higher average selling price.
There were further signs of a recovery in Chile’s construction activity during the quarter.
| James Hardie 2nd Quarter FY04 MD&A | 3 |
The average selling price increased due to strong export sales and growth in sales of higher-priced, differentiated products.
Hardie® Pipe
Our USA Hardie® Pipe business continued to penetrate the south-east market of the United States and improve its manufacturing efficiency.
Net sales increased 84% compared to the same period last year as market acceptance of our fibre cement pipes continued to grow strongly. Our share of the market for our targeted diameter range of drainage pipes in Florida is estimated to have increased to 20%.
Further manufacturing performance improvements were achieved during the quarter but manufacturing costs remain higher than our target.
The average net selling price decreased 3% compared to the same quarter last year due to competitors’ use of aggressive pricing tactics in response to our market penetration.
Florida road building expenditures were soft as a result of reduced transportation spending by the state. Federal funding is also down due to recent shifts in focus of federal spending from public infrastructure to defence and national security projects. The actual level of spending depends in part on the amount of highway user revenues raised by the government and the continued renewal of the TEA-21, which is expected to be renewed for another six years. Despite lower levels of transportation spending, residential construction continues to be strong in Florida due mainly to low interest rates.
Europe
Our European fibre cement business commenced operations in the first quarter of this fiscal year with the launch in the U.K. and French markets of our Hardibacker® range of interior products and our proprietary pre-painted siding products.
During the quarter the business continued to build awareness and sales among distributors, builders and contractors and penetrate its target markets. Market response to our products has been favourable and the rate of penetration at this early stage is in line with our expectations.
Artisan Roofing
In June 2003, we commissioned our pilot roofing plant at Fontana, California. The pilot plant, which has a design capacity of 25 mmsf, was built to test our proprietary manufacturing technology and to provide product for market testing in Southern California.
Plant testing and manufacturing trials continued during the quarter and the first on-site installations of the new roofing product were completed. It is now expected that commercial sales will commence in the third quarter once inventory levels are sufficient to meet initial demand.
| James Hardie 2nd Quarter FY04 MD&A | 4 |
Gross Profit
Gross profit increased 26% from US$73.6 million to US$92.4 million due to improvements in all our major businesses. The gross profit margin increased 0.3 of a percentage point to 36.7%.
USA Fibre Cement gross profit increased 30% due to higher sales volumes and a higher average net selling price, partly offset by an increase in unit cost of sales. The higher unit cost of sales resulted primarily from higher pulp costs, increased sales of higher-priced, differentiated products and the ramp-up of the new manufacturing lines at the Blandon, Pennsylvania and Waxahachie, Texas plants. Cost of sales was lower as a percentage of sales. The gross profit margin increased 2.0 percentage points.
Asia Pacific Fibre Cement gross profit increased 9% following improvements from Australia and New Zealand Fibre Cement and Philippines Fibre Cement. The improved result for Australia and New Zealand was due to a favourable foreign exchange difference. In Australian dollars, Australia and New Zealand fibre cement gross profit decreased 14% due primarily to a decrease in revenue, increased manufacturing costs mainly at our Rosehill, NSW plant and increased freight costs, partly offset by a decrease in SG&A costs. The manufacturing performance of the Rosehill plant returned to more acceptable levels by the end of the quarter. In the Philippines, increased sales and reduced manufacturing costs resulted in the stronger gross profit performance. The Asia Pacific Fibre cement gross profit margin decreased 3.9 percentage points mainly due to an increase in manufacturing costs and freight as a percentage of sales.
Selling, General and Administrative (SG&A) Expenses
SG&A expenses increased 16% compared to the same quarter last year, from US$33.5 million to US$38.9 million. The increase in SG&A expenses was due mainly to sales and marketing expenses associated with growth initiatives in the USA. However, as a percentage of sales, SG&A expenses were 1.1 percentage points lower, at 15.5%.
Research and Development Expenses
Research and development includes costs associated with “core” research projects that are aimed at benefiting all fibre cement business units. These costs are recorded in the Research and Development segment rather than being attributed to individual business units. These costs increased 57% for the quarter to US$3.6 million.
Other research and development costs associated with commercialisation projects in business units are included in the business unit segment results. In total, these costs decreased 9% to US$2.0 million.
Total research and development costs for the quarter were flat as a percentage of sales, at 2.2%.
EBIT2
EBIT increased 35% from US$35.6 million to US$47.9 million. The EBIT margin increased 1.4 percentage points to 19.0%.
| James Hardie 2nd Quarter FY04 MD&A | 5 |
USA Fibre Cement EBIT increased 32% from US$40.7 million to US$53.7 million. The increase was due to strong growth in net sales, partly offset by an increase in unit cost of sales and SG&A expenses. The EBIT margin increased 1.8 percentage points to 28.1%.
Asia Pacific Fibre Cement EBIT increased 16% from US$8.1 million to US$9.4 million. The EBIT margin decreased 0.8 of a percentage point to 17.2%.
Australia and New Zealand Fibre Cement EBIT increased 2% from US$8.4 million to US$8.6 million. In Australian dollars, EBIT decreased 14%. The decrease in EBIT in Australian dollars was primarily due to lower net sales compared to the same period last year, an increase in manufacturing costs, partly offset by lower SG&A costs. The EBIT margin was 2.6 percentage points lower, at 18.0%.
Our Philippines business recorded another small operating profit for the quarter due to increased sales.
The Chile Fibre Cement business recorded a small operating profit for the quarter. This follows the business achieving breakeven in the previous quarter of this fiscal year.
Despite continued strong volume growth, our USA Hardie® Pipe business incurred an operating loss for the quarter due to lower prices and higher than targeted unit costs.
Our European fibre cement business became operational during the previous quarter of this fiscal year and incurred a small operating loss, as expected.
General corporate costs decreased by US$1.1 million from US$7.9 million to US$6.8 million. This decrease was primarily due to a US$1.5 million decrease in employee bonus plan expense and a net decrease in other costs, partially offset by an increase of US$0.8 million in employee share based compensation expense from stock appreciation rights primarily caused by an increase in the company’s share price.
Other Expense, net
Other expense, net, increased by US$3.1 million primarily due to a capital duty fee paid in conjunction with our Dutch legal structure. We incurred this fee to extend the scope of our international finance subsidiary to lend to global operations and expect to recover this fee within six months through reduced taxation charges.
Net Interest Expense
Net interest expense decreased by US$0.1 million from US$2.5 million to US$2.4 million. Interest expense decreased by US$1.0 million due to lower average borrowings and an increase in the amount of interest expense capitalised during the quarter compared to the same period in the prior year. This decrease in net interest expense was partially offset by a US$0.9 decrease in interest income due to lower average cash balances compared to the same quarter in the prior year.
| James Hardie 2nd Quarter FY04 MD&A | 6 |
Income Tax Expense
Income tax expense decreased by US$0.5 million from US$9.9 million to US$9.4 million.
Operating Profit from Continuing Operations4
Income from continuing operations increased by 43% or US$9.8 million, from US$23.0 million for the second quarter of the previous year to US$32.8 million this quarter.
End.
Media/Analysts call:
Greg Baxter – Executive Vice President
Telephone: 61 2 8274 5377
Mobile: 0419 461 368
Email: [email protected]
Or
Steve Ashe
Vice President Investor Relations
Telephone: 61 2 8274 5246
Mobile: 0408 164 011
Email: [email protected]
Facsimile: 61 2 8274 5218
The MD&As and accompanying release and management presentation, along with an audio webcast of the presentation are available at www.jameshardie.com
| James Hardie 2nd Quarter FY04 MD&A | 7 |
Notes
1. This Management’s Discussion and Analysis document forms part of a package of information about the company’s results. It should be read in conjunction with the other parts of this package, including a Media Release, a Management Presentation, a Financial Report and a Results at a Glance document.
2. EBIT is defined as operating income. EBIT margin is defined as EBIT as a percentage of our net sales. We believe EBIT and EBIT margin to be relevant and useful information as these are the primary measures used by our management to measure the operating profit or loss of our business. EBIT is one of several metrics used by our management to measure the cash generated from our operations, excluding the operating cash requirement of our interest and income taxes. Additionally, EBIT is believed to be a primary measure and terminology used by our Australian investors. EBIT and EBIT margin should be considered in addition to, but not as a substitute for, other measures of financial performance reported in accordance with accounting principles generally accepted in the United States of America. EBIT and EBIT margin, as we have defined them, may not be comparable to similarly titled measures reported by other companies.
The use of EBIT and EBIT margins in this document are equivalent to the US GAAP measures of operating income and operating income margin.
3. Operating profit from continuing operations before income taxes is equivalent to the US GAAP measure of income from continuing operations before income taxes.
4. Operating profit from continuing operations is equivalent to the US GAAP measure of income from continuing operations.
5. Net operating profit including discontinued operations is equivalent to the US GAAP measure of net income.
Disclaimer
This report contains forward-looking statements. Words such as “believe,’’ “anticipate,’’ “plan,’’ “expect,’’ “intend,’’ “target,’’ “estimate,’’ “project,’’ “predict,’’ “forecast,’’ “guideline,’’ “should,’’ “aim’’ and similar expressions are intended to identify forward-looking statements but are not the exclusive means of identifying such statements. Forward-looking statements involve inherent risks and uncertainties. We caution you that a number of important factors could cause actual results to differ materially from the plans, objectives, expectations, estimates and intentions expressed in such forward-looking statements. These factors, which are further discussed in our reports submitted to the Securities and Exchange Commission on Forms 20-F and 6-K and in our other filings, include but are not limited to: competition and product pricing in the markets in which we operate; general economic and market conditions; compliance with, and possible changes in, environmental and health and safety laws; dependence on cyclical construction markets; the supply and cost of raw materials; our reliance on a small number of product distributors; the consequences of product failures or defects; exposure to environmental, asbestos or other legal proceedings; and risks of conducting business internationally. We caution you that the foregoing list of factors is not exclusive and that other risks and uncertainties may cause actual results to differ materially from those contained in forward-looking statements. Forward-looking statements speak only as of the date they are made.
| James Hardie 2nd Quarter FY04 MD&A | 8 |

| 13 November 2003 | Analyst and media enquiries, please contact Greg Baxter on Tel: 61 2 8274 5377 Mobile: 0419 461 368 or Steve Ashe on Tel: 61 2 8274 5246 Mobile: 0408 164 011 |
James Hardie Industries N.V.
Results for the 6 months Ended 30 September 2003
| US GAAP - US$ Millions | Six Months Ended 30 September | ||||||||||||
| FY 2004 | FY 2003 | % Change | |||||||||||
Net Sales |
|||||||||||||
USA Fibre Cement |
$ | 378.2 | $ | 307.2 | 23 | ||||||||
Asia Pacific Fibre Cement |
104.9 | 85.6 | 23 | ||||||||||
Other Fibre Cement |
10.0 | 3.9 | 156 | ||||||||||
Total Net Sales |
493.1 | 396.7 | 24 | ||||||||||
Net Sales |
$ | 493.1 | $ | 396.7 | 24 | ||||||||
Cost of goods sold |
(311.4 | ) | (254.6 | ) | 22 | ||||||||
Gross profit |
181.7 | 142.1 | 28 | ||||||||||
Selling General & Administrative expenses |
(75.1 | ) | (63.6 | ) | 18 | ||||||||
Research and Development expenses |
(10.4 | ) | (7.8 | ) | 33 | ||||||||
EBIT(2) |
96.2 | 70.7 | 36 | ||||||||||
Net interest expense |
(4.7 | ) | (5.4 | ) | (13 | ) | |||||||
Other (expense)/income, net |
(3.3 | ) | 0.1 | — | |||||||||
Operating profit from continuing operations before
income taxes(3) |
88.2 | 65.4 | 35 | ||||||||||
Income tax expense |
(22.5 | ) | (20.0 | ) | 13 | ||||||||
Operating Profit From Continuing Operations(4) |
$ | 65.7 | $ | 45.4 | 45 | ||||||||
Net Operating Profit Including Discontinued Operations(5) |
$ | 67.5 | $ | 100.5 | (33 | ) | |||||||
Tax rate |
25.5 | % | 30.6 | % | |||||||||
Volume (mmsf) |
|||||||||||||
USA Fibre Cement |
778.0 | 677.5 | 15 | ||||||||||
Asia Pacific Fibre Cement |
202.7 | 182.9 | 11 | ||||||||||
Average sales price per unit (per msf) |
|||||||||||||
USA Fibre Cement |
US$486 | US$453 | 7 | ||||||||||
Asia Pacific Fibre Cement |
A$796 | A$852 | (7 | ) | |||||||||
Unless otherwise stated, results are for continuing operations only and comparisons are of the
first six months of the current fiscal year versus the first six months of the prior fiscal years.
Total Net Sales
Total net sales increased 24% compared to the same period of the previous year, from US$396.7 million to US$493.1 million.
Net sales from USA Fibre Cement increased 23% from US$307.2 million to US$378.2 million due to continued strong growth in sales volumes and higher selling prices.
Net sales from Asia Pacific Fibre Cement increased 23% from US$85.6 million to US$104.9 million due to increased sales volumes and favourable exchange differences.
Net sales from Other Fibre Cement increased 156% from US$3.9 million to US$10.0 million as the Chilean flat sheet business and the USA-based Hardie® Pipe business continued to grow.
USA Fibre Cement
Net sales increased 23% from US$307.2 million to US$378.2 million.
Sales volume increased 15% from 677.5 million square feet to 778.0 million square feet, due to strong growth in primary demand for fibre cement and a favourable housing construction market.
Residential housing activity remained healthy during the period buoyed by low mortgage rates, strong house prices, low inventory levels of new homes for sale and improved consumer confidence.
Strong growth continued in both the interior and exterior product markets and in the northern and southern regions of the country as our products continued to take share from alternative materials.
The average net selling price increased 7% compared to the same period of the previous year from US$453 per thousand square feet to US$486 per thousand square feet. This was due to an increased proportion of sales of higher-priced, differentiated products and a price increase in some regions implemented in the first quarter of this fiscal year.
In the exterior products market, there was continued strong growth in sales of higher-priced, differentiated products such as vented soffits, Heritage® panels, the ColorPlus™ Collection of pre-painted siding and Harditrim® XLD™. Our share of the interior cement board market continued to increase.
During the period, we completed the upgrade and began ramping-up our Blandon, Pennsylvania plant acquired from Cemplank in December 2001. The upgrade increased design capacity of the plant from 120 mmsf to 200 mmsf. We also completed the upgrade and began ramping up our 160 mmsf panel production line at our Waxahachie, Texas plant.
Also during the period, we commissioned our new proprietary pre-finishing line at our Peru, Illinois plant. This is expected to significantly reduce painting costs for our ColorPlus™ Collection of exterior siding, and help accelerate our market penetration in the northern region.
| James Hardie Half Year FY04 MD&A | 2 |
Asia Pacific Fibre Cement
Net sales for this segment increased 23% from US$85.6 million to US$104.9 million. Sales volume increased 11% from 182.9 million square feet to 202.7 million square feet.
Australia and New Zealand Fibre Cement
Net sales increased 20% from US$76.7 million to US$91.7 million. In Australian dollars, net sales increased 1%.
The increase in local currency net sales was due to a 2% increase in sales volume from 149.7 million square feet to 152.5 million square feet, and a 1% decrease in the average net selling price due mainly to a change in product mix.
In Australia, new residential housing activity slowed during the period, but was better than industry forecasts. The impact of this was partly offset by continuing strong residential renovation and commercial construction activity.
FRC pipes continued to penetrate its targeted market, increasing sales volumes by 26% compared to the same period last year. A new pipe standard was released by Standards Australia during the period that will enable our fibre cement pipe to compete more effectively against steel reinforced concrete pipes.
During the period, we launched ExoTec™ Facade Panel, our new premium facade panel incorporating the next generation of fibre cement composites. The new product is designed for commercial applications.
In New Zealand, new residential housing starts remained at healthy levels but poor weather in some regions affected activity levels in the second quarter. Non-residential construction activity was weaker compared to the same period last year.
Philippines Fibre Cement
Net sales increased 47% from US$8.9 million to US$13.1 million. In local currency, net sales increased 55%. This was due to a 50% increase in sales volume compared to the same period of the previous year, from 33.4 million square feet to 50.2 million square feet and a higher average net selling price.
Domestic market conditions were relatively weak in the first half of the period but improved in the second half. Demand softened at the end of the period due to signs of political instability.
The average selling price increased 3% compared to the same period of the previous year due to a more favourable sales mix.
| James Hardie Half Year FY04 MD&A | 3 |
Other Fibre Cement
Chile Fibre Cement
Our Chilean operation continued to increase its penetration of the local market in line with the targets. The business has captured approximately a 25% share of the Chilean flat sheet market.
Net sales increased 186% compared to the same period last year due to a 113% increase in sales volume and a higher average selling price.
Construction activity in Chile began to show signs of recovery during the period after being stagnant since the end of 2001.
The average selling price increased due to strong export sales and growth in sales of higher-priced, differentiated products.
Hardie® Pipe
Our USA Hardie® Pipe business continued to penetrate the south-east market of the United States and improve its manufacturing efficiency.
Net sales increased 124% compared to the same period last year due to a 135% increase in sales volume and a lower average selling price.
Market acceptance of our fibre cement pipes continued to grow strongly. Our share of the market for our targeted diameter range of drainage pipes in Florida is estimated to have increased to 20%.
The manufacturing performance of the plant was further improved during the period, reducing costs and increasing output, particularly of the larger diameter pipes. Despite this, manufacturing costs remain higher than our targets.
The average net selling price decreased 5% compared to the same period last year due to competitors’ use of aggressive pricing tactics in response to our market penetration.
Florida road building expenditures were soft as a result of reduced transportation spending by the state. Federal funding is also down due to recent shifts in focus of federal spending from public infrastructure to defence and national security projects. The actual level of spending depends in part on the amount of highway user revenues raised by the government and the continued renewal of the TEA-21, which involves significant government spending on highway construction. It is expected that the TEA-21 will be renewed for another six years. Despite lower levels of transportation spending, residential construction continues to be strong in Florida due mainly to low interest rates.
Europe
Our European fibre cement business commenced operations during the period with the launch in the U.K. and French markets of our Hardibacker® range of interior products and our proprietary pre-painted siding products.
| James Hardie Half Year FY04 MD&A | 4 |
Awareness of our product range among distributors, builders and contractors is growing and we started making sales of Hardibacker® and the pre-painted siding products during the period.
In June 2003, we commissioned a new coating line near Southampton in England. The line is used to apply the finishing coat to siding products imported from our United States business.
Artisan Roofing
In June 2003, we commissioned our pilot roofing plant at Fontana, California. The pilot plant, which has a design capacity of 25 mmsf, was built to test our proprietary manufacturing technology and to provide product for market testing in Southern California.
Plant testing and manufacturing trials were conducted during the period and the first on-site installations of the new roofing product were completed. Commercial sales are expected to begin in the third quarter once inventory levels are sufficient to meet initial demand.
Gross Profit
Gross profit increased 28% from US$142.1 million to US$181.7 million due to improvements in all our major businesses. The gross profit margin increased 1.0 percentage point to 36.8%.
USA Fibre Cement gross profit increased 32% due to higher sales volumes and a higher average net selling price, partly offset by an increase in unit cost of sales. The higher unit cost of sales resulted primarily from higher pulp costs, increased sales of higher priced differentiated products and the ramp-up of the new manufacturing lines at the Blandon, Pennsylvania and Waxahachie, Texas plants. Cost of sales was lower as a percentage of sales. The gross profit margin increased 2.8 percentage points.
Asia Pacific Fibre Cement gross profit increased 10% following improvements from Australia and New Zealand Fibre Cement and Philippines Fibre Cement, which increased 7% and 71%, respectively. The improved result for Australia and New Zealand was due to a favourable foreign exchange difference. In Australian dollars, Australia and New Zealand fibre cement gross profit decreased 9% due primarily to a decrease in manufacturing performance at our Rosehill, NSW plant and increased freight costs. The manufacturing performance of the Rosehill plant returned to more acceptable levels by the end of the period. In the Philippines, increased sales and reduced manufacturing costs resulted in the stronger gross profit performance. The Asia Pacific Fibre Cement gross profit margin decreased 3.6 percentage points.
Selling, General and Administrative (SG&A) Expenses
SG&A expenses increased 18% compared to the same period last year, from US$63.6 million to US$75.1 million. The increase in SG&A expenses was due mainly to sales and marketing expenses associated with growth initiatives in the USA. However, as a percentage of sales, SG&A expenses were 0.8 of a percentage point lower, at 15.2%.
| James Hardie Half Year FY04 MD&A | 5 |
Research and Development Expenses
Research and development includes costs associated with “core” research projects that are aimed at benefiting all fibre cement business units. These costs are recorded in the Research and Development segment rather than being attributed to individual business units. These costs increased 54% for the period to US$6.3 million.
Other research and development costs associated with commercialisation projects in business units are included in the business unit segment results. In total, these costs increased 11% to US$4.1 million.
Total research and development costs for the period increased 0.1 of a percentage point to 2.1% of net sales.
EBIT(2)
EBIT increased 36% from US$70.7 million to US$96.2 million. The EBIT margin increased 1.7 percentage points to 19.5%.
USA Fibre Cement EBIT increased 36% from US$79.5 million to US$107.8 million. The increase was due to strong growth in net sales, partly offset by an increase in unit cost of sales and SG&A expenses. The EBIT margin increased 2.6 percentage points to 28.5%.
Asia Pacific Fibre Cement EBIT increased 15% from US$15.6 million to US$18.0 million. The EBIT margin decreased 1.0 percentage point to 17.2%.
Australia and New Zealand Fibre Cement EBIT increased 8% from US$15.8 million to US$17.0 million. In Australian dollars, EBIT decreased 9%. The decrease in EBIT in Australian dollars was due mainly to a decrease in manufacturing performance at the Rosehill, NSW plant and increased freight costs. The EBIT margin was 2.1 percentage points lower, at 18.5%.
Our Philippines business recorded a small operating profit for the period due to increased sales.
The Chile Fibre Cement business recorded an inaugural small operating profit for the period.
Despite continued strong volume growth, our USA Hardie® Pipe business incurred an operating loss for the period due to lower prices and higher than targeted unit costs.
Our European fibre cement business became operational during the period and incurred a small operating loss, as expected.
General corporate costs increased by US$0.3 million from US$13.9 million to US$14.2 million. This increase was due to a US$2.0 million increase in employee share based compensation expense from stock appreciation rights primarily caused by an increase in the company’s share price, partially offset by a US$1.5 million decrease in our employee bonus plan expense and a net decrease in other costs.
Other Expense, net
Other expense, net, increased by US$3.2 million primarily due to a capital duty fee paid in conjunction with our Dutch legal structure. We incurred this to extend the scope of our
| James Hardie Half Year FY04 MD&A | 6 |
international finance subsidiary to lend to global operations and expect to recover this fee within six months through reduced taxation charges.
Net Interest Expense
Net interest expense decreased by US$0.7 million from US$5.4 million to US$4.7 million. Interest expense decreased by US$2.5 million due to lower average borrowings and an increase in the amount of interest expense capitalised during the half year compared to the same period in the prior year. This decrease in net interest expense was partially offset by a US$1.8 million decrease in interest income due to lower average cash balances compared to the same period in the prior year.
Income Tax Expense
Income tax expense increased by US$2.5 million from US$20.0 million to US$22.5 million.
Operating Profit from Continuing Operations(4)
Income from continuing operations increased by 45% or US$20.3 million, from US$45.4 million for the first half of the previous year to US$65.7 million this half year.
Discontinued Operations
We recorded income from discontinued operations of US$1.8 million and US$55.1 million during the first half of the current and previous fiscal years, respectively. The first half of the fiscal year primarily includes profit recorded from the sale of our New Zealand Building Systems business on 30 May 2003. The first half of the previous fiscal year primarily consisted of net profit related to the sale of our Gypsum business.
Liquidity and Capital Resources
We have historically met our working capital needs and capital expenditure requirements through a combination of cash flow from operations, proceeds from the divestiture of businesses, credit facilities and other borrowings, proceeds from the sale of property, plant and equipment and proceeds from the redemption of investments. Seasonal fluctuations in working capital generally have not had a significant impact on our short-term or long-term liquidity. We believe that we can meet our present working capital requirements for at least the next 12 months based on our current capital resources.
We had cash and cash equivalents of US$98.8 million as of 30 September 2003. At that date we also had credit facilities totalling US$428.6 million of which US$174.4 million was outstanding. Our credit facilities are all uncollateralised and consist of the following:
| James Hardie Half Year FY04 MD&A | 7 |
| Effective Interest | Principal | ||||||||||||
| Rate at | Total Facility at | Outstanding at | |||||||||||
| Description | 30 September 2003 | 30 September 2003 | 30 September 2003 | ||||||||||
| (In millions of US$) | |||||||||||||
US$ notes, fixed
interest, repayable
annually in varying
tranches from
November 2004 through
November 2013 |
7.09 | % | $ | 165.0 | $ | 165.0 | |||||||
A$ revolving loan,
can be drawn down
in either US$ or
A$, variable
interest based on
US$ LIBOR or A$
bank bill rate plus
margin, can be
repaid and redrawn
until maturity in
November 2005 |
N/A | 136.6 | — | ||||||||||
US$ stand-by loan,
can be drawn down
in either US$ or
A$, variable
interest based on
US$ LIBOR or A$
bank bill rate plus
margin until
maturity in October
2004 |
N/A | 117.5 | — | ||||||||||
US$ line of credit,
can be drawn down
in Chilean Pesos,
variable interest
based on Chilean
Tasa Activa
Bancaria rate plus
margin until
maturity in
November 2006 |
4.08 | % | 9.5 | 9.4 | |||||||||
Total |
$ | 428.6 | $ | 174.4 | |||||||||
Cash Flow
Net operating cash inflows increased by US$18.4 million to US$91.0 million for the six months ended 30 September 2003 compared to the same period in the prior year. Net income after adjusting for the gain on disposal of subsidiaries and businesses increased by US$18.6 million. Additionally, we had a decrease in operating cash flows of US$0.2 million from the net change in working capital account balances and non-cash income and expenses.
Net investing activities produced a cash outflow of US$38.5 million for the six months ended 30 September 2003 compared to a cash inflow of US$310.6 million for the same period in the prior year. Proceeds from the disposal of subsidiaries and businesses decreased by US$329.4 million, and capital expenditures increased by US$20.1 million. Proceeds of US$5.0 million from the sale of subsidiaries and businesses in the current period resulted from the sale of our New Zealand Building Systems business in May 2003. The US$44.1 million capital expenditures in the current period resulted primarily from continued operating plant expansions and construction and new property purchases. We had other cash inflows from investing activities of US$0.6 million during the six months period ended 30 September 2003.
Net financing activities resulted in an outflow of US$8.8 million for the six months ended 30 September 2003 compared to a US$93.4 million outflow in the same period of the prior year. In the prior year period, we repaid US$100 million of bank debt, which did not recur in the current
| James Hardie Half Year FY04 MD&A | 8 |
period. Proceeds from borrowings decreased by US$3.8 million to US$0.6 million. We had a US$0.2 million decrease in proceeds from the issuance of shares to US$2.0 million and we paid dividends in the amount of US$11.4 million. The proceeds of US$2.0 million represent stock option exercises during the six months ended 30 September 2003.
Interim Dividend
The Board has declared an interim dividend of US 2.5 cents a share payable to share/CUFS holders on 16 December 2003. The Record Date is 27 November 2003 to determine entitlements to this dividend (i.e., on the basis of proper instruments of transfer received by the Company’s registrar, Computershare Investor Services Pty Ltd, Level 3, 60 Carrington Street, Sydney NSW 2000, Australia, by 5:00pm if securities are not CHESS approved, or security holding balances established by 5:00pm or such later time permitted by SCH Business Rules if securities are CHESS approved).
This interim dividend and future dividends will be unfranked for Australian taxation purposes.
This dividend is subject to Dutch withholding tax of 25%. Many Australian resident holders may reduce the withholding tax rate to 15% deduction if they are eligible and have completed and lodged a current special Form A before the dividend record date with the Company’s registrar. Holders with 25% withholding tax may be eligible to reclaim a portion of the tax after payment date. For withholding tax information see: www.jameshardie.com (select Investor Relations, then Shareholder services, then Tax Information) or contact Computershare.
The Australian currency equivalent amount of the dividend to be paid to CUFS holders will be announced to the ASX on 28 November 2003.
No dividend reinvestment plans are available for this dividend.
End.
Media/Analysts call:
Greg Baxter — Executive Vice President
Telephone: 61 2 8274 5377
Mobile: 0419 461 368
Email: [email protected]
Or
Steve Ashe
Vice President Investor Relations
Telephone: 61 2 8274 5246
Mobile: 0408 164 011
Email: [email protected]
Facsimile: 61 2 8274 5218
The MD&As and accompanying release and management presentation, along with an audio webcast of the presentation are available at www.jameshardie.com
| James Hardie Half Year FY04 MD&A | 9 |
Notes
1. This Management’s Discussion and Analysis document forms part of a package
of information about the company’s results. It should be read in conjunction
with the other parts of this package, including a Media Release, a Management
Presentation, a Financial Report and a Results at a Glance document.
2. EBIT is defined as operating income. EBIT margin is defined as EBIT as a percentage of our net sales. We believe EBIT and EBIT margin to be relevant and useful information as these are the primary measures used by our management to measure the operating profit or loss of our business. EBIT is one of several metrics used by our management to measure the cash generated from our operations, excluding the operating cash requirement of our interest and income taxes. Additionally, EBIT is believed to be a primary measure and terminology used by our Australian investors. EBIT and EBIT margin should be considered in addition to, but not as a substitute for, other measures of financial performance reported in accordance with accounting principles generally accepted in the United States of America. EBIT and EBIT margin, as we have defined them, may not be comparable to similarly titled measures reported by other companies.
The use of EBIT and EBIT margins in this document are equivalent to the US GAAP measures of operating income and operating income margin.
3. Operating profit from continuing operations before income taxes is equivalent to the US GAAP measure of income from continuing operations before income taxes.
4. Operating profit from continuing operations is equivalent to the US GAAP measure of income from continuing operations.
5. Net operating profit including discontinued operations is equivalent to the US GAAP measure of net income.
Disclaimer
This report contains forward-looking statements. Words such as “believe,’’
“anticipate,’’ “plan,’’ “expect,’’ “intend,’’ “target,’’ “estimate,’’
“project,’’ “predict,’’ “forecast,’’ “guideline,’’ “should,’’ “aim’’ and
similar expressions are intended to identify forward-looking statements but
are not the exclusive means of identifying such statements. Forward-looking
statements involve inherent risks and uncertainties. We caution you that a
number of important factors could cause actual results to differ materially
from the plans, objectives, expectations, estimates and intentions expressed
in such forward-looking statements. These factors, which are further
discussed in our reports submitted to the Securities and Exchange Commission
on Forms 20-F and 6-K and in our other filings, include but are not limited
to: competition and product pricing in the markets in which we operate;
general economic and market conditions; compliance with, and possible changes
in, environmental and health and safety laws; dependence on cyclical
construction markets; the supply and cost of raw materials; our reliance on a
small number of product distributors; the consequences of product failures or
defects; exposure to environmental, asbestos or other legal proceedings; and
risks of conducting business internationally. We caution you that the
foregoing list of factors is not exclusive and that other risks and
uncertainties may cause actual results to differ materially from those
contained in forward-looking statements. Forward-looking statements speak
only as of the date they are made.
| James Hardie Half Year FY04 MD&A | 10 |

James Hardie Industries N.V.
and
Subsidiaries
Financial Report
30 September 2003
INDEX
| Page | ||||||
Item 1. |
Financial Statements |
|||||
Report of Independent Auditors |
||||||
Consolidated Balance Sheets as of 30 September 2003 and 31 March 2003 |
1 | |||||
Consolidated Statements of Income for the Three and Six Months Ended 30 September 2003
and 2002 |
2 | |||||
Consolidated Statements of Cash Flows for the Six Months Ended 30 September 2003 and 2002 |
4 | |||||
Consolidated Statement of Changes in Shareholders’ Equity for the Six Months
Ended 30 September 2003 |
6 | |||||
Notes to Consolidated Financial Statements |
7 | |||||
Item 2. |
Quantitative and Qualitative Disclosures About Market Risk |
13 | ||||
Report of Independent Auditors
To the Board of Directors and Shareholders of James Hardie Industries N.V. and Subsidiaries
We have reviewed the accompanying consolidated balance sheet of James Hardie Industries N.V. and Subsidiaries as of 30 September 2003, and the related consolidated statements of income for each of the three-month and six-month periods ended 30 September 2003 and 2002, the consolidated statements of cash flows for the six-month periods ended 30 September 2003 and 2002, and the consolidated statement of changes in shareholders’ equity for the six-month period ended 30 September 2003, as stated in U.S. dollars. We have not reviewed any amounts stated in Australian dollars included in the accompanying financial statements. These interim financial statements are the responsibility of the Company’s management.
We conducted our review in accordance with standards established by the American Institute of Certified Public Accountants. A review of interim financial information consists principally of applying analytical procedures and making inquiries of persons responsible for financial and accounting matters. It is substantially less in scope than an audit conducted in accordance with generally accepted auditing standards, the objective of which is the expression of an opinion regarding the financial statements taken as a whole. Accordingly, we do not express such an opinion.
Based on our review, we are not aware of any material modifications that should be made to the accompanying consolidated interim financial statements for them to be in conformity with accounting principles generally accepted in the United States of America.
We previously audited in accordance with auditing standards generally accepted in the United States of America, the consolidated balance sheet as of 31 March 2003, and the related consolidated statements of income, cash flows and changes in shareholders’ equity for the year then ended (not presented herein), and in our report dated 2 May 2003 we expressed an unqualified opinion on those consolidated financial statements. In our opinion, the information set forth in the accompanying consolidated balance sheet information as of 31 March 2003, is fairly stated in all material respects in relation to the consolidated balance sheet from which it has been derived.
As discussed in Note 17 to the consolidated financial statements for the year ended 31 March 2003, on 25 April 2002, the Company sold the assets of its Gypsum business.
As discussed in Note 2 to the consolidated financial statements for the year ended 31 March 2003, the Company changed its method of accounting to reflect stock-based compensation under a fair value based model and retroactively restated all years presented. Also as discussed in Note 2, the Company changed its method of accounting for early extinguishments of debt, which resulted in costs incurred during the year ended 31 March 2003 not being classified as extraordinary.

PRICEWATERHOUSECOOPERS LLP
Los Angeles, California
10 November 2003
Item 1. Financial Statements
JAMES HARDIE INDUSTRIES N.V. AND SUBSIDIARIES
CONSOLIDATED BALANCE SHEETS
| (Millions of US dollars) | (Millions of Australian dollars) | |||||||||||||||||
| 30 September | 31 March | 30 September | 31 March | |||||||||||||||
| 2003 | 2003 | 2003 | 2003 | |||||||||||||||
| (Unaudited) | (Unaudited) | (Unaudited) | ||||||||||||||||
ASSETS |
||||||||||||||||||
Current assets: |
||||||||||||||||||
Cash and cash equivalents |
$ | 98.8 | $ | 54.6 | A$ | 144.7 | A$ | 90.4 | ||||||||||
Accounts and notes receivable, net of allowance for
doubtful accounts of $1.3 million (A$1.9 million) and
$1.0 million (A$1.7 million) as of 30 September 2003 and
31 March 2003, respectively |
102.6 | 87.8 | 150.2 | 145.4 | ||||||||||||||
Inventories |
75.9 | 74.0 | 111.1 | 122.5 | ||||||||||||||
Refundable income taxes |
— | 20.4 | — | 33.8 | ||||||||||||||
Prepaid expenses and other current assets |
11.1 | 6.6 | 16.3 | 10.9 | ||||||||||||||
Deferred tax assets |
19.6 | 23.0 | 28.7 | 38.1 | ||||||||||||||
Current assets — discontinued operations |
— | 5.4 | — | 8.9 | ||||||||||||||
Total current assets |
308.0 | 271.8 | 451.0 | 450.0 | ||||||||||||||
Long-term receivables |
6.0 | 3.7 | 8.8 | 6.1 | ||||||||||||||
Investments |
5.5 | 6.0 | 8.1 | 9.9 | ||||||||||||||
Property, plant and equipment, net |
556.5 | 520.0 | 814.9 | 861.1 | ||||||||||||||
Intangible assets, net |
3.0 | 3.4 | 4.4 | 5.6 | ||||||||||||||
Deferred tax assets |
14.8 | 21.4 | 21.7 | 35.4 | ||||||||||||||
Non-current assets — discontinued operations |
— | 1.3 | — | 2.2 | ||||||||||||||
Total assets |
$ | 893.8 | $ | 827.6 | A$ | 1,308.9 | A$ | 1,370.3 | ||||||||||
LIABILITIES AND SHAREHOLDERS’ EQUITY |
||||||||||||||||||
Current liabilities: |
||||||||||||||||||
Accounts payable and accrued liabilities |
$ | 78.9 | $ | 74.0 | A$ | 115.5 | A$ | 122.5 | ||||||||||
Short-term debt |
9.4 | 8.8 | 13.8 | 14.6 | ||||||||||||||
Accrued payroll and employee benefits |
33.2 | 31.6 | 48.6 | 52.3 | ||||||||||||||
Accrued product warranties |
11.7 | 7.3 | 17.1 | 12.1 | ||||||||||||||
Income taxes payable |
10.2 | 7.7 | 14.9 | 12.8 | ||||||||||||||
Other liabilities |
3.7 | 4.9 | 5.4 | 8.1 | ||||||||||||||
Current liabilities — discontinued operations |
— | 2.3 | — | 3.8 | ||||||||||||||
Total current liabilities |
147.1 | 136.6 | 215.3 | 226.2 | ||||||||||||||
Long-term debt |
165.0 | 165.0 | 241.6 | 273.2 | ||||||||||||||
Deferred income taxes |
59.9 | 65.5 | 87.7 | 108.5 | ||||||||||||||
Accrued product warranties |
1.5 | 7.5 | 2.2 | 12.4 | ||||||||||||||
Other liabilities |
15.0 | 18.3 | 22.0 | 30.3 | ||||||||||||||
Total liabilities |
388.5 | 392.9 | A$ | 568.8 | A$ | 650.6 | ||||||||||||
Commitments and contingencies (Note 7) |
||||||||||||||||||
Shareholders’ equity: |
||||||||||||||||||
Common stock, 2.0 billion shares authorized;
Euro 0.64 par value, 458,113,483 shares issued and
outstanding at 30 September 2003 and Euro 0.64
par value, 457,514,598 shares issued and outstanding
at 31 March 2003 |
270.2 | 269.7 | ||||||||||||||||
Additional paid-in capital |
174.1 | 171.3 | ||||||||||||||||
Retained earnings |
100.5 | 44.4 | ||||||||||||||||
Employee loans |
(4.1 | ) | (4.4 | ) | ||||||||||||||
Accumulated other comprehensive loss |
(35.4 | ) | (46.3 | ) | ||||||||||||||
Total shareholders’ equity |
505.3 | 434.7 | ||||||||||||||||
Total liabilities and shareholders’ equity |
$ | 893.8 | $ | 827.6 | ||||||||||||||
The accompanying notes are an integral part of these interim consolidated financial statements.
1
JAMES HARDIE INDUSTRIES N.V. AND SUBSIDIARIES
CONSOLIDATED STATEMENTS OF INCOME
(Unaudited)
| Three Months | Six Months | ||||||||||||||||
| Ended 30 September | Ended 30 September | ||||||||||||||||
| (Millions of US dollars, except per share data) | 2003 | 2002 | 2003 | 2002 | |||||||||||||
Net sales |
$ | 251.6 | $ | 202.1 | $ | 493.1 | $ | 396.7 | |||||||||
Cost of goods sold |
(159.2 | ) | (128.5 | ) | (311.4 | ) | (254.6 | ) | |||||||||
Gross profit |
92.4 | 73.6 | 181.7 | 142.1 | |||||||||||||
Selling, general and administrative expenses |
(38.9 | ) | (33.5 | ) | (75.1 | ) | (63.6 | ) | |||||||||
Research and development expenses |
(5.6 | ) | (4.5 | ) | (10.4 | ) | (7.8 | ) | |||||||||
Operating income |
47.9 | 35.6 | 96.2 | 70.7 | |||||||||||||
Interest expense |
(2.8 | ) | (3.8 | ) | (5.3 | ) | (7.8 | ) | |||||||||
Interest income |
0.4 | 1.3 | 0.6 | 2.4 | |||||||||||||
Other (expense) income |
(3.3 | ) | (0.2 | ) | (3.3 | ) | 0.1 | ||||||||||
Income from continuing operations before income taxes |
42.2 | 32.9 | 88.2 | 65.4 | |||||||||||||
Income tax expense |
(9.4 | ) | (9.9 | ) | (22.5 | ) | (20.0 | ) | |||||||||
Income from continuing operations |
32.8 | 23.0 | 65.7 | 45.4 | |||||||||||||
Discontinued operations: |
|||||||||||||||||
Income from discontinued operations, net of income
tax expense
of $0.3 million for the three months ended 30
September 2002
and net of income tax expense of $0.1 million and
$1.2 million
for the six months ended 30 September 2003 and 2002, respectively |
— | 0.5 | 0.2 | 2.2 | |||||||||||||
Gain on disposal of discontinued operations, net of
income tax
benefit of $2.1 million for the three months ended
30 September 2002
and net of income tax benefit (expense) of $0.1
million and ($27.3) million
for the six months ended 30 September 2003 and 2002,
respectively |
— | 1.1 | 1.6 | 52.9 | |||||||||||||
Income from discontinued operations |
— | 1.6 | 1.8 | 55.1 | |||||||||||||
Net income |
$ | 32.8 | $ | 24.6 | $ | 67.5 | $ | 100.5 | |||||||||
Income per share — basic: |
|||||||||||||||||
Income from continuing operations |
$ | 0.07 | $ | 0.05 | $ | 0.15 | $ | 0.10 | |||||||||
Income from discontinued operations |
— | — | — | 0.12 | |||||||||||||
Net income per share — basic |
$ | 0.07 | $ | 0.05 | $ | 0.15 | $ | 0.22 | |||||||||
Income per share — diluted: |
|||||||||||||||||
Income from continuing operations |
$ | 0.07 | $ | 0.05 | $ | 0.15 | $ | 0.10 | |||||||||
Income from discontinued operations |
— | — | — | 0.12 | |||||||||||||
Net income per share — diluted |
$ | 0.07 | $ | 0.05 | $ | 0.15 | $ | 0.22 | |||||||||
Weighted average common shares outstanding (in millions): |
|||||||||||||||||
Basic |
458.0 | 456.5 | 457.8 | 456.2 | |||||||||||||
Diluted |
461.5 | 459.1 | 461.0 | 458.6 | |||||||||||||
The accompanying notes are an integral part of these interim consolidated financial statements.
2
JAMES HARDIE INDUSTRIES N.V. AND SUBSIDIARIES
CONSOLIDATED STATEMENTS OF INCOME
(Unaudited)
| Three Months | Six Months | ||||||||||||||||
| Ended 30 September | Ended 30 September | ||||||||||||||||
| (Millions of Australian dollars, except per share data) | 2003 | 2002 | 2003 | 2002 | |||||||||||||
Net sales |
A$ | 387.1 | A$ | 367.7 | A$ | 758.7 | A$ | 721.8 | |||||||||
Cost of goods sold |
(244.9 | ) | (233.8 | ) | (479.1 | ) | (463.3 | ) | |||||||||
Gross profit |
142.2 | 133.9 | 279.6 | 258.5 | |||||||||||||
Selling, general and administrative expenses |
(59.9 | ) | (61.0 | ) | (115.5 | ) | (115.7 | ) | |||||||||
Research and development expenses |
(8.6 | ) | (8.2 | ) | (16.0 | ) | (14.2 | ) | |||||||||
Operating income |
73.7 | 64.7 | 148.1 | 128.6 | |||||||||||||
Interest expense |
(4.3 | ) | (6.9 | ) | (8.2 | ) | (14.2 | ) | |||||||||
Interest income |
0.6 | 2.4 | 0.9 | 4.4 | |||||||||||||
Other (expense) income |
(5.1 | ) | (0.4 | ) | (5.1 | ) | 0.2 | ||||||||||
Income from continuing operations before income taxes |
64.9 | 59.8 | 135.7 | 119.0 | |||||||||||||
Income tax expense |
(14.5 | ) | (18.0 | ) | (34.6 | ) | (36.4 | ) | |||||||||
Income from continuing operations |
50.4 | 41.8 | 101.1 | 82.6 | |||||||||||||
Discontinued operations: |
|||||||||||||||||
Income from discontinued operations, net of income tax expense
of A$0.5 million for the three months ended 30 September 2002
and net of income tax expense of A$0.2 million and A$2.2 million
for the six months ended 30 September 2003 and 2002, respectively |
— | 0.9 | 0.3 | 4.0 | |||||||||||||
Gain on disposal of discontinued operations, net of income tax
benefit of A$3.8 million for the three months ended 30 September
2002 and net of income tax benefit (expense) of A$0.2 million and
(A$49.7) million
for the six months ended 30 September 2003 and 2002, respectively |
— | 2.0 | 2.5 | 96.4 | |||||||||||||
Income from discontinued operations |
— | 2.9 | 2.8 | 100.4 | |||||||||||||
Net income |
A$ | 50.4 | A$ | 44.7 | A$ | 103.9 | A$ | 183.0 | |||||||||
Income per share — basic: |
|||||||||||||||||
Income from continuing operations |
A$ | 0.11 | A$ | 0.09 | A$ | 0.22 | A$ | 0.18 | |||||||||
Income from discontinued operations |
— | 0.01 | 0.01 | 0.22 | |||||||||||||
Net income per share — basic |
A$ | 0.11 | A$ | 0.10 | A$ | 0.23 | A$ | 0.40 | |||||||||
Income per share — diluted: |
|||||||||||||||||
Income from continuing operations |
A$ | 0.11 | A$ | 0.09 | A$ | 0.22 | A$ | 0.18 | |||||||||
Income from discontinued operations |
— | 0.01 | 0.01 | 0.22 | |||||||||||||
Net income per share — diluted |
A$ | 0.11 | A$ | 0.10 | A$ | 0.23 | A$ | 0.40 | |||||||||
Weighted average common shares outstanding (in millions): |
|||||||||||||||||
Basic |
458.0 | 456.5 | 457.8 | 456.2 | |||||||||||||
Diluted |
461.5 | 459.1 | 461.0 | 458.6 | |||||||||||||
The accompanying notes are an integral part of these interim consolidated financial statements.
3
JAMES HARDIE INDUSTRIES N.V. AND SUBSIDIARIES
CONSOLIDATED STATEMENTS OF CASH FLOWS
(Unaudited)
| Six Months | ||||||||||
| Ended 30 September | ||||||||||
| (Millions of US dollars) | 2003 | 2002 | ||||||||
Cash flows from operating activities: |
||||||||||
Net income |
$ | 67.5 | $ | 100.5 | ||||||
Adjustments to reconcile net income to net cash provided by operating activities: |
||||||||||
Gain on disposal of subsidiaries and businesses |
(1.8 | ) | (50.8 | ) | ||||||
Depreciation and amortisation |
16.2 | 14.5 | ||||||||
Deferred income taxes |
5.4 | (8.0 | ) | |||||||
Prepaid pension cost |
— | (0.2 | ) | |||||||
Tax benefit from stock options exercised |
0.1 | 0.6 | ||||||||
Stock compensation |
1.2 | 0.5 | ||||||||
Other |
0.4 | — | ||||||||
Changes in operating assets and liabilities: |
||||||||||
Accounts receivable |
(12.1 | ) | (12.2 | ) | ||||||
Prepaids and other current assets |
16.0 | (0.2 | ) | |||||||
Inventories |
0.4 | 13.4 | ||||||||
Accounts payable |
2.8 | 14.4 | ||||||||
Accrued liabilities and other liabilities |
(5.1 | ) | 0.1 | |||||||
Net cash provided by operating activities |
91.0 | 72.6 | ||||||||
Cash flows from investing activities: |
||||||||||
Purchases of property, plant and equipment |
(44.1 | ) | (24.0 | ) | ||||||
Proceeds from sale of property, plant and equipment |
0.1 | — | ||||||||
Proceeds from disposal of subsidiaries and businesses, net of
cash invested |
5.0 | 334.4 | ||||||||
Proceeds from sale and maturity of investments |
— | 0.1 | ||||||||
Collections on loans receivable |
0.5 | 0.1 | ||||||||
Net cash (used in) provided by investing activities |
(38.5 | ) | 310.6 | |||||||
Cash flows from financing activities: |
||||||||||
Net proceeds from line of credit |
0.6 | 2.0 | ||||||||
Proceeds from borrowings |
— | 2.4 | ||||||||
Repayments of borrowings |
— | (100.0 | ) | |||||||
Proceeds from issuance of shares |
2.0 | 2.2 | ||||||||
Dividends paid |
(11.4 | ) | — | |||||||
Net cash used in financing activities |
(8.8 | ) | (93.4 | ) | ||||||
Effects of exchange rate changes on cash |
0.5 | 0.9 | ||||||||
Net increase in cash and cash equivalents |
44.2 | 290.7 | ||||||||
Cash and cash equivalents at beginning of period |
54.6 | 31.1 | ||||||||
Cash and cash equivalents at end of period |
98.8 | 321.8 | ||||||||
Components of cash and cash equivalents: |
||||||||||
Cash at bank and on hand |
11.8 | 17.0 | ||||||||
Short-term deposits |
87.0 | 304.8 | ||||||||
Cash and cash equivalents at end of period |
$ | 98.8 | $ | 321.8 | ||||||
The accompanying notes are an integral part of these interim consolidated financial statements.
4
JAMES HARDIE INDUSTRIES N.V. AND SUBSIDIARIES
CONSOLIDATED STATEMENTS OF CASH FLOWS
(Unaudited)
| Six Months | ||||||||||
| Ended 30 September | ||||||||||
| (Millions of Australian dollars) | 2003 | 2002 | ||||||||
Cash flows from operating activities: |
||||||||||
Net income |
A$ | 103.9 | A$ | 183.0 | ||||||
Adjustments to reconcile net income to net cash provided by operating activities: |
||||||||||
Gain on disposal of subsidiaries and businesses |
(2.8 | ) | (92.4 | ) | ||||||
Depreciation and amortisation |
24.9 | 26.4 | ||||||||
Deferred income taxes |
8.3 | (14.6 | ) | |||||||
Prepaid pension cost |
— | (0.4 | ) | |||||||
Tax benefit from stock options exercised |
0.2 | 1.1 | ||||||||
Stock compensation |
1.8 | 0.9 | ||||||||
Other |
0.6 | — | ||||||||
Changes in operating assets and liabilities: |
||||||||||
Accounts receivable |
(18.6 | ) | (22.2 | ) | ||||||
Prepaids and other current assets |
24.6 | (0.4 | ) | |||||||
Inventories |
0.6 | 24.4 | ||||||||
Accounts payable |
4.3 | 26.2 | ||||||||
Accrued liabilities and other liabilities |
(7.9 | ) | 0.2 | |||||||
Net cash provided by operating activities |
139.9 | 132.2 | ||||||||
Cash flows from investing activities: |
||||||||||
Purchases of property, plant and equipment |
(67.9 | ) | (43.7 | ) | ||||||
Proceeds from sale of property, plant and equipment |
0.2 | — | ||||||||
Proceeds from disposal of subsidiaries and businesses, net of
cash invested |
7.7 | 608.5 | ||||||||
Proceeds from sale and maturity of investments |
— | 0.2 | ||||||||
Collections on loans receivable |
0.8 | 0.2 | ||||||||
Net cash (used in) provided by investing activities |
(59.2 | ) | 565.2 | |||||||
Cash flows from financing activities: |
||||||||||
Net proceeds from line of credit |
0.9 | 3.6 | ||||||||
Proceeds from borrowings |
— | 4.4 | ||||||||
Repayments of borrowings |
— | (182.0 | ) | |||||||
Proceeds from issuance of shares |
3.1 | 4.0 | ||||||||
Dividends paid |
(17.5 | ) | — | |||||||
Net cash used in financing activities |
(13.5 | ) | (170.0 | ) | ||||||
Effects of exchange rate changes on cash |
(12.9 | ) | 5.1 | |||||||
Net increase in cash and cash equivalents |
54.3 | 532.5 | ||||||||
Cash and cash equivalents at beginning of period |
90.4 | 58.5 | ||||||||
Cash and cash equivalents at end of period |
144.7 | 591.0 | ||||||||
Components of cash and cash equivalents: |
||||||||||
Cash at bank and on hand |
17.3 | 31.2 | ||||||||
Short-term deposits |
127.4 | 559.8 | ||||||||
Cash and cash equivalents at end of period |
A$ | 144.7 | A$ | 591.0 | ||||||
The accompanying notes are an integral part of these interim consolidated financial statements.
5
JAMES HARDIE INDUSTRIES N.V. AND SUBSIDIARIES
CONSOLIDATED STATEMENTS OF CHANGES IN SHAREHOLDERS’ EQUITY
(Unaudited)
| Accumulated | ||||||||||||||||||||||||||
| Additional | Other | |||||||||||||||||||||||||
| Common | Paid-in | Retained | Employee | Comprehensive | ||||||||||||||||||||||
| (Millions of US dollars) | Stock | Capital | Earnings | Loans | Income (Loss) | Total | ||||||||||||||||||||
Balances as of 31 March 2003 |
$ | 269.7 | $ | 171.3 | $ | 44.4 | $ | (4.4 | ) | $ | (46.3 | ) | $ | 434.7 | ||||||||||||
Comprehensive income: |
||||||||||||||||||||||||||
Net income |
— | — | 67.5 | — | — | 67.5 | ||||||||||||||||||||
Other comprehensive income: |
||||||||||||||||||||||||||
Amortisation of
unrealised transition
loss on derivative
instruments |
— | — | — | — | 0.6 | 0.6 | ||||||||||||||||||||
Foreign currency
translation gain |
— | — | — | — | 10.3 | 10.3 | ||||||||||||||||||||
Other comprehensive income |
— | — | — | — | 10.9 | 10.9 | ||||||||||||||||||||
Total comprehensive income |
78.4 | |||||||||||||||||||||||||
Dividends paid |
— | — | (11.4 | ) | — | — | (11.4 | ) | ||||||||||||||||||
Stock compensation |
— | 1.2 | — | — | — | 1.2 | ||||||||||||||||||||
Tax benefit from stock options
exercised |
— | 0.1 | — | — | — | 0.1 | ||||||||||||||||||||
Employee loans repaid |
— | — | — | 0.3 | — | 0.3 | ||||||||||||||||||||
Stock options exercised |
0.5 | 1.5 | — | — | — | 2.0 | ||||||||||||||||||||
Balances as of 30 September
2003 |
$ | 270.2 | $ | 174.1 | $ | 100.5 | $ | (4.1 | ) | $ | (35.4 | ) | $ | 505.3 | ||||||||||||
The accompanying notes are an integral part of these interim consolidated financial statements.
6
JAMES HARDIE INDUSTRIES N.V. AND SUBSIDIARIES
NOTES TO CONSOLIDATED FINANCIAL STATEMENTS
(Unaudited)
1. Basis of Presentation
The consolidated financial statements represent the financial position and results of operations of James Hardie Industries N.V. (“JHI NV”) and its wholly owned subsidiaries, collectively referred to as either the “Company” or “James Hardie,” unless the context indicates otherwise indicates otherwise.
In the opinion of management, the accompanying financial statements reflect all adjustments, which are of a normal recurring nature, necessary for a fair statement of financial position as of 30 September and 31 March 2003 and the results of operations for the three and six months ended 30 September 2003 and 2002 and cash flows for the six months ended 30 September 2003 and 2002. These consolidated financial statements and notes are to be read in conjunction with the audited consolidated financial statements of James Hardie Industries N.V. and Subsidiaries for the three years ended 31 March 2003. The results of operations for the six months ended 30 September 2003 are not necessarily indicative of the results to be expected for the full fiscal year ending 31 March 2004.
The assets, liabilities, income statement and cash flows of the Company have been presented with accompanying Australian dollar (A$) convenience translations. These A$ convenience translations are not prepared in accordance with accounting principles generally accepted in the United States of America. The exchange rates used to calculate the convenience translations are as follows (US$1 = A$):
| 31 March | 30 September | |||||||||||
| 2003 | 2003 | 2002 | ||||||||||
Assets and liabilities |
1.6559 | 1.4643 | n/a | |||||||||
Income statement |
n/a | 1.5386 | 1.8196 | |||||||||
Cash flows — beginning cash |
n/a | 1.6559 | 1.8808 | |||||||||
Cash flows — ending cash |
n/a | 1.4643 | 1.8359 | |||||||||
Cash flows — current period movements |
n/a | 1.5386 | 1.8196 | |||||||||
2. Summary of Significant Accounting Policies
Reclassifications
Certain prior year balances have been reclassified to conform with the current year presentation.
Earnings per Share
The Company is required to disclose basic and diluted earnings per share (“EPS”). Basic EPS is calculated using income divided by the weighted average number of common shares outstanding during the period. Diluted EPS is similar to basic EPS except that the weighted average number of common shares outstanding is increased to include the number of additional common shares calculated using the treasury method that would have been outstanding if the dilutive potential common shares, such as options, had been issued. Accordingly, basic and dilutive common shares outstanding used in determining net income per share are as follows:
| Three Months | Six Months | |||||||||||||||
| Ended 30 September | Ended 30 September | |||||||||||||||
| (Millions) | 2003 | 2002 | 2003 | 2002 | ||||||||||||
Basic common shares outstanding |
458.0 | 456.5 | 457.8 | 456.2 | ||||||||||||
Dilutive effect of stock options |
3.5 | 2.6 | 3.2 | 2.4 | ||||||||||||
Diluted common shares outstanding |
461.5 | 459.1 | 461.0 | 458.6 | ||||||||||||
Potential common shares of 2.0 million for the six months ended 30 September 2002 have been excluded from the calculation of diluted shares outstanding because the effect of their inclusion would be anti-dilutive.
7
JAMES HARDIE INDUSTRIES N.V. AND SUBSIDIARIES
NOTES TO CONSOLIDATED FINANCIAL STATEMENTS (Continued)
(Unaudited)
Advertising
The Company expenses the production costs of advertising the first time the advertising takes place. Advertising expense was $4.8 million and $2.8 million for the three months ended 30 September 2003 and 2002, respectively, and $7.1 million and $4.4 million for the six months ended 30 September 2003 and 2002, respectively.
Stock-Based Compensation
In fiscal year 2003, the Company adopted the fair value provisions of Statement of Financial Accounting Standard (“SFAS”) No. 123, “Accounting for Stock-Based Compensation,” which requires the Company to value stock options issued based upon an option-pricing model and recognise this value as compensation expense over the periods in which the options vest. In accordance with the provisions of SFAS No. 148, “Accounting for Stock-Based Compensation — Transition and Disclosure, an amendment of SFAS No.123,” the Company has elected to recognise stock-based compensation using the retroactive restatement method. Under this change in accounting method, the Company has restated its consolidated financial statements for all periods presented herein to reflect stock-based compensation expense under a fair value method for all options granted, modified or settled in fiscal years beginning after 31 March 1995. The table below sets forth the effect of the retroactive restatement of prior periods.
| 30 September | |||||
| (Millions of US dollars, except per share amounts) | 2002 | ||||
Net income: |
|||||
As previously reported |
$ | 100.5 | |||
As restated |
$ | 100.5 | |||
Net income per share — basic: |
|||||
As previously reported |
$ | 0.22 | |||
As restated |
$ | 0.22 | |||
Net income per share — diluted: |
|||||
As previously reported |
$ | 0.22 | |||
As restated |
$ | 0.22 | |||
The Company incurred stock-based compensation expense (included in selling, general and administrative expenses) of $0.6 million and $0.5 million for the three months ended 30 September 2003 and 2002, respectively, and $1.2 million and $0.9 million for the six months ended 30 September 2003 and 2002, respectively.
Recent Accounting Pronouncements
Amendment of SFAS No.133, Accounting for Derivative Instruments and Hedging Activities
In April 2003, the Financial Accounts Standards Board (“FASB”) issued SFAS No.149, “Amendment of Statement No. 133, Accounting for Derivative Instruments and Hedging Activities.” This statement clarifies the definition of a derivative and incorporates certain decisions made by the FASB as part of the Derivatives Implementation Group process. This statement is effective for contracts entered into or modified, and for hedging relationships designated after 30 June 2003 and should be applied prospectively. The provisions of the Statement that relate to implementation issues addressed by the Derivatives Implementation Group that have been effective should continue to be applied in accordance with their respective effective dates. The adoption of this standard did not have a material impact on the Company’s consolidated financial statements.
Certain Financial Instruments with Characteristics of both Liabilities and Equity
In May 2003, the FASB issued SFAS No. 150, “Certain Financial Instruments with Characteristics of both Liabilities and Equity.” This statement establishes standards for how a company clarifies and measures certain financial instruments with characteristics of both liabilities and equity. It requires a company to classify such instruments as liabilities, whereas they previously may have been classified as equity. The standard is effective for all financial instruments entered into or modified after 31 May 2003, and otherwise is effective 1 July 2003. The adoption of this standard did not have a material impact on the Company’s consolidated financial statements.
8
JAMES HARDIE INDUSTRIES N.V. AND SUBSIDIARIES
NOTES TO CONSOLIDATED FINANCIAL STATEMENTS (Continued)
(Unaudited)
3. Inventories
Inventories consist of the following components:
| 30 September | 31 March | ||||||||
| (Millions of US dollars) | 2003 | 2003 | |||||||
Finished goods |
$ | 52.5 | $ | 54.7 | |||||
Work-in-process |
5.2 | 4.5 | |||||||
Raw materials and supplies |
19.9 | 16.2 | |||||||
Provision for obsolete finished goods and raw materials |
(1.7 | ) | (1.4 | ) | |||||
Total inventories |
$ | 75.9 | $ | 74.0 | |||||
4. Discontinued Operations
Building Systems
On 30 May 2003, the Company sold its New Zealand Building Systems business to a third party. A gain of $1.9 million represented the excess of net proceeds from the sale of $6.7 million over the net book value of assets sold of $4.8 million. The proceeds from the sale were comprised of cash of $5.0 million and a note receivable in the amount of $1.7 million.
Gypsum
On 13 March 2002, the Company announced that it had signed an agreement to sell its US-based Gypsum operations to a third party. The transaction was completed on 25 April 2002. A pre-tax gain of $81.4 million represented the excess of net proceeds from the sale of $334.4 million over the net book value of assets sold of $253.0 million. The sale resulted in an income tax expense of $27.7 million. The proceeds from the sale were comprised of cash of $345.0 million less selling costs of $10.6 million.
The following are the results of operations of discontinued businesses:
| Three Months | Six Months | ||||||||||||||||
| Ended 30 September | Ended 30 September | ||||||||||||||||
| (Millions of US dollars) | 2003 | 2002 | 2003 | 2002 | |||||||||||||
Building Systems |
|||||||||||||||||
Net sales |
$ | — | $ | 5.5 | $ | 2.9 | $ | 11.1 | |||||||||
Income before income taxes |
— | 0.8 | 0.3 | 1.6 | |||||||||||||
Income tax expense |
— | (0.3 | ) | (0.1 | ) | (0.5 | ) | ||||||||||
Net income |
— | 0.5 | 0.2 | 1.1 | |||||||||||||
Gypsum |
|||||||||||||||||
Net sales |
$ | — | $ | — | $ | — | $ | 18.7 | |||||||||
Income before income taxes |
— | — | — | 1.8 | |||||||||||||
Income tax expense |
— | — | — | (0.7 | ) | ||||||||||||
Net income |
— | — | — | 1.1 | |||||||||||||
Total |
|||||||||||||||||
Net sales |
$ | — | $ | 5.5 | $ | 2.9 | $ | 29.8 | |||||||||
Income before income taxes |
— | 0.8 | 0.3 | 3.4 | |||||||||||||
Income tax expense |
— | (0.3 | ) | (0.1 | ) | (1.2 | ) | ||||||||||
Net income |
— | 0.5 | 0.2 | 2.2 | |||||||||||||
Gain on disposal, net of income taxes |
— | 1.1 | 1.6 | 52.9 | |||||||||||||
Income from discontinued operations |
$ | — | $ | 1.6 | $ | 1.8 | $ | 55.1 | |||||||||
9
JAMES HARDIE INDUSTRIES N.V. AND SUBSIDIARIES
NOTES TO CONSOLIDATED FINANCIAL STATEMENTS (Continued)
(Unaudited)
5. Operating Segment Information and Concentrations of Risk
The Company has reported its operating segment information in the format that the operating segment information is available to and evaluated by the Board of Directors. USA Fibre Cement manufactures and sells fibre cement flat sheet products in the United States. Asia Pacific Fibre Cement manufactures and sells fibre cement products in Australia, New Zealand and the Philippines. Research and Development is the research and development centres in Sydney, Australia and Fontana, United States. Other Fibre Cement includes the manufacture and sale of fibre cement products in Chile, the manufacture and sale of fibre reinforced cement pipes in the United States, roofing operations in the United States and fibre cement operations in Europe. The Company’s reportable operating segments are strategic operating units that are managed separately due to their different products and/or geographical location.
Operating Segments
The following are the Company’s operating segments and geographical information:
| Net Sales to Customers | Net Sales to Customers | ||||||||||||||||
| Three Months | Six Months | ||||||||||||||||
| Ended 30 September | Ended 30 September | ||||||||||||||||
| (Millions of US dollars) | 2003 | 2002 | 2003 | 2002 | |||||||||||||
USA Fibre Cement |
$ | 191.4 | $ | 154.7 | $ | 378.2 | $ | 307.2 | |||||||||
Asia Pacific Fibre Cement |
54.8 | 44.9 | 104.9 | 85.6 | |||||||||||||
Other Fibre Cement |
5.4 | 2.5 | 10.0 | 3.9 | |||||||||||||
Worldwide total from continuing operations |
$ | 251.6 | $ | 202.1 | $ | 493.1 | $ | 396.7 | |||||||||
| Income (Loss) from | Income (Loss) from | ||||||||||||||||
| Continuing Operations | Continuing Operations | ||||||||||||||||
| Before Income Taxes | Before Income Taxes | ||||||||||||||||
| Three Months | Six Months | ||||||||||||||||
| Ended 30 September | Ended 30 September | ||||||||||||||||
| (Millions of US dollars) | 2003 | 2002 | 2003 | 2002 | |||||||||||||
USA Fibre Cement |
$ | 53.7 | $ | 40.7 | $ | 107.8 | $ | 79.5 | |||||||||
Asia Pacific Fibre Cement |
9.4 | 8.1 | 18.0 | 15.6 | |||||||||||||
Research and Development |
(4.1 | ) | (2.9 | ) | (7.4 | ) | (5.4 | ) | |||||||||
Other Fibre Cement |
(4.3 | ) | (2.4 | ) | (8.0 | ) | (5.1 | ) | |||||||||
Segments total |
54.7 | 43.5 | 110.4 | 84.6 | |||||||||||||
General Corporate |
(6.8 | ) | (7.9 | ) | (14.2 | ) | (13.9 | ) | |||||||||
Total operating income |
47.9 | 35.6 | 96.2 | 70.7 | |||||||||||||
Net interest expense |
(2.4 | ) | (2.5 | ) | (4.7 | ) | (5.4 | ) | |||||||||
Other (expense) income |
(3.3 | ) | (0.2 | ) | (3.3 | ) | 0.1 | ||||||||||
Worldwide total from continuing operations |
$ | 42.2 | $ | 32.9 | $ | 88.2 | $ | 65.4 | |||||||||
| Total Identifiable Assets | |||||||||
| 30 September | 31 March | ||||||||
| (Millions of US dollars) | 2003 | 2003 | |||||||
USA Fibre Cement |
$ | 509.1 | $ | 492.2 | |||||
Asia Pacific Fibre Cement |
175.7 | 147.9 | |||||||
Other Fibre Cement |
72.1 | 48.2 | |||||||
Segments total |
756.9 | 688.3 | |||||||
General Corporate |
136.9 | 132.6 | |||||||
Discontinued operations |
— | 6.7 | |||||||
Worldwide total |
$ | 893.8 | $ | 827.6 | |||||
10
JAMES HARDIE INDUSTRIES N.V. AND SUBSIDIARIES
NOTES TO CONSOLIDATED FINANCIAL STATEMENTS (Continued)
(Unaudited)
Geographic Areas
| Net Sales to Customers | Net Sales to Customers | ||||||||||||||||
| Three Months | Six Months | ||||||||||||||||
| Ended 30 September | Ended 30 September | ||||||||||||||||
| (Millions of US dollars) | 2003 | 2002 | 2003 | 2002 | |||||||||||||
United States |
$ | 194.0 | $ | 156.2 | $ | 383.0 | $ | 309.4 | |||||||||
Australia |
38.2 | 32.8 | 72.9 | 61.5 | |||||||||||||
New Zealand |
9.6 | 7.9 | 18.8 | 15.2 | |||||||||||||
Other Countries |
9.8 | 5.2 | 18.4 | 10.6 | |||||||||||||
Worldwide total from continuing operations |
$ | 251.6 | $ | 202.1 | $ | 493.1 | $ | 396.7 | |||||||||
| Total Identifiable Assets | |||||||||
| 30 September | 31 March | ||||||||
| (Millions of US dollars) | 2003 | 2003 | |||||||
United States |
$ | 563.2 | $ | 528.3 | |||||
Australia |
112.6 | 87.7 | |||||||
New Zealand |
24.8 | 20.6 | |||||||
Other Countries |
56.3 | 51.7 | |||||||
Segments total |
756.9 | 688.3 | |||||||
General Corporate |
136.9 | 132.6 | |||||||
Discontinued operations |
— | 6.7 | |||||||
Worldwide total |
$ | 893.8 | $ | 827.6 | |||||
6. Accumulated Other Comprehensive Income (Loss)
The following are the components of total accumulated other comprehensive income (loss), net of related tax, which is displayed in the accompanying consolidated balance sheets:
| 30 September | 31 March | ||||||||
| (Millions of US dollars) | 2003 | 2003 | |||||||
Net unrealised gain on available-for-sale securities |
$ | 0.1 | $ | 0.1 | |||||
Unrealised transition loss on derivative instruments classified as
cash flow hedges |
(4.9 | ) | (4.9 | ) | |||||
Accumulated amortisation of unrealised transition loss on
derivative instruments |
2.8 | 2.2 | |||||||
Minimum pension liability adjustment |
(7.7 | ) | (7.7 | ) | |||||
Accumulated foreign currency losses on translation of foreign subsidiaries |
(25.7 | ) | (36.0 | ) | |||||
Total accumulated other comprehensive loss |
$ | (35.4 | ) | $ | (46.3 | ) | |||
7. Commitments and Contingencies
Environmental
The operations of the Company, like those of other companies engaged in similar businesses, are subject to various federal, state and local laws and regulations on air and water quality, waste handling and disposal. The Company’s policy is to accrue for environmental costs when it is determined that it is probable that an obligation exists and the amount can be reasonably estimated. In the opinion of management, based on information presently known, the ultimate liability for such matters should not have a material adverse effect on either the Company’s consolidated financial position, results of operations or cash flows.
Legal
The Company is involved from time to time in various legal proceedings and administrative actions incident to the normal conduct of its business. Although it is impossible to predict the outcome of any pending legal proceeding, management believes that such proceedings and actions should not, individually or in the aggregate, have a material adverse effect on either its consolidated financial position, results of operations or cash flows.
11
JAMES HARDIE INDUSTRIES N.V. AND SUBSIDIARIES
NOTES TO CONSOLIDATED FINANCIAL STATEMENTS (Continued)
(Unaudited)
Claims Against Former Subsidiaries
With the establishment and funding of the Medical Research and Compensation Foundation (the “Foundation”) in February 2001, the Company no longer owned or controlled two Australian companies which manufactured and marketed asbestos-related products prior to 1987. Those companies were former subsidiaries of ABN 60 Pty Limited (“ABN 60”, formerly known as JHIL). On 31 March 2003, James Hardie transferred control of ABN 60 to a newly established company named ABN 60 Foundation Pty Ltd (“ABN 60 Foundation”).
In prior years and up to the date of the establishment of the Foundation, these two former subsidiaries incurred costs of asbestos-related litigation and settlements. From time to time, ABN 60 was joined as a party to asbestos suits which were primarily directed at the two former subsidiaries which are now controlled by the Foundation. As all three former subsidiaries of the Company are no longer a part of James Hardie, and all relevant claims against ABN 60 had been successfully defended, no provision for asbestos-related claims was established in the Company’s accounts at 30 September 2003 or 31 March 2003.
While it is difficult to predict the incidence or outcome of future litigation, the Company believes it is remote that any significant personal injury suits for damages in connection with the former manufacture or sale of asbestos containing products that are or may be filed against ABN 60 or its former subsidiaries would have a material adverse effect on the business, results of operations or financial condition of the Company. This belief is based in part on the separateness of corporate entities under Australian law, the limited circumstances where “piercing the corporate veil” might occur under Australian law, and there being no equivalent under Australian law of the U.S. legal doctrine of “successor liability”. The courts in Australia have confirmed the primacy of separate corporate entities and have generally refused to hold parent entities responsible for the liabilities of their subsidiaries absent any finding of fraud, agency, direct operational responsibility or the like.
On 29 October 2003, the Foundation issued a media release announcing that it has experienced increases in the number of asbestos-related claims during the past few years. The Foundation said that new projections for Australia, involving many defendant companies including Australian government entities, were similar to the experience of the Foundation. Based upon new actuarial estimates, the Foundation stated that existing funding could be exhausted within five years. The release stated that the Foundation was investigating a range of legal options involving James Hardie or related entities. The Company does not believe that there are any valid legal claims that may be presented against the Company for potential asbestos-related liabilities of the former subsidiaries, the Foundation or the ABN 60 Foundation and any such claims would be defended vigorously.
The Company has not incurred any asbestos litigation and settlement payments during the six months ended 30 September 2003, nor does it expect to incur any material costs in the future related to asbestos litigation.
12
Item 2. Quantitative and Qualitative Disclosures About Market Risk
In this report, James Hardie Industries N.V. and its subsidiaries are collectively referred to as “we,” “us,” or “our,” the term “NZ$” refers to New Zealand dollars and the term “PHP” refers to Philippine pesos.
We have operations in foreign countries and, as a result, are exposed to foreign currency exchange rate risk inherent in purchases, sales, assets and liabilities denominated in currencies other than the U.S. dollar. We also are exposed to interest rate risk associated with our long-term debt and to changes in prices of commodities we use in production.
Our policy is to enter into derivative instruments solely to mitigate risks in our business and not for trading or speculative purposes.
Foreign Currency Exchange Rate Risk
We have significant operations outside of the United States and, as a result, are exposed to changes in exchange rates which affect our financial position, results of operations and cash flows. For the six months ended 30 September 2003, the following currencies comprised the following percentages of our net sales, cost of goods sold, expenses and liabilities:
| US$ | A$ | NZ$ | Other (1) | |||||||||||||
Net sales |
77.7 | % | 14.8 | % | 3.8 | % | 3.7 | % | ||||||||
Cost of goods sold |
78.5 | % | 14.0 | % | 3.4 | % | 4.1 | % | ||||||||
Expenses |
69.2 | % | 20.3 | % | 4.4 | % | 6.1 | % | ||||||||
Liabilities (excluding borrowings) |
82.8 | % | 10.3 | % | 3.2 | % | 3.7 | % | ||||||||
| (1) | Comprised of Philippine Pesos, Euros and Chilean Pesos. |
We purchase raw materials and fixed assets and sell some finished product for amounts denominated in currencies other than the functional currency of the business in which the related transaction is generated. In order to protect against foreign exchange rate movements, we may enter into forward exchange contracts timed to mature when settlement of the underlying transaction is due to occur. At 30 September 2003, there were no material contracts outstanding.
Interest Rate Risk
We have market risk from changes in interest rates, primarily related to our borrowings. At 30 September 2003 and 30 June 2003, 95% of our borrowings were fixed-rate and 5% variable-rate. The large percentage of fixed-rate debt reduces the earnings volatility that would result from changes in interest rates. From time to time, we may enter into interest rate swap contracts in an effort to mitigate interest rate risk. During the six months ended 30 September 2003, no interest rate swap contracts were entered into and no contracts were outstanding.
The following table presents our long-term borrowings at 30 September 2003, the expected maturity date of future principal repayments and related weighted average interest rates. The fair value of our outstanding debt is what we likely would have to pay over the term of the loan if we were to enter into debt on substantially the same terms today. At 30 September 2003, all of our outstanding fixed-rate borrowings were denominated in U.S. dollars.
13
Future Principal Repayments by Expected Maturity Date
(in millions of US dollars, except percentages)
| For the Years Ended 31 March | ||||||||||||||||||||||||||||||||
| Fair | ||||||||||||||||||||||||||||||||
| 2004 | 2005 | 2006 | 2007 | 2008 | Thereafter | Total | Value | |||||||||||||||||||||||||
Fixed rate debt |
— | $ | 17.6 | $ | 25.7 | $ | 27.1 | $ | 8.1 | $ | 86.5 | $ | 165.0 | $ | 196.3 | |||||||||||||||||
Weighted-average
interest rate |
— | 6.86 | % | 6.92 | % | 6.99 | % | 7.05 | % | 7.23 | % | 7.09 | % | |||||||||||||||||||
Variable rate debt |
— | — | — | — | — | — | — | — | ||||||||||||||||||||||||
Weighted-average
interest rate |
— | — | — | — | — | — | — | |||||||||||||||||||||||||
Commodity Price Risk
Pulp is a raw material we use to produce fibre cement, and it has historically demonstrated more price sensitivity than other raw materials we use in our manufacturing process. Although we have entered into contracts to hedge pulp prices in the past, we do not anticipate entering into such transactions in the near future.
14
Notes
1. This Financial Report forms part of a package of information about the company’s results. It should be read in conjunction with the other parts of this package, including a Media Release, a Management Presentation, a Management’s Discussion and Analysis and a Results at a Glance document.
Disclaimer
This report contains forward-looking statements. Words such as “believe,’’ “anticipate,’’ “plan,’’ “expect,’’ “intend,’’ “target,’’ “estimate,’’ “project,’’ “predict,’’ “forecast,’’ “guideline,’’ “should,’’ “aim’’ and similar expressions are intended to identify forward-looking statements but are not the exclusive means of identifying such statements. Forward-looking statements involve inherent risks and uncertainties. We caution you that a number of important factors could cause actual results to differ materially from the plans, objectives, expectations, estimates and intentions expressed in such forward-looking statements. These factors, which are further discussed in our reports submitted to the Securities and Exchange Commission on Forms 20-F and 6-K and in our other filings, include but are not limited to: competition and product pricing in the markets in which we operate; general economic and market conditions; compliance with, and possible changes in, environmental and health and safety laws; dependence on cyclical construction markets; the supply and cost of raw materials; our reliance on a small number of product distributors; the consequences of product failures or defects; exposure to environmental or other legal proceedings; and risks of conducting business internationally. We caution you that the foregoing list of factors is not exclusive and that other risks and uncertainties may cause actual results to differ materially from those contained in forward-looking statements. Forward-looking statements speak only as of the date they are made.
15
| FY04 2nd Quarter and Half Year Results 13 November 2003 Unless otherwise stated, results are for continuing operations only and comparisons are of the 2nd quarter of the current fiscal year versus the 2nd quarter of the prior fiscal year. |
| Overview - Peter Macdonald, CEO Financial Review - Phillip Morley, CFO Operating Review - Peter Macdonald, CEO Questions and Answers Agenda |
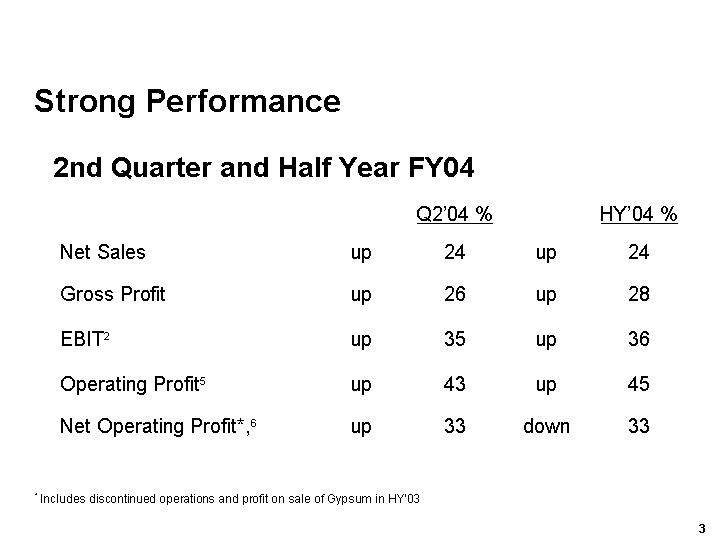
| * Includes discontinued operations and profit on sale of Gypsum in HY'03 Strong Performance 2nd Quarter and Half Year FY04 Q2'04 % HY'04 % Net Sales up 24 up 24 Gross Profit up 26 up 28 EBIT2 up 35 up 36 Operating Profit5 up 43 up 45 Net Operating Profit*,6 up 33 down 33 |
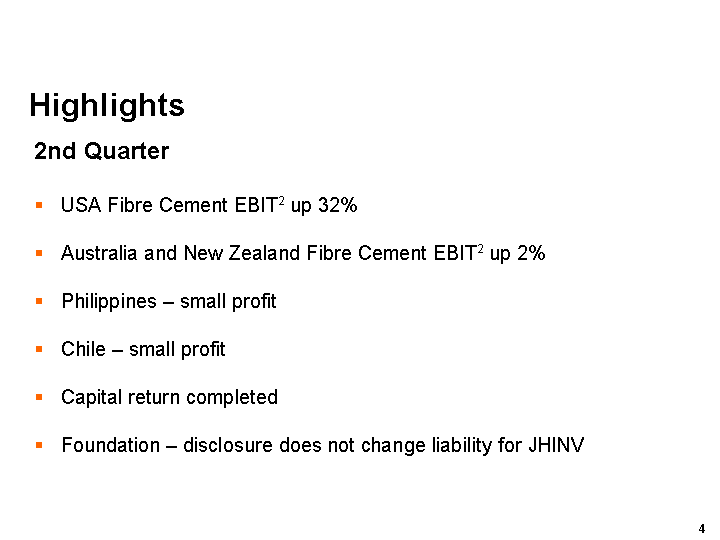
| Highlights 2nd Quarter USA Fibre Cement EBIT2 up 32% Australia and New Zealand Fibre Cement EBIT2 up 2% Philippines - small profit Chile - small profit Capital return completed Foundation - disclosure does not change liability for JHINV |

| Financial Review Phillip Morley, CFO |
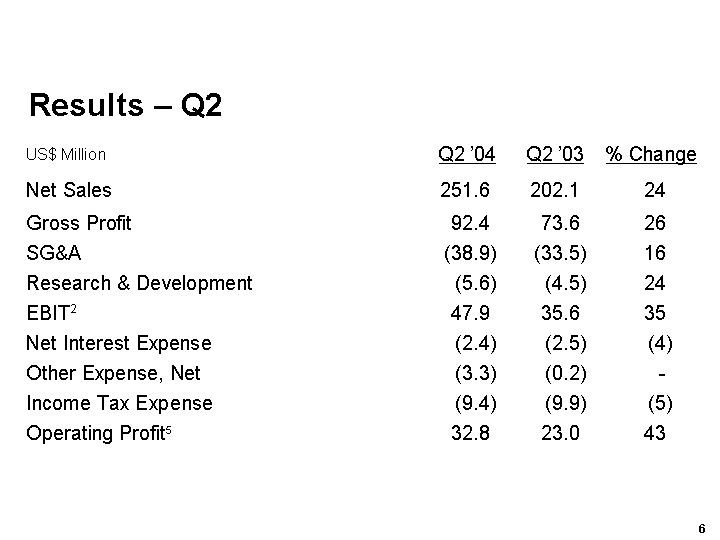
| US$ Million Q2 '04 Q2 '03 % Change Net Sales 251.6 202.1 24 Gross Profit 92.4 73.6 26 SG&A (38.9) (33.5) 16 Research & Development (5.6) (4.5) 24 EBIT2 47.9 35.6 35 Net Interest Expense (2.4) (2.5) (4) Other Expense, Net (3.3) (0.2) - Income Tax Expense (9.4) (9.9) (5) Operating Profit5 32.8 23.0 43 Results - Q2 |
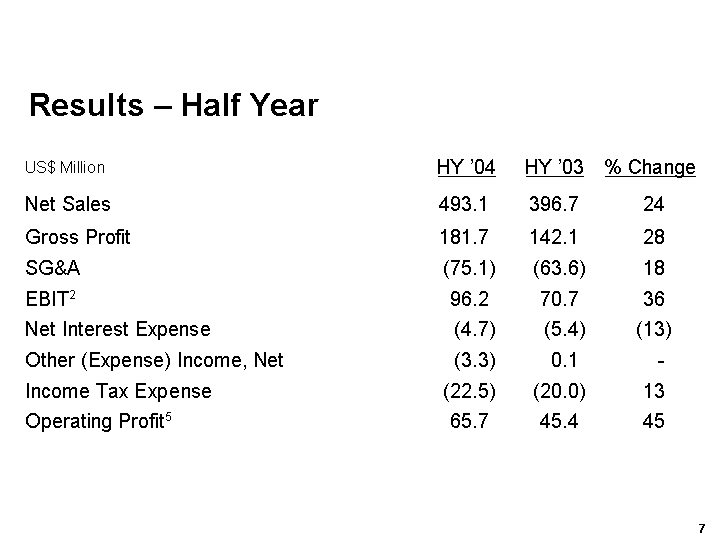
| Results - Half Year US$ Million HY '04 HY '03 % Change Net Sales 493.1 396.7 24 Gross Profit 181.7 142.1 28 SG&A (75.1) (63.6) 18 EBIT2 96.2 70.7 36 Net Interest Expense (4.7) (5.4) (13) Other (Expense) Income, Net (3.3) 0.1 - Income Tax Expense (22.5) (20.0) 13 Operating Profit5 65.7 45.4 45 |
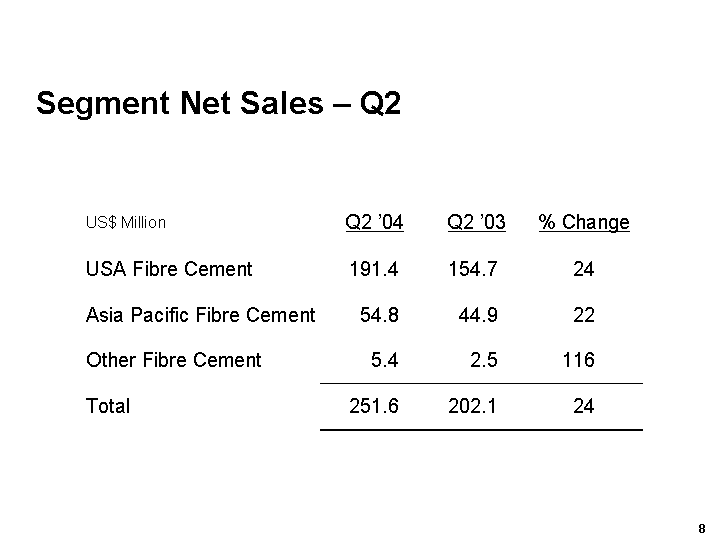
| Segment Net Sales - Q2 US$ Million Q2 '04 Q2 '03 % Change USA Fibre Cement 191.4 154.7 24 Asia Pacific Fibre Cement 54.8 44.9 22 Other Fibre Cement 5.4 2.5 116 Total 251.6 202.1 24 |
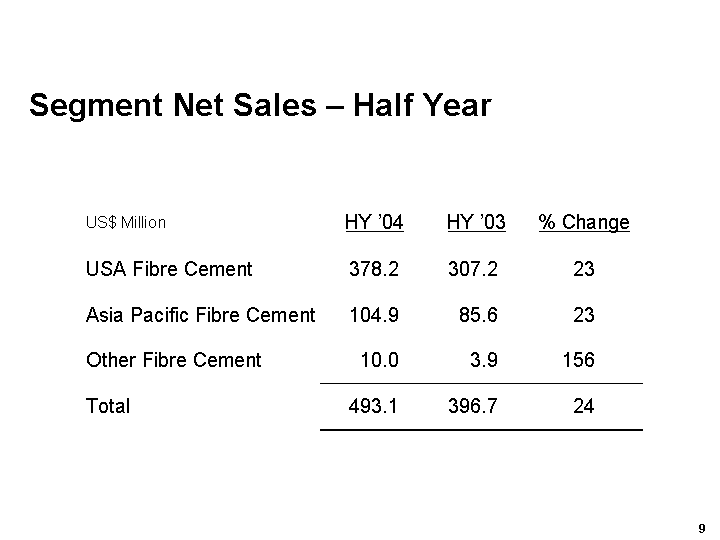
| Segment Net Sales - Half Year US$ Million HY '04 HY '03 % Change USA Fibre Cement 378.2 307.2 23 Asia Pacific Fibre Cement 104.9 85.6 23 Other Fibre Cement 10.0 3.9 156 Total 493.1 396.7 24 |
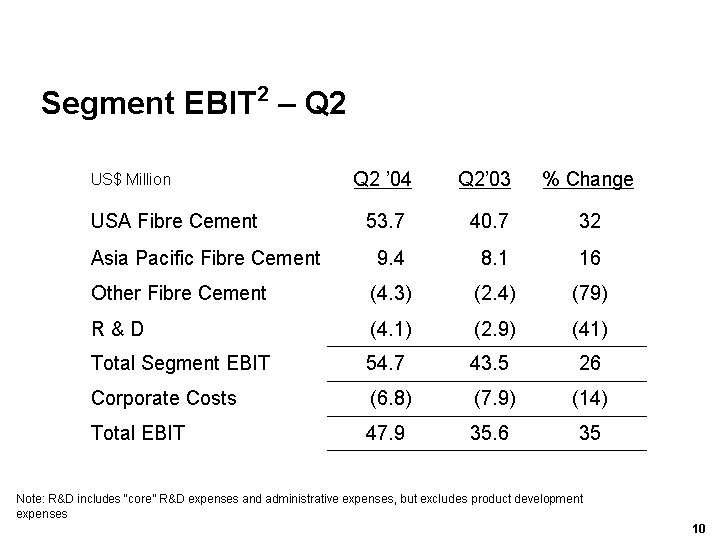
| Segment EBIT2 - Q2 US$ Million Q2 '04 Q2'03 % Change USA Fibre Cement 53.7 40.7 32 Asia Pacific Fibre Cement 9.4 8.1 16 Other Fibre Cement (4.3) (2.4) (79) R & D (4.1) (2.9) (41) Total Segment EBIT 54.7 43.5 26 Corporate Costs (6.8) (7.9) (14) Total EBIT 47.9 35.6 35 Note: R&D includes "core" R&D expenses and administrative expenses, but excludes product development expenses |
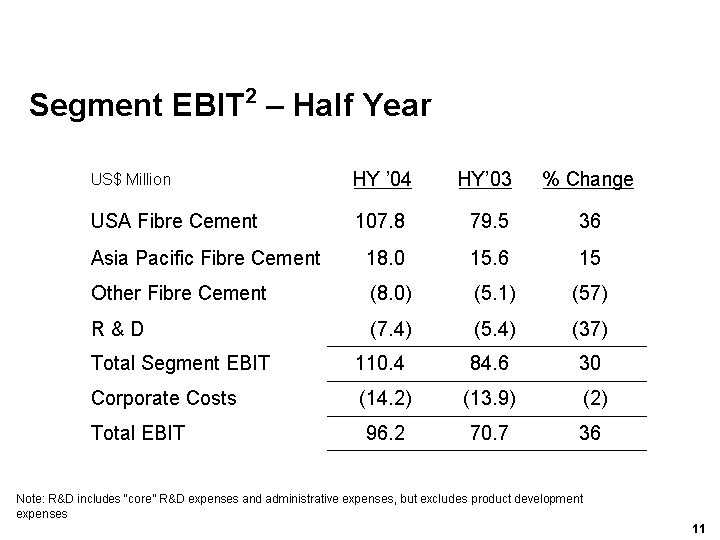
| Segment EBIT2 - Half Year US$ Million HY '04 HY'03 % Change USA Fibre Cement 107.8 79.5 36 Asia Pacific Fibre Cement 18.0 15.6 15 Other Fibre Cement (8.0) (5.1) (57) R & D (7.4) (5.4) (37) Total Segment EBIT 110.4 84.6 30 Corporate Costs (14.2) (13.9) (2) Total EBIT 96.2 70.7 36 Note: R&D includes "core" R&D expenses and administrative expenses, but excludes product development expenses |

| Corporate Costs US$ Million Q2'04 Q2'03 HY'04 HY'03 Economic Profit Compensation Expense 0.6 2.0 1.3 2.8 Fixed Stock Option Expense 0.6 0.1 1.1 0.3 Employee Share Plan and Other Variables 0.4 0.3 2.1 1.6 Corporate Costs 5.2 5.5 9.7 9.2 Total 6.8 7.9 14.2 13.9 |
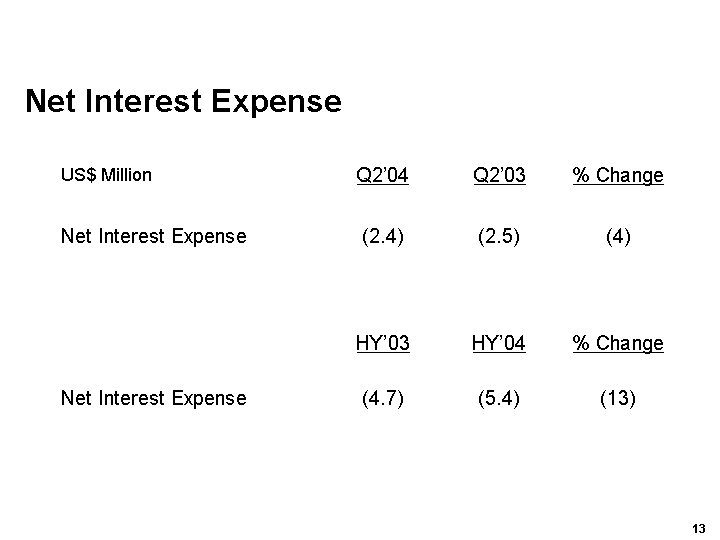
| Net Interest Expense US$ Million Q2'04 Q2'03 % Change Net Interest Expense (2.4) (2.5) (4) HY'03 HY'04 % Change Net Interest Expense (4.7) (5.4) (13) |
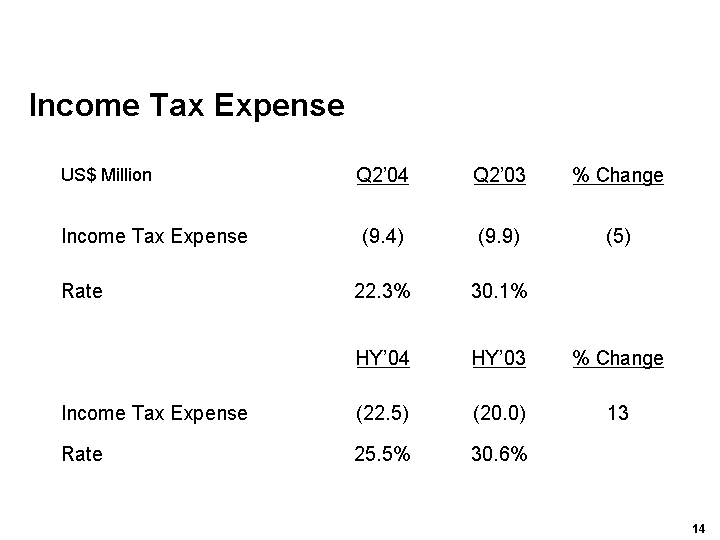
| Income Tax Expense US$ Million Q2'04 Q2'03 % Change Income Tax Expense (9.4) (9.9) (5) Rate 22.3% 30.1% HY'04 HY'03 % Change Income Tax Expense (22.5) (20.0) 13 Rate 25.5% 30.6% |
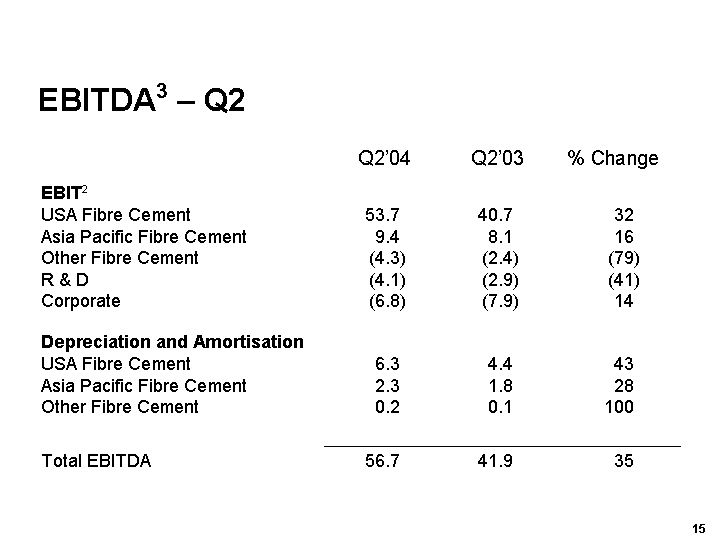
| EBITDA3 - Q2 Q2'04 Q2'03 % Change EBIT2 USA Fibre Cement Asia Pacific Fibre Cement Other Fibre Cement R & D Corporate 53.7 9.4 (4.3) (4.1) (6.8) 40.7 8.1 (2.4) (2.9) (7.9) 32 16 (79) (41) 14 Depreciation and Amortisation USA Fibre Cement Asia Pacific Fibre Cement Other Fibre Cement 6.3 2.3 0.2 4.4 1.8 0.1 43 28 100 Total EBITDA 56.7 41.9 35 |
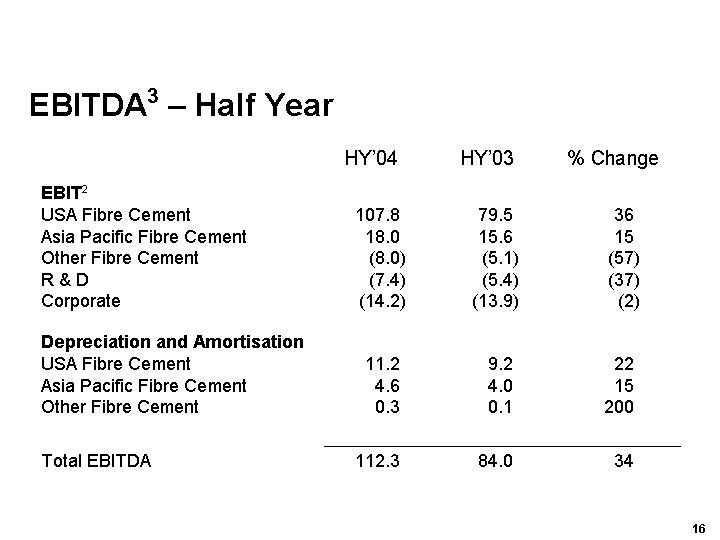
| EBITDA3 - Half Year HY'04 HY'03 % Change EBIT2 USA Fibre Cement Asia Pacific Fibre Cement Other Fibre Cement R & D Corporate 107.8 18.0 (8.0) (7.4) (14.2) 79.5 15.6 (5.1) (5.4) (13.9) 36 15 (57) (37) (2) Depreciation and Amortisation USA Fibre Cement Asia Pacific Fibre Cement Other Fibre Cement 11.2 4.6 0.3 9.2 4.0 0.1 22 15 200 Total EBITDA 112.3 84.0 34 |
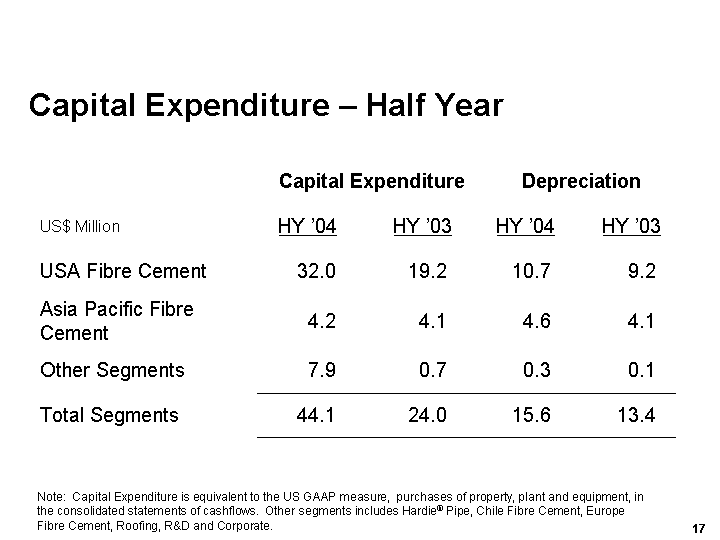
| Capital Expenditure - Half Year Capital Expenditure Capital Expenditure Depreciation Depreciation US$ Million HY '04 HY '03 HY '04 HY '03 USA Fibre Cement 32.0 19.2 10.7 9.2 Asia Pacific Fibre Cement 4.2 4.1 4.6 4.1 Other Segments 7.9 0.7 0.3 0.1 Total Segments 44.1 24.0 15.6 13.4 Note: Capital Expenditure is equivalent to the US GAAP measure, purchases of property, plant and equipment, in the consolidated statements of cashflows. Other segments includes Hardie(r) Pipe, Chile Fibre Cement, Europe Fibre Cement, Roofing, R&D and Corporate. |

| Key Ratios HY '04 FY '03 FY '02 FY '01 EPS (Basic) 14.5c 18.7c 6.4c 7.3c Return on Shareholders Funds* 28.3% 42.3% 8.9% 14.7% Return on Capital Employed* 28.7% 21.2% 8.6% 8.6% EBIT2/Sales 19.5% 16.4% 8.0% 7.6% Gearing 13.0% 21.4% 44.7% 56.1% Net Interest Cover 20.5x 6.6x 3.0x 3.1x *Annualised |

| Operating Review Peter Macdonald, CEO |
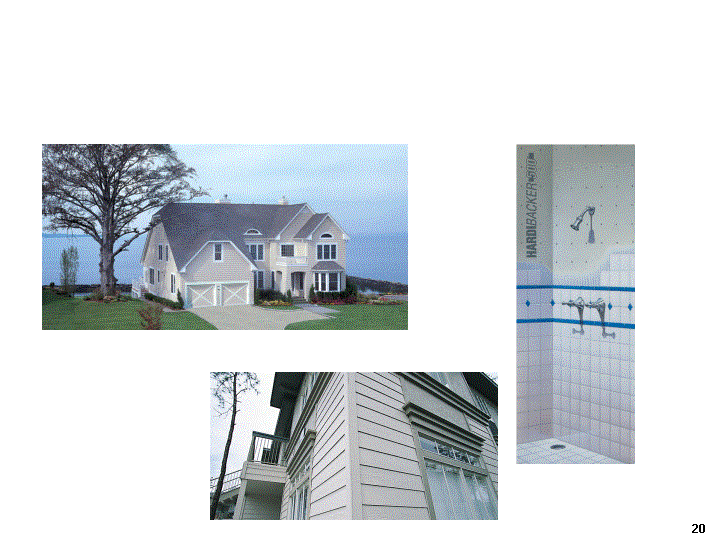
| USA Fibre Cement |
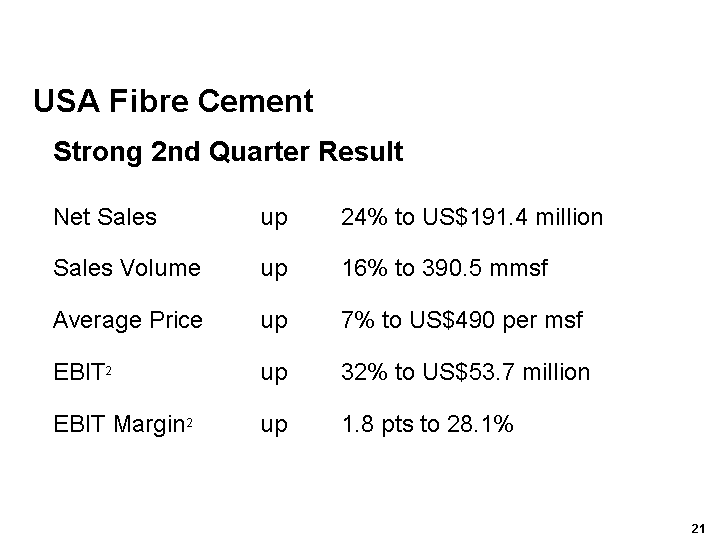
| Strong 2nd Quarter Result Net Sales up 24% to US$191.4 million Sales Volume up 16% to 390.5 mmsf Average Price up 7% to US$490 per msf EBIT2 up 32% to US$53.7 million EBIT Margin2 up 1.8 pts to 28.1% USA Fibre Cement |
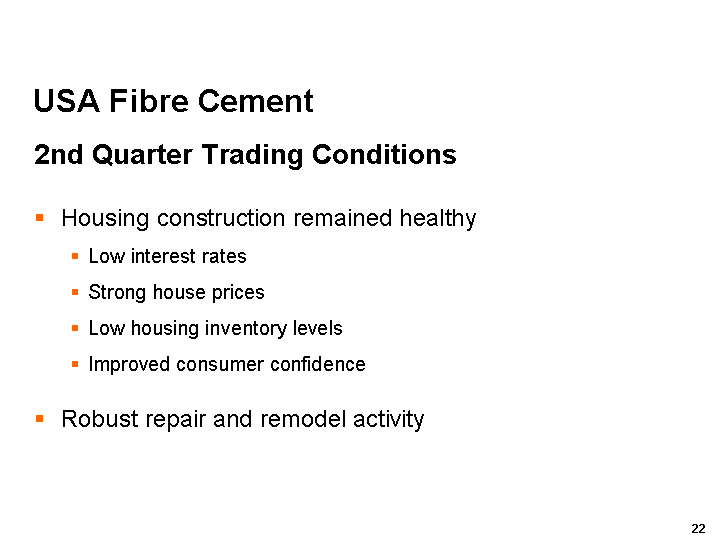
| USA Fibre Cement 2nd Quarter Trading Conditions Housing construction remained healthy Low interest rates Strong house prices Low housing inventory levels Improved consumer confidence Robust repair and remodel activity |
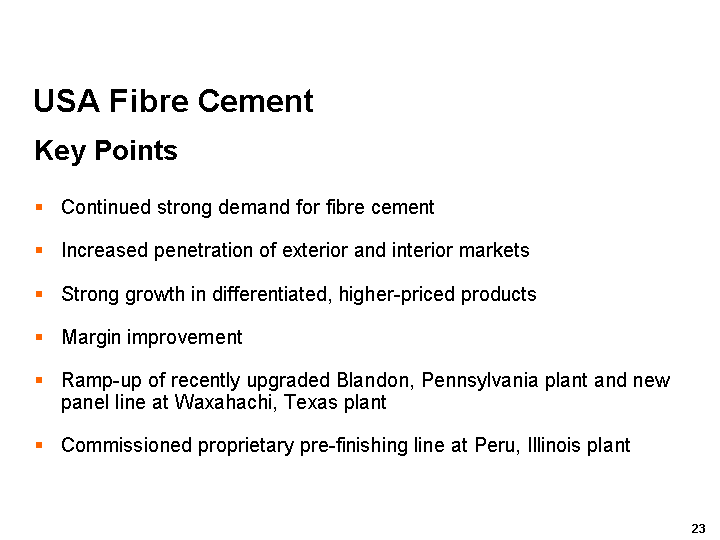
| USA Fibre Cement Key Points Continued strong demand for fibre cement Increased penetration of exterior and interior markets Strong growth in differentiated, higher-priced products Margin improvement Ramp-up of recently upgraded Blandon, Pennsylvania plant and new panel line at Waxahachi, Texas plant Commissioned proprietary pre-finishing line at Peru, Illinois plant |
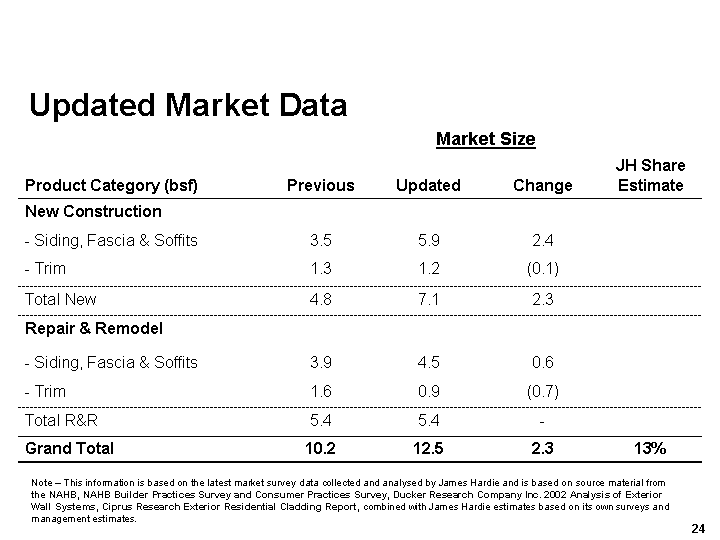
| Updated Market Data Market Size Market Size Market Size Market Size Product Category (bsf) Previous Updated Change JH Share Estimate New Construction - Siding, Fascia & Soffits 3.5 5.9 2.4 - Trim 1.3 1.2 (0.1) Total New 4.8 7.1 2.3 Repair & Remodel - Siding, Fascia & Soffits 3.9 4.5 0.6 - Trim 1.6 0.9 (0.7) Total R&R 5.4 5.4 - Grand Total 10.2 12.5 2.3 13% Note - This information is based on the latest market survey data collected and analysed by James Hardie and is based on source material from the NAHB, NAHB Builder Practices Survey and Consumer Practices Survey, Ducker Research Company Inc. 2002 Analysis of Exterior Wall Systems, Ciprus Research Exterior Residential Cladding Report, combined with James Hardie estimates based on its own surveys and management estimates. |
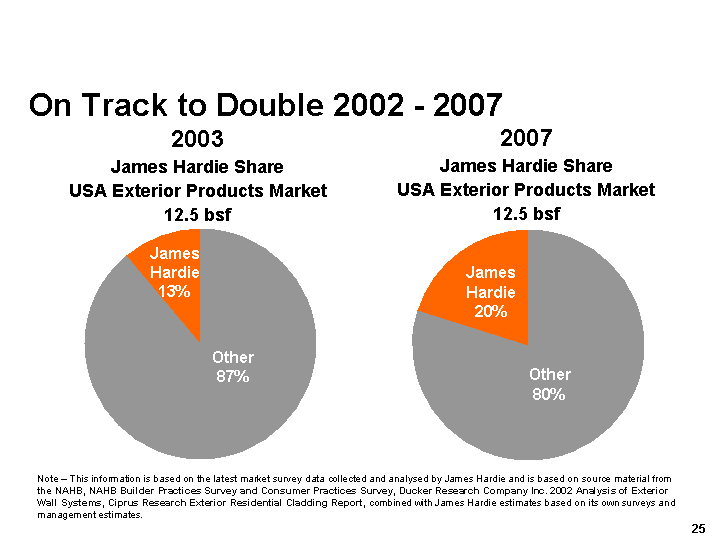
| 2003 James Hardie Share USA Exterior Products Market 12.5 bsf 2007 James Hardie Share USA Exterior Products Market 12.5 bsf James Hardie 13% Other 87% James Hardie 20% Other 80% On Track to Double 2002 - 2007 Note - This information is based on the latest market survey data collected and analysed by James Hardie and is based on source material from the NAHB, NAHB Builder Practices Survey and Consumer Practices Survey, Ducker Research Company Inc. 2002 Analysis of Exterior Wall Systems, Ciprus Research Exterior Residential Cladding Report, combined with James Hardie estimates based on its own surveys and management estimates. |
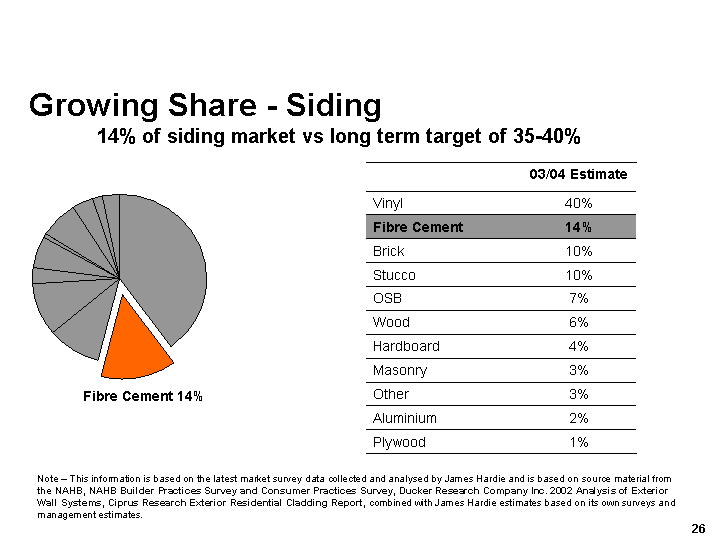
| Growing Share - Siding 14% of siding market vs long term target of 35-40% Note - This information is based on the latest market survey data collected and analysed by James Hardie and is based on source material from the NAHB, NAHB Builder Practices Survey and Consumer Practices Survey, Ducker Research Company Inc. 2002 Analysis of Exterior Wall Systems, Ciprus Research Exterior Residential Cladding Report, combined with James Hardie estimates based on its own surveys and management estimates. Fibre Cement 14% 03/04 Estimate Vinyl 40% Fibre Cement 14% Brick 10% Stucco 10% OSB 7% Wood 6% Hardboard 4% Masonry 3% Other 3% Aluminium 2% Plywood 1% |
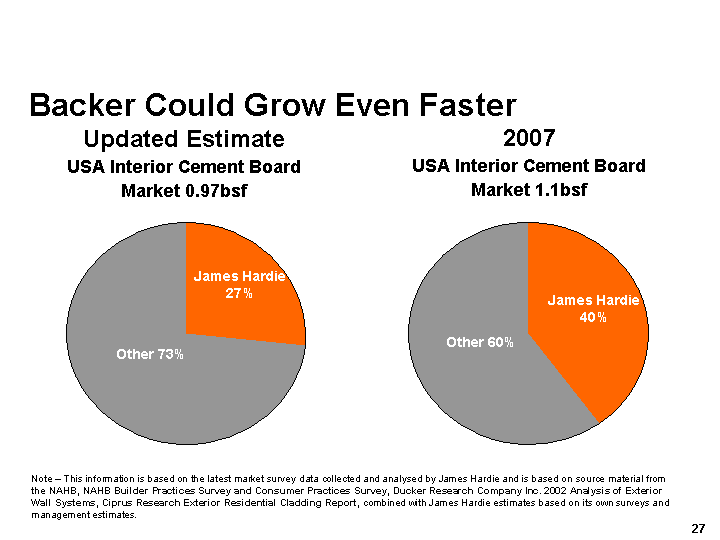
| Backer Could Grow Even Faster Updated Estimate USA Interior Cement Board Market 0.97bsf 2007 USA Interior Cement Board Market 1.1bsf Note - This information is based on the latest market survey data collected and analysed by James Hardie and is based on source material from the NAHB, NAHB Builder Practices Survey and Consumer Practices Survey, Ducker Research Company Inc. 2002 Analysis of Exterior Wall Systems, Ciprus Research Exterior Residential Cladding Report, combined with James Hardie estimates based on its own surveys and management estimates. James Hardie 27% Other 73% James Hardie 40% Other 60% |
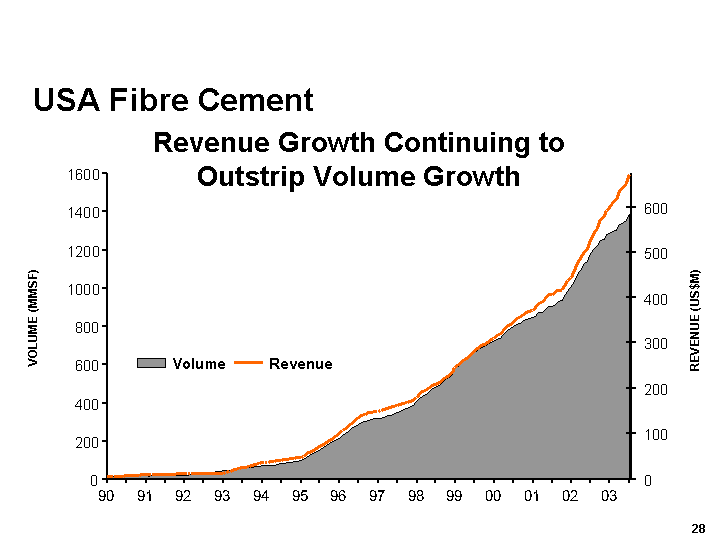
| USA Fibre Cement Revenue Growth Continuing to Outstrip Volume Growth 0 200 400 600 800 1000 1200 1400 1600 90 91 92 93 94 95 96 97 98 99 00 01 02 03 VOLUME (MMSF) 0 100 200 300 400 500 600 REVENUE (US$M) Volume Revenue |
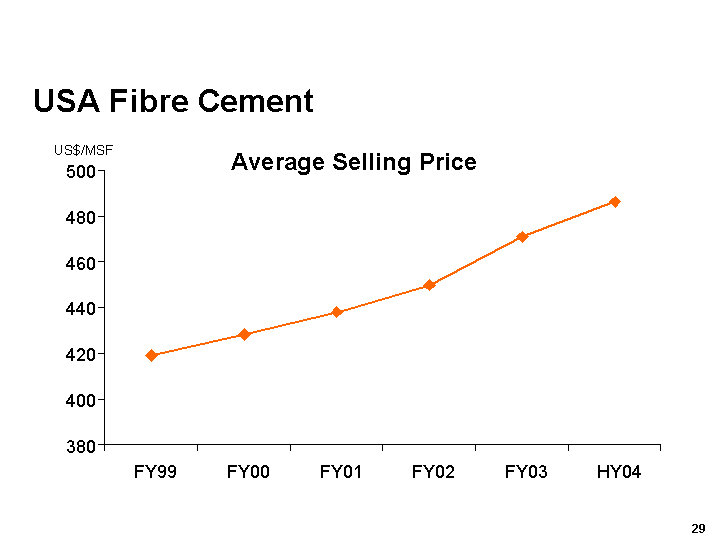
| USA Fibre Cement US$/MSF |
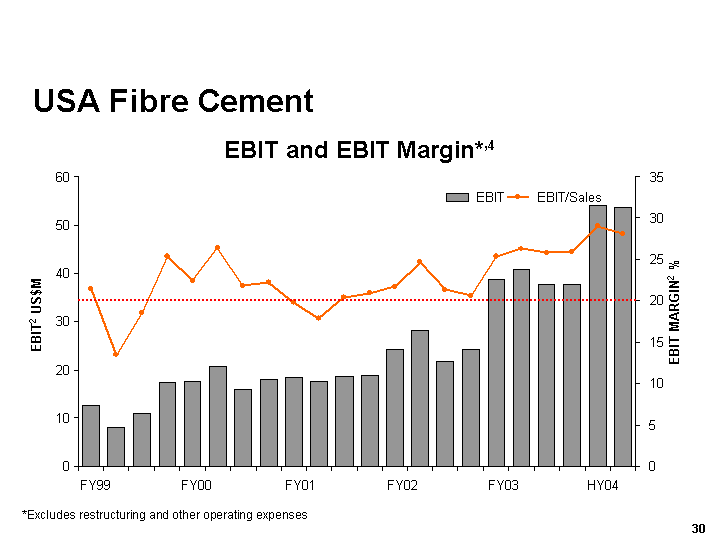
| USA Fibre Cement *Excludes restructuring and other operating expenses EBIT and EBIT Margin*,4 0 10 20 30 40 50 60 FY99 FY00 FY01 FY02 FY03 HY04 EBIT2 US$M 0 5 10 15 20 25 30 35 EBIT MARGIN2 % EBIT EBIT/Sales |
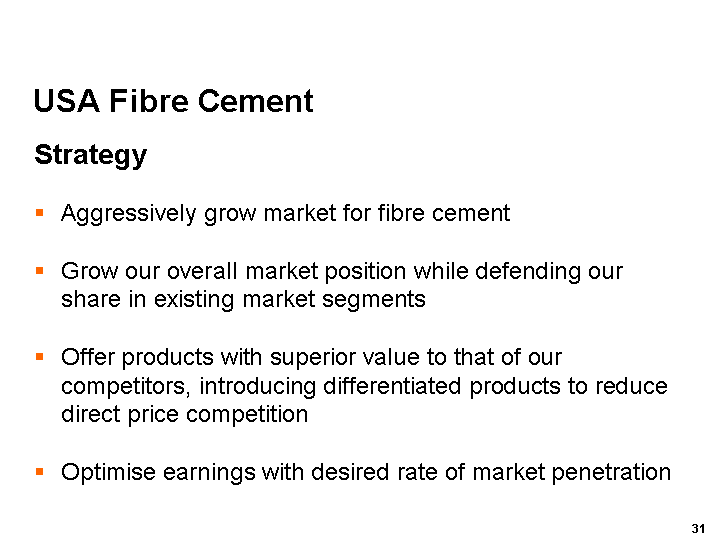
| USA Fibre Cement Strategy Aggressively grow market for fibre cement Grow our overall market position while defending our share in existing market segments Offer products with superior value to that of our competitors, introducing differentiated products to reduce direct price competition Optimise earnings with desired rate of market penetration |
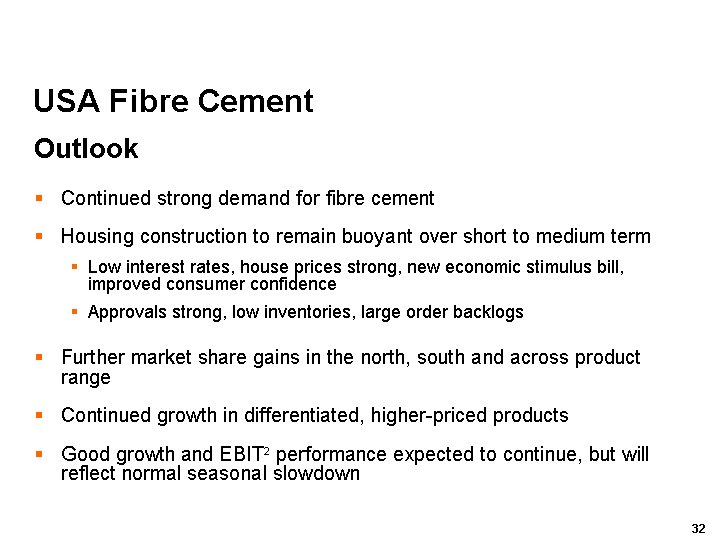
| USA Fibre Cement Outlook Continued strong demand for fibre cement Housing construction to remain buoyant over short to medium term Low interest rates, house prices strong, new economic stimulus bill, improved consumer confidence Approvals strong, low inventories, large order backlogs Further market share gains in the north, south and across product range Continued growth in differentiated, higher-priced products Good growth and EBIT2 performance expected to continue, but will reflect normal seasonal slowdown |
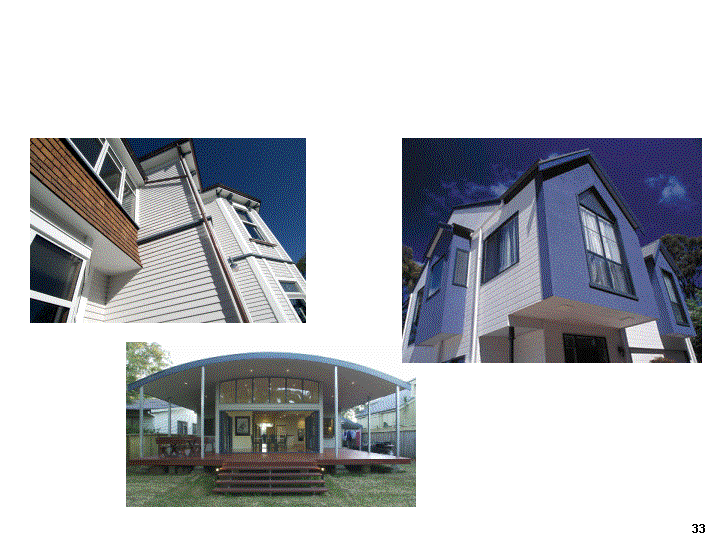
| Asia Pacific Fibre Cement |
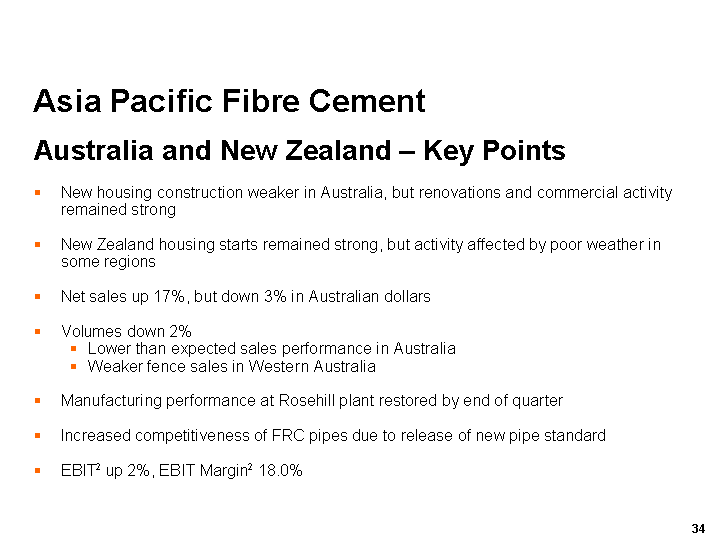
| Asia Pacific Fibre Cement Australia and New Zealand - Key Points New housing construction weaker in Australia, but renovations and commercial activity remained strong New Zealand housing starts remained strong, but activity affected by poor weather in some regions Net sales up 17%, but down 3% in Australian dollars Volumes down 2% Lower than expected sales performance in Australia Weaker fence sales in Western Australia Manufacturing performance at Rosehill plant restored by end of quarter Increased competitiveness of FRC pipes due to release of new pipe standard EBIT2 up 2%, EBIT Margin2 18.0% |
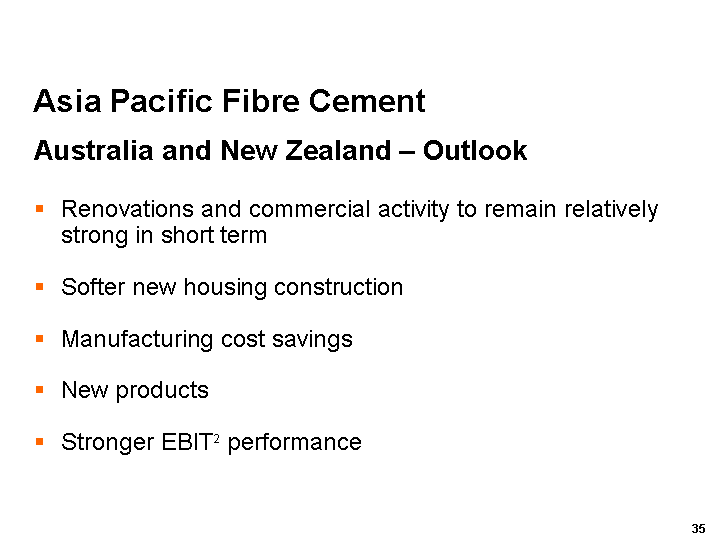
| Asia Pacific Fibre Cement Australia and New Zealand - Outlook Renovations and commercial activity to remain relatively strong in short term Softer new housing construction Manufacturing cost savings New products Stronger EBIT2 performance |
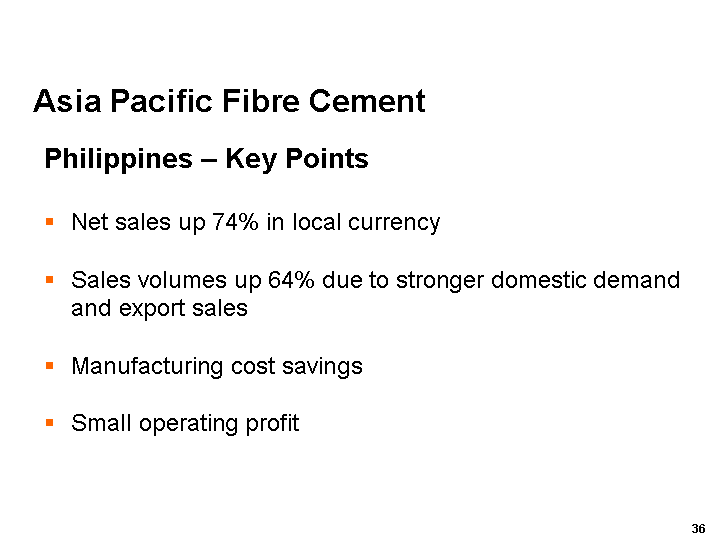
| Asia Pacific Fibre Cement Philippines - Key Points Net sales up 74% in local currency Sales volumes up 64% due to stronger domestic demand and export sales Manufacturing cost savings Small operating profit |
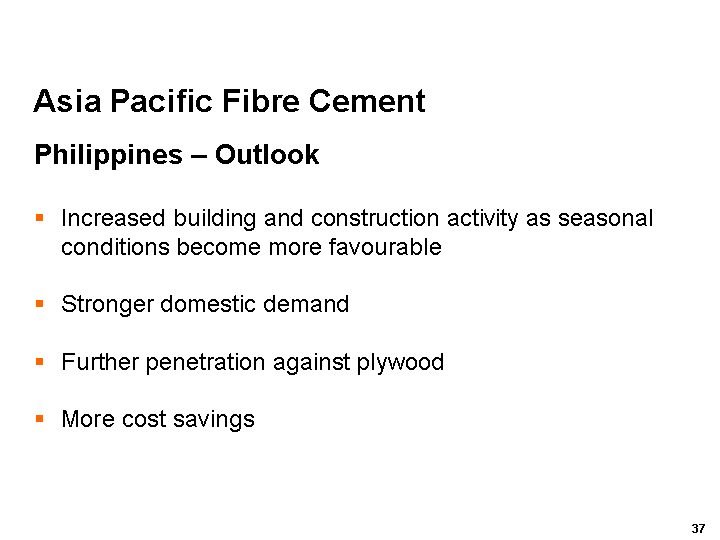
| Asia Pacific Fibre Cement Philippines - Outlook Increased building and construction activity as seasonal conditions become more favourable Stronger domestic demand Further penetration against plywood More cost savings |
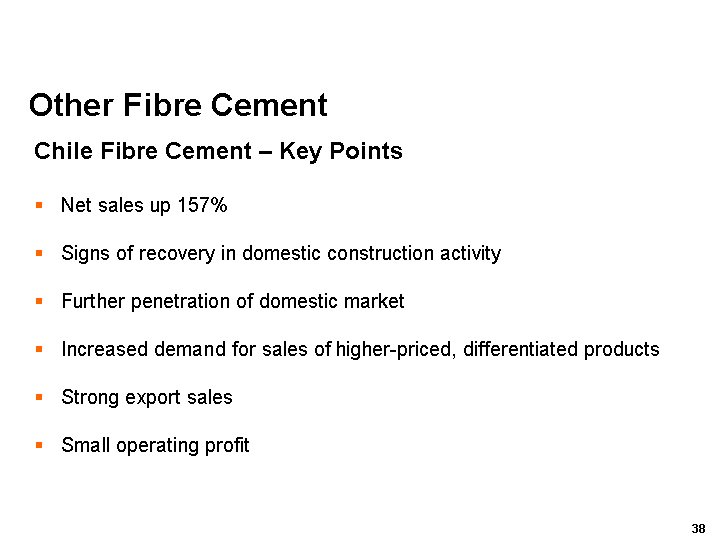
| Other Fibre Cement Chile Fibre Cement - Key Points Net sales up 157% Signs of recovery in domestic construction activity Further penetration of domestic market Increased demand for sales of higher-priced, differentiated products Strong export sales Small operating profit |
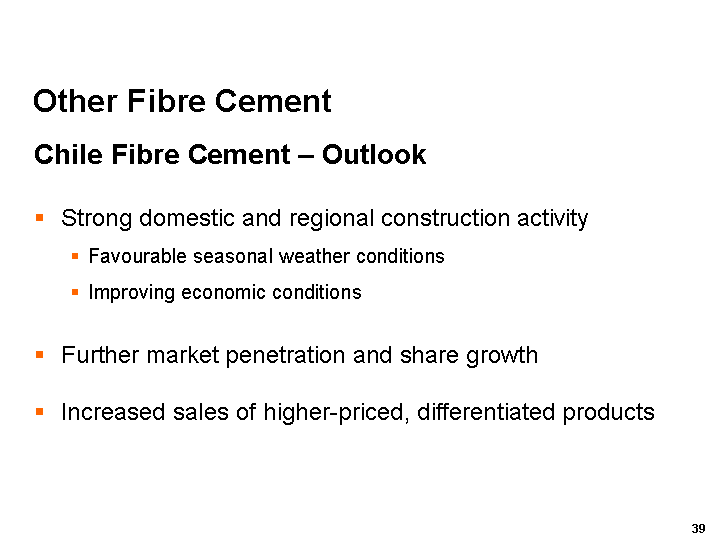
| Other Fibre Cement Chile Fibre Cement - Outlook Strong domestic and regional construction activity Favourable seasonal weather conditions Improving economic conditions Further market penetration and share growth Increased sales of higher-priced, differentiated products |
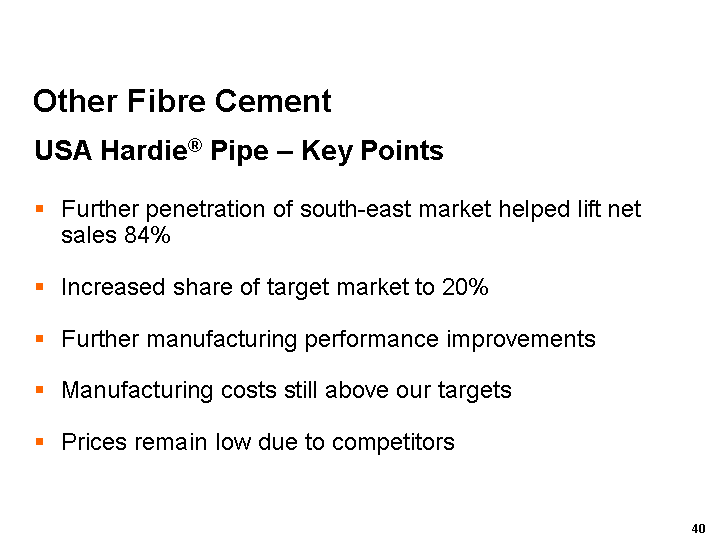
| Other Fibre Cement USA Hardie(r) Pipe - Key Points Further penetration of south-east market helped lift net sales 84% Increased share of target market to 20% Further manufacturing performance improvements Manufacturing costs still above our targets Prices remain low due to competitors |
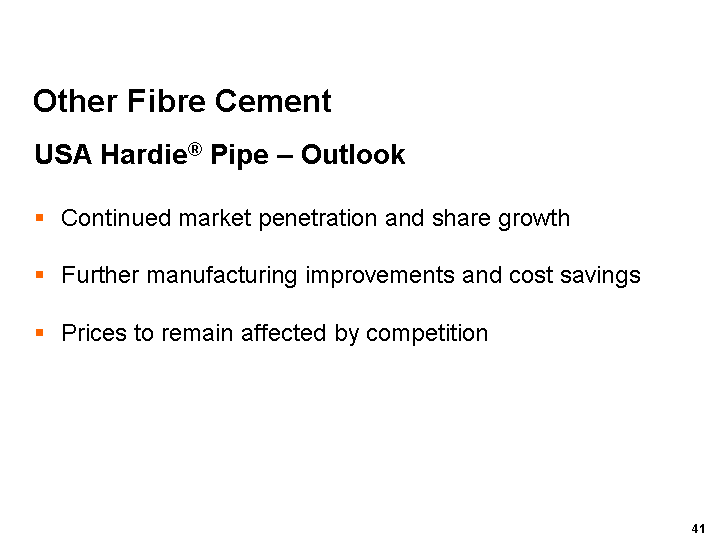
| Other Fibre Cement USA Hardie(r) Pipe - Outlook Continued market penetration and share growth Further manufacturing improvements and cost savings Prices to remain affected by competition |
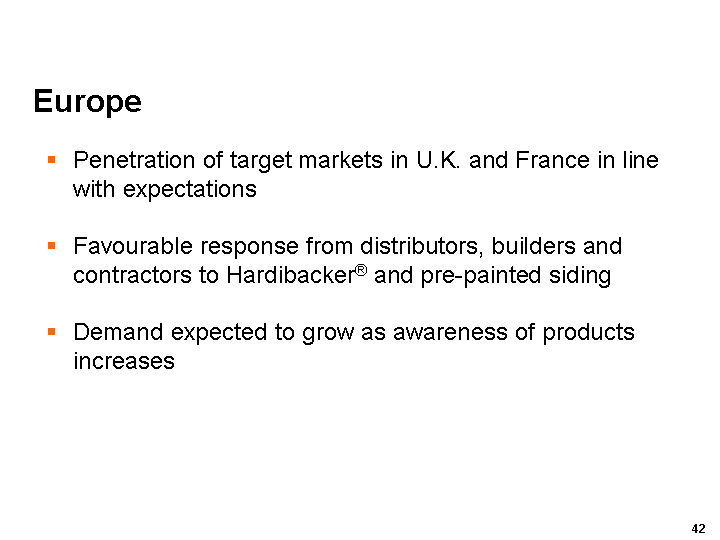
| Europe Penetration of target markets in U.K. and France in line with expectations Favourable response from distributors, builders and contractors to Hardibacker(r) and pre-painted siding Demand expected to grow as awareness of products increases |
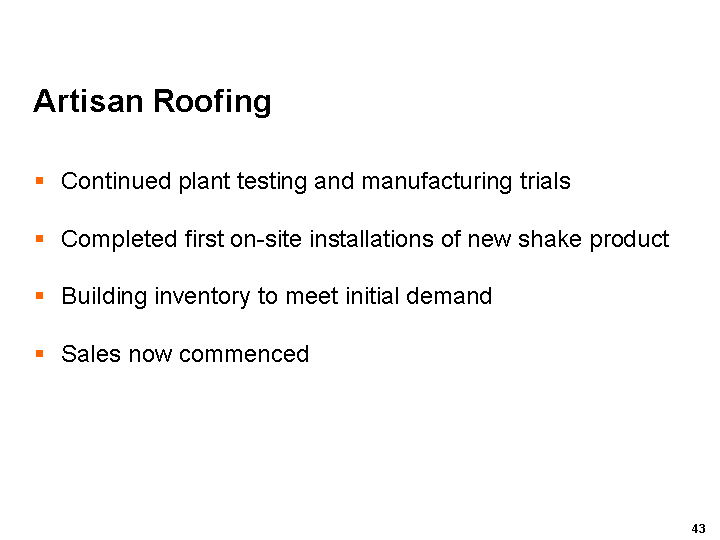
| Artisan Roofing Continued plant testing and manufacturing trials Completed first on-site installations of new shake product Building inventory to meet initial demand Sales now commenced |
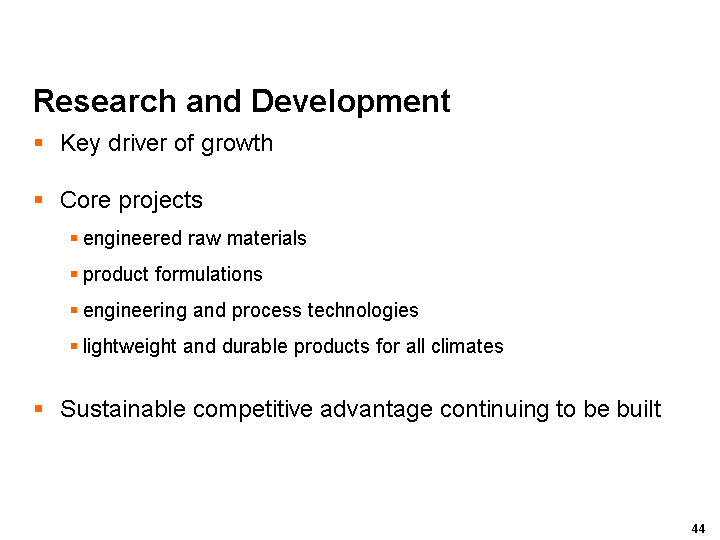
| Research and Development Key driver of growth Core projects engineered raw materials product formulations engineering and process technologies lightweight and durable products for all climates Sustainable competitive advantage continuing to be built |
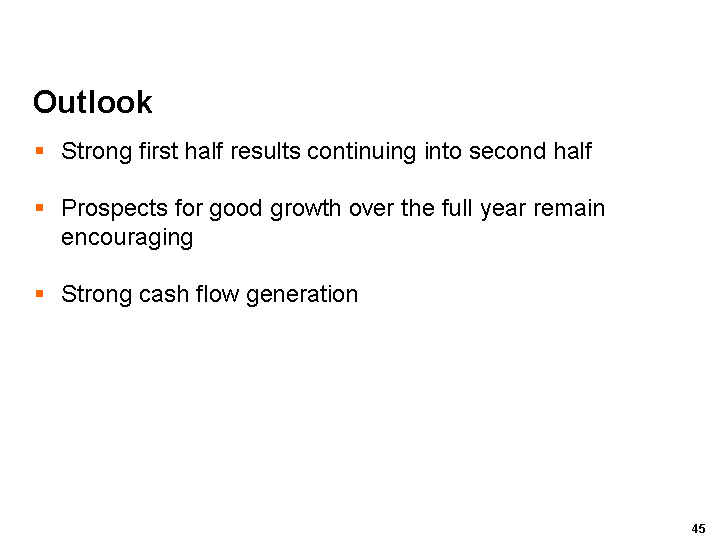
| Outlook Strong first half results continuing into second half Prospects for good growth over the full year remain encouraging Strong cash flow generation |
| Disclaimer This presentation contains forward-looking statements. Words such as "believe,'' "anticipate,'' "plan,'' "expect,'' "intend,'' "target,'' "estimate,'' "project,'' "predict,'' "forecast,'' "guideline,'' "should,'' "aim'' and similar expressions are intended to identify forward-looking statements but are not the exclusive means of identifying such statements. Forward-looking statements involve inherent risks and uncertainties. We caution you that a number of important factors could cause actual results to differ materially from the plans, objectives, expectations, estimates and intentions expressed in such forward-looking statements. These factors, which are further discussed in our reports submitted to the Securities and Exchange Commission on Forms 20-F and 6-K and in our other filings, include but are not limited to: competition and product pricing in the markets in which we operate; general economic and market conditions; compliance with, and possible changes in, environmental and health and safety laws; dependence on cyclical construction markets; the supply and cost of raw materials; our reliance on a small number of product distributors; the consequences of product failures or defects; exposure to environmental, asbestos or other legal proceedings; and risks of conducting business internationally. We caution you that the foregoing list of factors is not exclusive and that other risks and uncertainties may cause actual results to differ materially from those contained in forward-looking statements. Forward-looking statements speak only as of the date they are made. |
| Notes This Management Presentation forms part of a package of information about the company's results. It should be read in conjunction with the other parts of this package, including Management's Discussion and Analysis (MD&A), a Media Release, a Financial Report and Results at a Glance document. EBIT is defined as operating income. EBIT margin is defined as EBIT as a percentage of our net sales. We believe EBIT and EBIT margin to be relevant and useful information as these are the primary measures used by our management to measure the operating profit or loss of our business. EBIT is one of several metrics used by our management to measure the cash generated from our operations, excluding the operating cash requirement of our interest and income taxes. Additionally, EBIT is believed to be a primary measure and terminology used by our Australian investors. EBIT and EBIT margin should be considered in addition to, but not as a substitute for, other measures of financial performance reported in accordance with accounting principles generally accepted in the United States of America. EBIT and EBIT margin, as we have defined them, may not be comparable to similarly titled measures reported by other companies. The use of EBIT and EBIT margins in this document are equivalent to the US GAAP measures of operating income and operating income margin. |
| Notes cont... 3. EBITDA is not a measure of financial performance under US GAAP and should not be considered as an alternative to, or more meaningful than, income from operations, net income or cash flows as defined by US GAAP or as a measure of our profitability or liquidity. All companies do not calculate EBITDA in the same manner and, accordingly, EBITDA may not be comparable with other companies. We have included information concerning EBITDA because we believe that EBITDA is commonly used by investors to evaluate the ability of a company's earnings from its core business operations to satisfy its debt, capital expenditure and working capital requirements. 4. Presentation of EBIT and EBIT Margin before restructuring and other operating (expense) income are not measures of financial performance under US GAAP and should not be considered to be more meaningful than EBIT and EBIT Margin. The Company has included these financial measures to provide investors with an alternative method for assessing the Company's operating results in a manner that is focused on the performance of the Company's ongoing operations. The Company's management uses these non-GAAP measures for the same purposes. Operating profit from continuing operations is equivalent to the US GAAP measure of income from continuing operations. Net operating profit including discontinued operations is equivalent to the US GAAP measure of net income. |
| FY04 2nd Quarter and Half Year Results 13 November 2003 |