
| High Growth From Unique Technology March 2004 Exhibit 99.1 |
| Focussed on Fibre Cement High growth Unique proprietary technology Sustainable competitive advantage Strong cashflows and balance sheet Low cyclical risk Relentless will to win Attractive Investment Attributes Photo (s) |
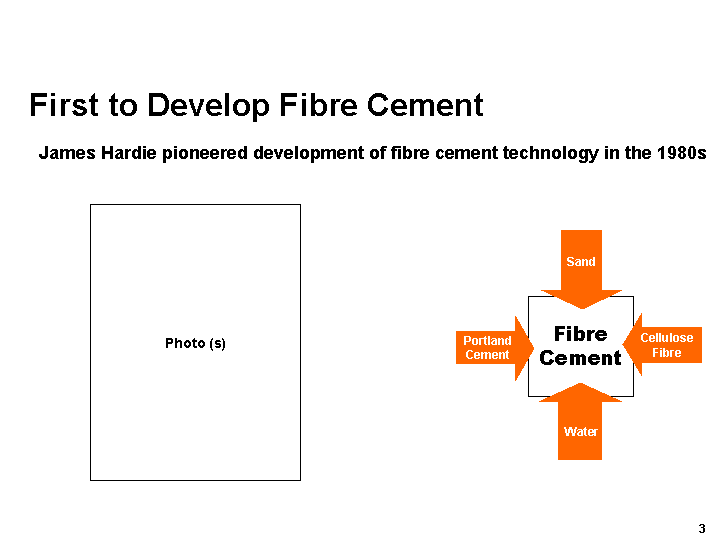
| First to Develop Fibre Cement James Hardie pioneered development of fibre cement technology in the 1980s Fibre Cement Sand Cellulose Fibre Water Portland Cement Photo (s) |
| Many Product Applications External siding/soffit lining Internal wall/floor wet area lining Trim and fascia Ceiling lining and flooring External/internal wall systems Partitioning Commercial facades Decorative columns Fencing Drainage pipes Photo (s) |
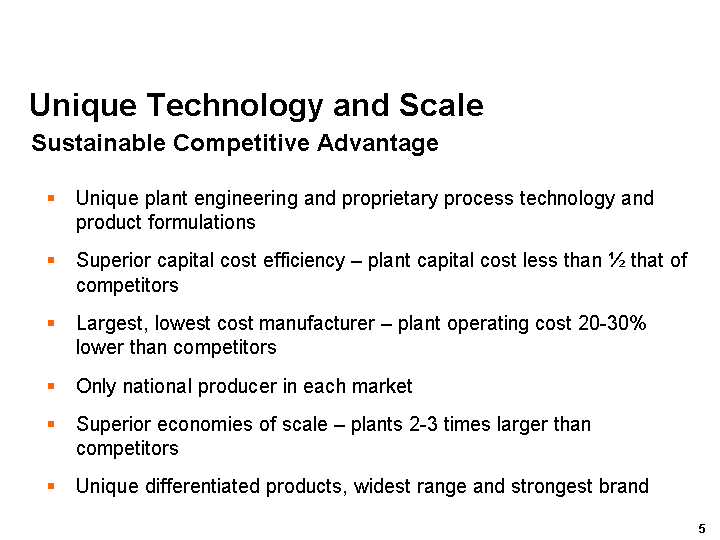
| Unique Technology and Scale Sustainable Competitive Advantage Unique plant engineering and proprietary process technology and product formulations Superior capital cost efficiency - plant capital cost less than 1/2 that of competitors Largest, lowest cost manufacturer - plant operating cost 20-30% lower than competitors Only national producer in each market Superior economies of scale - plants 2-3 times larger than competitors Unique differentiated products, widest range and strongest brand |

| Capabilities and resources 120 scientists, engineers and technicians 30% increase in spend to US$21 million in FY03 - 3% of sales Core projects new proprietary engineered raw materials new proprietary product formulations new engineering and proprietary process technologies lightweight and durable products for all climates Creating the Future R&D is a Key Driver of Growth Photo (s) Photo (s) |
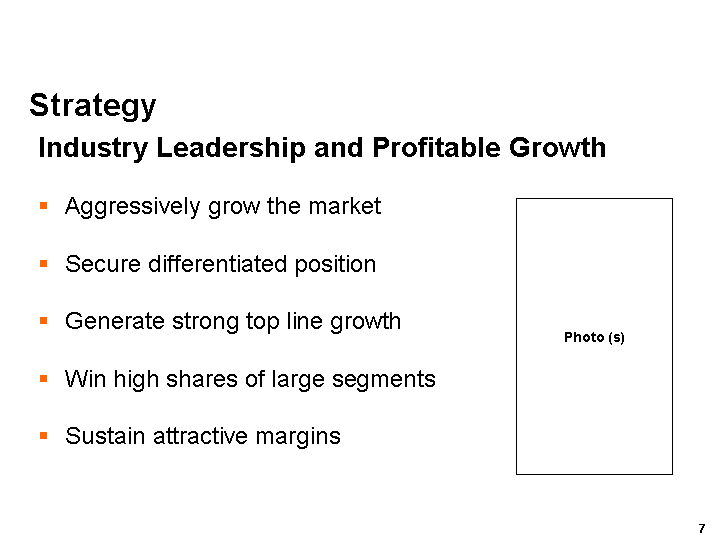
| Strategy Industry Leadership and Profitable Growth Aggressively grow the market Secure differentiated position Generate strong top line growth Win high shares of large segments Sustain attractive margins Photo (s) |
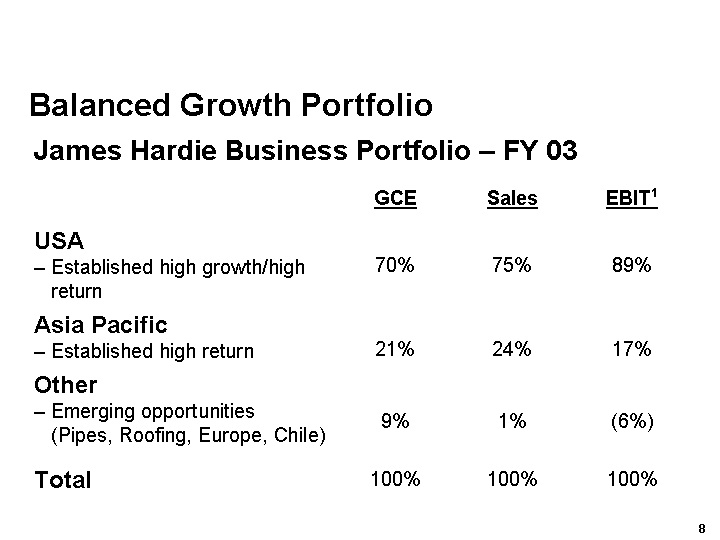
| Balanced Growth Portfolio James Hardie Business Portfolio - FY 03 GCE Sales EBIT1 USA - - Established high growth/high return 70% 75% 89% Asia Pacific - - Established high return 21% 24% 17% Other - - Emerging opportunities (Pipes, Roofing, Europe, Chile) 9% 1% (6%) Total 100% 100% 100% |
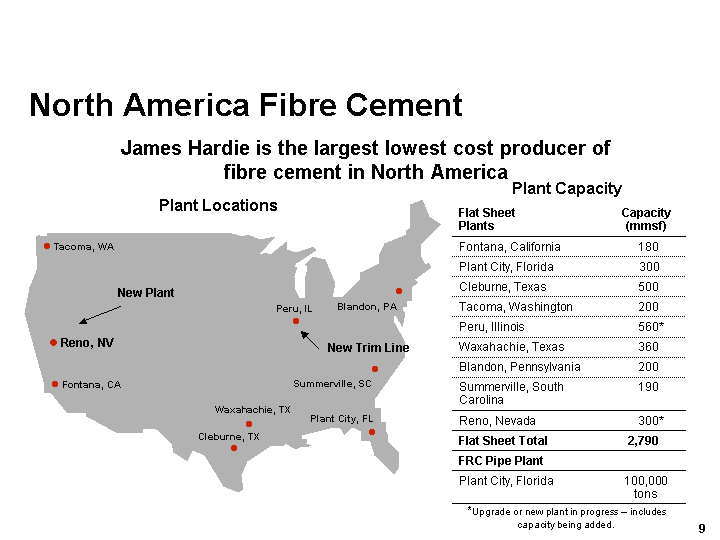
| North America Fibre Cement James Hardie is the largest lowest cost producer of fibre cement in North America Plant Locations Flat Sheet Plants Capacity (mmsf) Fontana, California 180 Plant City, Florida 300 Cleburne, Texas 500 Tacoma, Washington 200 Peru, Illinois 560* Waxahachie, Texas 360 Blandon, Pennsylvania 200 Summerville, South Carolina 190 Reno, Nevada 300* Flat Sheet Total 2,790 FRC Pipe Plant Plant City, Florida 100,000 tons Plant Capacity *Upgrade or new plant in progress - includes capacity being added. Tacoma, WA Fontana, CA Plant City, FL Waxahachie, TX Cleburne, TX Peru, IL Blandon, PA Summerville, SC Reno, NV New Trim Line New Plant |
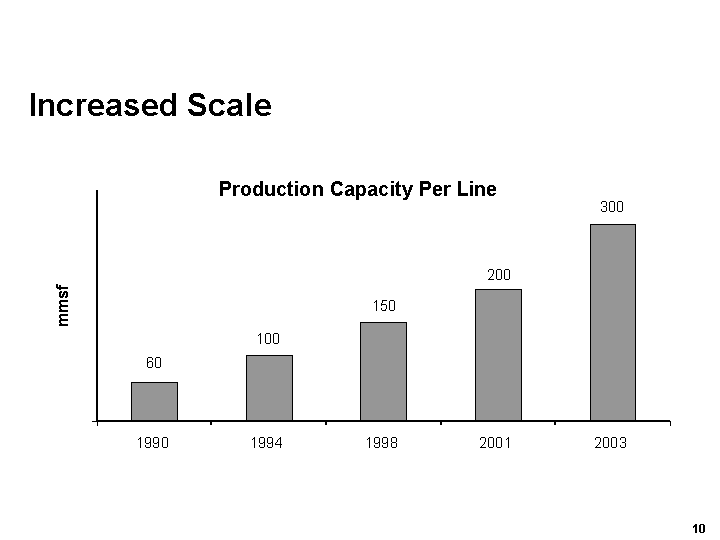
| Increased Scale 1990 1994 1998 2001 2003 mmsf 60 100 150 200 300 Production Capacity Per Line |
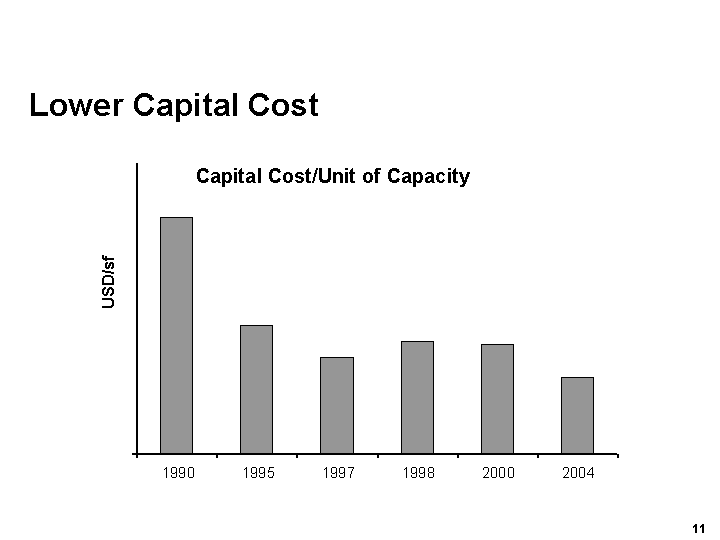
| Lower Capital Cost 1990 1995 1997 1998 2000 2004 USD/sf Capital Cost/Unit of Capacity |
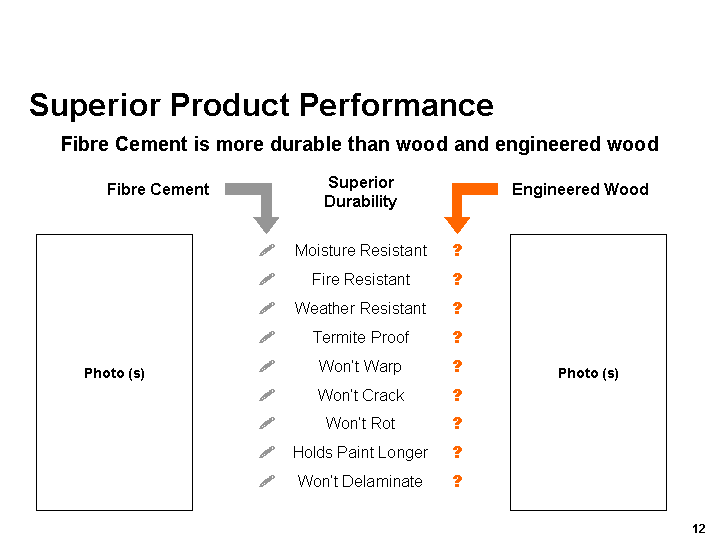
| Superior Product Performance Fibre Cement is more durable than wood and engineered wood Fibre Cement Superior Durability Moisture Resistant Fire Resistant Weather Resistant Termite Proof Won't Warp Won't Crack Won't Rot Holds Paint Longer Won't Delaminate ? ? ? ? ? ? ? ? ? ? ? ? ? ? ? ? ? ? Engineered Wood Photo (s) Photo (s) |
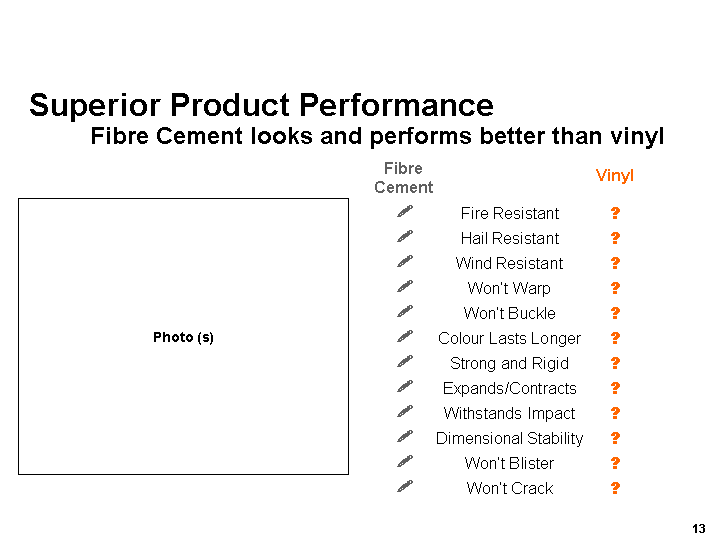
| Superior Product Performance Fibre Cement looks and performs better than vinyl Vinyl Fire Resistant Hail Resistant Wind Resistant Won't Warp Won't Buckle Colour Lasts Longer Strong and Rigid Expands/Contracts Withstands Impact Dimensional Stability Won't Blister Won't Crack ? ? ? ? ? ? ? ? ? ? ? ? ? ? ? ? ? ? ? ? ? ? ? ? Fibre Cement Photo (s) |
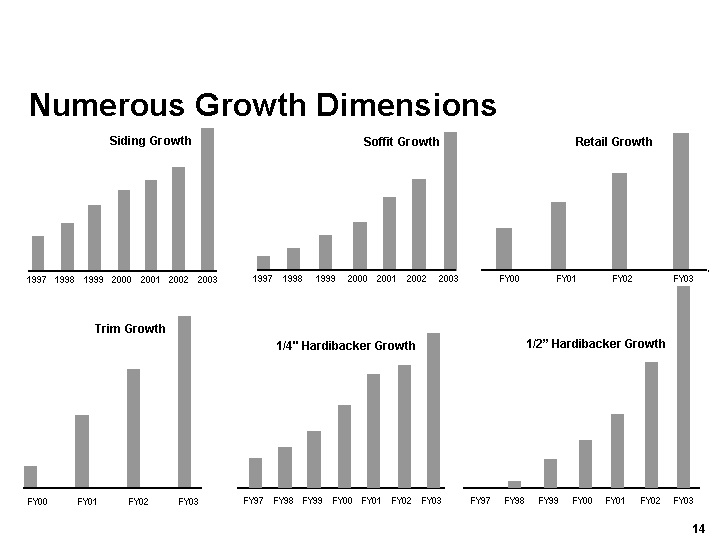
| Soffit Growth 1997 1998 1999 2000 2001 2002 2003 FY00 FY01 FY02 FY03 Retail Growth 1997 1998 1999 2000 2001 2002 2003 Siding Growth Trim Growth FY00 FY01 FY02 FY03 Numerous Growth Dimensions 1/4" Hardibacker Growth FY97 FY98 FY99 FY00 FY01 FY02 FY03 1/2" Hardibacker Growth FY97 FY98 FY99 FY00 FY01 FY02 FY03 |
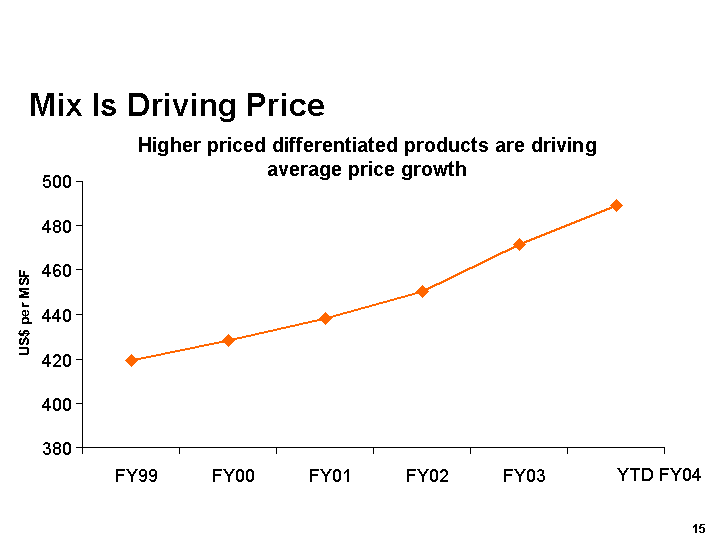
| Higher priced differentiated products are driving average price growth Mix Is Driving Price US$ per MSF |
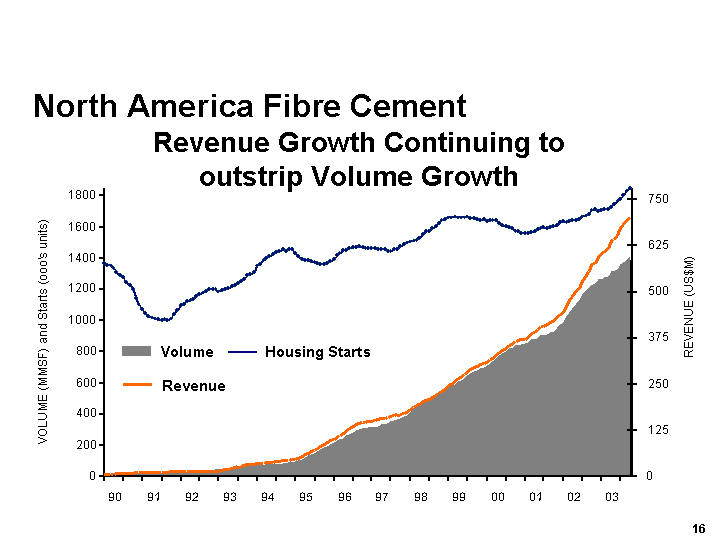
| North America Fibre Cement Revenue Growth Continuing to outstrip Volume Growth 0 200 400 600 800 1000 1200 1400 1600 1800 90 91 92 93 94 95 96 97 98 99 00 01 02 03 VOLUME (MMSF) and Starts (ooo's units) 0 125 250 375 500 625 750 REVENUE (US$M) Volume Revenue Housing Starts |
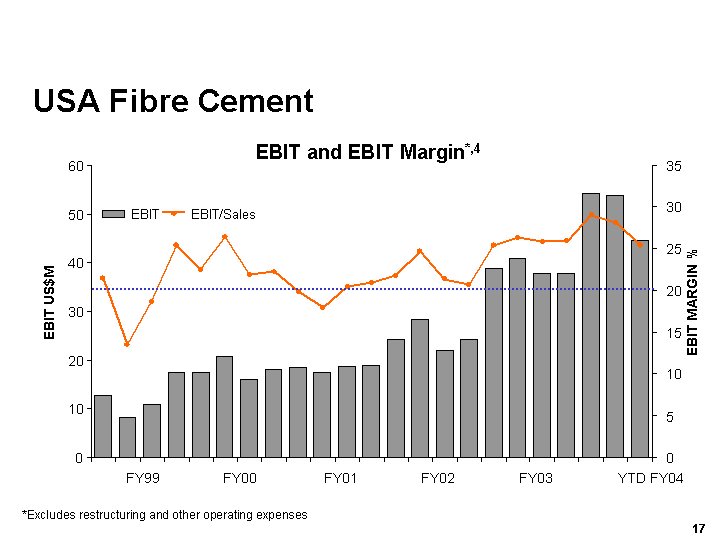
| USA Fibre Cement *Excludes restructuring and other operating expenses 0 10 20 30 40 50 60 FY99 FY00 FY01 FY02 FY03 YTD FY04 EBIT US$M 0 5 10 15 20 25 30 35 EBIT MARGIN % EBIT EBIT/Sales EBIT and EBIT Margin*,4 |
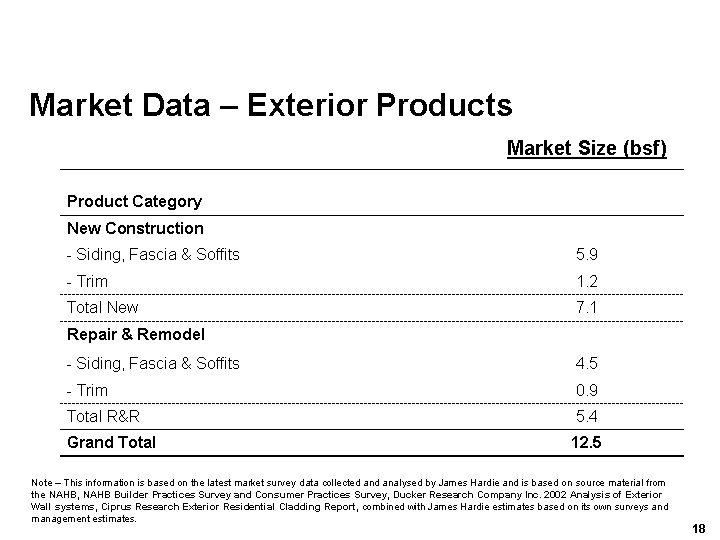
| Market Data - Exterior Products Market Size (bsf) Product Category New Construction - Siding, Fascia & Soffits 5.9 - Trim 1.2 Total New 7.1 Repair & Remodel - Siding, Fascia & Soffits 4.5 - Trim 0.9 Total R&R 5.4 Grand Total 12.5 Note - This information is based on the latest market survey data collected and analysed by James Hardie and is based on source material from the NAHB, NAHB Builder Practices Survey and Consumer Practices Survey, Ducker Research Company Inc. 2002 Analysis of Exterior Wall systems, Ciprus Research Exterior Residential Cladding Report, combined with James Hardie estimates based on its own surveys and management estimates. |
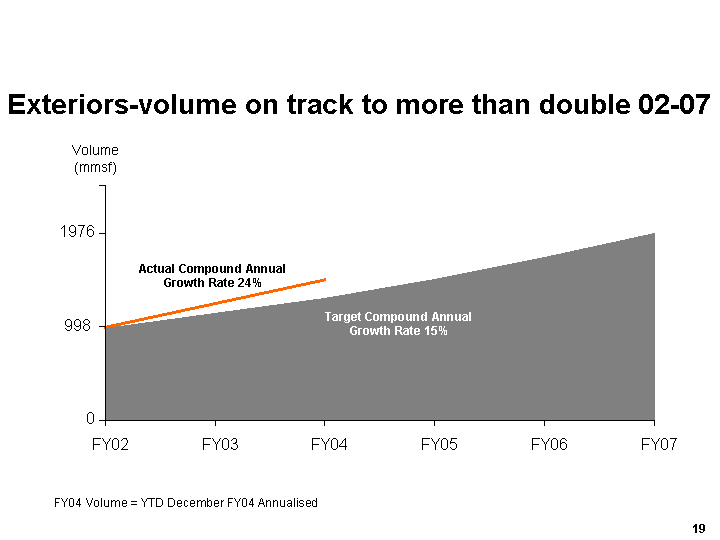
| Exteriors-volume on track to more than double 02-07 0 998 1976 FY02 FY03 FY04 FY05 FY06 FY07 Actual Compound Annual Growth Rate 24% Target Compound Annual Growth Rate 15% Volume (mmsf) FY04 Volume = YTD December FY04 Annualised |
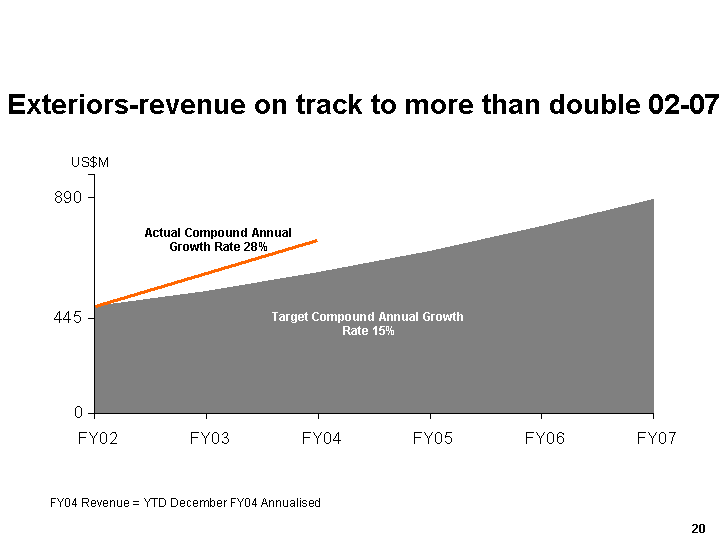
| Exteriors-revenue on track to more than double 02-07 0 445 890 FY02 FY03 FY04 FY05 FY06 FY07 FY04 Revenue = YTD December FY04 Annualised Target Compound Annual Growth Rate 15% Actual Compound Annual Growth Rate 28% US$M |
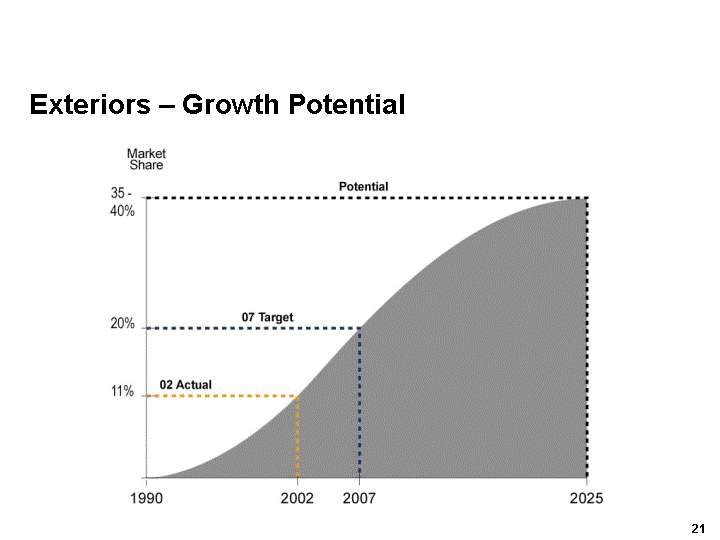
| Exteriors - Growth Potential Exteriors - Growth Potential |
| Stable US Housing Market Positive demographic factors Immigration Internal migration Household formation Low mortgage rates Strong house prices Low inventories Improving economy Photo (s) |
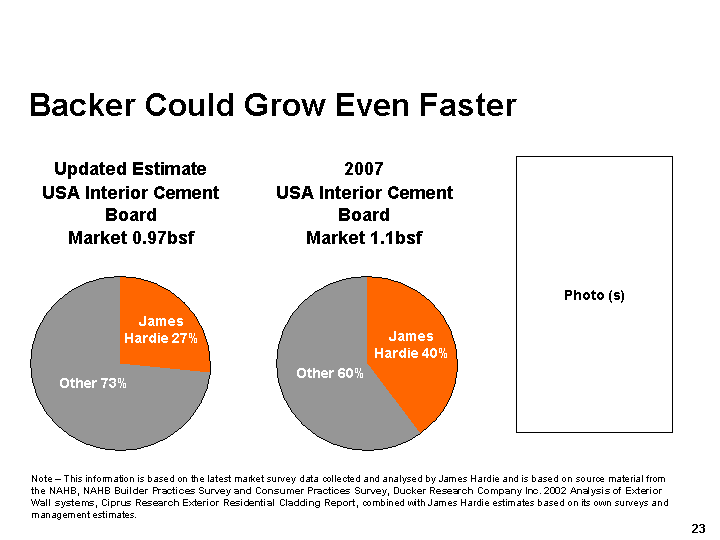
| Backer Could Grow Even Faster Updated Estimate USA Interior Cement Board Market 0.97bsf 2007 USA Interior Cement Board Market 1.1bsf Note - This information is based on the latest market survey data collected and analysed by James Hardie and is based on source material from the NAHB, NAHB Builder Practices Survey and Consumer Practices Survey, Ducker Research Company Inc. 2002 Analysis of Exterior Wall systems, Ciprus Research Exterior Residential Cladding Report, combined with James Hardie estimates based on its own surveys and management estimates. James Hardie 27% Other 73% James Hardie 40% Other 60% Photo (s) |
| Australia/New Zealand YTD sales US$140m - up 22% YTD EBIT1 up 19% Higher value differentiated products Lower delivered cost Emphasise step change High performance culture Increase revenue and margins Photo (s) |
| Philippines and Asia Manufacturing plant commissioned 1999 YTD sales US$18 million up 39% EBIT1 positive Fibre cement as substitute for plywood 26% share of domestic plywood substitution market Established low cost regional manufacturing hub Low GDP per capita is an obstacle for developing a differentiated JH business model Photo (s) |
| Chile and South America Manufacturing plant commissioned 2001 Low cost manufacturing, rapid market penetration, high growth 23% share of flat sheet market already achieved Positive EBIT1 Introducing differentiated products Photo (s) |
| USA manufacturing plant commissioned 2001 Product has advantages over reinforced steel concrete pipes - - light, long, strong Lower cost to make and install YTD volume growth up 107% Long term targets national business large share of US$2 billion market Pipes Photo (s) |
| Roofing USA market entry Development of fibre cement roofing technology US roofing market 13 bsf Initial target market 2.1 bsf to compete with wood shake superior durability and fire performance US$12m pilot plant commissioned Photo (s) |
| Europe Initially pursuing a low cost, low risk strategy Differentiated products imported from US G2 Backer XLD Trim ColorPlus Siding Focussed market development UK and France JH business model differentiated from current industry approach |
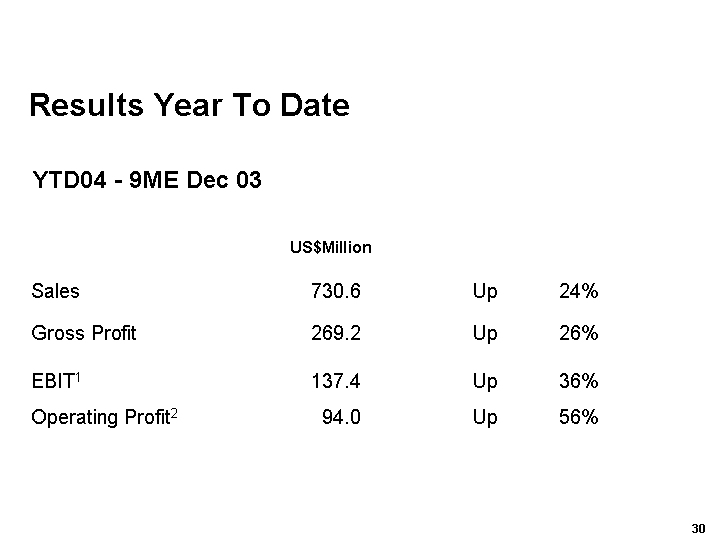
| Results Year To Date US$Million Sales 730.6 Up 24% Gross Profit 269.2 Up 26% EBIT1 137.4 Up 36% Operating Profit2 94.0 Up 56% YTD04 - 9ME Dec 03 |
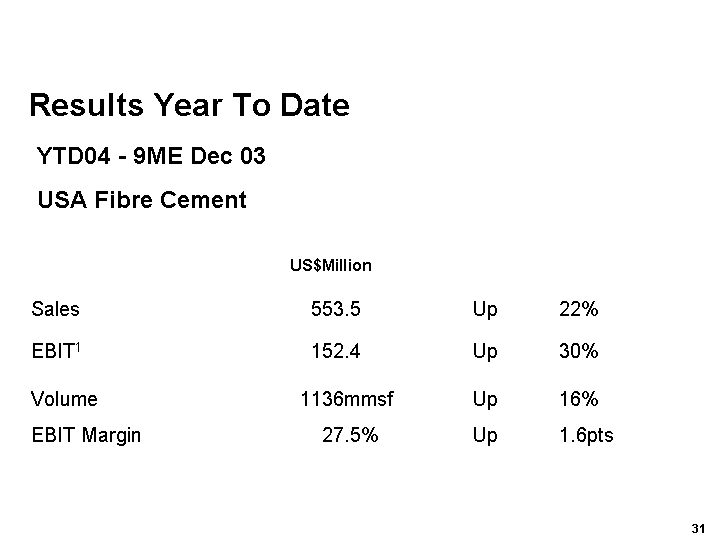
| Results Year To Date US$Million Sales 553.5 Up 22% EBIT1 152.4 Up 30% Volume 1136mmsf Up 16% EBIT Margin 27.5% Up 1.6pts YTD04 - 9ME Dec 03 USA Fibre Cement |
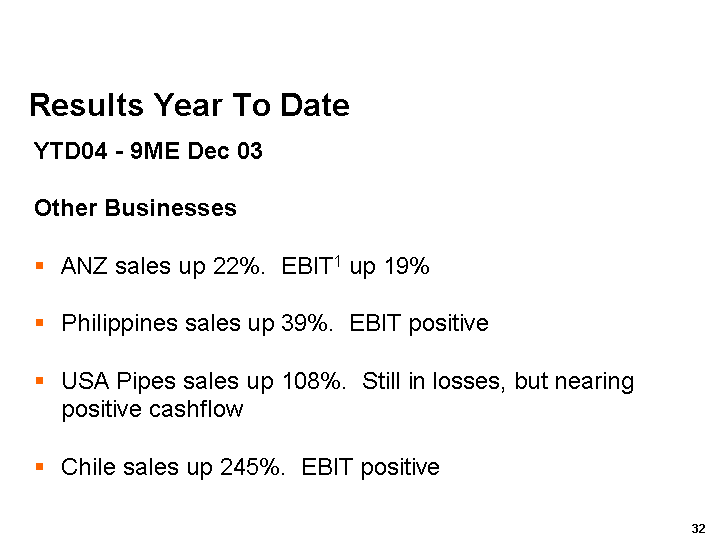
| Results Year To Date YTD04 - 9ME Dec 03 Other Businesses ANZ sales up 22%. EBIT1 up 19% Philippines sales up 39%. EBIT positive USA Pipes sales up 108%. Still in losses, but nearing positive cashflow Chile sales up 245%. EBIT positive |
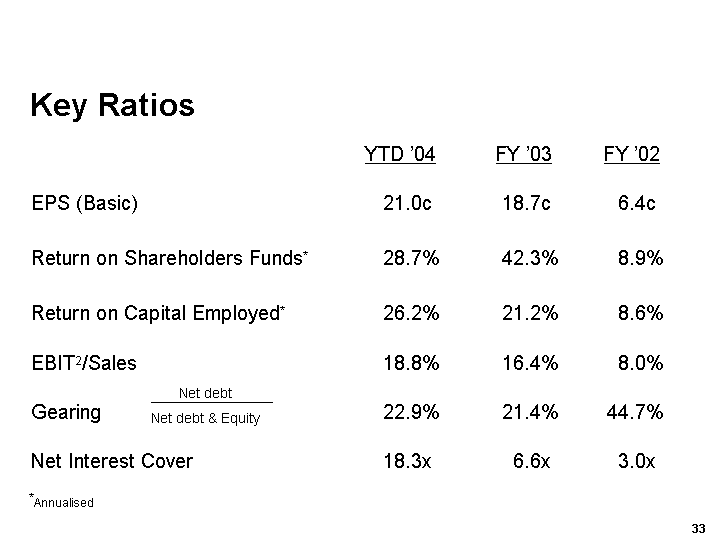
| Key Ratios YTD '04 FY '03 FY '02 EPS (Basic) 21.0c 18.7c 6.4c Return on Shareholders Funds* 28.7% 42.3% 8.9% Return on Capital Employed* 26.2% 21.2% 8.6% EBIT2/Sales 18.8% 16.4% 8.0% Gearing 22.9% 21.4% 44.7% Net Interest Cover 18.3x 6.6x 3.0x *Annualised |
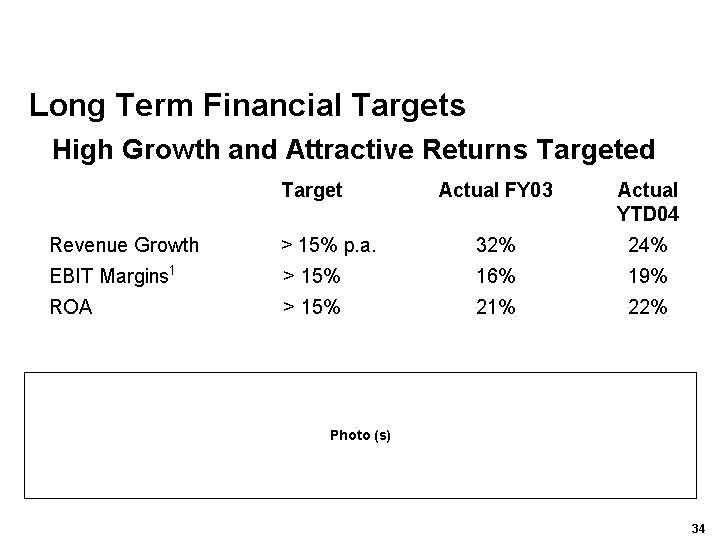
| High Growth and Attractive Returns Targeted Long Term Financial Targets Target Actual FY03 Actual YTD04 Revenue Growth > 15% p.a. 32% 24% EBIT Margins1 > 15% 16% 19% ROA > 15% 21% 22% Photo (s) |
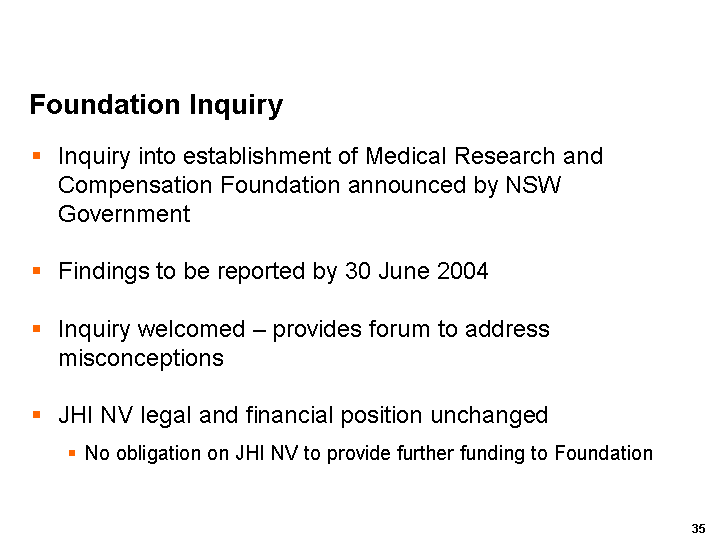
| Foundation Inquiry Inquiry into establishment of Medical Research and Compensation Foundation announced by NSW Government Findings to be reported by 30 June 2004 Inquiry welcomed - provides forum to address misconceptions JHI NV legal and financial position unchanged No obligation on JHI NV to provide further funding to Foundation |
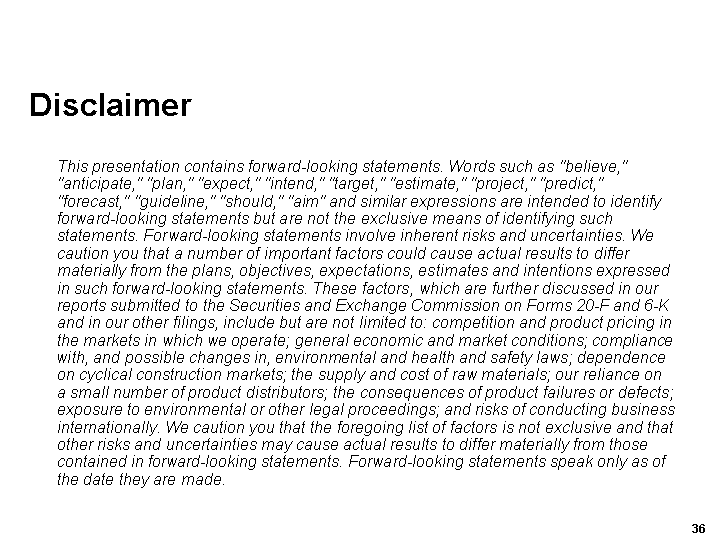
| Disclaimer This presentation contains forward-looking statements. Words such as "believe,'' "anticipate,'' "plan,'' "expect,'' "intend,'' "target,'' "estimate,'' "project,'' "predict,'' "forecast,'' "guideline,'' "should,'' "aim'' and similar expressions are intended to identify forward-looking statements but are not the exclusive means of identifying such statements. Forward-looking statements involve inherent risks and uncertainties. We caution you that a number of important factors could cause actual results to differ materially from the plans, objectives, expectations, estimates and intentions expressed in such forward-looking statements. These factors, which are further discussed in our reports submitted to the Securities and Exchange Commission on Forms 20-F and 6-K and in our other filings, include but are not limited to: competition and product pricing in the markets in which we operate; general economic and market conditions; compliance with, and possible changes in, environmental and health and safety laws; dependence on cyclical construction markets; the supply and cost of raw materials; our reliance on a small number of product distributors; the consequences of product failures or defects; exposure to environmental or other legal proceedings; and risks of conducting business internationally. We caution you that the foregoing list of factors is not exclusive and that other risks and uncertainties may cause actual results to differ materially from those contained in forward-looking statements. Forward-looking statements speak only as of the date they are made. |

| Notes 1. EBIT is defined as operating income. EBIT margin is defined as EBIT as a percentage of our net sales. We believe EBIT and EBIT margin to be relevant and useful information as these are the primary measures used by our management to measure the operating profit or loss of our business. EBIT is one of several metrics used by our management to measure the cash generated from our operations, excluding the operating cash requirement of our interest and income taxes. Additionally, EBIT is believed to be a primary measure and terminology used by our Australian investors. EBIT and EBIT margin should be considered in addition to, but not as a substitute for, other measures of financial performance reported in accordance with accounting principles generally accepted in the United States of America. EBIT and EBIT margin, as we have defined them, may not be comparable to similarly titled measures reported by other companies. The use of EBIT and EBIT margins in this document are equivalent to the US GAAP measures of operating income and operating income margin. 2. Operating profit from continuing operations is equivalent to the US GAAP measure of income from continuing operations. |

| High Growth From Unique Technology March 2004 |