Exhibit 99.2
| Louis Gries, CEO |

| Louis Gries, CEO |
| 2 Disclaimer The presentation contains forward-looking statements. We may from time to time make forward-looking statements in our periodic reports filed with or furnished to the US Securities and Exchange Commission, on Forms 20-F and 6-K, in our annual reports to shareholders, in offering circulars, invitation memoranda and prospectuses, in media releases and other written materials and in oral statements made by our officers, directors or employees to analysts, institutional investors, existing and potential lenders, representatives of the media and others. Statements that are not historical facts are forward-looking statements and such forward- looking statements are statements made pursuant to the Safe Harbor Provisions of the Private Securities Litigation Reform Act of 1995. Examples of forward-looking statements include:statements about our future performance; statements regarding our plans, objectives or goals, including those relating to strategies, initiatives, competition, acquisitions, dispositions and/or our products; expectations concerning the costs associated with the suspension or closure of operations at any of our plants and future plans with respect to any such plants; expectations that our credit facilities will be extended or renewed; expectations concerning dividend payments;statements concerning our corporate and tax domiciles and potential changes to them;statements regarding tax liabilities and related audits and proceedings;statements as to the possible consequences of proceedings brought against us and certain of our former directors and officers by the Australian Securities & Investments Commission;expectations about the timing and amount of contributions to the Asbestos Injuries Compensation Fund, a special purpose fund for the compensation of proven Australian asbestos-related personal injury and death claims;expectations concerning indemnification obligations; and statements about product or environmental liabilities.Words such as "believe," "anticipate," "plan," "expect," "intend," "target," "estimate," "project," "predict," "forecast," "guideline," "aim," "will," "should," "continue" and similar expressions are intended to identify forward-looking statements but are not the exclusive means of identifying such statements. Readers are cautioned not to place undue reliance on these forward-looking statements and all such forward-looking statements are qualified in their entirety by reference to the following cautionary statements.Forward-looking statements are based on our estimates and assumptions and because forward-looking statements address future results, events and conditions, they, by their very nature, involve inherent risks and uncertainties. Such known and unknown risks, uncertainties and other factors may cause our actual results, performance or other achievements to differ materially from the anticipated results, performance or achievements expressed, projected or implied by these forward- looking statements. These factors, some of which are discussed under "Key Information - Risk Factors" beginning on page 6 of our Form 20-F filed with the U.S. Securities and Exchange Commission on 25 June 2009, include, but are not limited to: all matters relating to or arising out of the prior manufacture of products that contained asbestos by current and former James Hardie subsidiaries; required contributions to the Asbestos Injuries Compensation Fund and the effect of currency exchange rate movements on the amount recorded in our financial statements as an asbestos liability; compliance with and changes in tax laws and treatments; competition and product pricing in the markets in which we operate; the consequences of product failures or defects; exposure to environmental, asbestos or other legal proceedings; general economic and market conditions; the supply and cost of raw materials; the success of research and development efforts; reliance on a small number of customers; a customer's inability to pay; compliance with and changes in environmental and health and safety laws; risks of conducting business internationally; our proposal to transform to a Dutch "SE" company and transfer our corporate domicile from The Netherlands to Ireland to become an Irish "SE" company; compliance with and changes in laws and regulations; currency exchange risks; the concentration of our customer base on large format retail customers, distributors and dealers; the effect of natural disasters; changes in our key management personnel; inherent limitations on internal controls; use of accounting estimates; and all other risks identified in our reports filed with Australian, Dutch and U.S. securities agencies and exchanges (as appropriate). We caution you that the foregoing list of factors is not exhaustive and that other risks and uncertainties may cause actual results to differ materially from those in forward-looking statements. Forward-looking statements speak only as of the date they are made and are statements of our current expectations concerning future results, events and conditions. |
| 3 Results overview - FY 2009 and Q1 FY 2010USA and Europe Fibre Cement HardieZoneTM SystemLegacy issues Asbestos compensation funding arrangements Agenda |
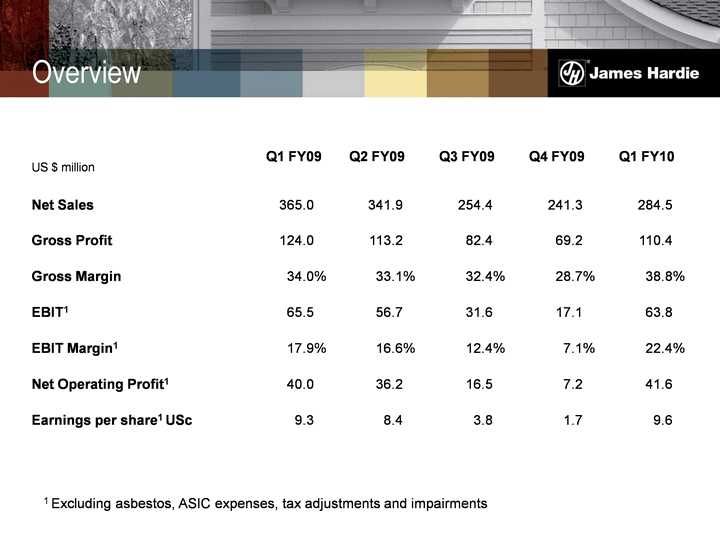
| 1 Excluding asbestos, ASIC expenses, tax adjustments and impairments Overview |
| 5 Aggressively grow demand for our products in targeted market segmentsGrow our overall market position while defending our share in existing market segmentsOffer products with superior value to that of our competitorsIntroduce differentiated products to reduce direct price competition Global Strategy |
| 6 USA and Europe Fibre CementThe US business continues to perform well in a severely depressed housing market We continue to stay on strategy with our product and market initiatives Europe sales continue to increase off a still small baseAsia Pacific Fibre Cement The Australian and New Zealand businesses are set up very much like the US business and have performed well despite declining market demandRecent improvements in the Philippines' plant operation have lifted returns in that business Key points |
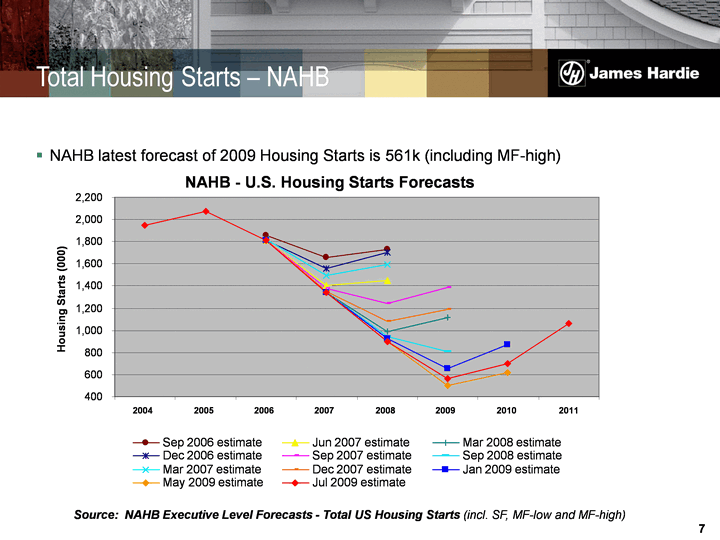
| 7 Total Housing Starts - NAHB NAHB latest forecast of 2009 Housing Starts is 561k (including MF-high) Source: NAHB Executive Level Forecasts - Total US Housing Starts (incl. SF, MF-low and MF-high) May 2009 estimate Jul 2009 estimate |
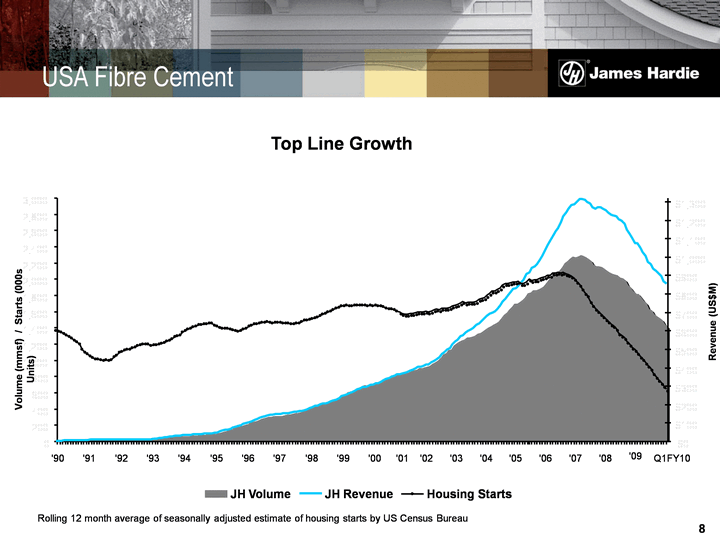
| 8 USA Fibre Cement Rolling 12 month average of seasonally adjusted estimate of housing starts by US Census Bureau Top Line Growth 0 200 400 600 800 1,000 1,200 1,400 1,600 1,800 2,000 2,200 2,400 2,600 2,800 3,000 '90 '91 '92 '93 '94 '95 '96 '97 '98 '99 '00 '01 '02 '03 '04 '05 '06 '07 '08 Q1FY10 Volume (mmsf) / Starts (000s Units) $0 $100 $200 $300 $400 $500 $600 $700 $800 $900 $1,000 $1,100 $1,200 $1,300 Revenue (US$M) JH Volume JH Revenue Housing Starts '09 |
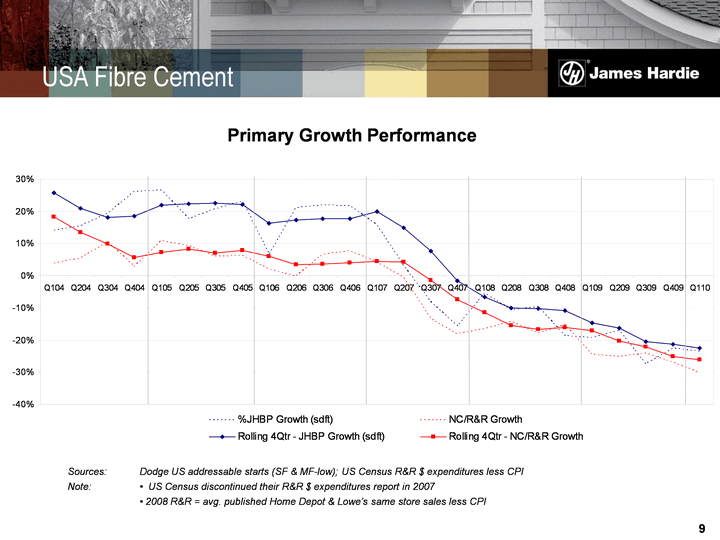
| 9 USA Fibre Cement Primary Growth Performance Sources: Dodge US addressable starts (SF & MF-low); US Census R&R $ expenditures less CPINote: • US Census discontinued their R&R $ expenditures report in 2007 • 2008 R&R = avg. published Home Depot & Lowe's same store sales less CPI |
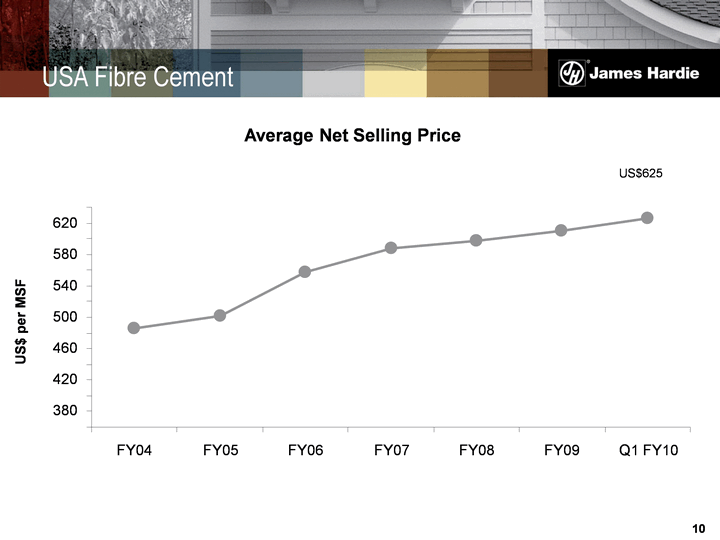
| 10 Average Net Selling Price US$ per MSF USA Fibre Cement 380 420 460 500 540 580 620 FY04 FY05 FY06 FY07 FY08 FY09 Q1 FY10 US$625 |
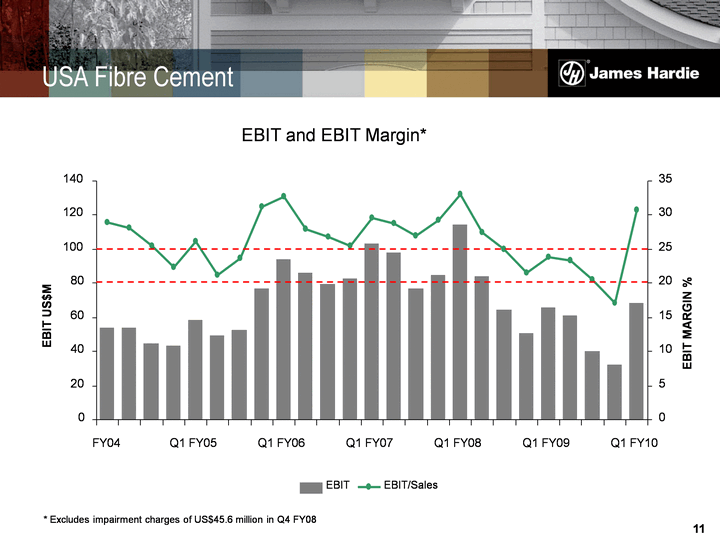
| 11 USA Fibre Cement 0 20 40 60 80 100 120 140 FY04 Q1 FY05 Q1 FY06 Q1 FY07 Q1 FY08 Q1 FY09 Q1 FY10 EBIT US$M 0 5 10 15 20 25 30 35 EBIT MARGIN % EBIT EBIT/Sales EBIT and EBIT Margin* * Excludes impairment charges of US$45.6 million in Q4 FY08 |
| 12 The HardieZone(tm) System James Hardie is currently undertaking a major product launch in the United States. The HardieZoneTM System:provides specific product performance attributes relative to the climate where the product is used across full range of engineered products - Plank, Panel, Trim, Fascia and Soffit, HardieWrap weather barrier clearly articulates why James Hardie is superior to generic fibre cements |
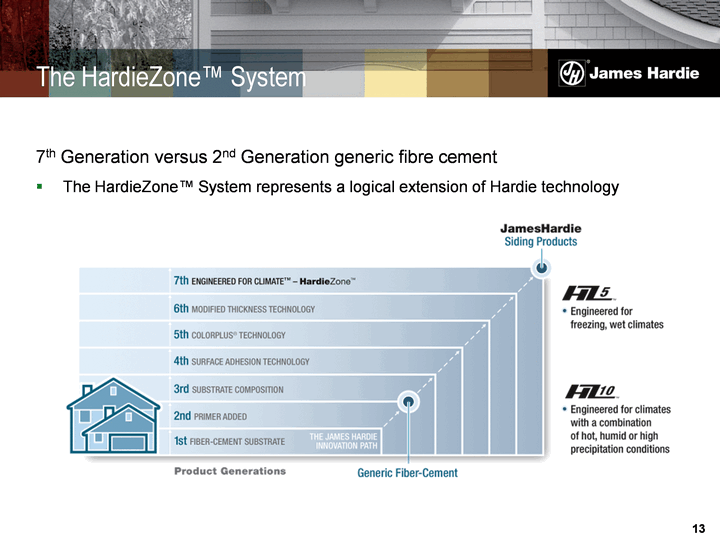
| 13 The HardieZone(tm) System 7th Generation versus 2nd Generation generic fibre cementThe HardieZone(tm) System represents a logical extension of Hardie technology |
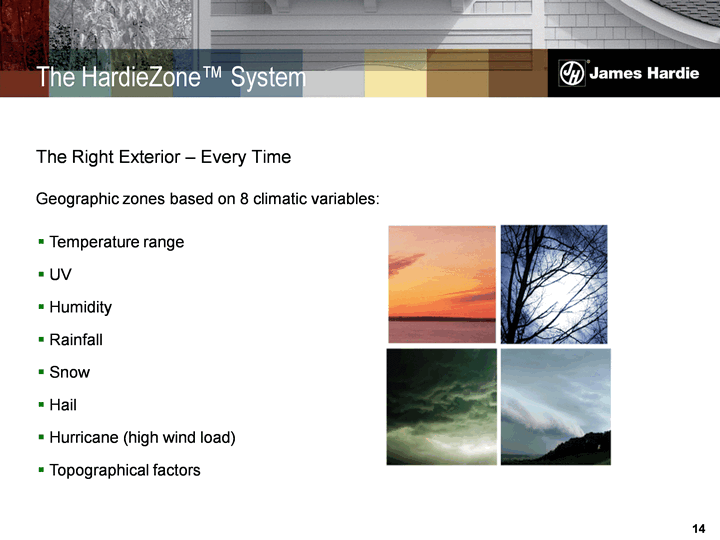
| 14 The HardieZone(tm) System The Right Exterior - Every TimeGeographic zones based on 8 climatic variables: Temperature range UV Humidity Rainfall Snow Hail Hurricane (high wind load) Topographical factors |
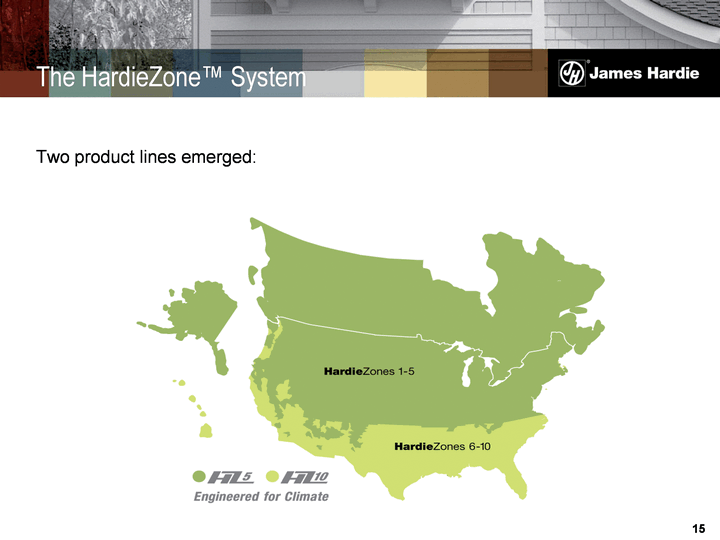
| 15 The HardieZone(tm) System Two product lines emerged: |
| 16 The HardieZone(tm) System plus Factory controlled finish for maximum consistency and durabilityResistant to cracking, fading and chippingReduces costly weather delays plus Factory-controlled finish for maximum consistency and durability Resists peeling, chipping, cracking or marring Colour retention and fade resistance with high levels of UV exposure experienced in zones 6-10 |
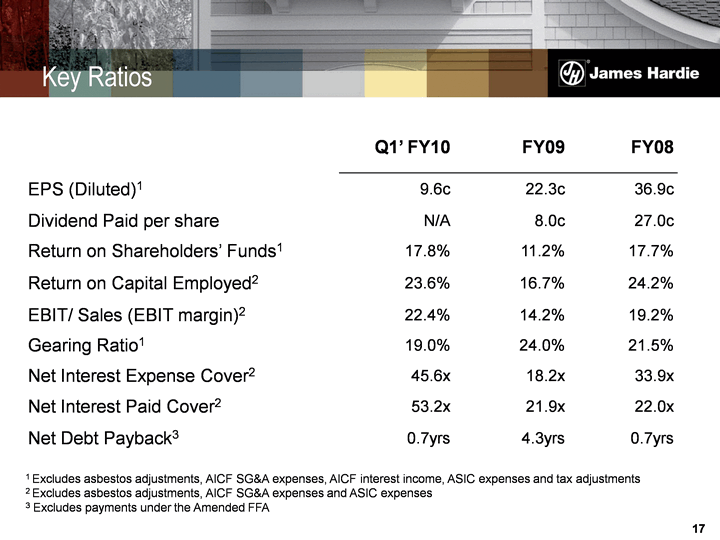
| 17 Key Ratios Q1' FY10 FY09 FY08 EPS (Diluted)1 9.6c 22.3c 36.9c Dividend Paid per share N/A 8.0c 27.0c Return on Shareholders' Funds1 17.8% 11.2% 17.7% Return on Capital Employed2 23.6% 16.7% 24.2% EBIT/ Sales (EBIT margin)2 22.4% 14.2% 19.2% Gearing Ratio1 19.0% 24.0% 21.5% Net Interest Expense Cover2 45.6x 18.2x 33.9x Net Interest Paid Cover2 53.2x 21.9x 22.0x Net Debt Payback3 0.7yrs 4.3yrs 0.7yrs 1 Excludes asbestos adjustments, AICF SG&A expenses, AICF interest income, ASIC expenses and tax adjustments2 Excludes asbestos adjustments, AICF SG&A expenses and ASIC expenses3 Excludes payments under the Amended FFA |
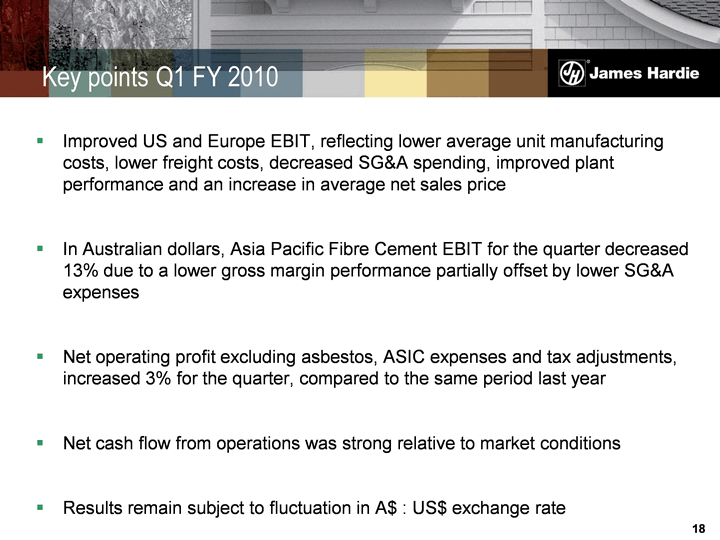
| 18 Improved US and Europe EBIT, reflecting lower average unit manufacturing costs, lower freight costs, decreased SG&A spending, improved plant performance and an increase in average net sales priceIn Australian dollars, Asia Pacific Fibre Cement EBIT for the quarter decreased 13% due to a lower gross margin performance partially offset by lower SG&A expenses Net operating profit excluding asbestos, ASIC expenses and tax adjustments, increased 3% for the quarter, compared to the same period last yearNet cash flow from operations was strong relative to market conditions Results remain subject to fluctuation in A$ : US$ exchange rate Key points Q1 FY 2010 |
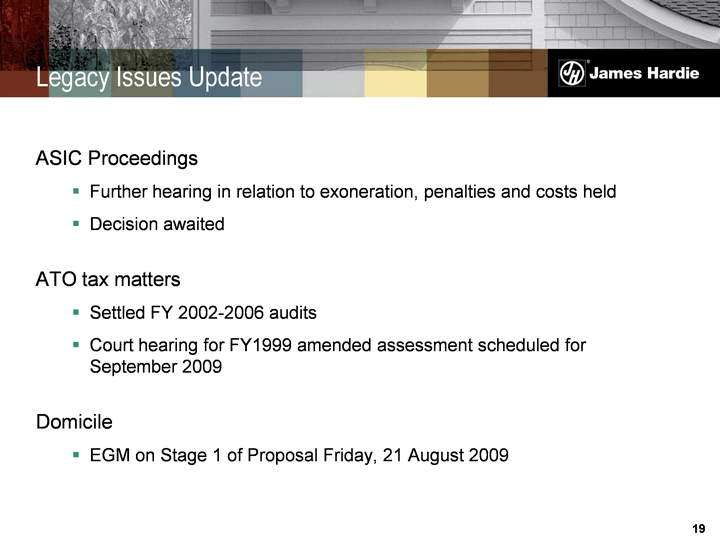
| 19 Legacy Issues Update ASIC ProceedingsFurther hearing in relation to exoneration, penalties and costs heldDecision awaited ATO tax mattersSettled FY 2002-2006 auditsCourt hearing for FY1999 amended assessment scheduled for September 2009 Domicile EGM on Stage 1 of Proposal Friday, 21 August 2009 |
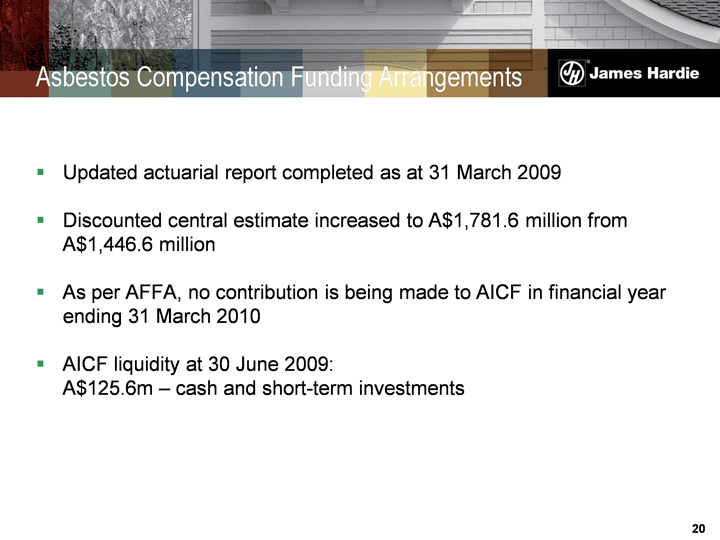
| 20 Updated actuarial report completed as at 31 March 2009Discounted central estimate increased to A$1,781.6 million from A$1,446.6 millionAs per AFFA, no contribution is being made to AICF in financial year ending 31 March 2010AICF liquidity at 30 June 2009: A$125.6m - cash and short-term investments Asbestos Compensation Funding Arrangements |
| 21 Endnotes This Management Presentation forms part of a package of information about the company's results. It should be read in conjunction with the other parts of this package, including Management's Analysis of Results, a Media Release and a Financial Report. DefinitionsFinancial Measures - US GAAP equivalentsEBIT and EBIT Margin - EBIT, as used in this document, is equivalent to the US GAAP measure of operating income. EBIT margin is defined as EBIT as a percentage of net sales. We believe EBIT and EBIT margin to be relevant and useful information as these are the primary measures used by our management to measure the operating profit or loss of our business. EBIT is one of several metrics used by our management to measure the earnings generated from our operations, excluding interest and income tax expenses. Additionally, EBIT is believed to be a primary measure and terminology used by our Australian investors. EBIT and EBIT margin should be considered in addition to, but not as a substitute for, other measures of financial performance reported in accordance with accounting principles generally accepted in the United States of America. EBIT and EBIT margin, as we have defined them, may not be comparable to similarly titled measures reported by other companies.Operating profit - is equivalent to the US GAAP measure of income.Net operating profit - is equivalent to the US GAAP measure of net income.Sales Volumesmmsf - million square feet, where a square foot is defined as a standard square foot of 5/16" thickness.msf - thousand square feet, where a square foot is defined as a standard square foot of 5/16" thickness. |
| 22 Endnotes Financial RatiosGearing Ratio - Net debt (cash) divided by net debt (cash) plus shareholders' equity.Net interest expense cover - EBIT divided by net interest expense.Net interest paid cover - EBIT divided by cash paid during the period for interest, net of amounts capitalised.Net debt payback - Net debt (cash) divided by cash flow from operations.Net debt (cash) - Short-term and long-term debt less cash and cash equivalents. |
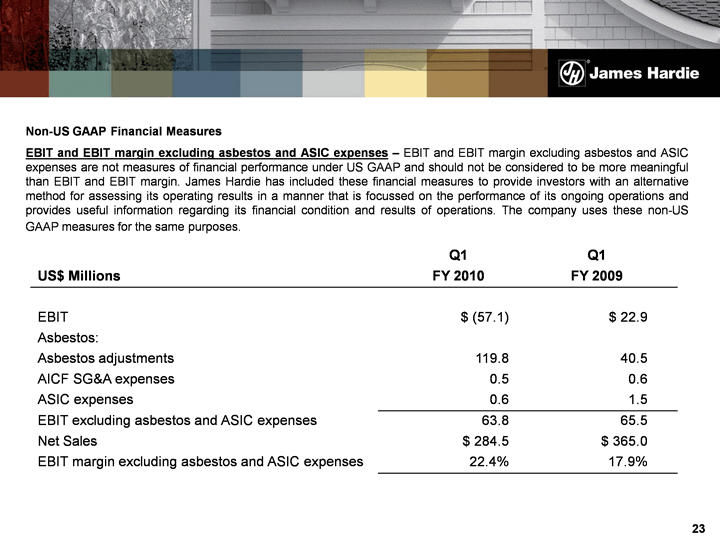
| 23 Non-US GAAP Financial MeasuresEBIT and EBIT margin excluding asbestos and ASIC expenses - EBIT and EBIT margin excluding asbestos and ASIC expenses are not measures of financial performance under US GAAP and should not be considered to be more meaningful than EBIT and EBIT margin. James Hardie has included these financial measures to provide investors with an alternative method for assessing its operating results in a manner that is focussed on the performance of its ongoing operations and provides useful information regarding its financial condition and results of operations. The company uses these non-US GAAP measures for the same purposes. Q1 Q1 US$ Millions FY 2010 FY 2009 EBIT $ (57.1) $ 22.9 Asbestos: Asbestos adjustments 119.8 40.5 AICF SG&A expenses 0.5 0.6 ASIC expenses 0.6 1.5 EBIT excluding asbestos and ASIC expenses 63.8 65.5 Net Sales $ 284.5 $ 365.0 EBIT margin excluding asbestos and ASIC expenses 22.4% 17.9% |
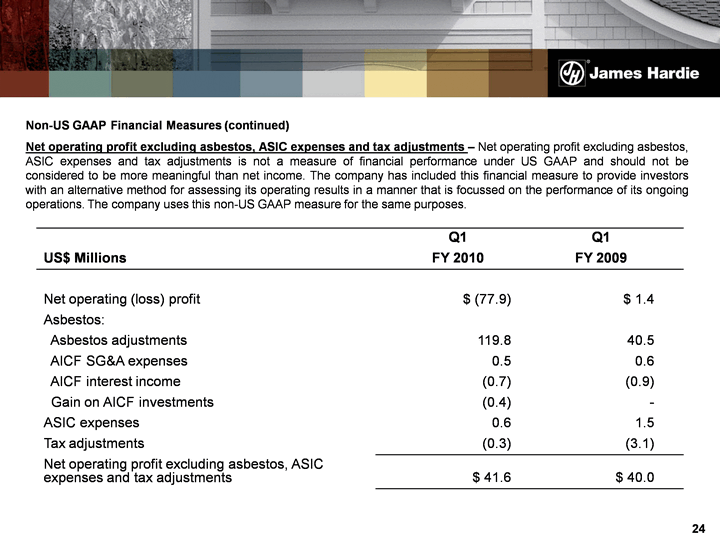
| 24 Non-US GAAP Financial Measures (continued)Net operating profit excluding asbestos, ASIC expenses and tax adjustments - Net operating profit excluding asbestos, ASIC expenses and tax adjustments is not a measure of financial performance under US GAAP and should not be considered to be more meaningful than net income. The company has included this financial measure to provide investors with an alternative method for assessing its operating results in a manner that is focussed on the performance of its ongoing operations. The company uses this non-US GAAP measure for the same purposes. Q1 Q1 US$ Millions FY 2010 FY 2009 Net operating (loss) profit $ (77.9) $ 1.4 Asbestos: Asbestos adjustments 119.8 40.5 AICF SG&A expenses 0.5 0.6 AICF interest income (0.7) (0.9) Gain on AICF investments (0.4) - ASIC expenses 0.6 1.5 Tax adjustments (0.3) (3.1) Net operating profit excluding asbestos, ASIC expenses and tax adjustments $ 41.6 $ 40.0 |
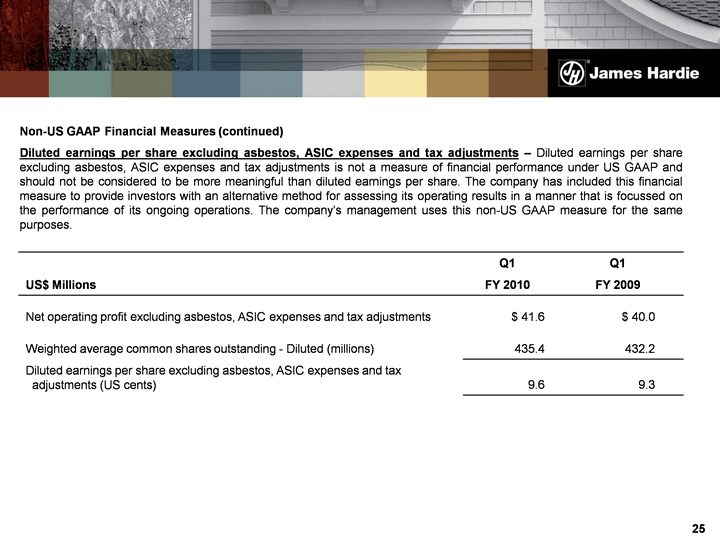
| 25 Non-US GAAP Financial Measures (continued)Diluted earnings per share excluding asbestos, ASIC expenses and tax adjustments - Diluted earnings per share excluding asbestos, ASIC expenses and tax adjustments is not a measure of financial performance under US GAAP and should not be considered to be more meaningful than diluted earnings per share. The company has included this financial measure to provide investors with an alternative method for assessing its operating results in a manner that is focussed on the performance of its ongoing operations. The company's management uses this non-US GAAP measure for the same purposes. Q1 Q1 US$ Millions FY 2010 FY 2009 Net operating profit excluding asbestos, ASIC expenses and tax adjustments $ 41.6 $ 40.0 Weighted average common shares outstanding - Diluted (millions) 435.4 432.2 Diluted earnings per share excluding asbestos, ASIC expenses and tax adjustments (US cents) 9.6 9.3 |
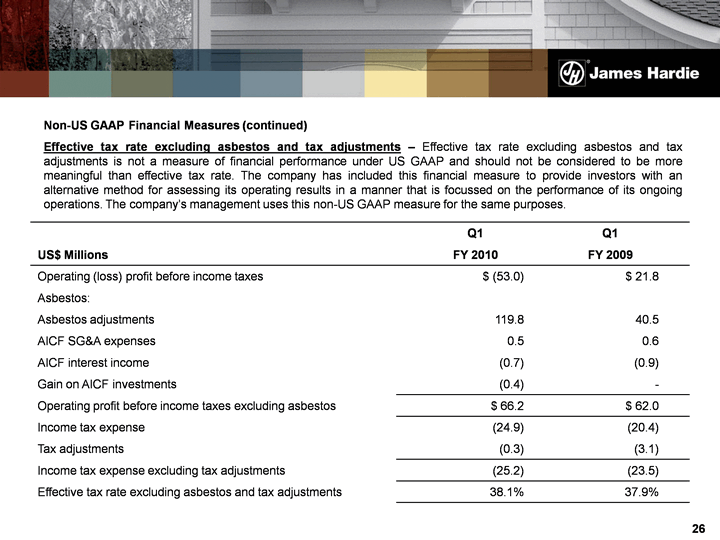
| 26 Non-US GAAP Financial Measures (continued)Effective tax rate excluding asbestos and tax adjustments - Effective tax rate excluding asbestos and tax adjustments is not a measure of financial performance under US GAAP and should not be considered to be more meaningful than effective tax rate. The company has included this financial measure to provide investors with an alternative method for assessing its operating results in a manner that is focussed on the performance of its ongoing operations. The company's management uses this non-US GAAP measure for the same purposes. Q1 Q1 US$ Millions FY 2010 FY 2009 Operating (loss) profit before income taxes $ (53.0) $ 21.8 Asbestos: Asbestos adjustments 119.8 40.5 AICF SG&A expenses 0.5 0.6 AICF interest income (0.7) (0.9) Gain on AICF investments (0.4) - Operating profit before income taxes excluding asbestos $ 66.2 $ 62.0 Income tax expense (24.9) (20.4) Tax adjustments (0.3) (3.1) Income tax expense excluding tax adjustments (25.2) (23.5) Effective tax rate excluding asbestos and tax adjustments 38.1% 37.9% |
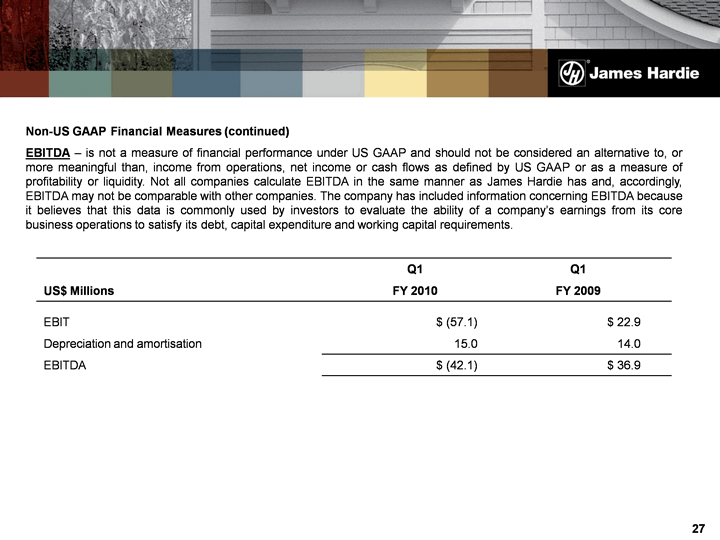
| 27 Non-US GAAP Financial Measures (continued)EBITDA - is not a measure of financial performance under US GAAP and should not be considered an alternative to, or more meaningful than, income from operations, net income or cash flows as defined by US GAAP or as a measure of profitability or liquidity. Not all companies calculate EBITDA in the same manner as James Hardie has and, accordingly, EBITDA may not be comparable with other companies. The company has included information concerning EBITDA because it believes that this data is commonly used by investors to evaluate the ability of a company's earnings from its core business operations to satisfy its debt, capital expenditure and working capital requirements. Q1 Q1 US$ Millions FY 2010 FY 2009 EBIT $ (57.1) $ 22.9 Depreciation and amortisation 15.0 14.0 EBITDA $ (42.1) $ 36.9 |
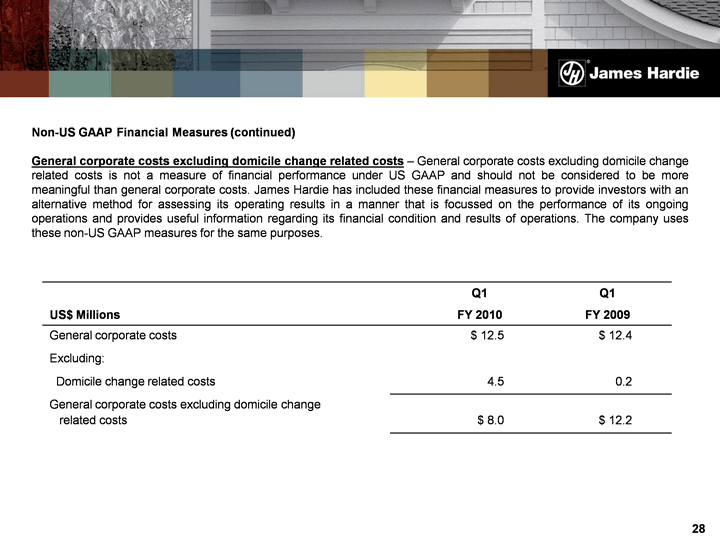
| 28 Non-US GAAP Financial Measures (continued)General corporate costs excluding domicile change related costs - General corporate costs excluding domicile change related costs is not a measure of financial performance under US GAAP and should not be considered to be more meaningful than general corporate costs. James Hardie has included these financial measures to provide investors with an alternative method for assessing its operating results in a manner that is focussed on the performance of its ongoing operations and provides useful information regarding its financial condition and results of operations. The company uses these non-US GAAP measures for the same purposes. Q1 Q1 Q1 Q1 US$ Millions FY 2010 FY 2010 FY 2009 FY 2009 General corporate costs $ 12.5 $ 12.4 Excluding: Domicile change related costs 4.5 0.2 General corporate costs excluding domicile change related costs $ 8.0 $ 12.2 |