

| USA Business Scott Barnett, US Divisional CFO 1 October 2009 |
| 2 Job 1: Drive towards terminal market share while maintaining value pricing Primary Demand Growth Product Mix Shift Zero to the Landfill Job 2: Extend the US fiber cement business model New products New segments Job 3: Move beyond US fiber cement Organic growth opportunity Business Goals |
| 3 Product Leadership Strategy Value Pricing - driven by Product Differentiation Low Fixed Cost/High Capital Efficiency R&D investment Flat management structure Minimize non-strategic costs Manage all costs as variable (except DTI) Key Principles of the James Hardie Business Model |
| 4 Grow market for fiber cement by: Increased focus on repair and remodel market Increased focus in non-metro markets New product development (i.e. panel) Reach smaller decision makers directly with market development programs Full wrap solution (soffit, fascia, trim) Primary Demand Growth |
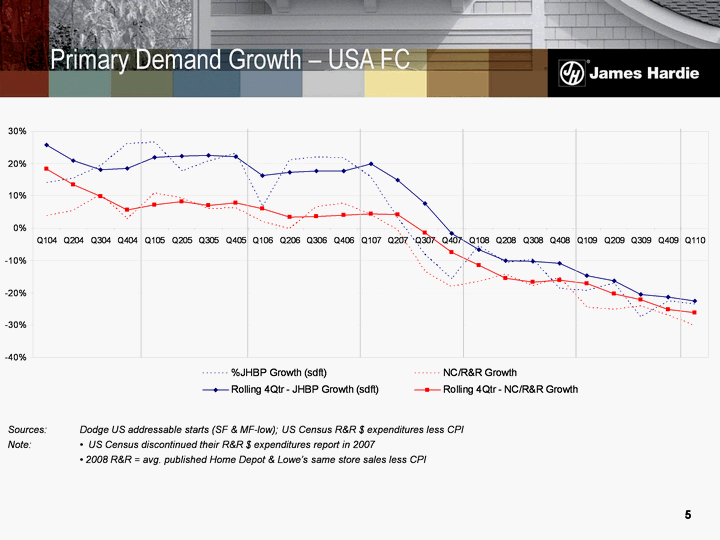
| 5 Sources: Dodge US addressable starts (SF & MF-low); US Census R&R $ expenditures less CPI Note: • US Census discontinued their R&R $ expenditures report in 2007 • 2008 R&R = avg. published Home Depot & Lowe's same store sales less CPI Primary Demand Growth - USA FC |
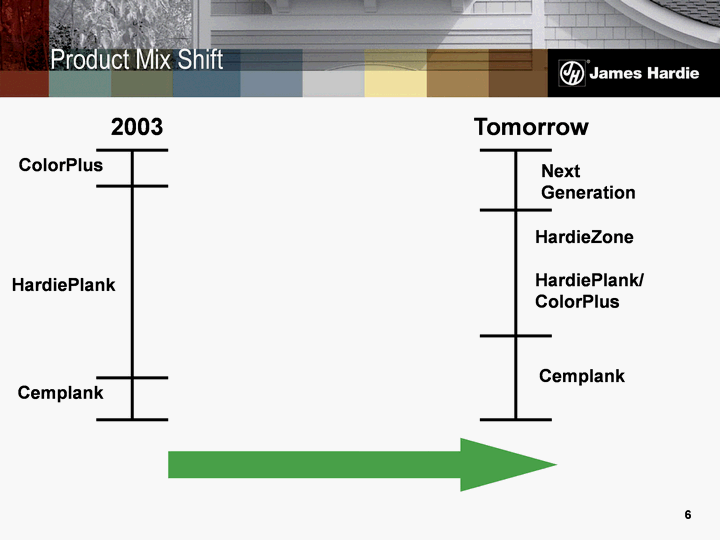
| 6 HardiePlank ColorPlus Cemplank Next Generation Cemplank HardieZone HardiePlank/ ColorPlus 2003 Tomorrow Product Mix Shift |
| 7 Artisan(r) market development C+ house packs in primed fiber cement markets Gain back and maintain big builder share Implement dual multi-family approach Develop commercial market position Product Mix Shift |
| 8 Up until mid 2006, US business model based primarily on growth: Strong engineering and construction focus to build new capacity Higher focus on throughput (denominator) vs. cost controls (numerator) Build support organizations to enable growth R&D investment to support product differentiation strategy Balance out demand with winter inventory builds JH Approach to the Housing Downturn |
| 9 Changes made in late 2006 to address the market decline We developed 3 overarching goals for the business: Increase market share in R&R Maintain or grow contribution margin per unit Reduce organizational cost by at least 10% per annum In order to achieve the 3 goals above, we did the following: Redeploy significant engineering resources to other areas of the business (procurement, maintenance, cost initiatives) in order to retain expertise Reallocated sales resources from new construction metro focus to R&R and high contribution product opportunities Change organizational focus from "EP" growth to contribution per unit Balance supply through proactive shift reductions and down days Manage all costs as variable Management compensation plans realigned around these 3 goals in early 2007 JH Approach to the Housing Downturn (continued) |
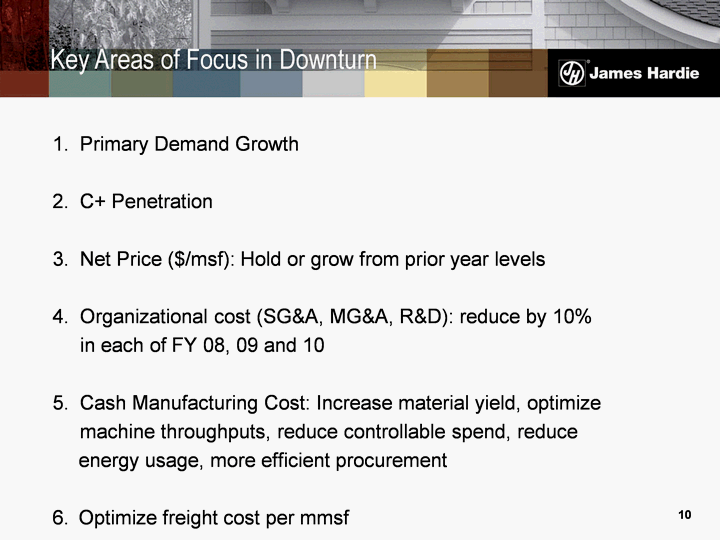
| 10 1. Primary Demand Growth 2. C+ Penetration 3. Net Price ($/msf): Hold or grow from prior year levels 4. Organizational cost (SG&A, MG&A, R&D): reduce by 10% in each of FY 08, 09 and 10 5. Cash Manufacturing Cost: Increase material yield, optimize machine throughputs, reduce controllable spend, reduce energy usage, more efficient procurement 6. Optimize freight cost per mmsf Key Areas of Focus in Downturn |
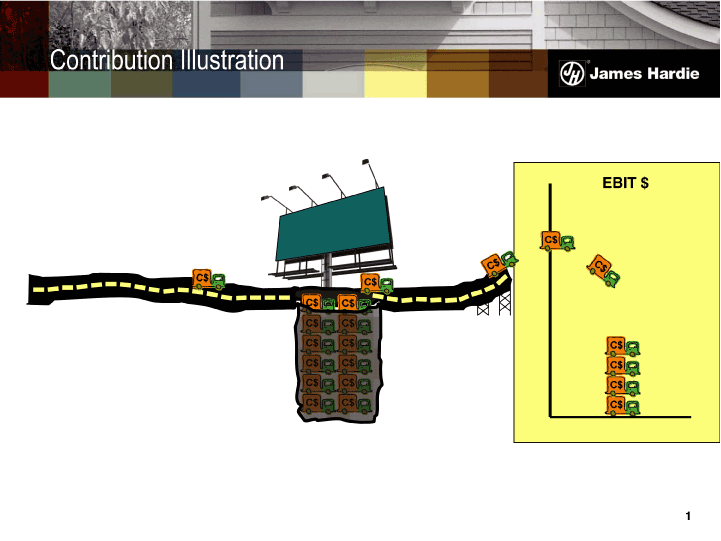
| 11 Septic Tank EBIT $ Contribution Illustration |
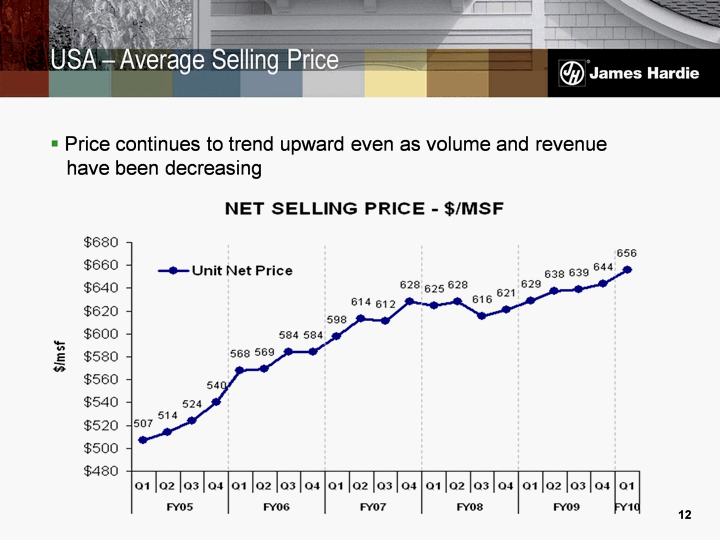
| 12 Price continues to trend upward even as volume and revenue have been decreasing USA - Average Selling Price |
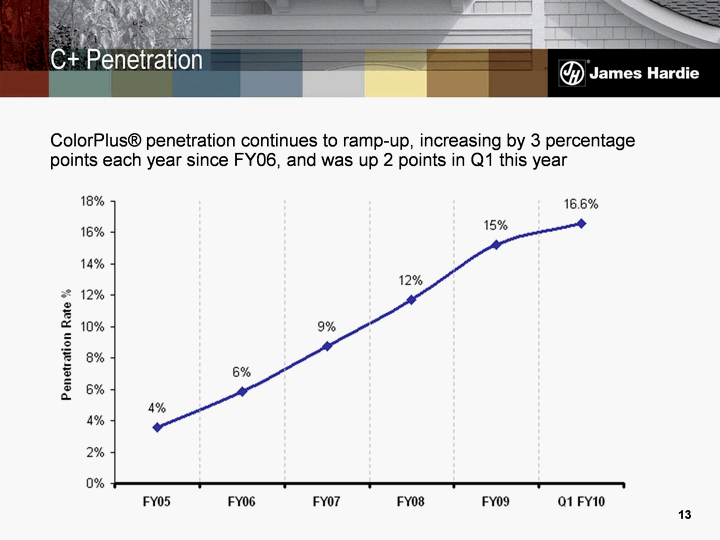
| 13 ColorPlus(r) penetration continues to ramp-up, increasing by 3 percentage points each year since FY06, and was up 2 points in Q1 this year C+ Penetration |
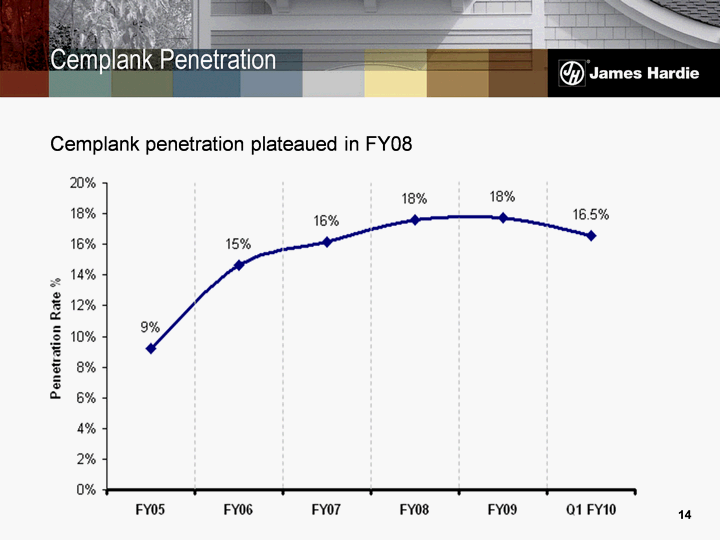
| 14 Cemplank penetration plateaued in FY08 Cemplank Penetration |
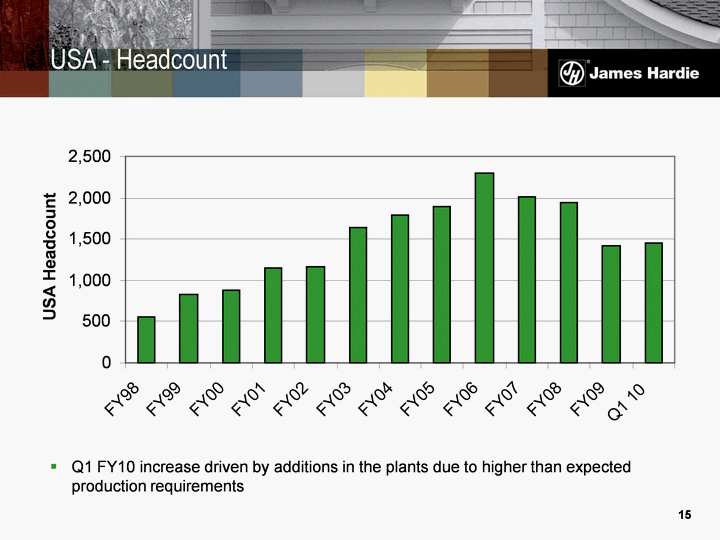
| 15 Q1 FY10 increase driven by additions in the plants due to higher than expected production requirements USA - Headcount 0 500 1,000 1,500 2,000 2,500 FY98 FY99 FY00 FY01 FY02 FY03 FY04 FY05 FY06 FY07 FY08 FY09 Q1 10 USA Headcount |
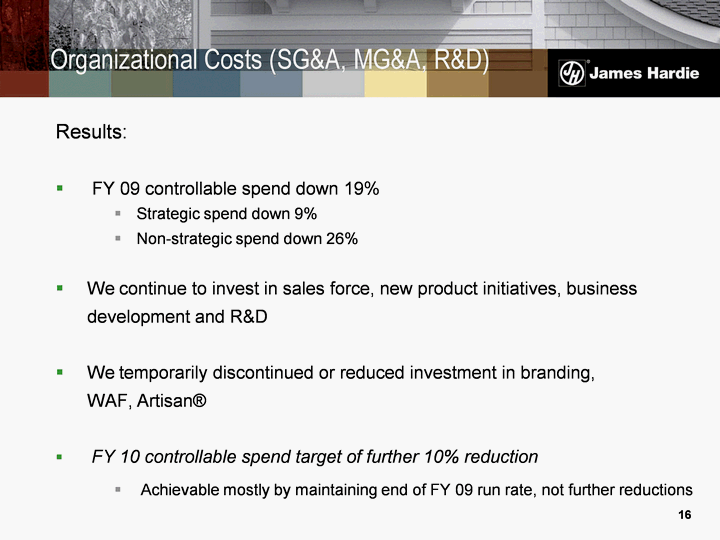
| 16 Results: FY 09 controllable spend down 19% Strategic spend down 9% Non-strategic spend down 26% We continue to invest in sales force, new product initiatives, business development and R&D We temporarily discontinued or reduced investment in branding, WAF, Artisan(r) FY 10 controllable spend target of further 10% reduction Achievable mostly by maintaining end of FY 09 run rate, not further reductions Organizational Costs (SG&A, MG&A, R&D) |

| 17 FY 10 Outlook and Go Forward |
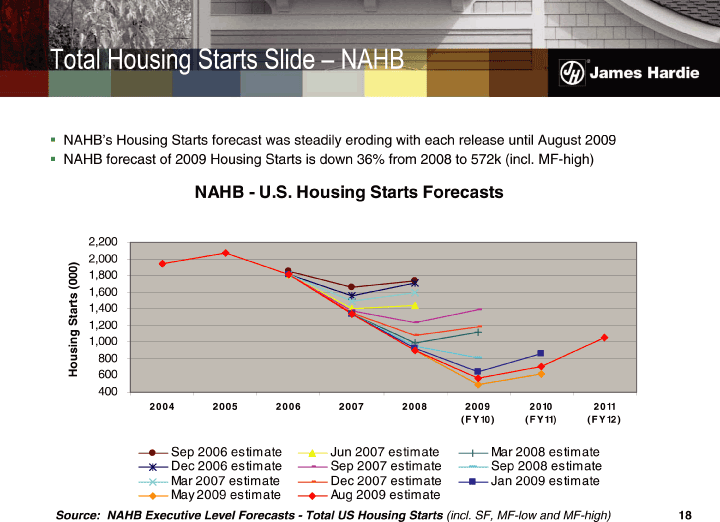
| 18 NAHB's Housing Starts forecast was steadily eroding with each release until August 2009 NAHB forecast of 2009 Housing Starts is down 36% from 2008 to 572k (incl. MF-high) Source: NAHB Executive Level Forecasts - Total US Housing Starts (incl. SF, MF-low and MF-high) Total Housing Starts Slide - NAHB |
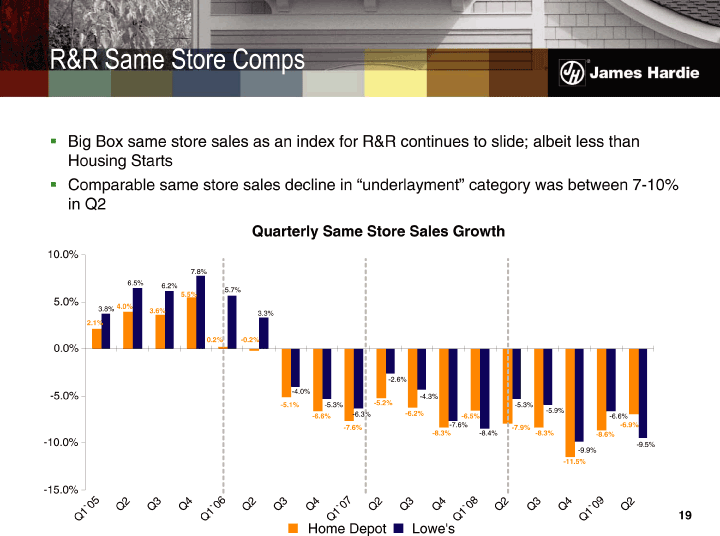
| 19 Big Box same store sales as an index for R&R continues to slide; albeit less than Housing Starts Comparable same store sales decline in "underlayment" category was between 7-10% in Q2 R&R Same Store Comps Quarterly Same Store Sales Growth 2.1% 4.0% 3.6% 5.5% - -5.1% - -6.6% - -7.6% - -5.2% - -6.2% - -8.3% - -6.5% - -7.9% - -8.3% - -11.5% - -8.6% 3.8% 6.5% 6.2% 7.8% 5.7% 3.3% - -4.0% - -5.3% - -6.3% - -2.6% - -4.3% - -7.6% - -8.4% - -5.3% - -5.9% - -9.9% - -6.6% - -6.9% 0.2% - -0.2% - -9.5% - -15.0% - -10.0% - -5.0% 0.0% 5.0% 10.0% Q1'05 Q2 Q3 Q4 Q1'06 Q2 Q3 Q4 Q1'07 Q2 Q3 Q4 Q1'08 Q2 Q3 Q4 Q1'09 Q2 Home Depot Lowe's |
| 20 Our performance in a declining market has proven out our differentiated product strategy and company capability: Plants should be able to see leverage in maintenance spending and labor but will have to adapt to increasingly complex product mix. A lot of our plan success to date has been around minimizing rejects, maximizing raw material yield and eliminating wasteful spending Certain parts of the business will flex up (product marketing, manufacturing) but many should be able to manage the increasing size of the business at or near existing levels of manning/spending Focus will be on adding back value-creating costs but not adding back waste Looking Forward |