Exhibit 99.4

| Q3 FY10 Management Presentation 11 February 2010 |
| Q3 FY10 Management Presentation 11 February 2010 |

| Disclaimer This Management Presentation contains forward-looking statements. James Hardie may from time to time make forward-looking statements in its periodic reports filed with or furnished to the United States Securities and Exchange Commission on Forms 20-F and 6-K, in the annual reports to shareholders, in offering circulars, invitation memoranda and prospectuses, in media releases and other written materials and in oral statements made by the Company's officers, directors or employees to analysts, institutional investors, existing and potential lenders, representatives of the media and others. Statements that are not historical facts are forward-looking statements and such forward-looking statements are statements made pursuant to the Safe Harbor Provisions of the Private Securities Litigation Reform Act of 1995. Examples of forward-looking statements include: statements about the Company's future performance; projections of the Company's results of operations or financial condition; statements regarding the Company's plans, objectives or goals, including those relating to its strategies, initiatives, competition, acquisitions, dispositions and/or its products; expectations concerning the costs associated with the suspension or closure of operations at any of the Company's plants and future plans with respect to any such plants; expectations that the Company's credit facilities will be extended or renewed; expectations concerning dividend payments; statements concerning the Company's corporate and tax domiciles and potential changes to them, including potential tax charges; statements regarding tax liabilities and related audits, reviews and proceedings; statements as to the possible consequences of proceedings brought against the Company and certain of its former directors and officers by the ASIC; expectations about the timing and amount of contributions to the AICF, a special purpose fund for the compensation of proven Australian asbestos-related personal injury and death claims; expectations concerning indemnification obligations; and statements about product or environmental liabilities. Words such as "believe," "anticipate," "plan," "expect," "intend," "target," "estimate," "project," "predict," "forecast," "guideline," "aim," "will," "should," "continue" and similar expressions are intended to identify forward-looking statements but are not the exclusive means of identifying such statements. Readers are cautioned not to place undue reliance on these forward-looking statements and all such forward-looking statements are qualified in their entirety by reference to the following cautionary statements. Forward-looking statements are based on the Company's estimates and assumptions and because forward-looking statements address future results, events and conditions, they, by their very nature, involve inherent risks and uncertainties. Such known and unknown risks, uncertainties and other factors may cause the Company's actual results, performance or other achievements to differ materially from the anticipated results, performance or achievements expressed, projected or implied by these forward-looking statements. These factors, some of which are discussed under "Key Information - Risk Factors" beginning on page 6 of the Form 20-F filed with the US Securities and Exchange Commission on 25 June 2009, include, but are not limited to: all matters relating to or arising out of the prior manufacture of products that contained asbestos by current and former James Hardie subsidiaries; required contributions to the AICF, any shortfall in the AICF and the effect of currency exchange rate movements on the amount recorded in the Company's financial statements as an asbestos liability; compliance with and changes in tax laws and treatments; competition and product pricing in the markets in which the Company operates; the consequences of product failures or defects; exposure to environmental, asbestos or other legal proceedings; general economic and market conditions; the supply and cost of raw materials; the success of research and development efforts; reliance on a small number of customers; a customer's inability to pay; compliance with and changes in environmental and health and safety laws; risks of conducting business internationally; the Company's pending transformation to a Dutch "SE" company and proposal to transfer its corporate domicile from The Netherlands to Ireland to become an Irish "SE" company; compliance with and changes in laws and regulations; currency exchange risks; the concentration of the Company's customer base on large format retail customers, distributors and dealers; the effect of natural disasters; changes in the Company's key management personnel; inherent limitations on internal controls; use of accounting estimates; and all other risks identified in the Company's reports filed with Australian, Dutch and US securities agencies and exchanges (as appropriate). The Company cautions that the foregoing list of factors is not exhaustive and that other risks and uncertainties may cause actual results to differ materially from those in forward-looking statements. Forward-looking statements speak only as of the date they are made and are statements of the Company's current expectations concerning future results, events and conditions. 2 |
| Overview and Operating Review - Louis Gries, CEO Financial Review - Russell Chenu, CFO Questions and Answers Agenda In this Management Presentation, James Hardie may present financial measures, sales volume terms, financial ratios, and Non-US GAAP financial measures included in the Definitions section of this document starting on page 49. The company presents financial measures that it believes are customarily used by its Australian investors. Specifically, these financial measures, which are equivalent to or derived from certain US GAAP measures as explained in the definitions, include "EBIT", "EBIT margin", "Operating profit" and "Net operating profit". The company may also present other terms for measuring its sales volumes ("million square feet or mmsf" and "thousand square feet or msf"); financial ratios ("Gearing ratio", "Net interest expense cover", "Net interest paid cover", "Net debt payback", "Net debt (cash)"); and Non-US GAAP financial measures ("EBIT excluding asbestos and ASIC expenses", "EBIT margin excluding asbestos and ASIC expenses", "Net operating profit excluding asbestos, ASIC expenses and tax adjustments", "Diluted earnings per share excluding asbestos, ASIC expenses, and tax adjustments", "Operating profit before income taxes excluding asbestos", "Effective tax rate excluding asbestos and tax adjustments", "EBITDA" and "General corporate costs excluding domicile change related costs"). Unless otherwise stated, results and comparisons are of the 3rd quarter and nine months of the current fiscal year versus the 3rd quarter and nine months of the prior fiscal year. 3 |

| Operating Review Louis Gries, CEO |
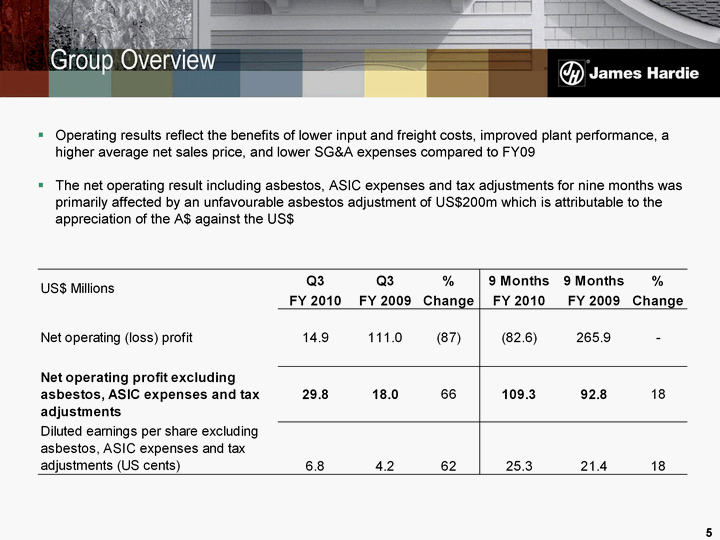
| Group Overview Operating results reflect the benefits of lower input and freight costs, improved plant performance, a higher average net sales price, and lower SG&A expenses compared to FY09 The net operating result including asbestos, ASIC expenses and tax adjustments for nine months was primarily affected by an unfavourable asbestos adjustment of US$200m which is attributable to the appreciation of the A$ against the US$ 5 |
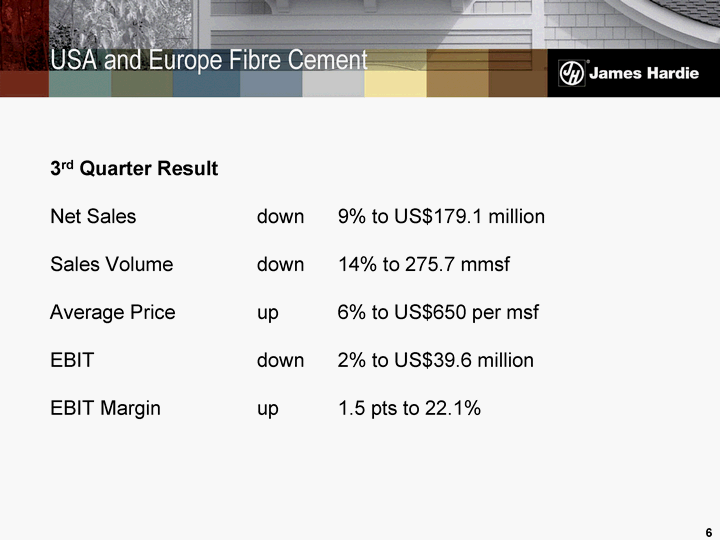
| 3rd Quarter Result Net Sales down 9% to US$179.1 million Sales Volume down 14% to 275.7 mmsf Average Price up 6% to US$650 per msf EBIT down 2% to US$39.6 million EBIT Margin up 1.5 pts to 22.1% USA and Europe Fibre Cement 6 |
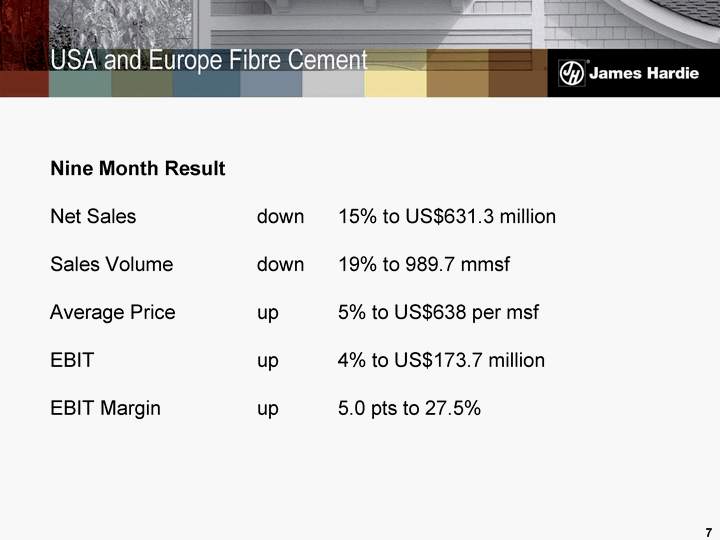
| Nine Month Result Net Sales down 15% to US$631.3 million Sales Volume down 19% to 989.7 mmsf Average Price up 5% to US$638 per msf EBIT up 4% to US$173.7 million EBIT Margin up 5.0 pts to 27.5% USA and Europe Fibre Cement 7 |
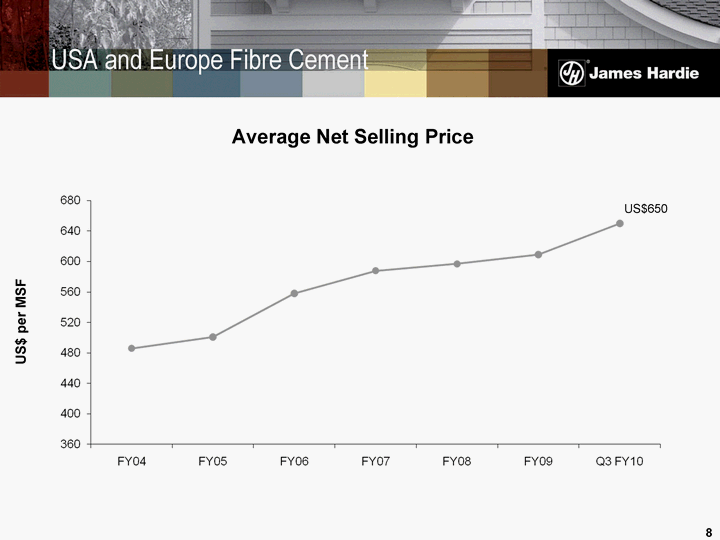
| Average Net Selling Price US$ per MSF USA and Europe Fibre Cement US$650 8 |
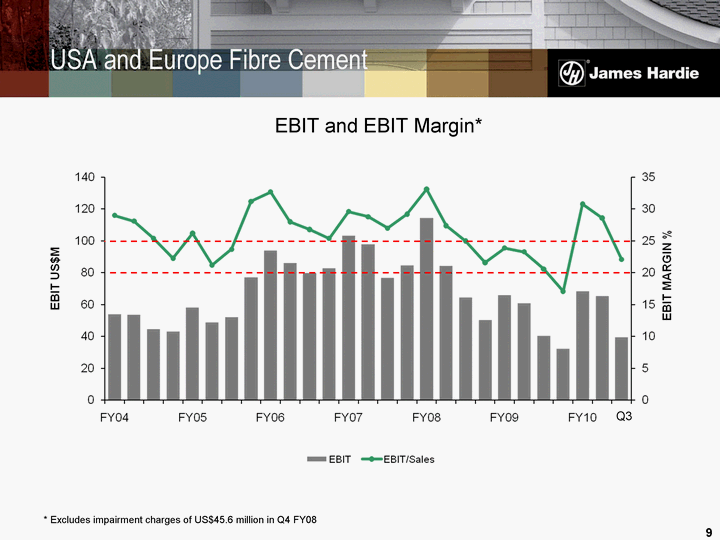
| USA and Europe Fibre Cement * Excludes impairment charges of US$45.6 million in Q4 FY08 9 EBIT and EBIT Margin* Q3 |
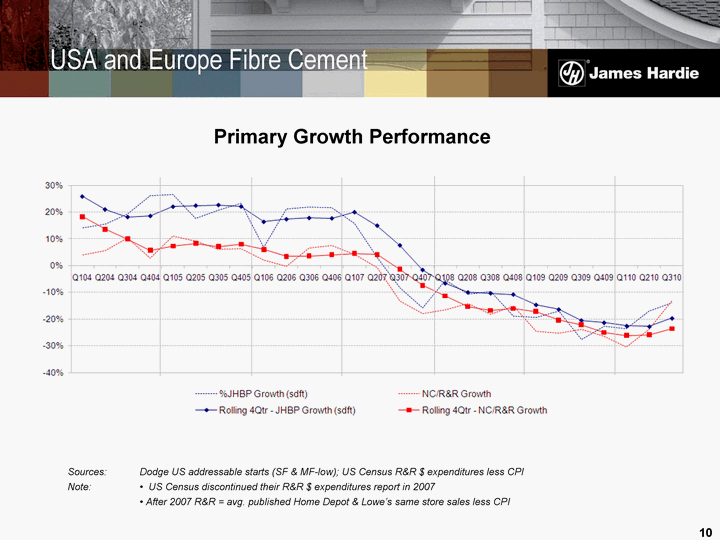
| USA and Europe Fibre Cement Primary Growth Performance Sources: Dodge US addressable starts (SF & MF-low); US Census R&R $ expenditures less CPI Note: • US Census discontinued their R&R $ expenditures report in 2007 • After 2007 R&R = avg. published Home Depot & Lowe's same store sales less CPI 10 |
| 11 Nigel Rigby is now responsible for the US business Mark Fisher is now responsible for research and development, engineering, manufacturing, logistics and product management, as well as the company's non-US businesses The restructure is designed to better position the company for the recovery in the US market, and to facilitate an increased focus on top line growth The former Senior Leadership Team is transitioning into the Group Management Team, consisting of: Louis Gries, Russell Chenu, Nigel Rigby, Mark Fisher, Robert Cox and Sean O'Sullivan Management Restructure The company has restructured its senior management team: |
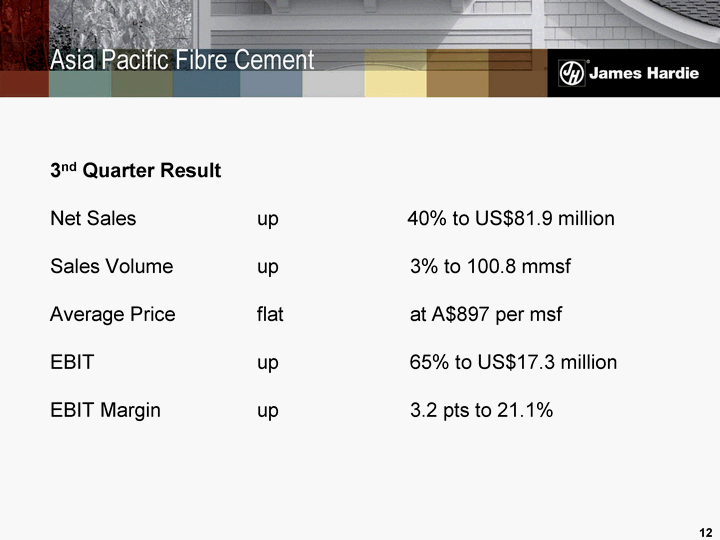
| 3nd Quarter Result Net Sales up 40% to US$81.9 million Sales Volume up 3% to 100.8 mmsf Average Price flat at A$897 per msf EBIT up 65% to US$17.3 million EBIT Margin up 3.2 pts to 21.1% Asia Pacific Fibre Cement 12 |

| Nine Month Result Net Sales down 1% to US$218.4 million Sales Volume down 3% to 292.1 mmsf Average Price up 2% to A$897 per msf EBIT up 10% to US$44.4 million EBIT Margin up 2 pts to 20.3% Asia Pacific Fibre Cement 13 |
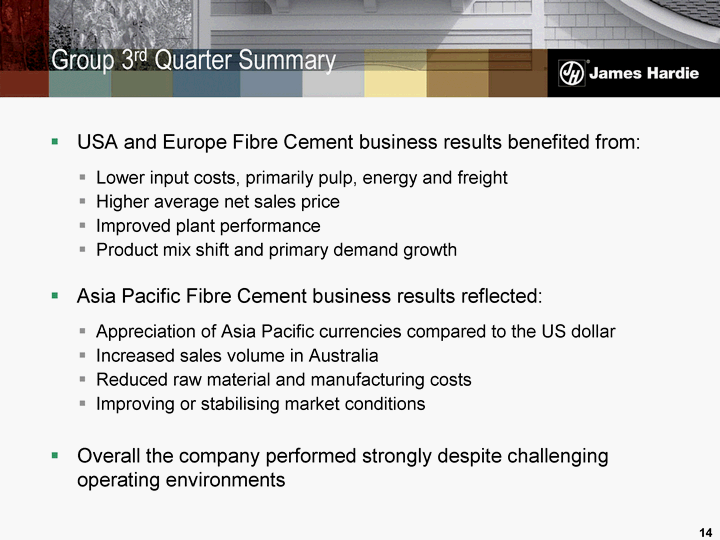
| USA and Europe Fibre Cement business results benefited from: Lower input costs, primarily pulp, energy and freight Higher average net sales price Improved plant performance Product mix shift and primary demand growth Asia Pacific Fibre Cement business results reflected: Appreciation of Asia Pacific currencies compared to the US dollar Increased sales volume in Australia Reduced raw material and manufacturing costs Improving or stabilising market conditions Overall the company performed strongly despite challenging operating environments Group 3rd Quarter Summary 14 |
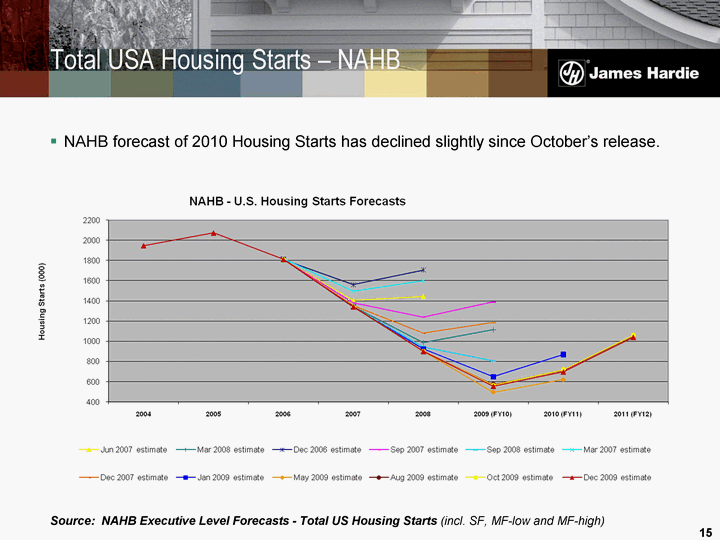
| Total USA Housing Starts - NAHB NAHB forecast of 2010 Housing Starts has declined slightly since October's release. Source: NAHB Executive Level Forecasts - Total US Housing Starts (incl. SF, MF-low and MF-high) 15 |
| United States The outlook for residential construction remains uncertain with recent data presenting mixed indications as to the extent and sustainability of the anticipated recovery Challenges remain, including: Restricted access to credit for prospective home owners Weak and deteriorating employment markets An expected increase in the supply of foreclosed homes in the next 12 months Expiry of home owners tax credit at the end of April 2010 However, some positives are emerging including: Improvements in housing affordability A modest recovery in consumer confidence An increase in building permit applications Group Outlook 16 |
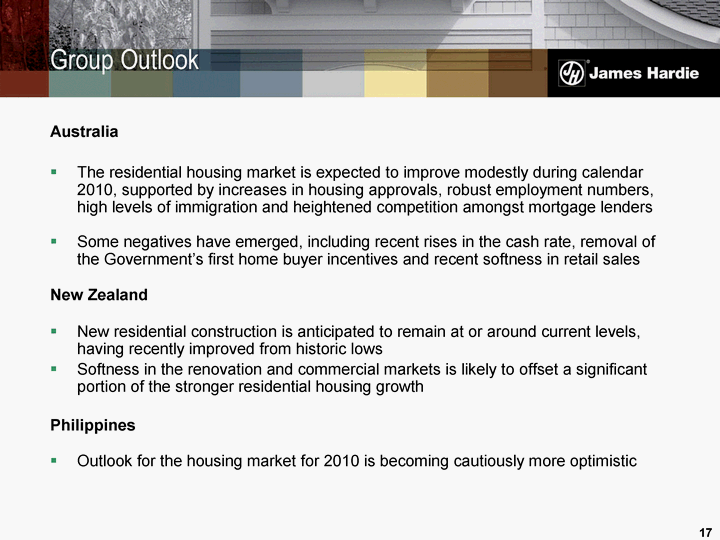
| Australia The residential housing market is expected to improve modestly during calendar 2010, supported by increases in housing approvals, robust employment numbers, high levels of immigration and heightened competition amongst mortgage lenders Some negatives have emerged, including recent rises in the cash rate, removal of the Government's first home buyer incentives and recent softness in retail sales New Zealand New residential construction is anticipated to remain at or around current levels, having recently improved from historic lows Softness in the renovation and commercial markets is likely to offset a significant portion of the stronger residential housing growth Philippines Outlook for the housing market for 2010 is becoming cautiously more optimistic Group Outlook 17 |
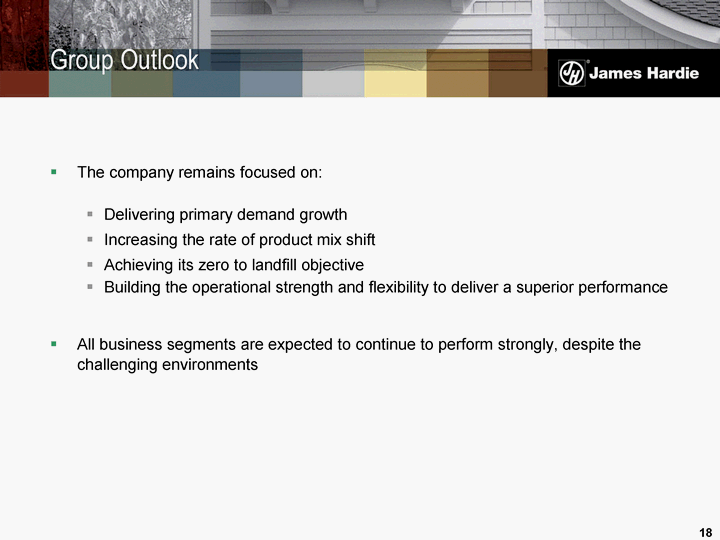
| The company remains focused on: Delivering primary demand growth Increasing the rate of product mix shift Achieving its zero to landfill objective Building the operational strength and flexibility to deliver a superior performance All business segments are expected to continue to perform strongly, despite the challenging environments Group Outlook 18 |

| Financial Review Russell Chenu, CFO |
| Overview Results continue to be affected by weak housing construction activity, particularly in the US Earnings in the quarter benefited from lower input costs, higher average net selling prices, lower SG&A and the strength of Asia Pacific currencies, when compared to the third quarter of FY09 Strong net cash flow generation in the quarter and year to date has enabled a reduction in net debt of US$140.8 million to US$140.8 million All businesses performed strongly in continuing difficult operating environments 20 |
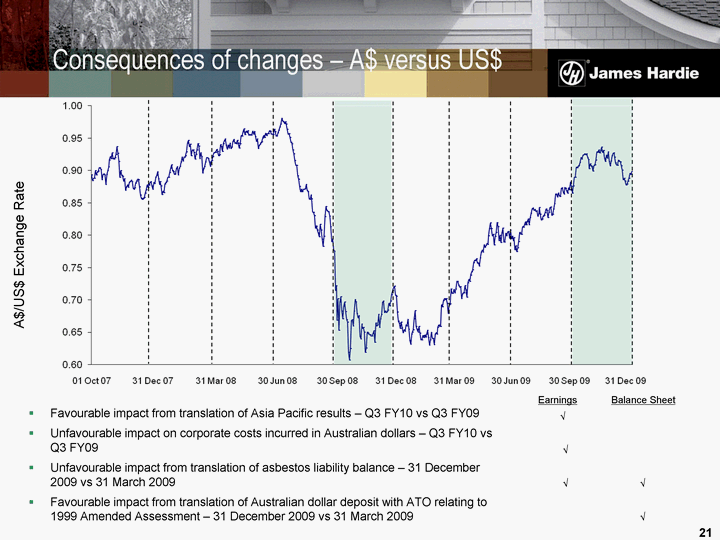
| Consequences of changes - A$ versus US$ A$/US$ Exchange Rate Favourable impact from translation of Asia Pacific results - Q3 FY10 vs Q3 FY09 Unfavourable impact on corporate costs incurred in Australian dollars - Q3 FY10 vs Q3 FY09 Unfavourable impact from translation of asbestos liability balance - 31 December 2009 vs 31 March 2009 Favourable impact from translation of Australian dollar deposit with ATO relating to 1999 Amended Assessment - 31 December 2009 vs 31 March 2009 Earnings Balance Sheet ^ ^ ^ ^ ^ 21 |
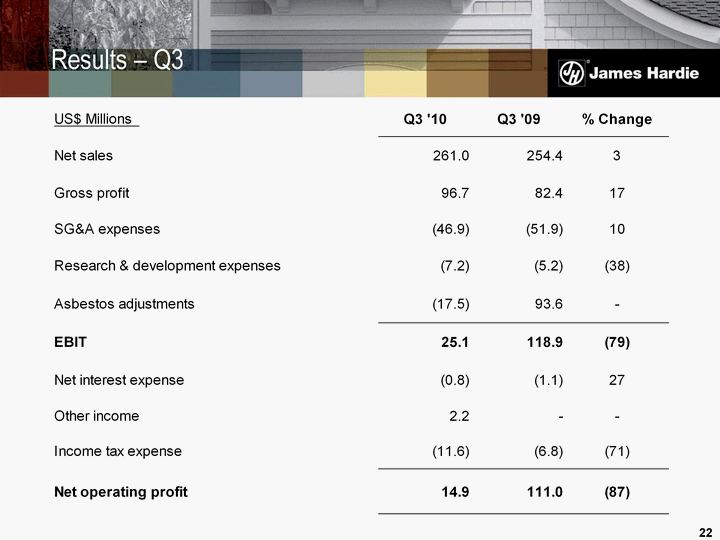
| Results - Q3 22 |
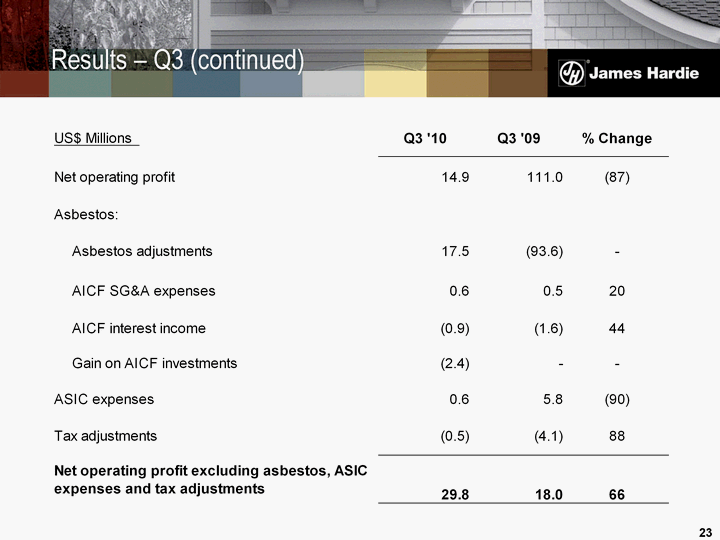
| Results - Q3 (continued) 23 |
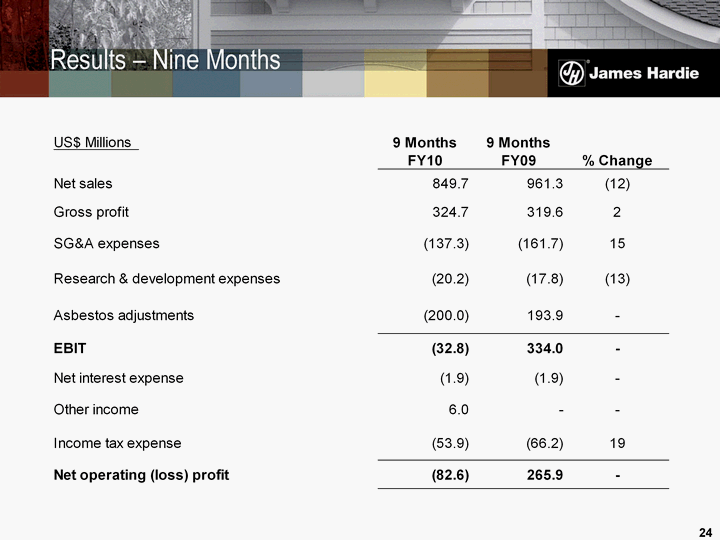
| Results - Nine Months 24 |
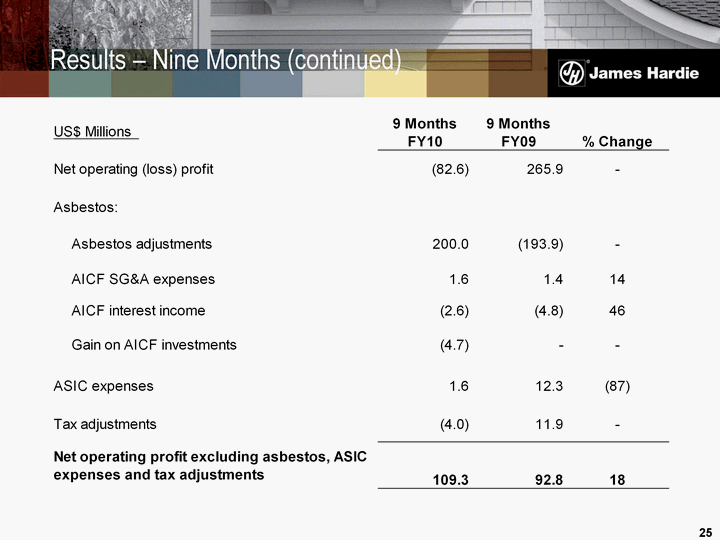
| Results - Nine Months (continued) 25 |
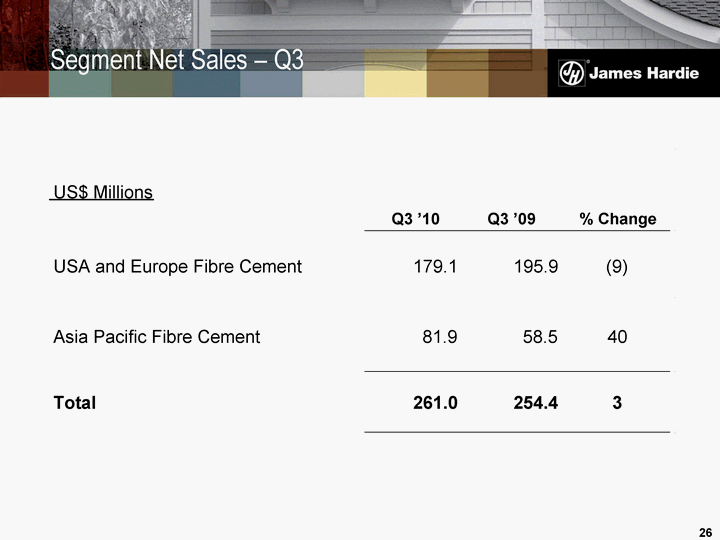
| Segment Net Sales - Q3 26 US$ Millions Q3 '10 Q3 '09 % Change USA and Europe Fibre Cement 179.1 195.9 (9) Asia Pacific Fibre Cement 81.9 58.5 40 Total 261.0 254.4 3 |
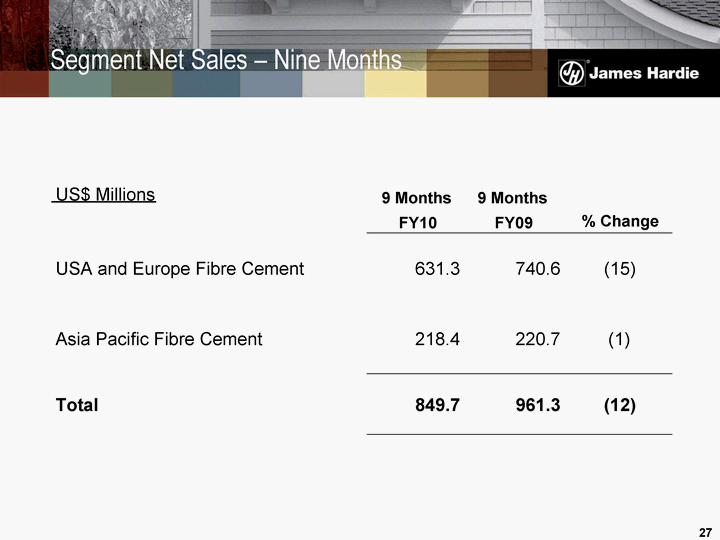
| Segment Net Sales - Nine Months 27 US$ Millions 9 Months FY10 9 Months FY09 % Change USA and Europe Fibre Cement 631.3 740.6 (15) Asia Pacific Fibre Cement 218.4 220.7 (1) Total 849.7 961.3 (12) |

| 1 Research & development includes "core" research & development expenses and administrative expenses, but excludes product development expenses Segment EBIT - Q3 28 |
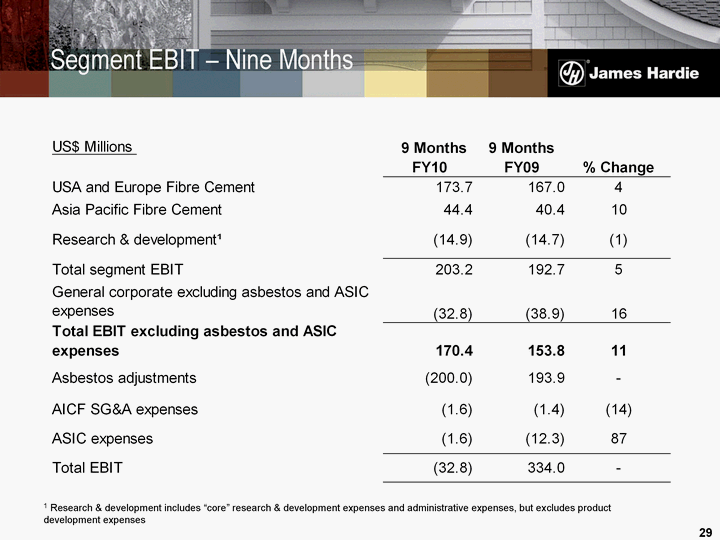
| 1 Research & development includes "core" research & development expenses and administrative expenses, but excludes product development expenses Segment EBIT - Nine Months 29 |

| Income Tax Expense - Q3 30 |
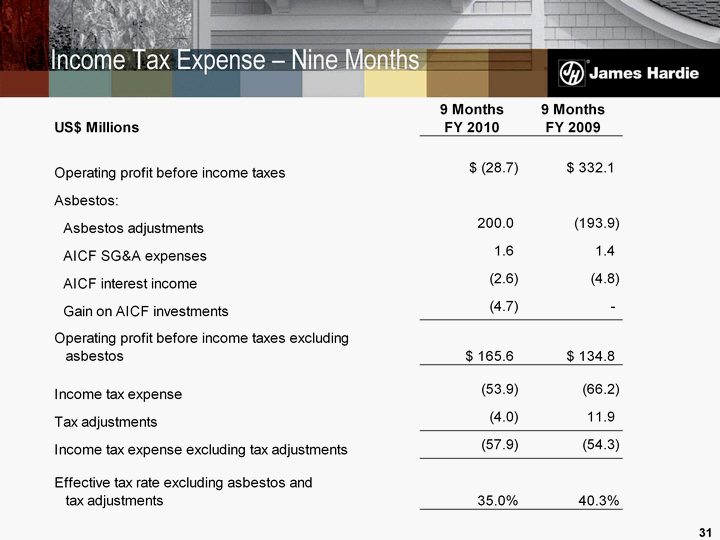
| Income Tax Expense - Nine Months 31 |
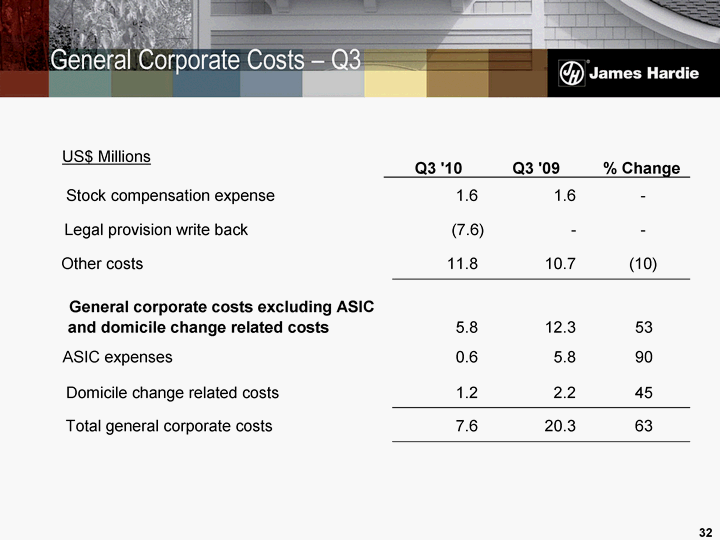
| General Corporate Costs - Q3 32 US$ Millions % Change Stock compensation expense 1.6 1.6 - - Legal provision write back (7.6) - - - Other costs 11.8 10.7 (10) General corporate costs excluding ASIC and domicile change related costs 5.8 12.3 53 ASIC expenses 0.6 5.8 90 Domicile change related costs 1.2 2.2 45 Total general corporate costs 7.6 20.3 63 Q3 '10 Q3 '09 |
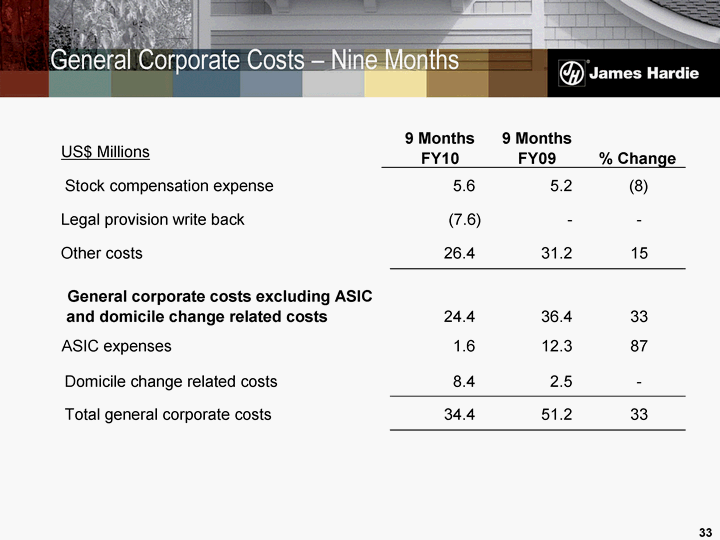
| General Corporate Costs - Nine Months 33 US$ Millions % Change Stock compensation expense 5.6 5.2 (8) Legal provision write back (7.6) - - - Other costs 26.4 31.2 15 General corporate costs excluding ASIC and domicile change related costs 24.4 36.4 33 ASIC expenses 1.6 12.3 87 Domicile change related costs 8.4 2.5 - - Total general corporate costs 34.4 51.2 33 9 Months FY10 9 Months FY09 |
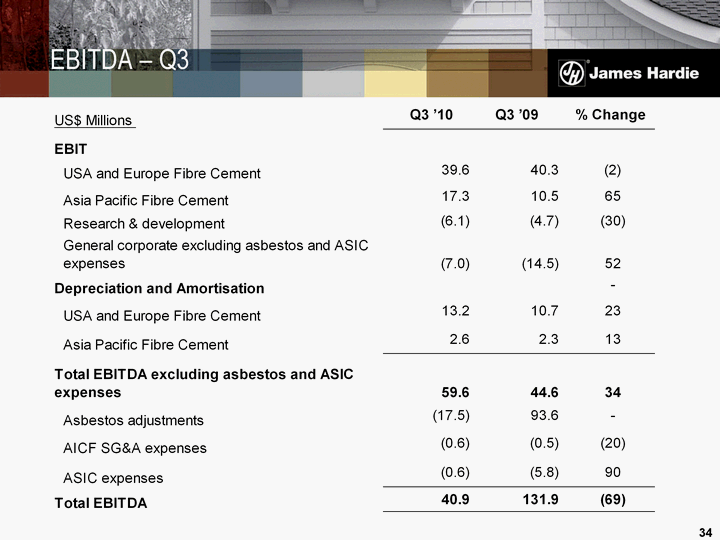
| EBITDA - Q3 34 |
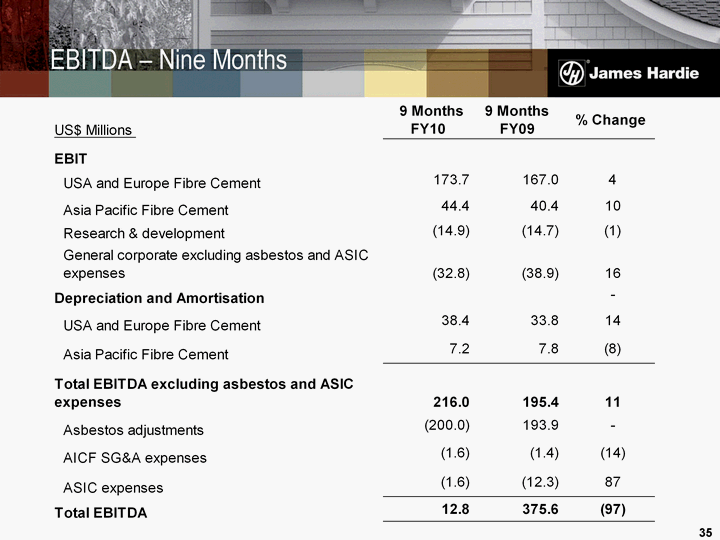
| EBITDA - Nine Months 35 |
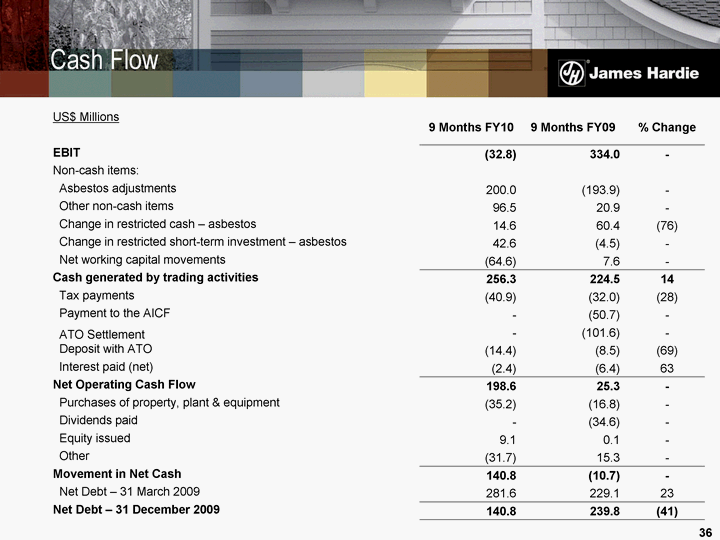
| Cash Flow 36 US$ Millions 9 Months FY10 9 Months FY09 % Change EBIT (32.8) 334.0 - Non-cash items: Asbestos adjustments 200.0 (193.9) - Other non-cash items 96.5 20.9 - Change in restricted cash - asbestos 14.6 60.4 (76) Change in restricted short-term investment - asbestos 42.6 (4.5) - Net working capital movements (64.6) 7.6 - Cash generated by trading activities 256.3 224.5 14 Tax payments (40.9) (32.0) (28) Payment to the AICF - (50.7) - ATO Settlement - (101.6) - Deposit with ATO (14.4) (8.5) (69) Interest paid (net) (2.4) (6.4) 63 Net Operating Cash Flow 198.6 25.3 - Purchases of property, plant & equipment (35.2) (16.8) - Dividends paid - (34.6) - Equity issued 9.1 0.1 - Other (31.7) 15.3 - Movement in Net Cash 140.8 (10.7) - Net Debt - 31 March 2009 281.6 229.1 23 Net Debt - 31 December 2009 140.8 239.8 (41) |
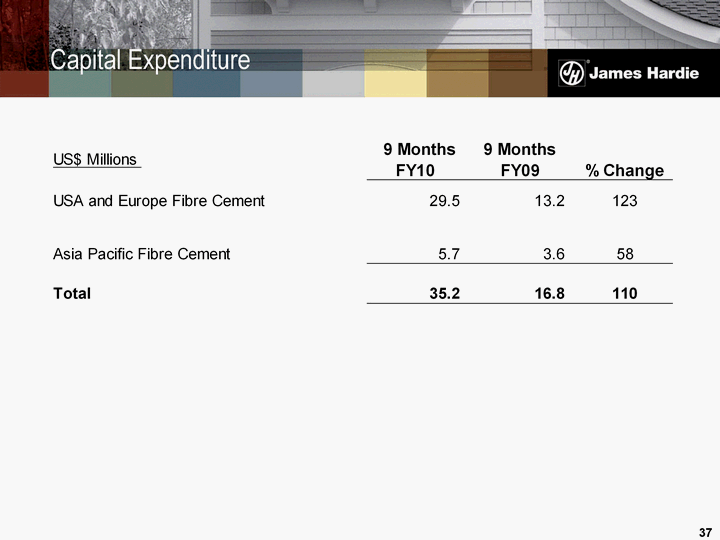
| Capital Expenditure 37 |
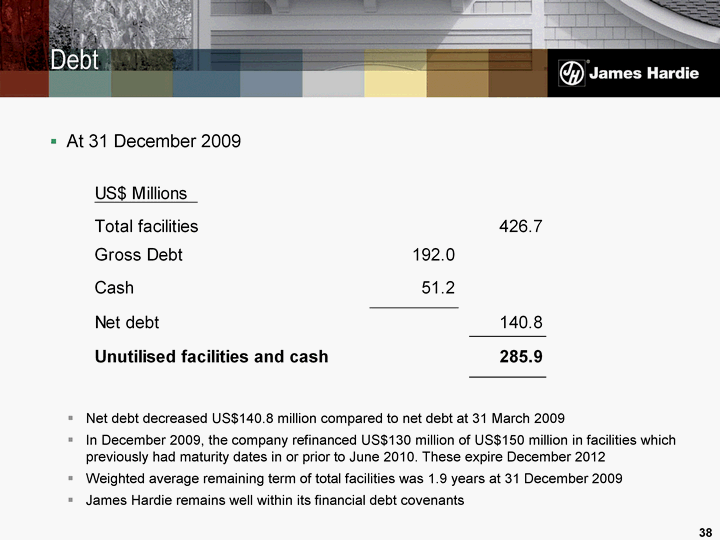
| Debt Net debt decreased US$140.8 million compared to net debt at 31 March 2009 In December 2009, the company refinanced US$130 million of US$150 million in facilities which previously had maturity dates in or prior to June 2010. These expire December 2012 Weighted average remaining term of total facilities was 1.9 years at 31 December 2009 James Hardie remains well within its financial debt covenants At 31 December 2009 38 |
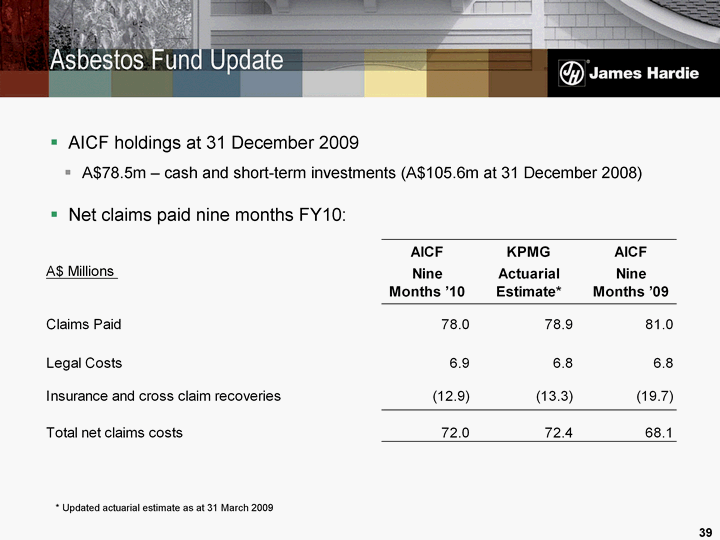
| AICF holdings at 31 December 2009 A$78.5m - cash and short-term investments (A$105.6m at 31 December 2008) Net claims paid nine months FY10: * Updated actuarial estimate as at 31 March 2009 Asbestos Fund Update 39 |
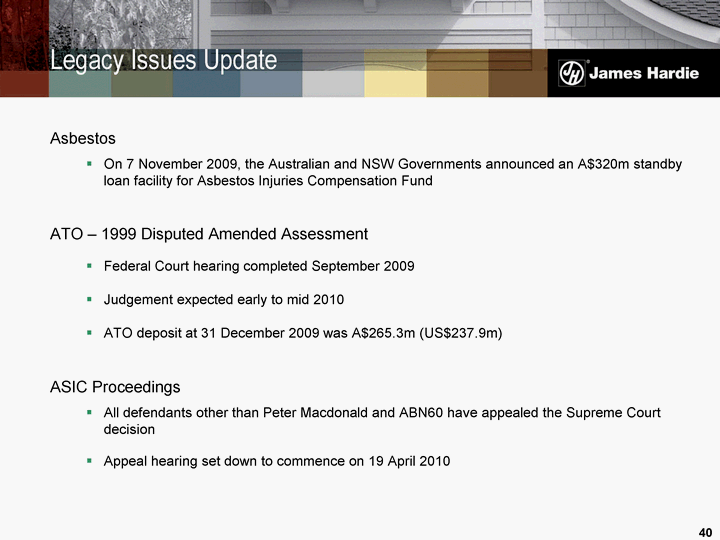
| Legacy Issues Update Asbestos On 7 November 2009, the Australian and NSW Governments announced an A$320m standby loan facility for Asbestos Injuries Compensation Fund ATO - 1999 Disputed Amended Assessment Federal Court hearing completed September 2009 Judgement expected early to mid 2010 ATO deposit at 31 December 2009 was A$265.3m (US$237.9m) ASIC Proceedings All defendants other than Peter Macdonald and ABN60 have appealed the Supreme Court decision Appeal hearing set down to commence on 19 April 2010 40 |
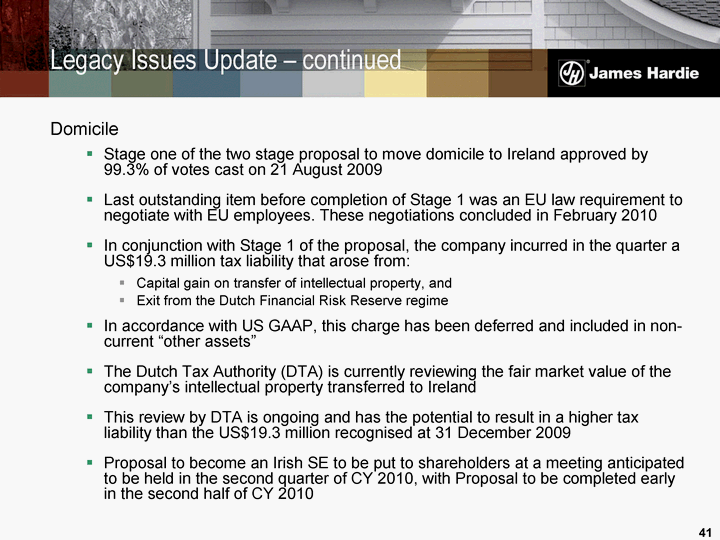
| Legacy Issues Update - continued Domicile Stage one of the two stage proposal to move domicile to Ireland approved by 99.3% of votes cast on 21 August 2009 Last outstanding item before completion of Stage 1 was an EU law requirement to negotiate with EU employees. These negotiations concluded in February 2010 In conjunction with Stage 1 of the proposal, the company incurred in the quarter a US$19.3 million tax liability that arose from: Capital gain on transfer of intellectual property, and Exit from the Dutch Financial Risk Reserve regime In accordance with US GAAP, this charge has been deferred and included in non- current "other assets" The Dutch Tax Authority (DTA) is currently reviewing the fair market value of the company's intellectual property transferred to Ireland This review by DTA is ongoing and has the potential to result in a higher tax liability than the US$19.3 million recognised at 31 December 2009 Proposal to become an Irish SE to be put to shareholders at a meeting anticipated to be held in the second quarter of CY 2010, with Proposal to be completed early in the second half of CY 2010 41 |
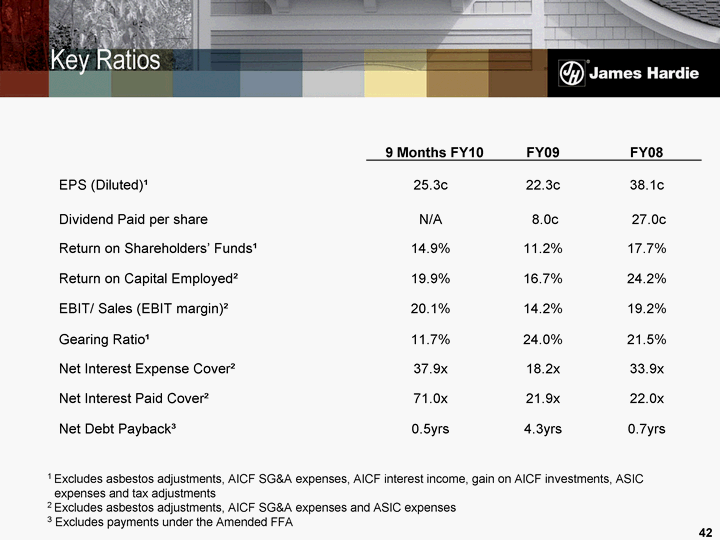
| Key Ratios 1 Excludes asbestos adjustments, AICF SG&A expenses, AICF interest income, gain on AICF investments, ASIC expenses and tax adjustments 2 Excludes asbestos adjustments, AICF SG&A expenses and ASIC expenses 3 Excludes payments under the Amended FFA 42 9 Months FY10 FY09 FY08 EPS (Diluted)1 25.3c 22.3c 38.1c Dividend Paid per share N/A 8.0c 27.0c Return on Shareholders' Funds1 14.9% 11.2% 17.7% Return on Capital Employed2 19.9% 16.7% 24.2% EBIT/ Sales (EBIT margin)2 20.1% 14.2% 19.2% Gearing Ratio1 11.7% 24.0% 21.5% Net Interest Expense Cover2 37.9x 18.2x 33.9x Net Interest Paid Cover2 71.0x 21.9x 22.0x Net Debt Payback3 0.5yrs 4.3yrs 0.7yrs |
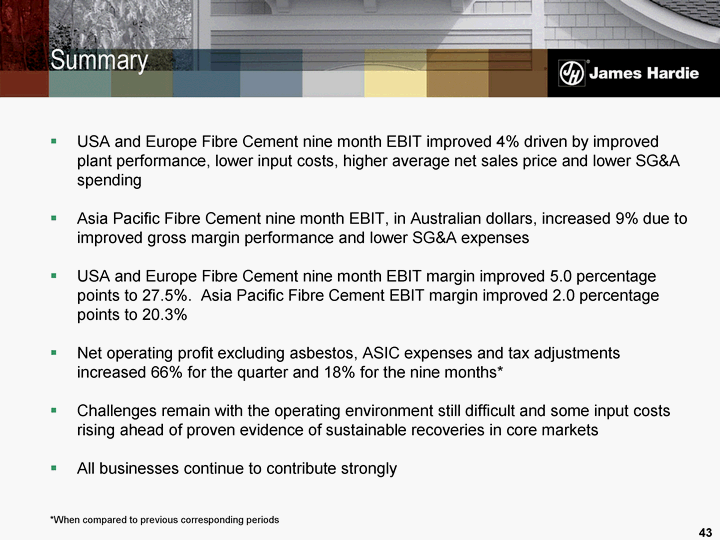
| USA and Europe Fibre Cement nine month EBIT improved 4% driven by improved plant performance, lower input costs, higher average net sales price and lower SG&A spending Asia Pacific Fibre Cement nine month EBIT, in Australian dollars, increased 9% due to improved gross margin performance and lower SG&A expenses USA and Europe Fibre Cement nine month EBIT margin improved 5.0 percentage points to 27.5%. Asia Pacific Fibre Cement EBIT margin improved 2.0 percentage points to 20.3% Net operating profit excluding asbestos, ASIC expenses and tax adjustments increased 66% for the quarter and 18% for the nine months* Challenges remain with the operating environment still difficult and some input costs rising ahead of proven evidence of sustainable recoveries in core markets All businesses continue to contribute strongly Summary *When compared to previous corresponding periods 43 |

| Questions & Answers 44 |

| Appendix |
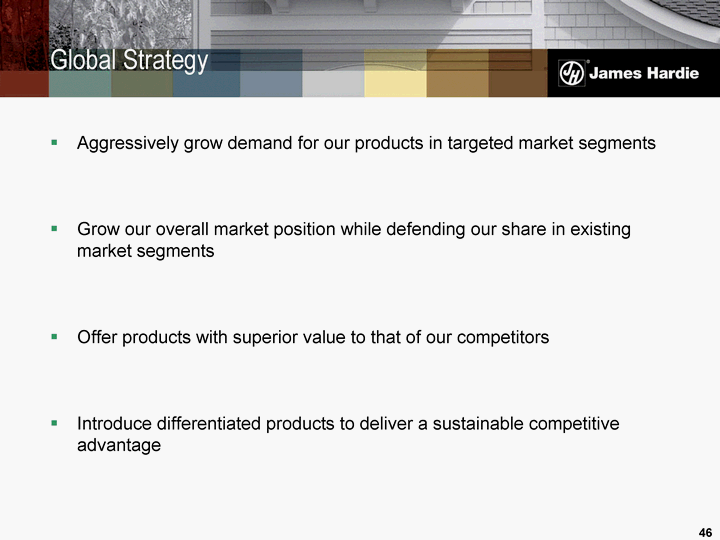
| Aggressively grow demand for our products in targeted market segments Grow our overall market position while defending our share in existing market segments Offer products with superior value to that of our competitors Introduce differentiated products to deliver a sustainable competitive advantage Global Strategy 46 |
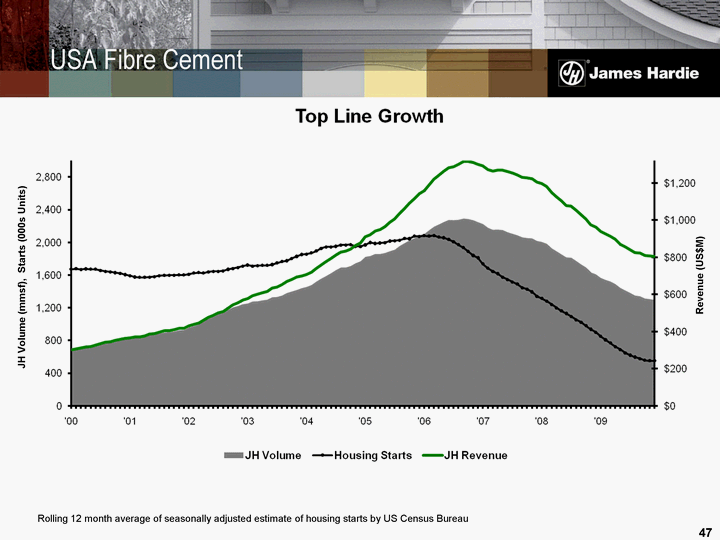
| USA Fibre Cement Rolling 12 month average of seasonally adjusted estimate of housing starts by US Census Bureau JH Volume (mmsf), Starts (000s Units) Revenue (US$M) 47 |
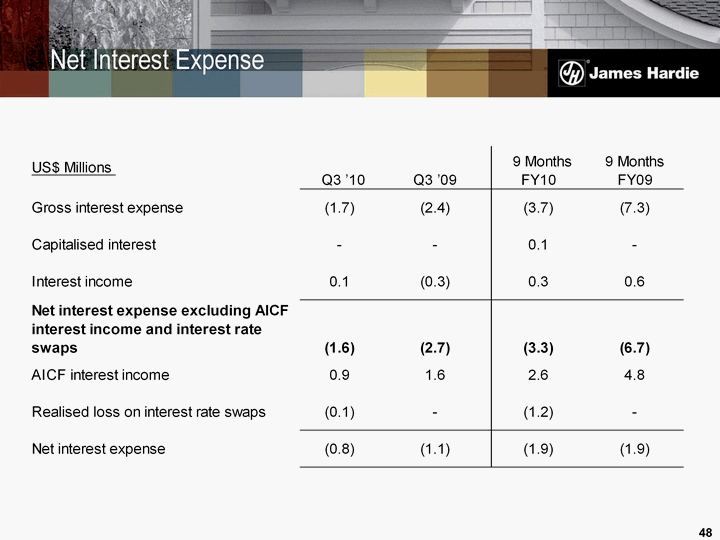
| Net Interest Expense 48 |
| Endnotes This Management Presentation forms part of a package of information about the company's results. It should be read in conjunction with the other parts of this package, including Management's Analysis of Results, a Media Release and a Financial Report. Definitions Financial Measures - US GAAP equivalents EBIT and EBIT Margin - EBIT, as used in this document, is equivalent to the US GAAP measure of operating income. EBIT margin is defined as EBIT as a percentage of net sales. We believe EBIT and EBIT margin to be relevant and useful information as these are the primary measures used by our management to measure the operating profit or loss of our business. EBIT is one of several metrics used by our management to measure the earnings generated from our operations, excluding interest and income tax expenses. Additionally, EBIT is believed to be a primary measure and terminology used by our Australian investors. EBIT and EBIT margin should be considered in addition to, but not as a substitute for, other measures of financial performance reported in accordance with accounting principles generally accepted in the United States of America. EBIT and EBIT margin, as we have defined them, may not be comparable to similarly titled measures reported by other companies. Operating profit - is equivalent to the US GAAP measure of income. Net operating profit - is equivalent to the US GAAP measure of net income. Sales Volumes mmsf - million square feet, where a square foot is defined as a standard square foot of 5/16" thickness. msf - thousand square feet, where a square foot is defined as a standard square foot of 5/16" thickness. 49 |
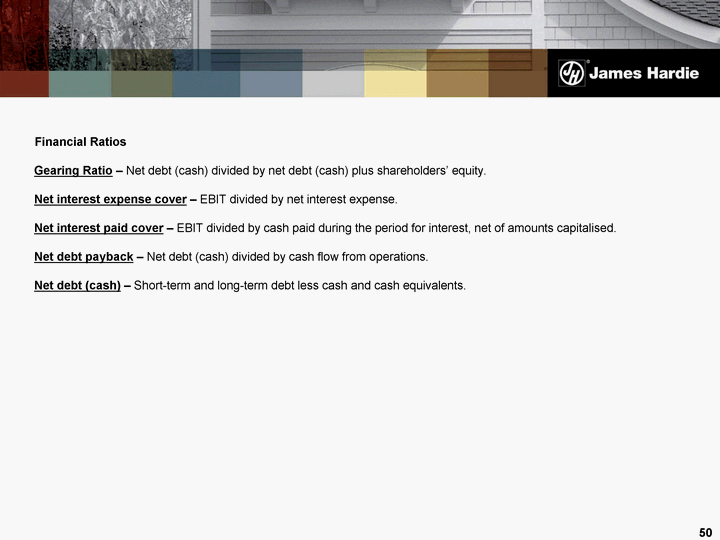
| Financial Ratios Gearing Ratio - Net debt (cash) divided by net debt (cash) plus shareholders' equity. Net interest expense cover - EBIT divided by net interest expense. Net interest paid cover - EBIT divided by cash paid during the period for interest, net of amounts capitalised. Net debt payback - Net debt (cash) divided by cash flow from operations. Net debt (cash) - Short-term and long-term debt less cash and cash equivalents. 50 |
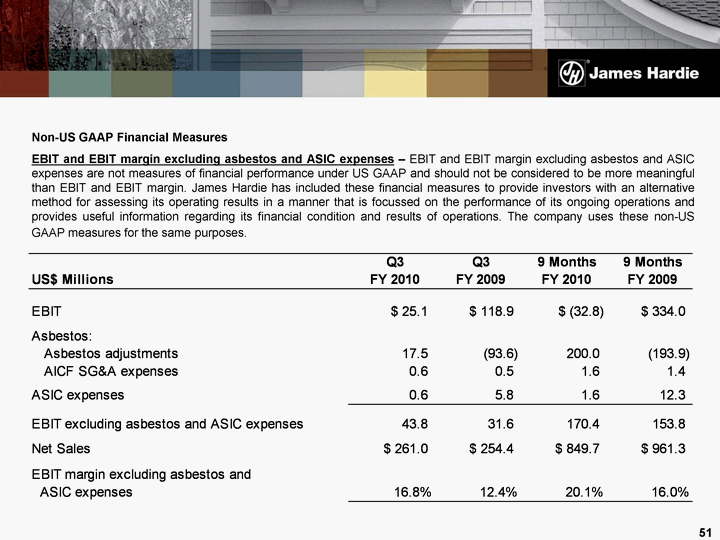
| Non-US GAAP Financial Measures EBIT and EBIT margin excluding asbestos and ASIC expenses - EBIT and EBIT margin excluding asbestos and ASIC expenses are not measures of financial performance under US GAAP and should not be considered to be more meaningful than EBIT and EBIT margin. James Hardie has included these financial measures to provide investors with an alternative method for assessing its operating results in a manner that is focussed on the performance of its ongoing operations and provides useful information regarding its financial condition and results of operations. The company uses these non-US GAAP measures for the same purposes. 51 |
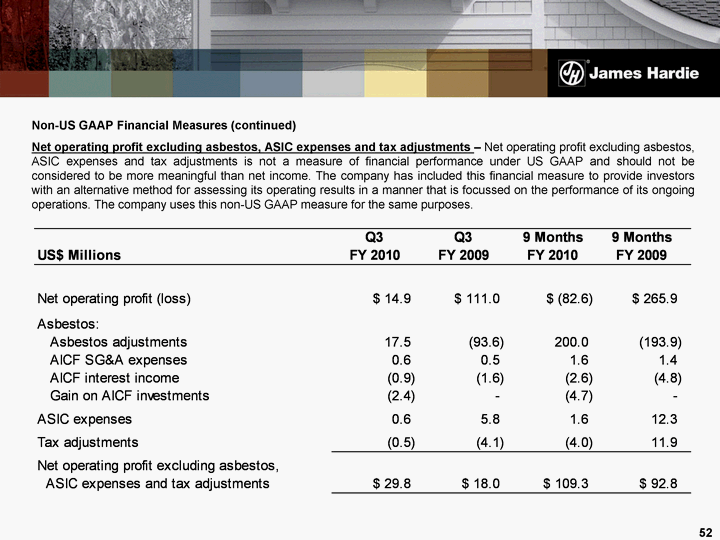
| Non-US GAAP Financial Measures (continued) Net operating profit excluding asbestos, ASIC expenses and tax adjustments - Net operating profit excluding asbestos, ASIC expenses and tax adjustments is not a measure of financial performance under US GAAP and should not be considered to be more meaningful than net income. The company has included this financial measure to provide investors with an alternative method for assessing its operating results in a manner that is focussed on the performance of its ongoing operations. The company uses this non-US GAAP measure for the same purposes. 52 |
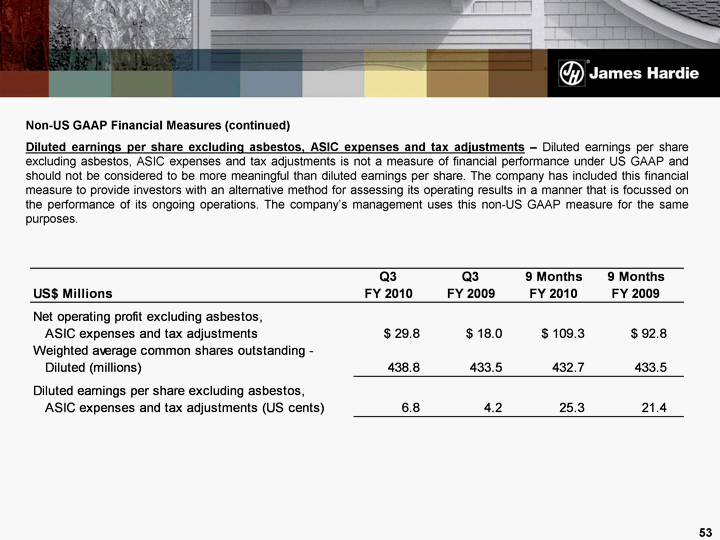
| Non-US GAAP Financial Measures (continued) Diluted earnings per share excluding asbestos, ASIC expenses and tax adjustments - Diluted earnings per share excluding asbestos, ASIC expenses and tax adjustments is not a measure of financial performance under US GAAP and should not be considered to be more meaningful than diluted earnings per share. The company has included this financial measure to provide investors with an alternative method for assessing its operating results in a manner that is focussed on the performance of its ongoing operations. The company's management uses this non-US GAAP measure for the same purposes. 53 |
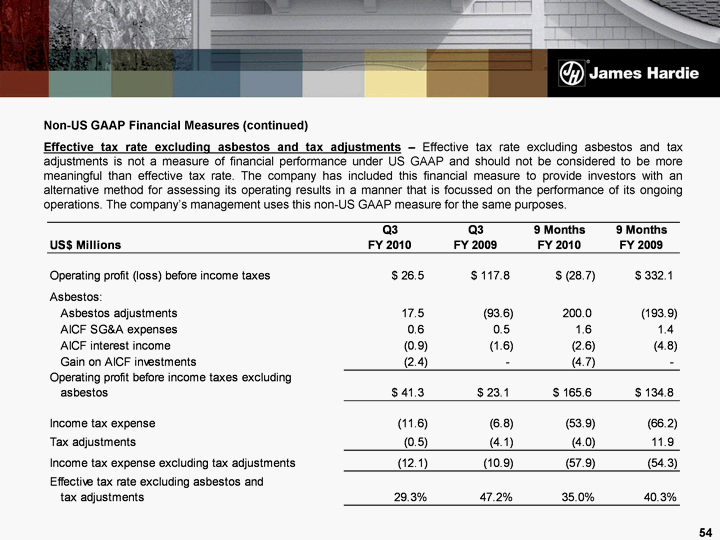
| Non-US GAAP Financial Measures (continued) Effective tax rate excluding asbestos and tax adjustments - Effective tax rate excluding asbestos and tax adjustments is not a measure of financial performance under US GAAP and should not be considered to be more meaningful than effective tax rate. The company has included this financial measure to provide investors with an alternative method for assessing its operating results in a manner that is focussed on the performance of its ongoing operations. The company's management uses this non-US GAAP measure for the same purposes. 54 |
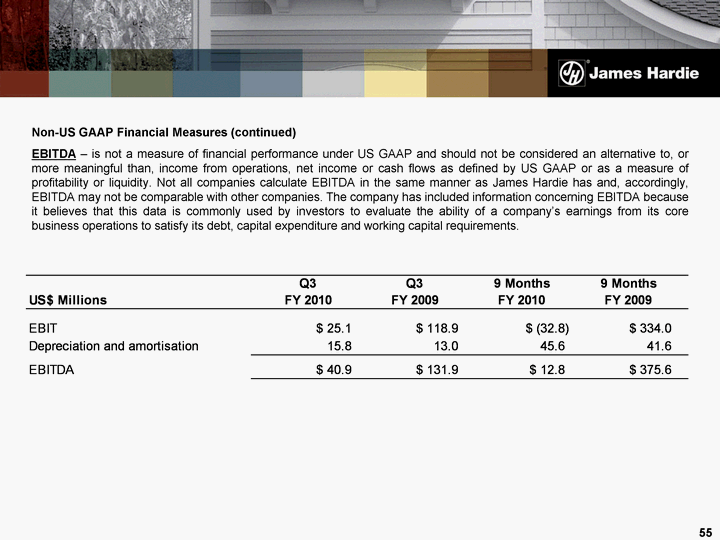
| Non-US GAAP Financial Measures (continued) EBITDA - is not a measure of financial performance under US GAAP and should not be considered an alternative to, or more meaningful than, income from operations, net income or cash flows as defined by US GAAP or as a measure of profitability or liquidity. Not all companies calculate EBITDA in the same manner as James Hardie has and, accordingly, EBITDA may not be comparable with other companies. The company has included information concerning EBITDA because it believes that this data is commonly used by investors to evaluate the ability of a company's earnings from its core business operations to satisfy its debt, capital expenditure and working capital requirements. 55 |
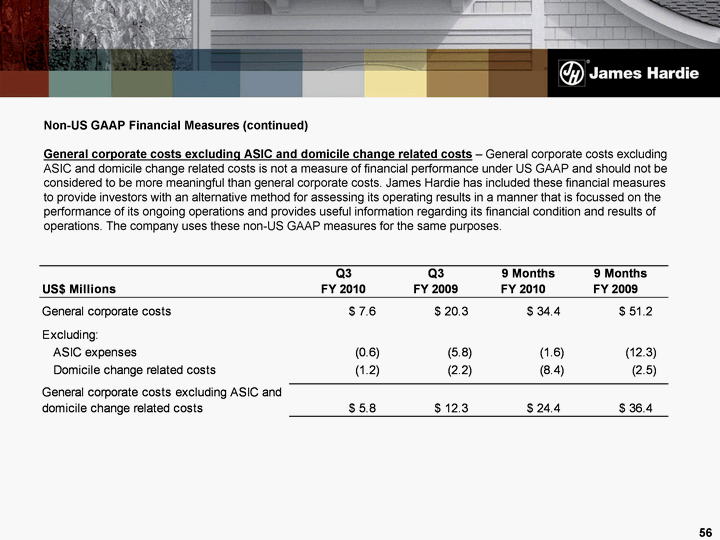
| Non-US GAAP Financial Measures (continued) General corporate costs excluding ASIC and domicile change related costs - General corporate costs excluding ASIC and domicile change related costs is not a measure of financial performance under US GAAP and should not be considered to be more meaningful than general corporate costs. James Hardie has included these financial measures to provide investors with an alternative method for assessing its operating results in a manner that is focussed on the performance of its ongoing operations and provides useful information regarding its financial condition and results of operations. The company uses these non-US GAAP measures for the same purposes. 56 |

| Q3 FY10 Management Presentation 11 February 2010 |