
| Asia Pacific Update Grant Gustafson, VP - International 15 March 2010 |
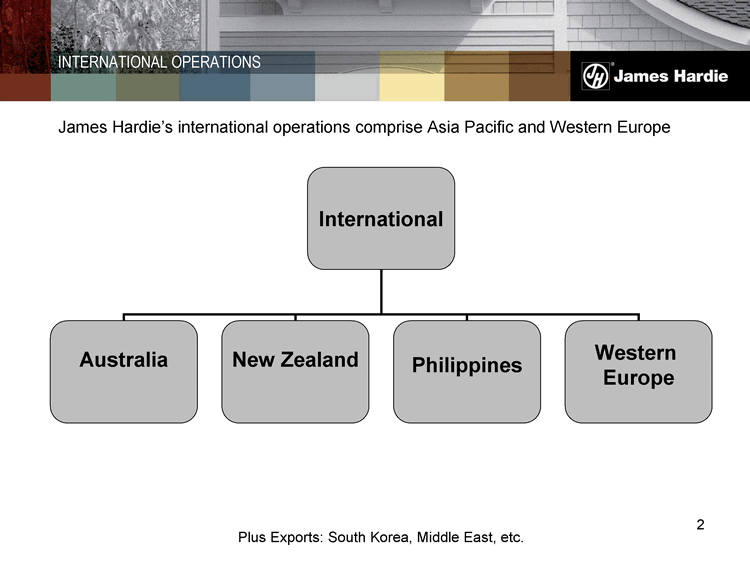
| 2 Plus Exports: South Korea, Middle East, etc. James Hardie's international operations comprise Asia Pacific and Western Europe INTERNATIONAL OPERATIONS International Australia New Zealand Philippines Western Europe |
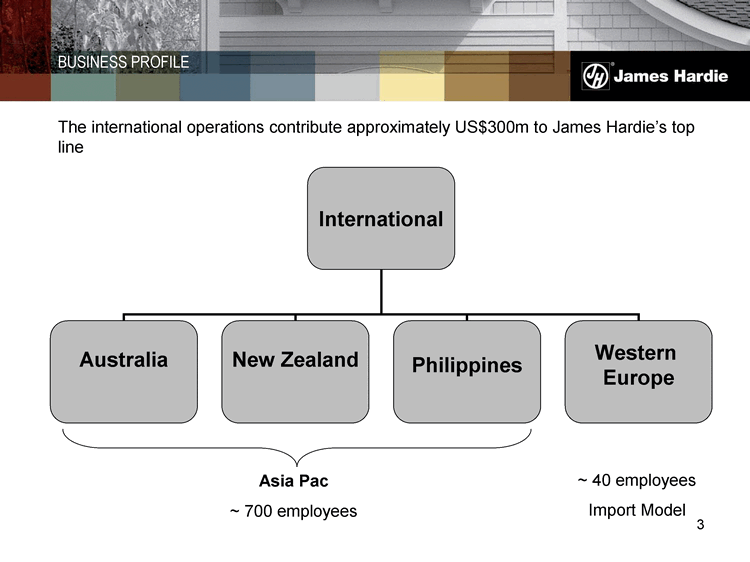
| 3 International Australia New Zealand Philippines Western Europe Asia Pac ~ 700 employees ~ 40 employees Import Model The international operations contribute approximately US$300m to James Hardie's top line BUSINESS PROFILE |
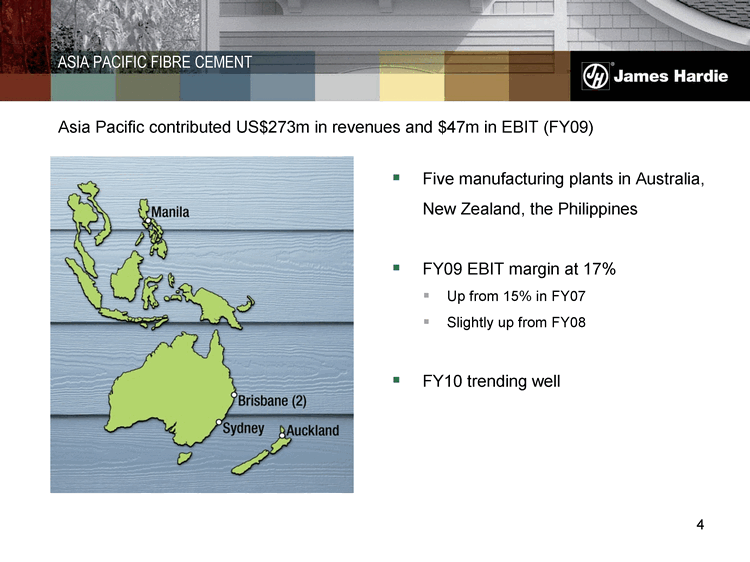
| 4 Five manufacturing plants in Australia, New Zealand, the Philippines FY09 EBIT margin at 17% Up from 15% in FY07 Slightly up from FY08 FY10 trending well Asia Pacific contributed US$273m in revenues and $47m in EBIT (FY09) ASIA PACIFIC FIBRE CEMENT |
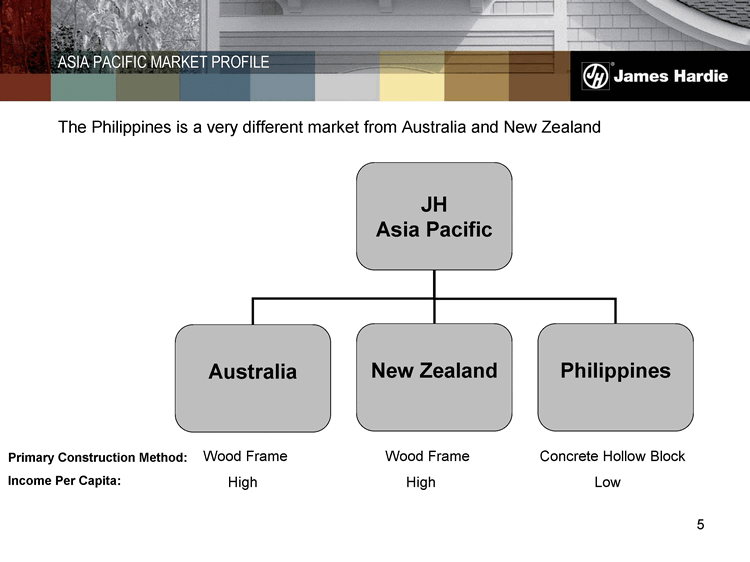
| 5 JH Asia Pacific Australia New Zealand Philippines The Philippines is a very different market from Australia and New Zealand Primary Construction Method: Income Per Capita: Wood Frame Wood Frame Concrete Hollow Block High High Low ASIA PACIFIC MARKET PROFILE |
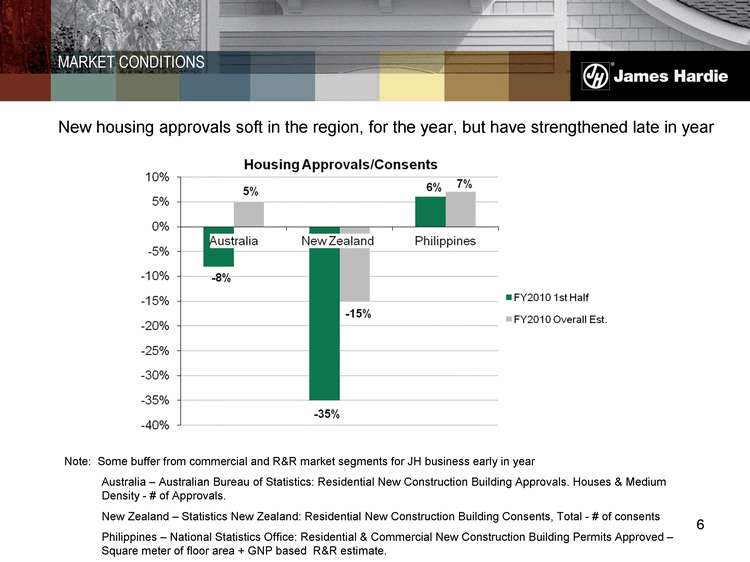
| 6 Note: Some buffer from commercial and R&R market segments for JH business early in year Australia - Australian Bureau of Statistics: Residential New Construction Building Approvals. Houses & Medium Density - # of Approvals. New Zealand - Statistics New Zealand: Residential New Construction Building Consents, Total - # of consents Philippines - National Statistics Office: Residential & Commercial New Construction Building Permits Approved - Square meter of floor area + GNP based R&R estimate. New housing approvals soft in the region, for the year, but have strengthened late in year MARKET CONDITIONS Australia New Zealand Philippines - -8% 5% -35% -15% 6% 7% FY2010 1st Half FY2010 Overall Est. |
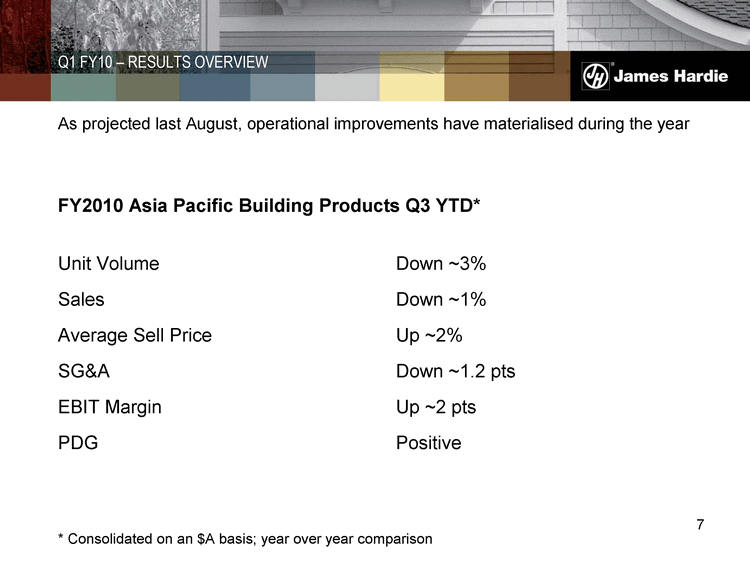
| 7 As projected last August, operational improvements have materialised during the year FY2010 Asia Pacific Building Products Q3 YTD* Unit Volume Down ~3% Sales Down ~1% Average Sell Price Up ~2% SG&A Down ~1.2 pts EBIT Margin Up ~2 pts PDG Positive * Consolidated on an $A basis; year over year comparison Q1 FY10 - RESULTS OVERVIEW |
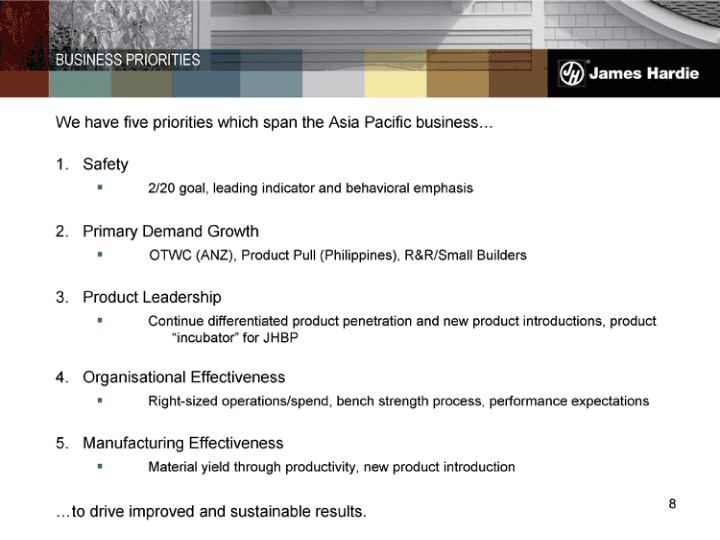
| 8 Safety 2/20 goal, leading indicator and behavioral emphasis Primary Demand Growth OTWC (ANZ), Product Pull (Philippines), R&R/Small Builders Product Leadership Continue differentiated product penetration and new product introductions, product "incubator" for JHBP Organisational Effectiveness Right-sized operations/spend, bench strength process, performance expectations Manufacturing Effectiveness Material yield through productivity, new product introduction We have five priorities which span the Asia Pacific business... ....to drive improved and sustainable results. BUSINESS PRIORITIES |
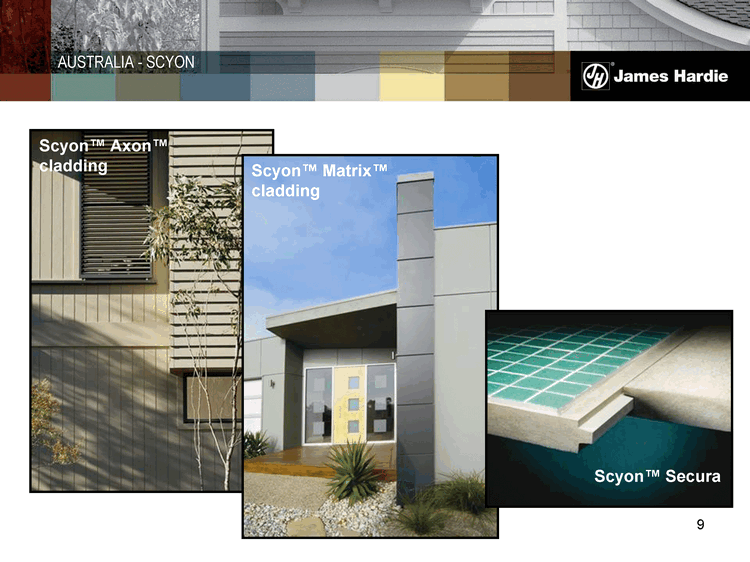
| 9 Scyon(tm) Matrix(tm) cladding Scyon(tm) Axon(tm) cladding Scyon(tm) Secura AUSTRALIA - SCYON |
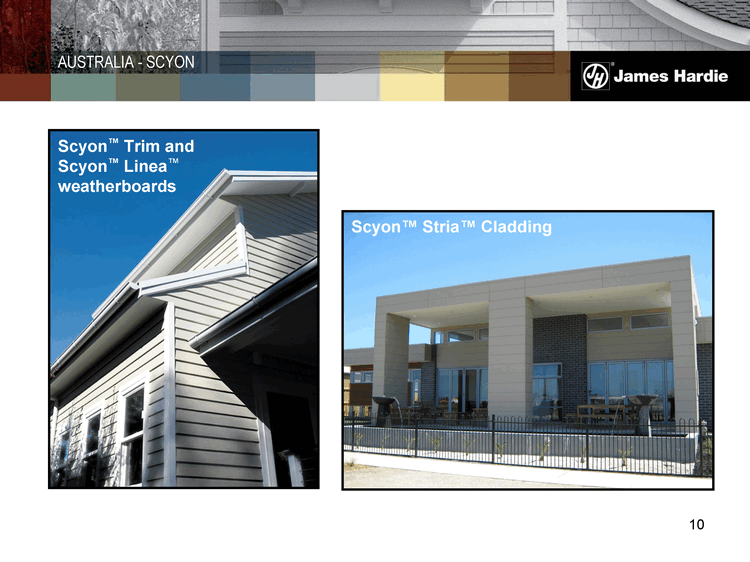
| 10 Scyon(tm) Trim and Scyon(tm) Linea(tm) weatherboards Scyon(tm) Stria(tm) Cladding AUSTRALIA - SCYON |
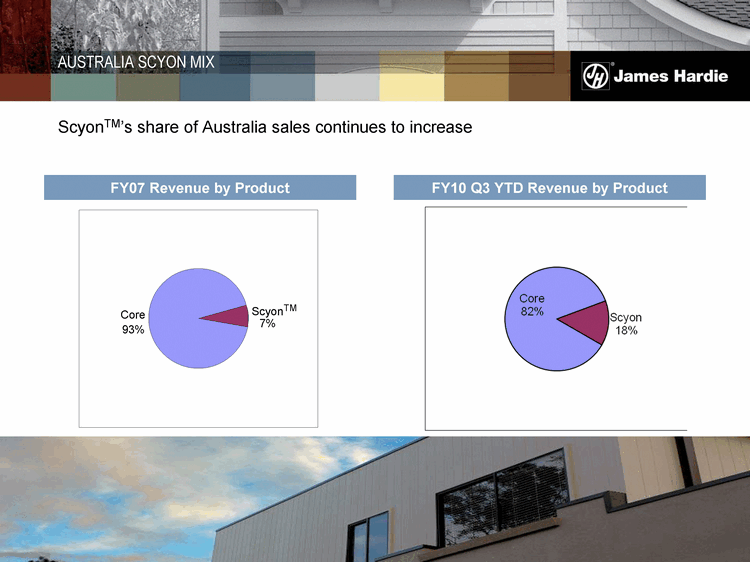
| 11 FY10 Q3 YTD Revenue by Product FY07 Revenue by Product ScyonTM's share of Australia sales continues to increase AUSTRALIA SCYON MIX Core 93% ScyonTM 7% Core 82% Scyon 18% |
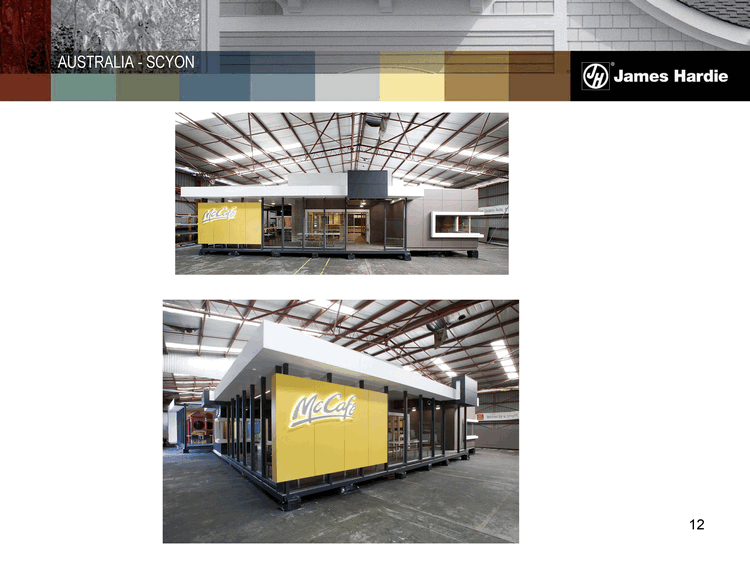
| 12 AUSTRALIA - SCYON |