Exhibit 99.8

| This Management Presentation contains forward-looking statements. We may from time to time make forward-looking statements in our periodic reports filed with or furnished to the United States Securities and Exchange Commission on Forms 20-F and 6-K, in our annual reports to shareholders, in offering circulars, invitation memoranda and prospectuses, in media releases and other written materials and in oral statements made by our officers, directors or employees to analysts, institutional investors, lenders and potential lenders, representatives of the media and others. Examples of forward-looking statements include: expectations about the timing and amount of payments to the Asbestos Injuries Compensation Fund (AICF), a special purpose fund for the compensation of proven Australian asbestos-related personal injury and death claims; statements regarding tax liabilities and related proceedings; statements as to the possible consequences of proceedings brought against us and certain of our former directors and officers by the Australian Securities and Investments Commission; expectations concerning indemnification obligations; expectations concerning the costs associated with the suspension of operations at our Blandon Pennsylvania and Plant City, Florida plants; expectations that our credit facilities will be extended or renewed; expectations concerning dividend payments; projections of our operating results or financial condition; statements regarding our plans, objectives or goals, including those relating to competition, acquisitions, dispositions and our products; statements about our future performance; and statements about product or environmental liabilities. Words such as "believe," "anticipate," "plan," "expect," "intend," "target," "estimate," "project," "predict," "forecast," "guideline," "should," "aim" and similar expressions are intended to identify forward-looking statements but are not the exclusive means of identifying such statements. Forward-looking statements involve inherent risks and uncertainties. We caution you that a number of important factors could cause actual results to differ materially from the plans, objectives, expectations, estimates and intentions expressed in such forward-looking statements. These factors, some of which are discussed under "Key Information - Risk Factors" beginning on page 6 of our Form 20-F filed on 8 July 2008 with the Securities and Exchange Commission, include but are not limited to: all matters relating to or arising out of the prior manufacture of products that contained asbestos by current and former James Hardie subsidiaries; required contributions to the AICF and the effect of foreign exchange on the amount recorded in our financial statements as an asbestos liability; compliance with and changes in tax laws and treatments; competition and product pricing in the markets in which we operate; the consequences of product failures or defects; exposure to environmental, asbestos or other legal proceedings; general economic and market conditions; the supply and cost of raw materials; the success of our research and development efforts; our reliance on a small number of customers; compliance with and changes in environmental and health and safety laws; risks of conducting business internationally; compliance with and changes in laws and regulations; foreign exchange risks; and the effect of natural disasters and changes in our key management personnel. We caution you that the foregoing list of factors is not exclusive and that other risks and uncertainties may cause actual results to differ materially from those in forward-looking statements. Forward-looking statements speak only as of the date they are made. Disclaimer |
| Agenda Role of Manufacturing Key Areas of Manufacturing Focus Current State of Capacity Manufacturing Performance Trends Cost Management and Initiatives Safety Research and Development |
| Role of Manufacturing Manufacturing is a key enabler in achieving James Hardie's business strategy, through: Meeting market reliability standards (as defined by JH) in regards to quality and service Continuing to fund growth initiatives through the returns generated by operating high efficiency/low unit cost facilities Adopting technologies and processes to effectively support our product leadership position Creating a sustainable manufacturing model through a planned organizational approach |
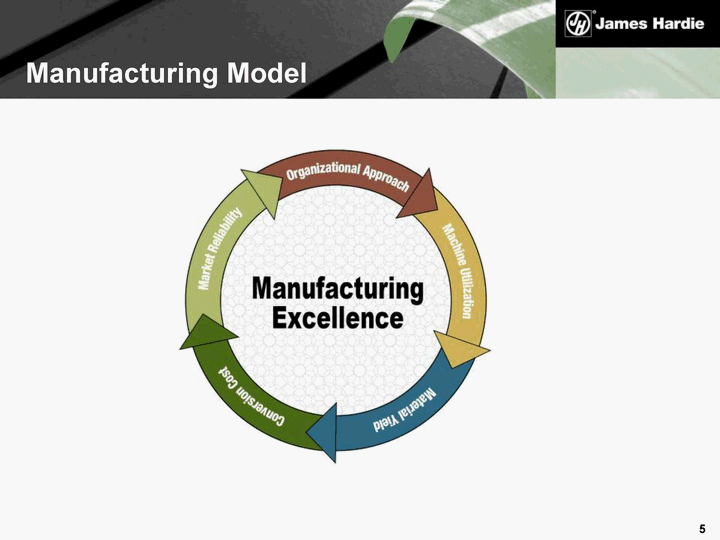
| Manufacturing Model Manufacturing Model |
| Current State of Capacity |
| Current State of Capacity "Flexible" Manufacturing Model in Place Allows for Rapid Response to Market Conditions Able to Match Supply with Demand Allows for a band of up to 200 mmsf of Variation Currently Operating at 50-70% of Capacity Regional Model Helps Offset Rising Fuel Costs |
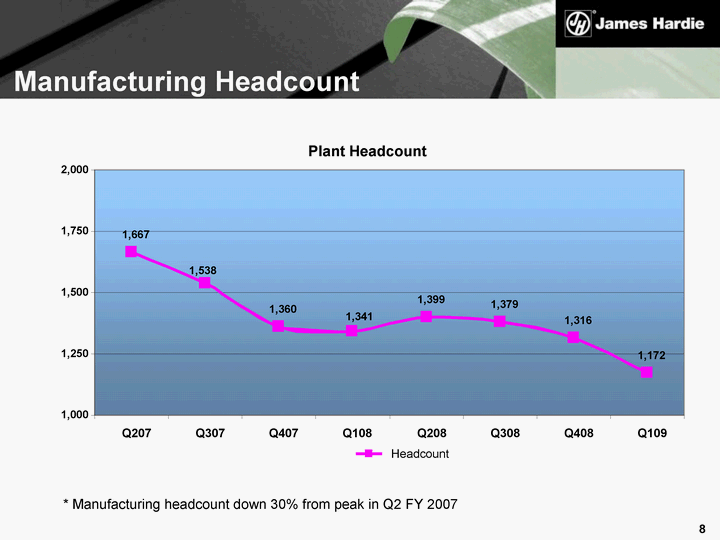
| Manufacturing Headcount * Manufacturing headcount down 30% from peak in Q2 FY 2007 Plant Headcount 1,667 1,360 1,399 1,379 1,316 1,172 1,538 1,341 1,000 1,250 1,500 1,750 2,000 Q207 Q307 Q407 Q108 Q208 Q308 Q408 Q109 Headcount Plant Headcount 1,667 1,360 1,399 1,379 1,316 1,172 1,538 1,341 1,000 1,250 1,500 1,750 2,000 Q207 Q307 Q407 Q108 Q208 Q308 Q408 Q109 Headcount |
| Manufacturing Performance Trends |
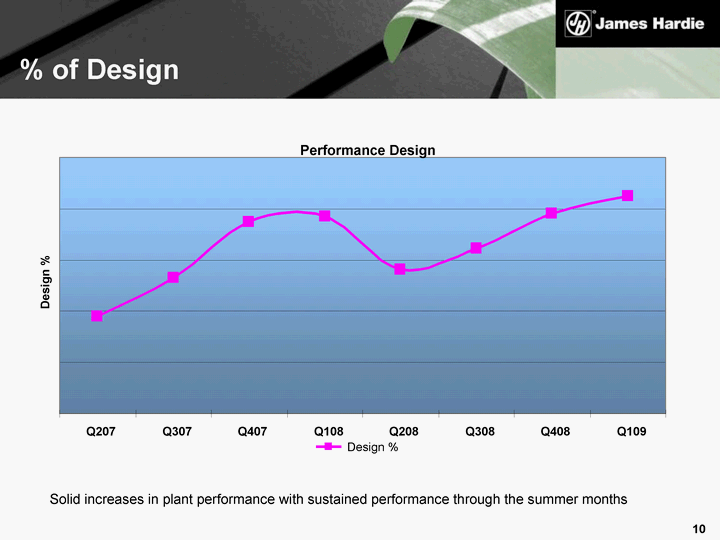
| % of Design Solid increases in plant performance with sustained performance through the summer months Performance Design Q207 Q307 Q407 Q108 Q208 Q308 Q408 Q109 Design % Design % Performance Design Q207 Q307 Q407 Q108 Q208 Q308 Q408 Q109 Design % Design % |
| Material Yield Zero to Landfill Program Launched in FY08 Goal has been to Reduce Waste at the Source Cross Functional Project Teams Facilities Currently Operating at Record Yield Levels |
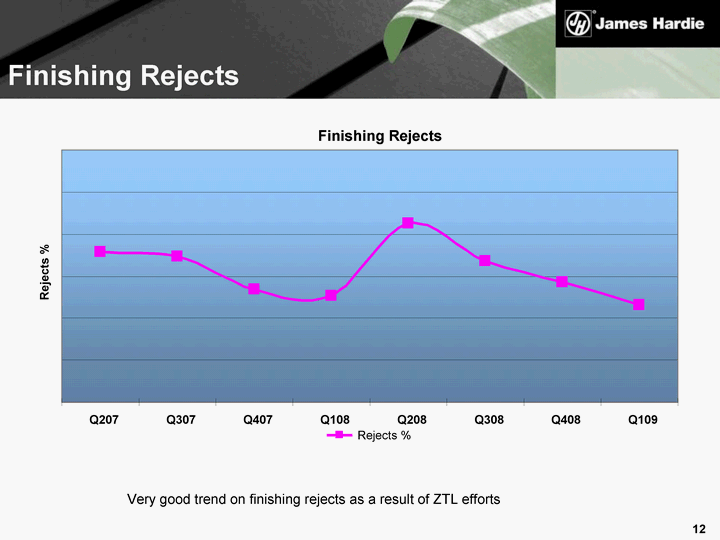
| Finishing Rejects Very good trend on finishing rejects as a result of ZTL efforts Finishing Rejects Q207 Q307 Q407 Q108 Q208 Q308 Q408 Q109 Rejects % Rejects % Finishing Rejects Q207 Q307 Q407 Q108 Q208 Q308 Q408 Q109 Rejects % Rejects % |
| Cost Management and Initiatives |
| Cost Management Aggressive Program Implemented to Minimize Waste Maximize Efficiency Reduce Plant Costs Offset Rising Raw Material Inputs |
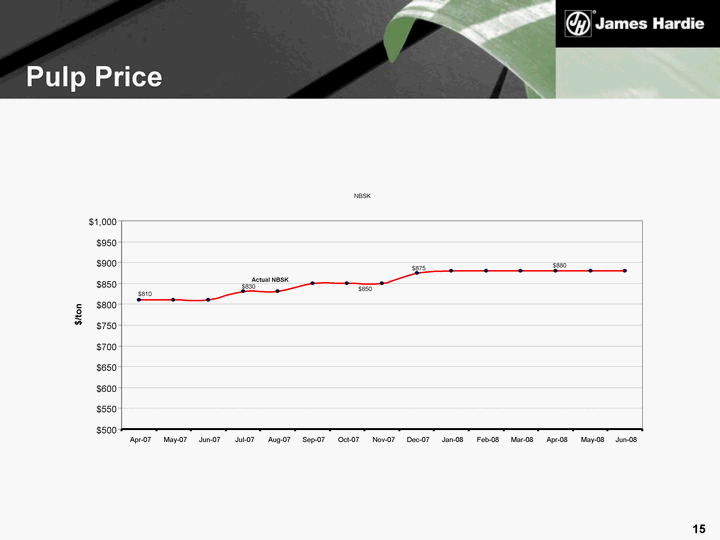
| Pulp Price NBSK $880 $850 $875 $830 $810 $500 $550 $600 $650 $700 $750 $800 $850 $900 $950 $1,000 Apr-07 May-07 Jun-07 Jul-07 Aug-07 Sep-07 Oct-07 Nov-07 Dec-07 Jan-08 Feb-08 Mar-08 Apr-08 May-08 Jun-08 $/ton Actual NBSK NBSK $880 $850 $875 $830 $810 $500 $550 $600 $650 $700 $750 $800 $850 $900 $950 $1,000 Apr-07 May-07 Jun-07 Jul-07 Aug-07 Sep-07 Oct-07 Nov-07 Dec-07 Jan-08 Feb-08 Mar-08 Apr-08 May-08 Jun-08 $/ton Actual NBSK |
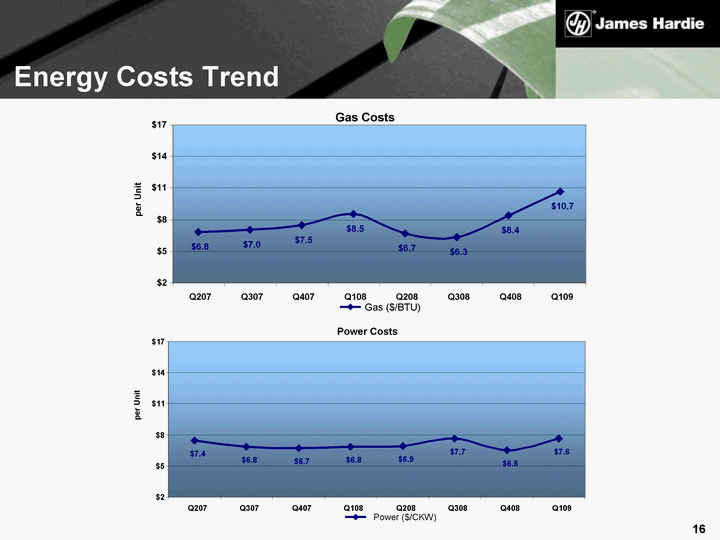
| Energy Costs Trend Gas Costs $6.8 $7.0 $7.5 $8.5 $6.7 $6.3 $8.4 $10.7 $2 $5 $8 $11 $14 $17 Q207 Q307 Q407 Q108 Q208 Q308 Q408 Q109 per Unit Gas ($/BTU) Gas Costs $6.8 $7.0 $7.5 $8.5 $6.7 $6.3 $8.4 $10.7 $2 $5 $8 $11 $14 $17 Q207 Q307 Q407 Q108 Q208 Q308 Q408 Q109 per Unit Gas ($/BTU) Power Costs Power Costs $7.4 $7.4 $6.8 $6.8 $6.7 $6.7 $6.8 $6.8 $6.9 $6.9 $7.7 $7.7 $6.5 $6.5 $7.6 $7.6 $2 $2 $5 $5 $8 $8 $11 $11 $14 $14 $17 $17 Q207 Q207 Q307 Q307 Q407 Q407 Q108 Q108 Q208 Q208 Q308 Q308 Q408 Q408 Q109 Q109 per Unit per Unit Power ($/CKW) Power ($/CKW) |
| Cost Initiatives Targeted cost reductions of approximately US$10 million through: Procurement initiatives (all materials with focus on pulp, cement, paint, primer) Compressible spend vendor aggregation Compressible spend reductions through benchmarking Better paint and primer yield Minimize overtime Pallet operations Pulp blends Interleaver turns/yield Dedicated fleet hauling Raw material blend optimization |
| Conversion Cost Conversion cost methodology was developed to answer three questions: 1) Is the plant in the right location to optimize input costs? 2) What scale or flexibility advantages does the plant have? 3) Is the plant well run? After analyzing these questions, we consider whether we have made the correct product line sourcing decisions. Focus on enabling management to quickly get a view on: Efficient use of raw materials Understanding and quantifying variances from theoretical raw material mix Comparison of plant efficiency across several input areas (utility efficiency, labor costs and processing costs) |

| Safety |
| US Safety Safety Results: April 1st - July 31st, 2008 Incident Rate = 2.6 Severity Rate = 37 Strong Focus on Behavioral Modifications Roughly 50% of Incidents are Behavior Based Major Reduction in Heat Related Incidences YTD Organizational Goal Remains 2 and 20 |

| Research and Development |
| Technology Strategy Enable JH Product Leadership Strategy Provide sustainable advantage Balance between Research and Development New Opportunities - Segments / Products |
| R & D Centers Diverse workforce of 130 technologists Locations 70 in Fontana 50 in Sydney mixture of science and engineering 40% with greater than 5yrs service +50% with advanced degrees Aligned to deliver on Product Strategies |
| FY09 Key Focus Successful Launches of New Products 4/4" and 5/4" Trim in All Markets Board and Batten System Commercial / MF Specific Products Manufacturing Optimization Raw Materials Process Control Color + Development |
| Conclusion / Next Steps Manufacturing Model Continues to Evolve Flexible Manufacturing Key Metrics Machine Utilization Yield RD Alignment on Key Strategic Goals |