Exhibit 99.9

| This Management Presentation contains forward-looking statements. We may from time to time make forward-looking statements in our periodic reports filed with or furnished to the United States Securities and Exchange Commission on Forms 20-F and 6-K, in our annual reports to shareholders, in offering circulars, invitation memoranda and prospectuses, in media releases and other written materials and in oral statements made by our officers, directors or employees to analysts, institutional investors, lenders and potential lenders, representatives of the media and others. Examples of forward-looking statements include: expectations about the timing and amount of payments to the Asbestos Injuries Compensation Fund (AICF), a special purpose fund for the compensation of proven Australian asbestos-related personal injury and death claims; statements regarding tax liabilities and related proceedings; statements as to the possible consequences of proceedings brought against us and certain of our former directors and officers by the Australian Securities and Investments Commission; expectations concerning indemnification obligations; expectations concerning the costs associated with the suspension of operations at our Blandon Pennsylvania and Plant City, Florida plants; expectations that our credit facilities will be extended or renewed; expectations concerning dividend payments; projections of our operating results or financial condition; statements regarding our plans, objectives or goals, including those relating to competition, acquisitions, dispositions and our products; statements about our future performance; and statements about product or environmental liabilities. Words such as "believe," "anticipate," "plan," "expect," "intend," "target," "estimate," "project," "predict," "forecast," "guideline," "should," "aim" and similar expressions are intended to identify forward-looking statements but are not the exclusive means of identifying such statements. Forward-looking statements involve inherent risks and uncertainties. We caution you that a number of important factors could cause actual results to differ materially from the plans, objectives, expectations, estimates and intentions expressed in such forward-looking statements. These factors, some of which are discussed under "Key Information - Risk Factors" beginning on page 6 of our Form 20-F filed on 8 July 2008 with the Securities and Exchange Commission, include but are not limited to: all matters relating to or arising out of the prior manufacture of products that contained asbestos by current and former James Hardie subsidiaries; required contributions to the AICF and the effect of foreign exchange on the amount recorded in our financial statements as an asbestos liability; compliance with and changes in tax laws and treatments; competition and product pricing in the markets in which we operate; the consequences of product failures or defects; exposure to environmental, asbestos or other legal proceedings; general economic and market conditions; the supply and cost of raw materials; the success of our research and development efforts; our reliance on a small number of customers; compliance with and changes in environmental and health and safety laws; risks of conducting business internationally; compliance with and changes in laws and regulations; foreign exchange risks; and the effect of natural disasters and changes in our key management personnel. We caution you that the foregoing list of factors is not exclusive and that other risks and uncertainties may cause actual results to differ materially from those in forward-looking statements. Forward-looking statements speak only as of the date they are made. Disclaimer |
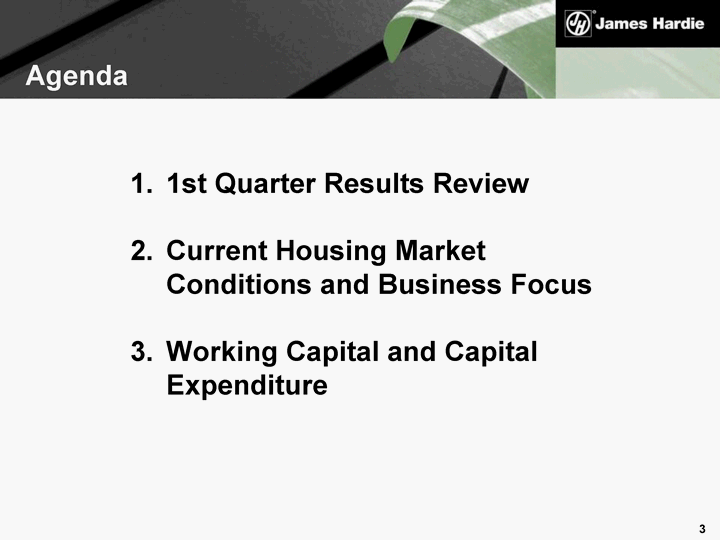
| Agenda 1st Quarter Results Review Current Housing Market Conditions and Business Focus Working Capital and Capital Expenditure |

| 1st Quarter FY 2009 Results Review |
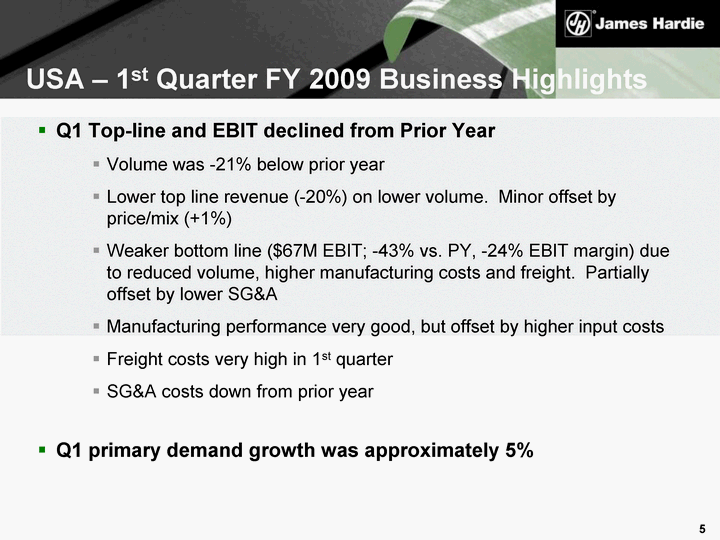
| USA - 1st Quarter FY 2009 Business Highlights Q1 Top-line and EBIT declined from Prior Year Volume was -21% below prior year Lower top line revenue (-20%) on lower volume. Minor offset by price/mix (+1%) Weaker bottom line ($67M EBIT; -43% vs. PY, -24% EBIT margin) due to reduced volume, higher manufacturing costs and freight. Partially offset by lower SG&A Manufacturing performance very good, but offset by higher input costs Freight costs very high in 1st quarter SG&A costs down from prior year Q1 primary demand growth was approximately 5% |
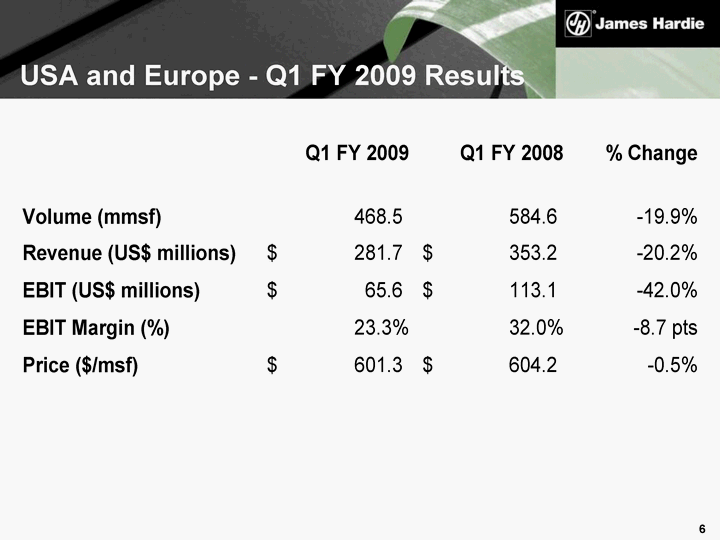
| USA and Europe - Q1 FY 2009 Results |
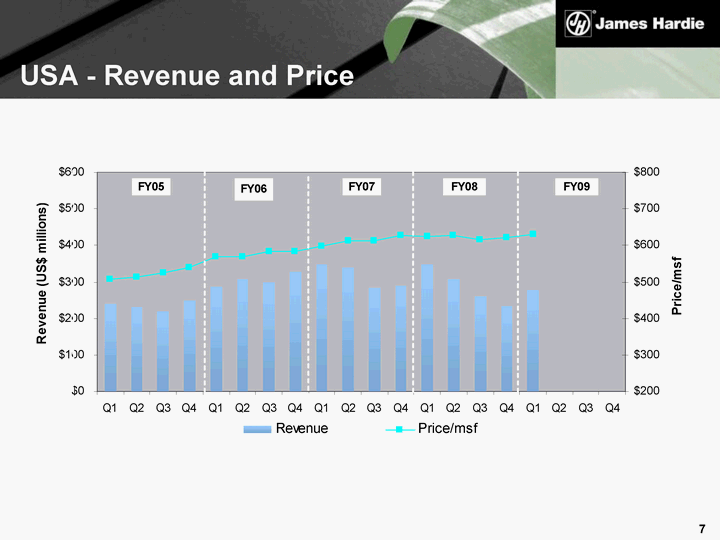
| USA - Revenue and Price |
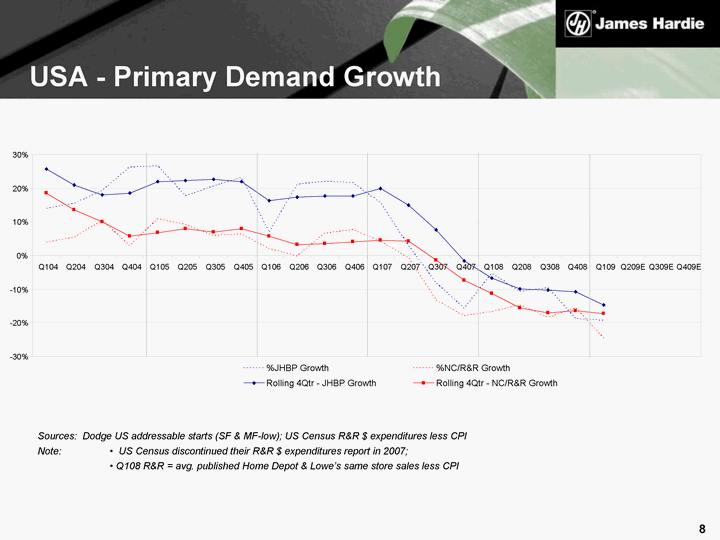
| USA - Primary Demand Growth Sources: Dodge US addressable starts (SF & MF-low); US Census R&R $ expenditures less CPI Note: • US Census discontinued their R&R $ expenditures report in 2007; • Q108 R&R = avg. published Home Depot & Lowe's same store sales less CPI - -30% - -20% - -10% 0% 10% 20% 30% Q104 Q204 Q304 Q404 Q105 Q205 Q305 Q405 Q106 Q206 Q306 Q406 Q107 Q207 Q307 Q407 Q108 Q208 Q308 Q408 Q109 Q209E Q309E Q409E %JHBP Growth %NC/R&R Growth Rolling 4Qtr - JHBP Growth Rolling 4Qtr - NC/R&R Growth |
| USA - Freight Fuel & Carrier spend significantly up in FY09 as a result of high diesel price and reduced supply of carriers Fuel prices appear to have stabilized in Q2; reductions in both fuel and carrier rates anticipated for remainder of FY09 Product mix has been unfavorable from a freight perspective as C+ sales continue to increase. Regional mix also unfavorable as Canadian sales are up while Southeast sales are down % less than full truckload ("LTL") remains flat 2% fuel surcharge announced in mid July became effective mid August Focus remains on sourcing product on a lowest delivered cash cost to the market |
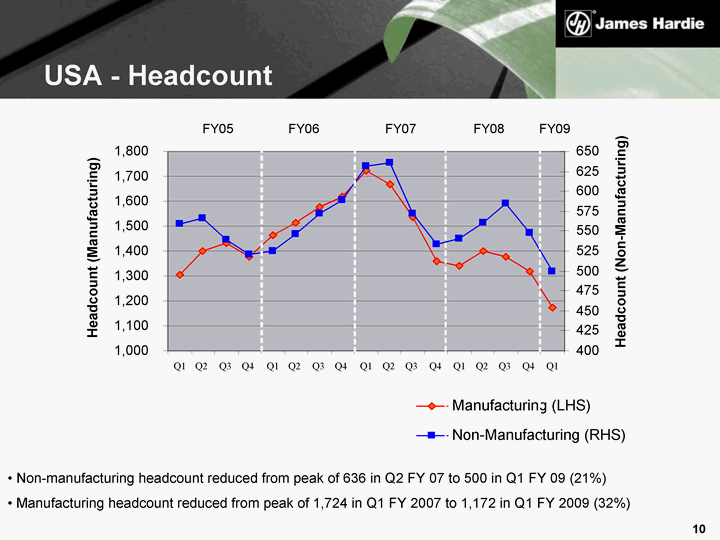
| USA - Headcount Non-manufacturing headcount reduced from peak of 636 in Q2 FY 07 to 500 in Q1 FY 09 (21%) Manufacturing headcount reduced from peak of 1,724 in Q1 FY 2007 to 1,172 in Q1 FY 2009 (32%) 1,000 1,100 1,200 1,300 1,400 1,500 1,600 1,700 1,800 Q1 Q2 Q3 Q4 Q1 Q2 Q3 Q4 Q1 Q2 Q3 Q4 Q1 Q2 Q3 Q4 Q1 Headcount (Manufacturing) 400 425 450 475 500 525 550 575 600 625 650 Headcount (Non-Manufacturing) Manufacturing (LHS) Non-Manufacturing (RHS) FY06 FY05 FY07 FY08 FY09 |
| Current Housing Market Conditions and Business Focus |
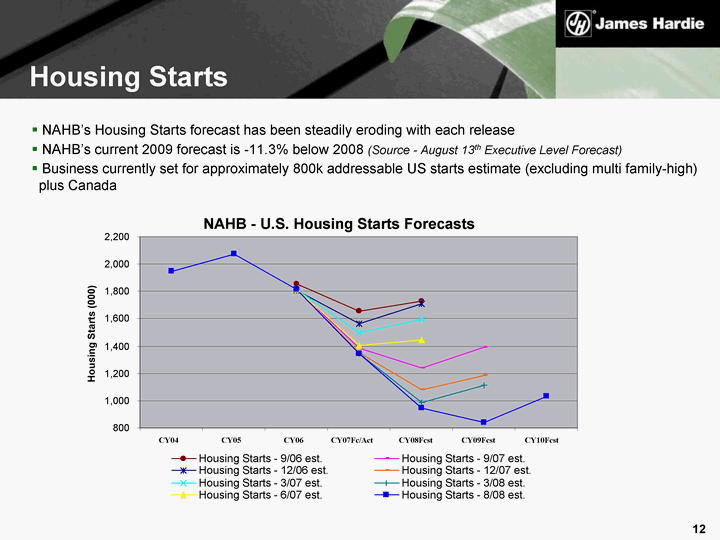
| NAHB's Housing Starts forecast has been steadily eroding with each release NAHB's current 2009 forecast is -11.3% below 2008 (Source - August 13th Executive Level Forecast) Business currently set for approximately 800k addressable US starts estimate (excluding multi family-high) plus Canada Housing Starts NAHB - U.S. Housing Starts Forecasts 800 1,000 1,200 1,400 1,600 1,800 2,000 2,200 CY04 CY05 CY06 CY07Fc/Act CY08Fcst CY09Fcst CY10Fcst Housing Starts (000) Housing Starts - 9/06 est. Housing Starts - 9/07 est. Housing Starts - 12/06 est. Housing Starts - 12/07 est. Housing Starts - 3/07 est. Housing Starts - 3/08 est. Housing Starts - 6/07 est. Housing Starts - 8/08 est. |
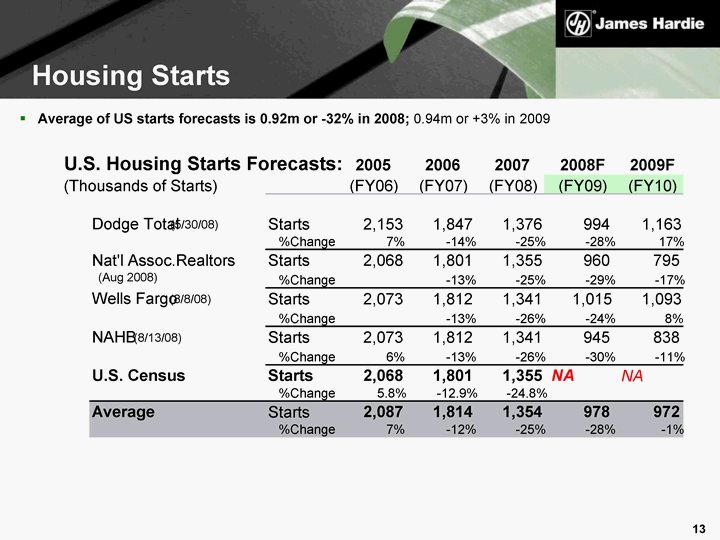
| Housing Starts Average of US starts forecasts is 0.92m or -32% in 2008; 0.94m or +3% in 2009 U.S. Housing Starts Forecasts: 2005 2006 2007 2008F 2009F (Thousands of Starts) (FY06) (FY07) (FY08) (FY09) (FY10) Dodge Total (5/30/08) Starts 2,153 1,847 1,376 994 1,163 %Change 7% - -14% - -25% - -28% 17% Nat'l Assoc.Realtors Starts 2,068 1,801 1,355 960 795 (Aug 2008) %Change - -13% - -25% - -29% - -17% Wells Fargo (8/8/08) Starts 2,073 1,812 1,341 1,015 1,093 %Change - -13% - -26% - -24% 8% NAHB (8/13/08) Starts 2,073 1,812 1,341 945 838 %Change 6% - -13% - -26% - -30% - -11% U.S. Census Starts 2,068 1,801 1,355 NA NA %Change 5.8% - -12.9% - -24.8% Average Starts 2,087 1,814 1,354 978 972 %Change 7% - -12% - -25% - -28% - -1% |
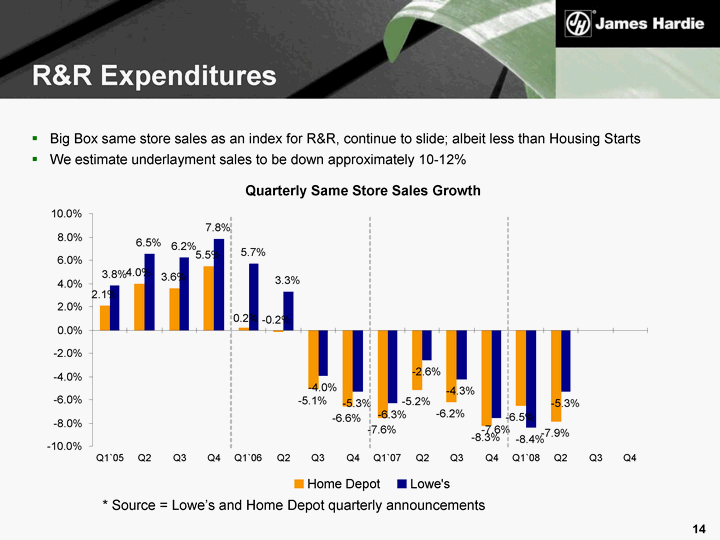
| R&R Expenditures Big Box same store sales as an index for R&R, continue to slide; albeit less than Housing Starts We estimate underlayment sales to be down approximately 10-12% * Source = Lowe's and Home Depot quarterly announcements Quarterly Same Store Sales Growth 2.1% 4.0% 3.6% 5.5% - -5.1% - -6.6% - -7.6% - -5.2% - -6.2% - -8.3% - -6.5% - -7.9% 3.8% 6.5% 6.2% 7.8% 5.7% 3.3% - -4.0% - -5.3% - -6.3% - -2.6% - -4.3% - -7.6% - -8.4% - -5.3% 0.2% - -0.2% - -10.0% - -8.0% - -6.0% - -4.0% - -2.0% 0.0% 2.0% 4.0% 6.0% 8.0% 10.0% Q1'05 Q2 Q3 Q4 Q1'06 Q2 Q3 Q4 Q1'07 Q2 Q3 Q4 Q1'08 Q2 Q3 Q4 Home Depot Lowe's |
| Working Capital and Capital Expenditure |
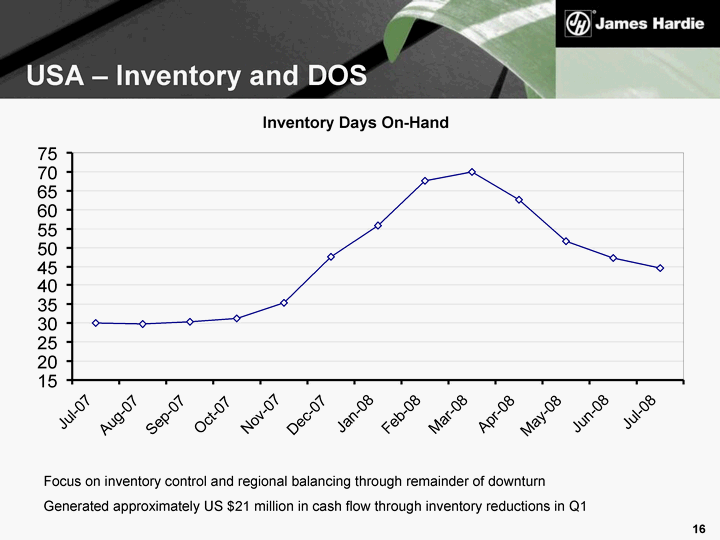
| USA - Inventory and DOS Focus on inventory control and regional balancing through remainder of downturn Generated approximately US $21 million in cash flow through inventory reductions in Q1 Inventory Days On-Hand 15 20 25 30 35 40 45 50 55 60 65 70 75 Jul-07 Aug-07 Sep-07 Oct-07 Nov-07 Dec-07 Jan-08 Feb-08 Mar-08 Apr-08 May-08 Jun-08 Jul-08 |
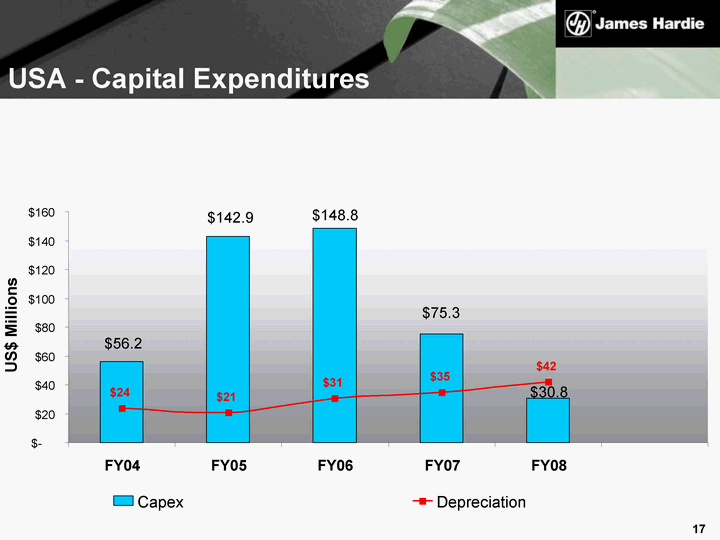
| USA - Capital Expenditures $30.8 $75.3 $148.8 $56.2 $142.9 $35 $24 $21 $31 $42 $- $20 $40 $60 $80 $100 $120 $140 $160 FY04 FY05 FY06 FY07 FY08 US$ Millions Capex Depreciation |
| Focus of USA - Business in Downturn EBIT and cash maximization Maintain/grow contribution margin per housing start Maintain/grow R&R market share Working capital and capital efficiency Cost management - all areas of the business (procurement, conversion cost, ceasing unnecessary activities) Product mix shift Grow overall market and category share |
| Definitions Financial Measures - US GAAP equivalents EBIT and EBIT Margin - EBIT, as used in this document, is equivalent to the US GAAP measure of operating income. EBIT margin is defined as EBIT as a percentage of net sales. We believe EBIT and EBIT margin to be relevant and useful information as these are the primary measures used by our management to measure the operating profit or loss of our business. EBIT is one of several metrics used by our management to measure the earnings generated from our operations, excluding interest and income tax expenses. Additionally, EBIT is believed to be a primary measure and terminology used by our Australian investors. EBIT and EBIT margin should be considered in addition to, but not as a substitute for, other measures of financial performance reported in accordance with accounting principles generally accepted in the United States of America. EBIT and EBIT margin, as we have defined them, may not be comparable to similarly titled measures reported by other companies. Operating profit - is equivalent to the US GAAP measure of income. Net operating profit - is equivalent to the US GAAP measure of net income. Sales Volumes mmsf - million square feet, where a square foot is defined as a standard square foot of 5/16" thickness. msf - thousand square feet, where a square foot is defined as a standard square foot of 5/16" thickness. Endnotes |
| Financial Ratios Gearing Ratio - Net debt (cash) divided by net debt (cash) plus shareholders' equity. Net interest expense cover - EBIT divided by net interest expense. Net interest paid cover - EBIT divided by cash paid during the period for interest, net of amounts capitalised. Net debt payback - Net debt (cash) divided by cash flow from operations. Net debt (cash) - Short-term and long-term debt less cash and cash equivalents. Endnotes |
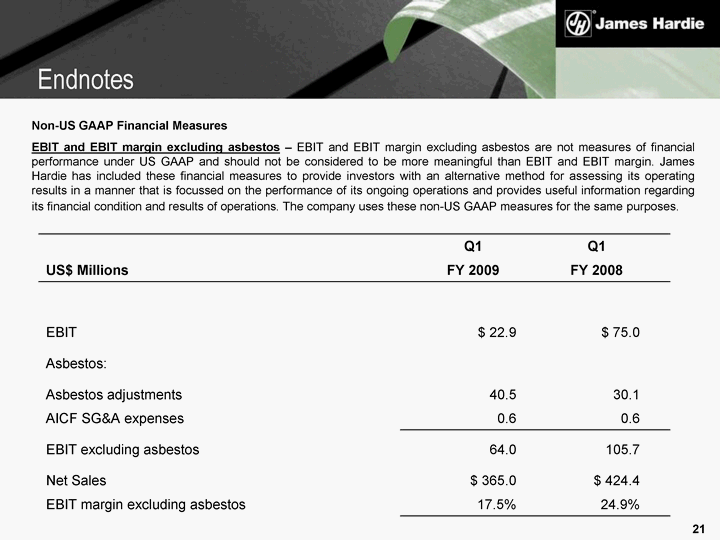
| Non-US GAAP Financial Measures EBIT and EBIT margin excluding asbestos - EBIT and EBIT margin excluding asbestos are not measures of financial performance under US GAAP and should not be considered to be more meaningful than EBIT and EBIT margin. James Hardie has included these financial measures to provide investors with an alternative method for assessing its operating results in a manner that is focussed on the performance of its ongoing operations and provides useful information regarding its financial condition and results of operations. The company uses these non-US GAAP measures for the same purposes. Q1 Q1 US$ Millions FY 2009 FY 2008 EBIT $ 22.9 $ 75.0 Asbestos: Asbestos adjustments 40.5 30.1 AICF SG&A expenses 0.6 0.6 EBIT excluding asbestos 64.0 105.7 Net Sales $ 365.0 $ 424.4 EBIT margin excluding asbestos 17.5% 24.9% Endnotes |
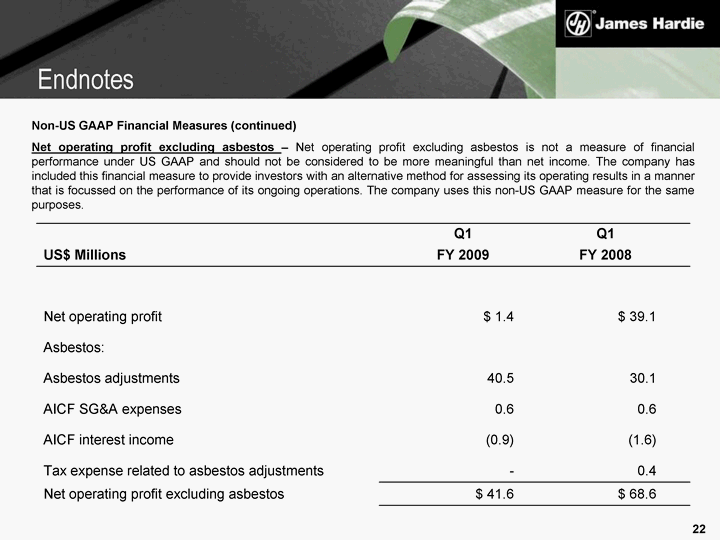
| Non-US GAAP Financial Measures (continued) Net operating profit excluding asbestos - Net operating profit excluding asbestos is not a measure of financial performance under US GAAP and should not be considered to be more meaningful than net income. The company has included this financial measure to provide investors with an alternative method for assessing its operating results in a manner that is focussed on the performance of its ongoing operations. The company uses this non-US GAAP measure for the same purposes. Q1 Q1 US$ Millions FY 2009 FY 2008 Net operating profit $ 1.4 $ 39.1 Asbestos: Asbestos adjustments 40.5 30.1 AICF SG&A expenses 0.6 0.6 AICF interest income (0.9) (1.6) Tax expense related to asbestos adjustments - 0.4 Net operating profit excluding asbestos $ 41.6 $ 68.6 Endnotes |
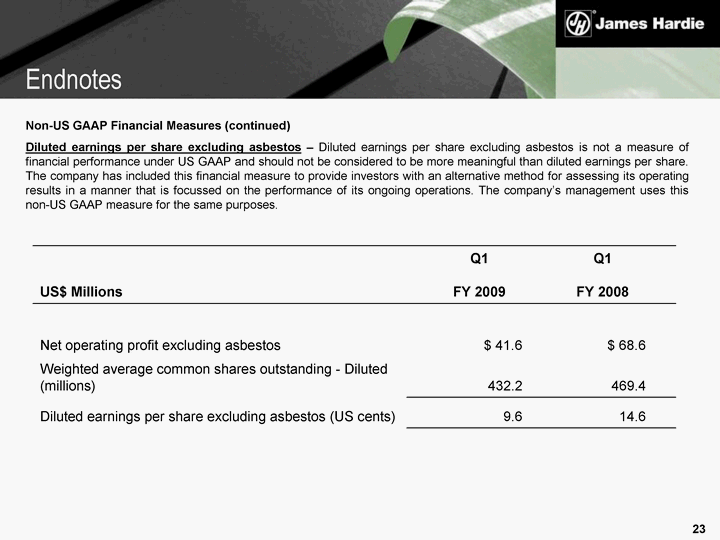
| Non-US GAAP Financial Measures (continued) Diluted earnings per share excluding asbestos - Diluted earnings per share excluding asbestos is not a measure of financial performance under US GAAP and should not be considered to be more meaningful than diluted earnings per share. The company has included this financial measure to provide investors with an alternative method for assessing its operating results in a manner that is focussed on the performance of its ongoing operations. The company's management uses this non-US GAAP measure for the same purposes. Q1 Q1 US$ Millions FY 2009 FY 2008 Net operating profit excluding asbestos $ 41.6 $ 68.6 Weighted average common shares outstanding - Diluted (millions) 432.2 469.4 Diluted earnings per share excluding asbestos (US cents) 9.6 14.6 Endnotes |
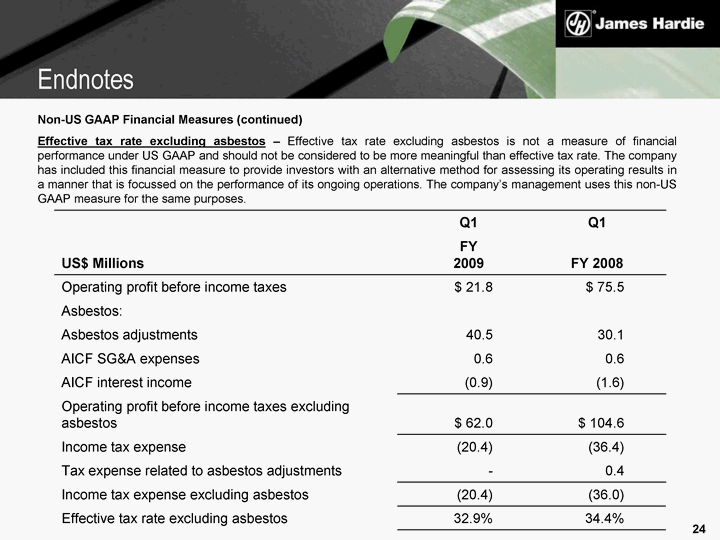
| Non-US GAAP Financial Measures (continued) Effective tax rate excluding asbestos - Effective tax rate excluding asbestos is not a measure of financial performance under US GAAP and should not be considered to be more meaningful than effective tax rate. The company has included this financial measure to provide investors with an alternative method for assessing its operating results in a manner that is focussed on the performance of its ongoing operations. The company's management uses this non-US GAAP measure for the same purposes. Q1 Q1 US$ Millions FY 2009 FY 2008 Operating profit before income taxes $ 21.8 $ 75.5 Asbestos: Asbestos adjustments 40.5 30.1 AICF SG&A expenses 0.6 0.6 AICF interest income (0.9) (1.6) Operating profit before income taxes excluding asbestos $ 62.0 $ 104.6 Income tax expense (20.4) (36.4) Tax expense related to asbestos adjustments - 0.4 Income tax expense excluding asbestos (20.4) (36.0) Effective tax rate excluding asbestos 32.9% 34.4% Endnotes |
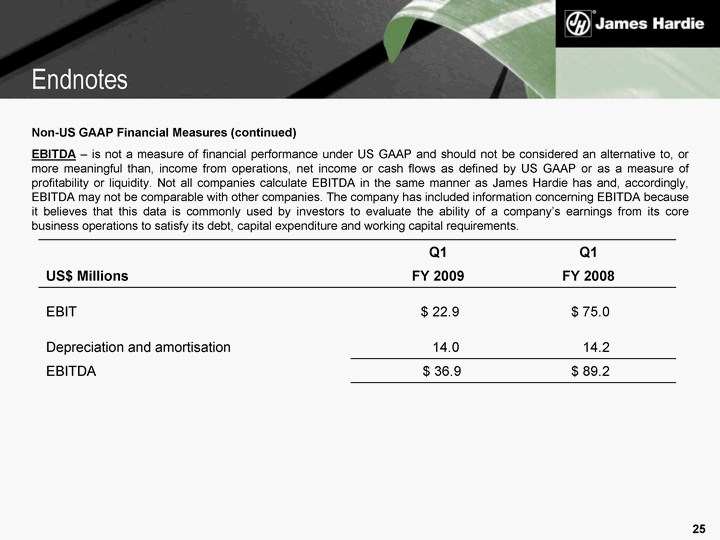
| Non-US GAAP Financial Measures (continued) EBITDA - is not a measure of financial performance under US GAAP and should not be considered an alternative to, or more meaningful than, income from operations, net income or cash flows as defined by US GAAP or as a measure of profitability or liquidity. Not all companies calculate EBITDA in the same manner as James Hardie has and, accordingly, EBITDA may not be comparable with other companies. The company has included information concerning EBITDA because it believes that this data is commonly used by investors to evaluate the ability of a company's earnings from its core business operations to satisfy its debt, capital expenditure and working capital requirements. Q1 Q1 US$ Millions FY 2009 FY 2008 EBIT $ 22.9 $ 75.0 Depreciation and amortisation 14.0 14.2 EBITDA $ 36.9 $ 89.2 Endnotes |