
| In this Management Presentation, James Hardie may present financial measures, sales volume terms, financial ratios, and Non- US GAAP financial measures included in the Definitions section of this document starting on page 46. The company presents financial measures that it believes are customarily used by its Australian investors. Specifically, these financial measures, which are equivalent to or derived from certain US GAAP measures as explained in the definitions, include "EBIT", "EBIT margin", "Operating profit" and "Net operating profit". The company may also present other terms for measuring its sales volumes ("million square feet or mmsf" and "thousand square feet or msf"); financial ratios ("Gearing ratio", "Net interest expense cover", "Net interest paid cover", "Net debt payback", "Net debt (cash)"); and Non-US GAAP financial measures ("EBIT excluding asbestos and ASIC expenses", "EBIT margin excluding asbestos and ASIC expenses", "Net operating profit excluding asbestos, ASIC expenses and tax adjustments", "Diluted earnings per share excluding asbestos, ASIC expenses and tax adjustments", "Operating profit before income taxes excluding asbestos and ASIC expenses" , "Effective tax rate excluding asbestos and tax adjustments" and "EBITDA"). Unless otherwise stated, results and comparisons are of the 2nd quarter and 1st half of the current fiscal year versus the 2nd quarter and 1st half of the prior fiscal year. James Hardie Q2 FY09 Results Management Presentation - 17 November 2008 |

| Overview and Operating Review - Louis Gries, CEO Financial Review - Russell Chenu, CFO Questions and Answers Agenda |
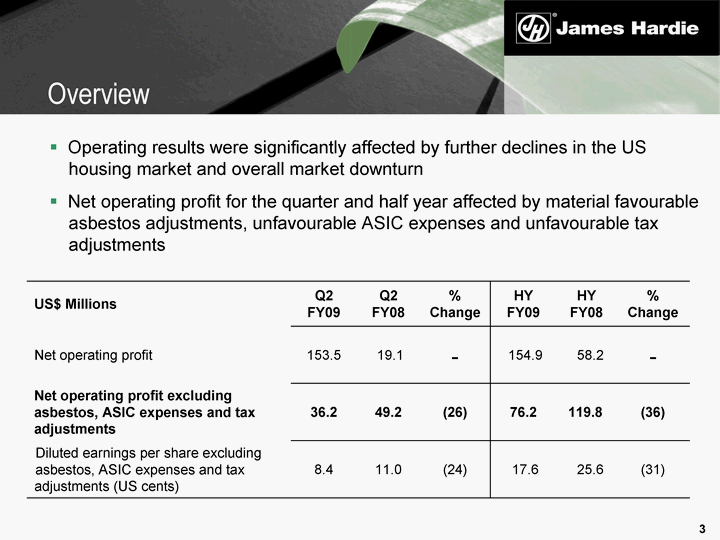
| Operating results were significantly affected by further declines in the US housing market and overall market downturn Net operating profit for the quarter and half year affected by material favourable asbestos adjustments, unfavourable ASIC expenses and unfavourable tax adjustments US$ Millions Q2 FY09 Q2 FY08 % Change HY FY09 HY FY08 % Change Net operating profit 153.5 19.1 - 154.9 58.2 - Net operating profit excluding asbestos, ASIC expenses and tax adjustments 36.2 49.2 (26) 76.2 119.8 (36) Diluted earnings per share excluding asbestos, ASIC expenses and tax adjustments (US cents) 8.4 11.0 (24) 17.6 25.6 (31) Overview |

| Operating Review Louis Gries, CEO |
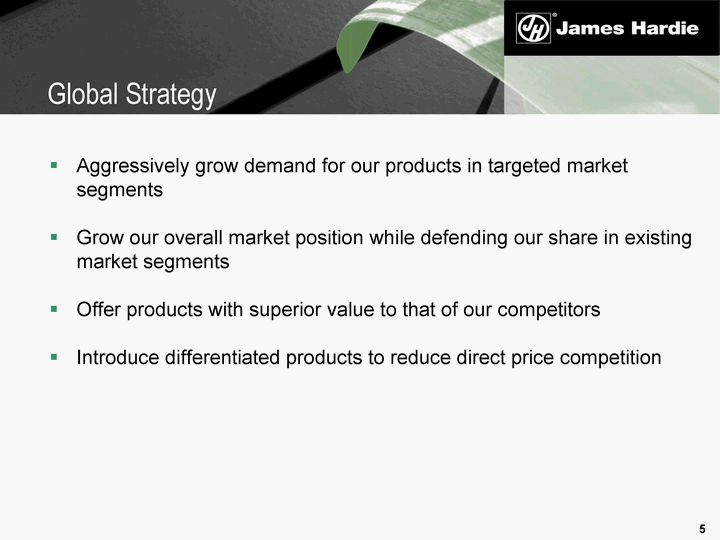
| Aggressively grow demand for our products in targeted market segments Grow our overall market position while defending our share in existing market segments Offer products with superior value to that of our competitors Introduce differentiated products to reduce direct price competition Global Strategy |
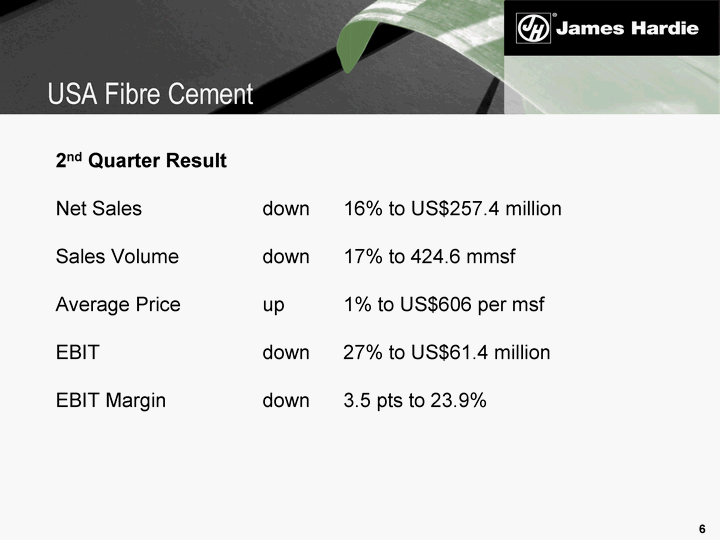
| 2nd Quarter Result Net Sales down 16% to US$257.4 million Sales Volume down 17% to 424.6 mmsf Average Price up 1% to US$606 per msf EBIT down 27% to US$61.4 million EBIT Margin down 3.5 pts to 23.9% USA Fibre Cement |
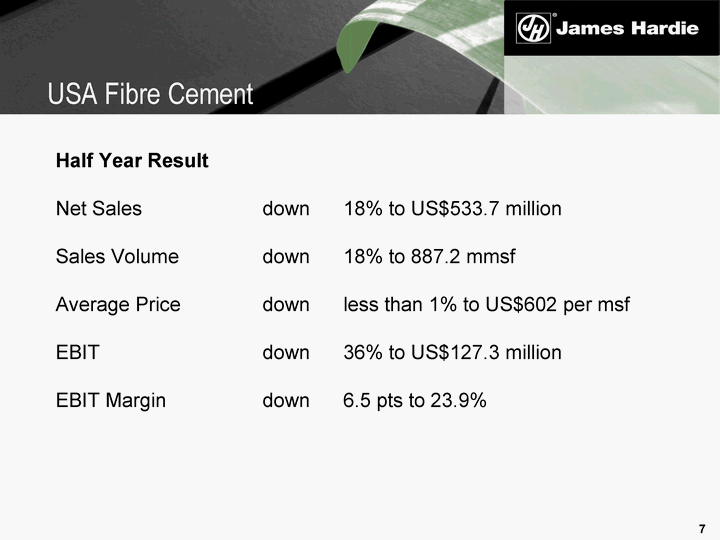
| Half Year Result Net Sales down 18% to US$533.7 million Sales Volume down 18% to 887.2 mmsf Average Price down less than 1% to US$602 per msf EBIT down 36% to US$127.3 million EBIT Margin down 6.5 pts to 23.9% USA Fibre Cement |
| 2nd Quarter Market Conditions Further deterioration in new housing construction activity Starts down 35% for the quarter, compared to last year Market demand affected by weaker economic conditions, tighter lending standards and falling house prices Inventory level of new homes remains high More existing homes for sale due to increase in foreclosures Builder confidence levels remain very low Repair & Remodelling activity down, but much less than new construction USA Fibre Cement |
| 2nd Quarter Key Points Sales down due to declining market Sales volumes were lower across all divisions and in each key region, other than Canada While sales of most exterior products declined, the differentiated ColorPlus(r) collection of products increased market penetration in the quarter Weakness in Repair & Remodelling activity led to lower sales of interior products Freight costs increased Average net sales price increased slightly due to product mix and material costs USA Fibre Cement |
| Announced on 4 November 2008, in response to the continued deterioration in the US housing market: Suspension of operations at Fontana, California plant Fontana, a 175 mmsf per annum plant, has been running at reduced operating levels since the market downturn Reduction in demand in the core area it services in the US Southwest The plant employed 60 people Suspension of operations at Summerville, South Carolina plant Summerville, a 190 mmsf per annum plant, has been running at reduced operating levels During the shut-down, the appropriate future product mix for the plant will be determined The plant employed 67 people The plants will re-open when market demand returns to acceptable levels USA Fibre Cement |
| Outlook On-going downward pressure on house prices and weaker demand Repair & Remodelling activity expected to continue to be soft Maintain or grow market share of fibre cement against alternative materials Maintain share of fibre cement category USA Fibre Cement |
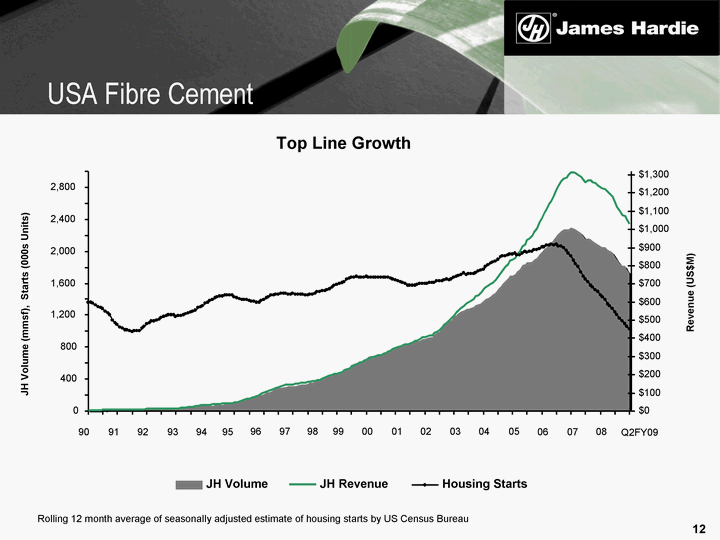
| Rolling 12 month average of seasonally adjusted estimate of housing starts by US Census Bureau Top Line Growth 0 400 800 1,200 1,600 2,000 2,400 2,800 90 91 92 93 94 95 96 97 98 99 00 01 02 03 04 05 06 07 08 JH Volume (mmsf), Starts (000s Units) $0 $100 $200 $300 $400 $500 $600 $700 $800 $900 $1,000 $1,100 $1,200 $1,300 Revenue (US$M) JH Volume JH Revenue Housing Starts Q2FY09 USA Fibre Cement |
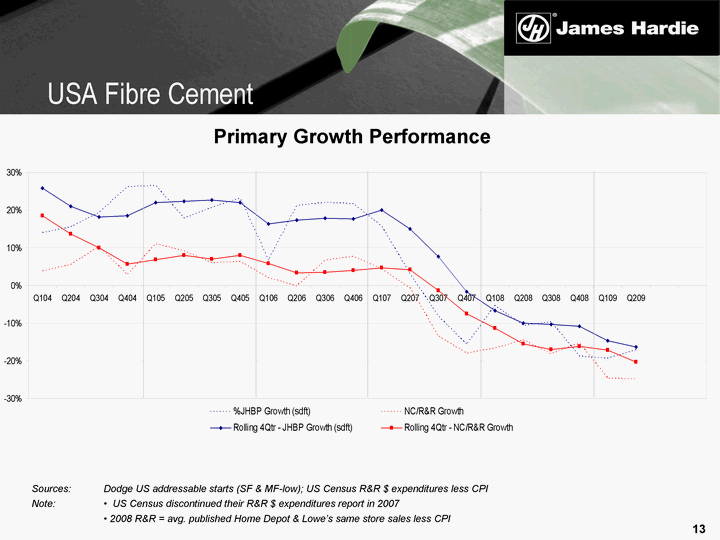
| Primary Growth Performance Sources: Dodge US addressable starts (SF & MF-low); US Census R&R $ expenditures less CPI Note: • US Census discontinued their R&R $ expenditures report in 2007 • 2008 R&R = avg. published Home Depot & Lowe's same store sales less CPI USA Fibre Cement |
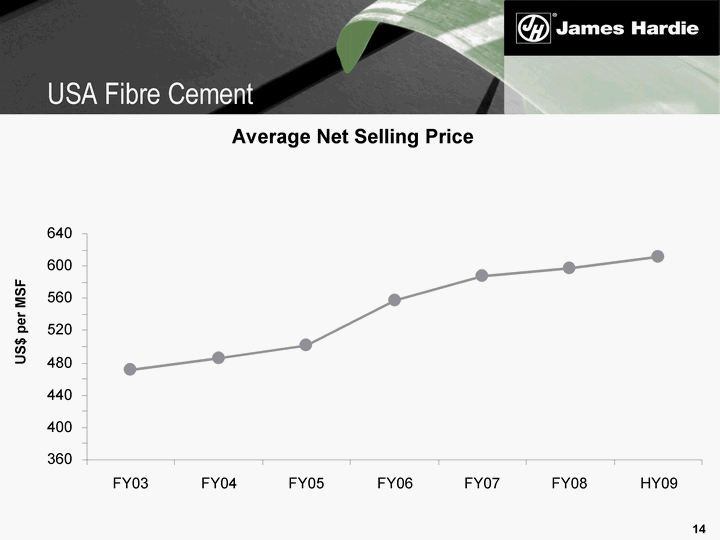
| Average Net Selling Price US$ per MSF 360 400 440 480 520 560 600 640 FY03 FY04 FY05 FY06 FY07 FY08 HY09 USA Fibre Cement |
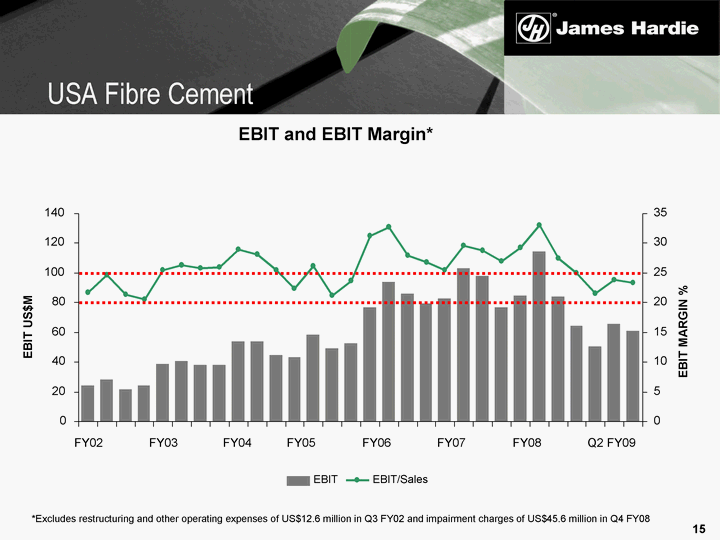
| *Excludes restructuring and other operating expenses of US$12.6 million in Q3 FY02 and impairment charges of US$45.6 million in Q4 FY08 EBIT and EBIT Margin* 0 20 40 60 80 100 120 140 FY02 FY03 FY04 FY05 FY06 FY07 FY08 Q2 FY09 EBIT US$M 0 5 10 15 20 25 30 35 EBIT MARGIN % EBIT EBIT/Sales USA Fibre Cement |
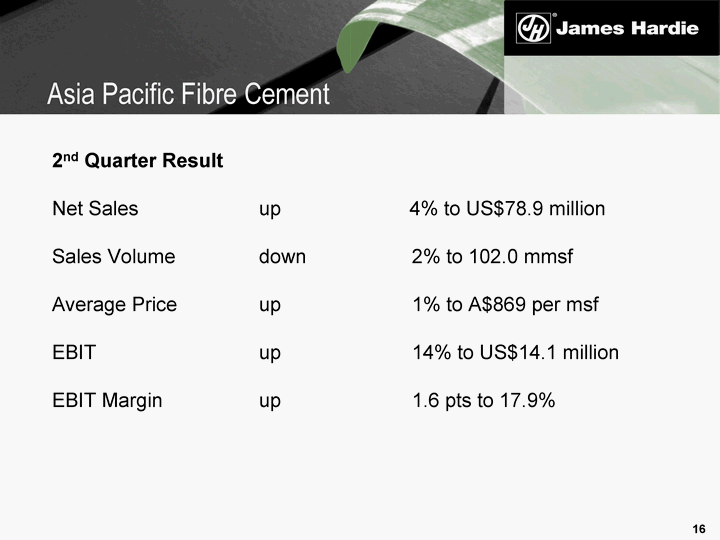
| 2nd Quarter Result Net Sales up 4% to US$78.9 million Sales Volume down 2% to 102.0 mmsf Average Price up 1% to A$869 per msf EBIT up 14% to US$14.1 million EBIT Margin up 1.6 pts to 17.9% Asia Pacific Fibre Cement |
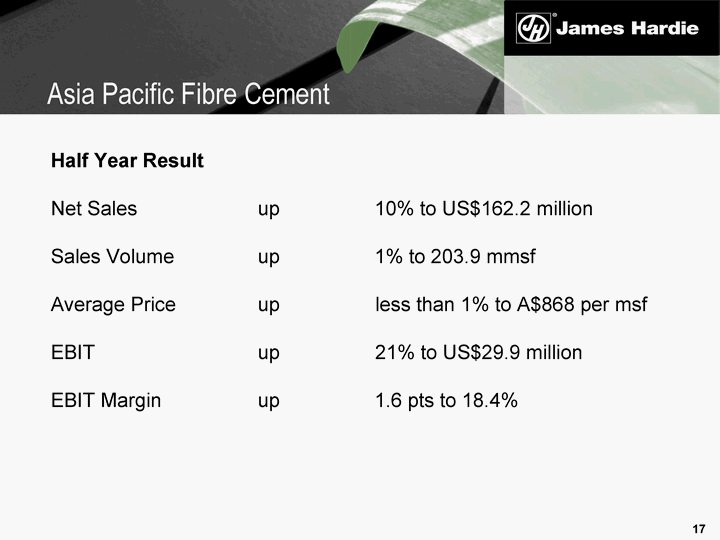
| Half Year Result Net Sales up 10% to US$162.2 million Sales Volume up 1% to 203.9 mmsf Average Price up less than 1% to A$868 per msf EBIT up 21% to US$29.9 million EBIT Margin up 1.6 pts to 18.4% Asia Pacific Fibre Cement |
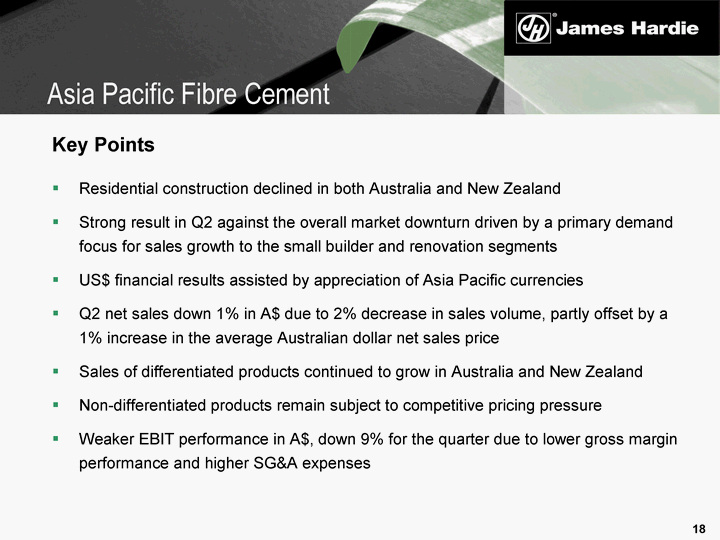
| Key Points Residential construction declined in both Australia and New Zealand Strong result in Q2 against the overall market downturn driven by a primary demand focus for sales growth to the small builder and renovation segments US$ financial results assisted by appreciation of Asia Pacific currencies Q2 net sales down 1% in A$ due to 2% decrease in sales volume, partly offset by a 1% increase in the average Australian dollar net sales price Sales of differentiated products continued to grow in Australia and New Zealand Non-differentiated products remain subject to competitive pricing pressure Weaker EBIT performance in A$, down 9% for the quarter due to lower gross margin performance and higher SG&A expenses Asia Pacific Fibre Cement |

| Outlook Building approvals expected to continue to fall in Australia and in New Zealand Housing affordability to remain under pressure with high interest rates and fuel costs Continued growth in sales of differentiated products Non-differentiated products in Australia are expected to remain subject to strong competition In the Philippines, residential construction activity is expected to be flat, or decline Asia Pacific Fibre Cement |

| Financial Review Russell Chenu, CFO |
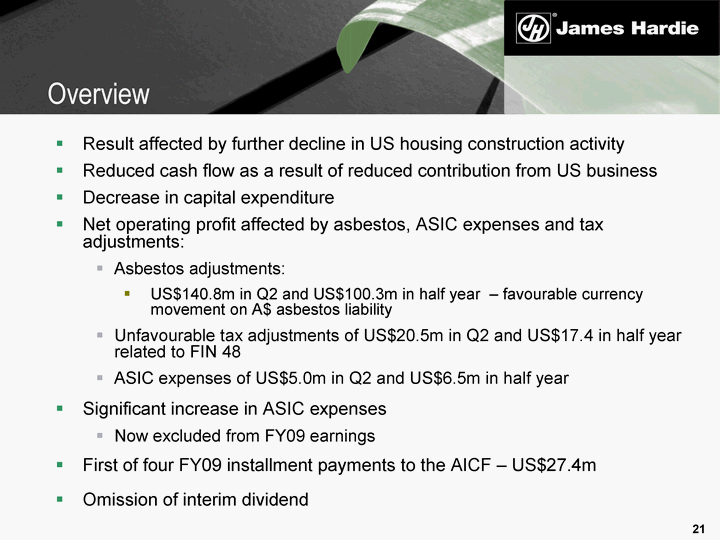
| Result affected by further decline in US housing construction activity Reduced cash flow as a result of reduced contribution from US business Decrease in capital expenditure Net operating profit affected by asbestos, ASIC expenses and tax adjustments: Asbestos adjustments: US$140.8m in Q2 and US$100.3m in half year - favourable currency movement on A$ asbestos liability Unfavourable tax adjustments of US$20.5m in Q2 and US$17.4 in half year related to FIN 48 ASIC expenses of US$5.0m in Q2 and US$6.5m in half year Significant increase in ASIC expenses Now excluded from FY09 earnings First of four FY09 installment payments to the AICF - US$27.4m Omission of interim dividend Overview |
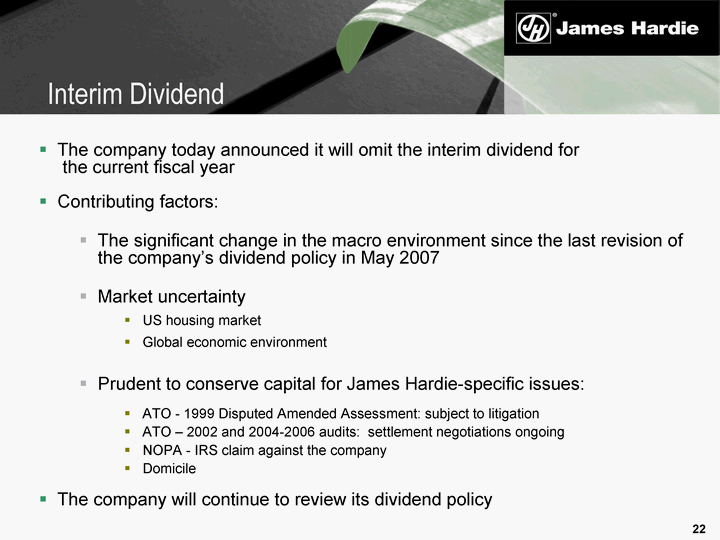
| The company today announced it will omit the interim dividend for the current fiscal year Contributing factors: The significant change in the macro environment since the last revision of the company's dividend policy in May 2007 Market uncertainty US housing market Global economic environment Prudent to conserve capital for James Hardie-specific issues: ATO - 1999 Disputed Amended Assessment: subject to litigation ATO - 2002 and 2004-2006 audits: settlement negotiations ongoing NOPA - IRS claim against the company Domicile The company will continue to review its dividend policy Interim Dividend |
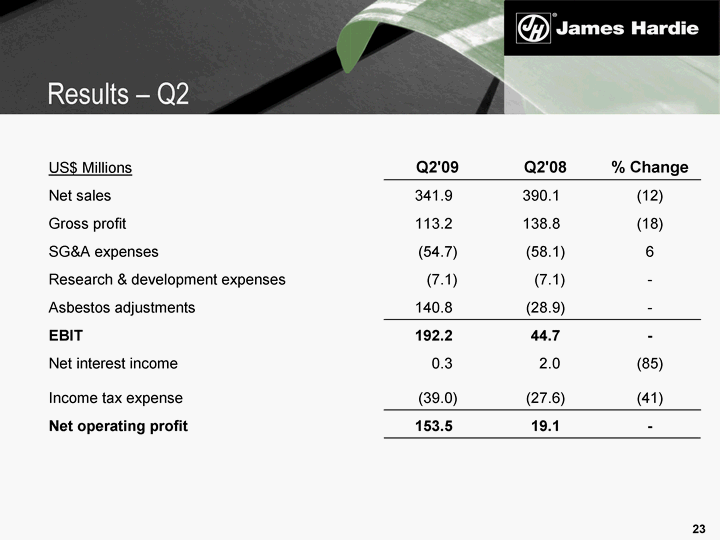
| US$ Millions Q2'09 Q2'08 % Change Net sales 341.9 390.1 (12) Gross profit 113.2 138.8 (18) SG&A expenses (54.7) (58.1) 6 Research & development expenses (7.1) (7.1) - Asbestos adjustments 140.8 (28.9) - EBIT 192.2 44.7 - Net interest income 0.3 2.0 (85) Income tax expense (39.0) (27.6) (41) Net operating profit 153.5 19.1 - Results - Q2 |
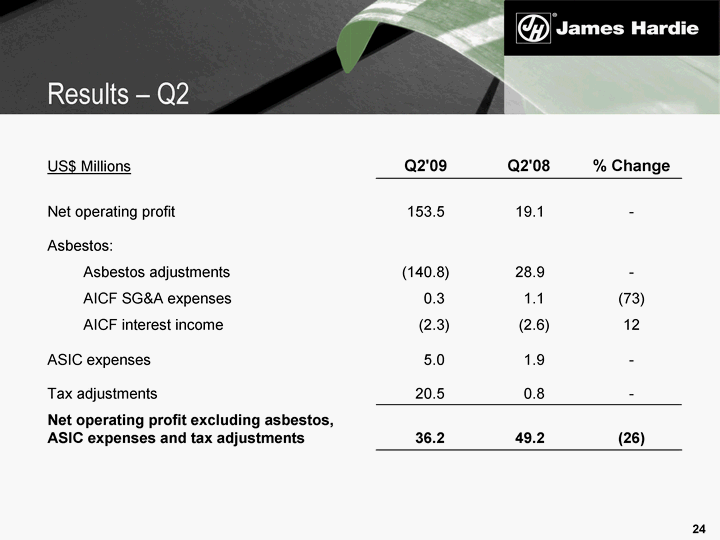
| US$ Millions Q2'09 Q2'08 % Change Net operating profit 153.5 19.1 - Asbestos: Asbestos adjustments (140.8) 28.9 - AICF SG&A expenses 0.3 1.1 (73) AICF interest income (2.3) (2.6) 12 ASIC expenses 5.0 1.9 - Tax adjustments 20.5 0.8 - Net operating profit excluding asbestos, ASIC expenses and tax adjustments 36.2 49.2 (26) Results - Q2 |
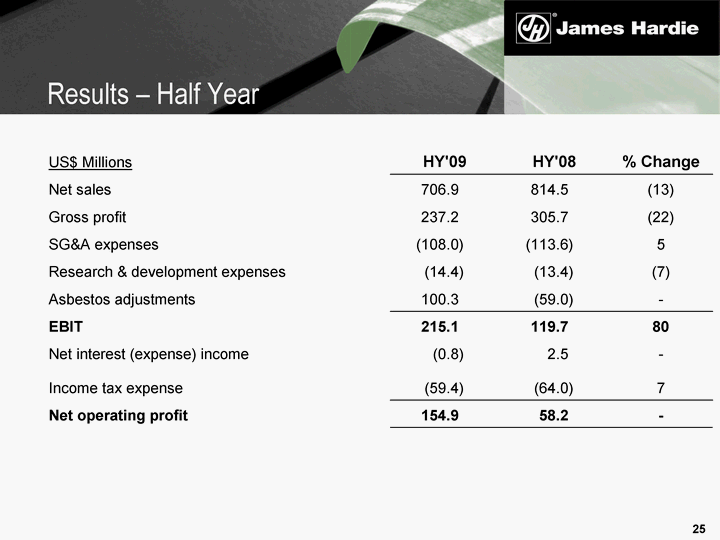
| US$ Millions HY'09 HY'08 % Change Net sales 706.9 814.5 (13) Gross profit 237.2 305.7 (22) SG&A expenses (108.0) (113.6) 5 Research & development expenses (14.4) (13.4) (7) Asbestos adjustments 100.3 (59.0) - EBIT 215.1 119.7 80 Net interest (expense) income (0.8) 2.5 - Income tax expense (59.4) (64.0) 7 Net operating profit 154.9 58.2 - Results - Half Year |
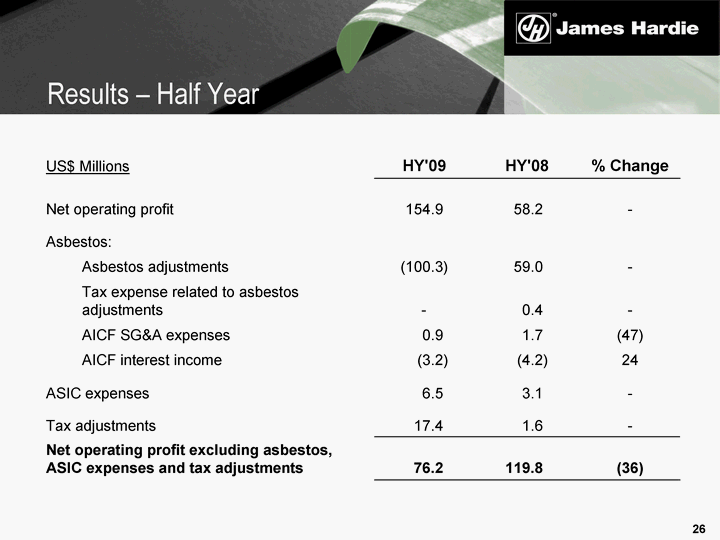
| US$ Millions HY'09 HY'08 % Change Net operating profit 154.9 58.2 - Asbestos: Asbestos adjustments (100.3) 59.0 - Tax expense related to asbestos adjustments - 0.4 - AICF SG&A expenses 0.9 1.7 (47) AICF interest income (3.2) (4.2) 24 ASIC expenses 6.5 3.1 - Tax adjustments 17.4 1.6 - Net operating profit excluding asbestos, ASIC expenses and tax adjustments 76.2 119.8 (36) Results - Half Year |

| US$ Millions Q2'09 Q2'08 % Change USA and Europe Fibre Cement 263.0 314.0 (16) Asia Pacific Fibre Cement 78.9 76.1 4 Total 341.9 390.1 (12) Segment Net Sales - Q2 |
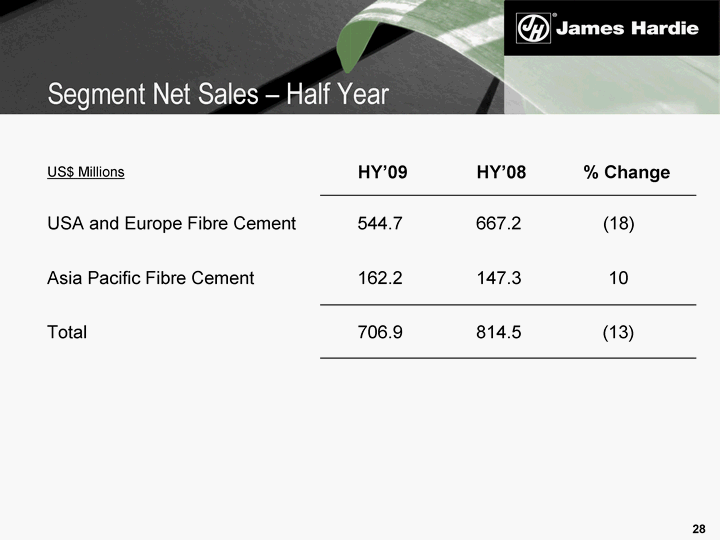
| US$ Millions HY'09 HY'08 % Change USA and Europe Fibre Cement 544.7 667.2 (18) Asia Pacific Fibre Cement 162.2 147.3 10 Total 706.9 814.5 (13) Segment Net Sales - Half Year |
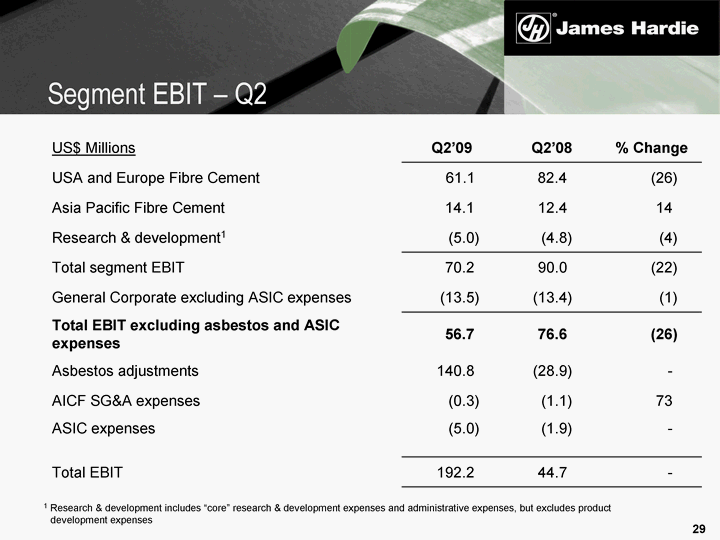
| US$ Millions Q2'09 Q2'08 % Change USA and Europe Fibre Cement 61.1 82.4 (26) Asia Pacific Fibre Cement 14.1 12.4 14 Research & development1 (5.0) (4.8) (4) Total segment EBIT 70.2 90.0 (22) General Corporate excluding ASIC expenses (13.5) (13.4) (1) Total EBIT excluding asbestos and ASIC expenses 56.7 76.6 (26) Asbestos adjustments 140.8 (28.9) - AICF SG&A expenses (0.3) (1.1) 73 ASIC expenses (5.0) (1.9) - Total EBIT 192.2 44.7 - 1 Research & development includes "core" research & development expenses and administrative expenses, but excludes product development expenses Segment EBIT - Q2 |
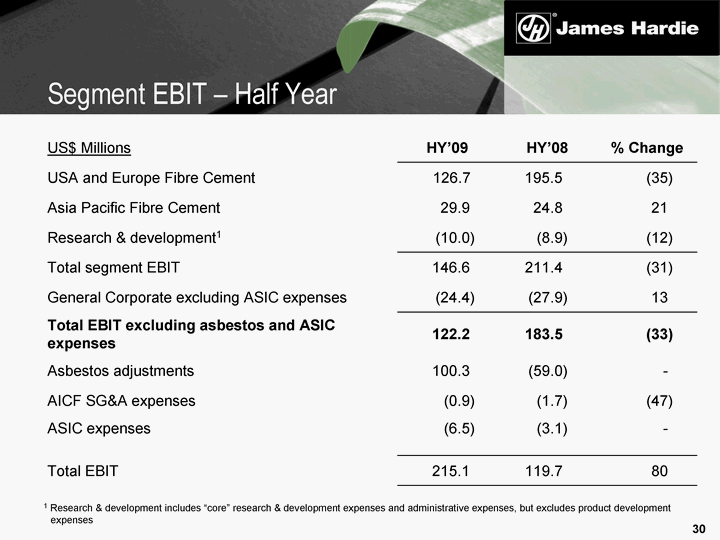
| US$ Millions HY'09 HY'08 % Change USA and Europe Fibre Cement 126.7 195.5 (35) Asia Pacific Fibre Cement 29.9 24.8 21 Research & development1 (10.0) (8.9) (12) Total segment EBIT 146.6 211.4 (31) General Corporate excluding ASIC expenses (24.4) (27.9) 13 Total EBIT excluding asbestos and ASIC expenses 122.2 183.5 (33) Asbestos adjustments 100.3 (59.0) - AICF SG&A expenses (0.9) (1.7) (47) ASIC expenses (6.5) (3.1) - Total EBIT 215.1 119.7 80 1 Research & development includes "core" research & development expenses and administrative expenses, but excludes product development expenses Segment EBIT - Half Year |
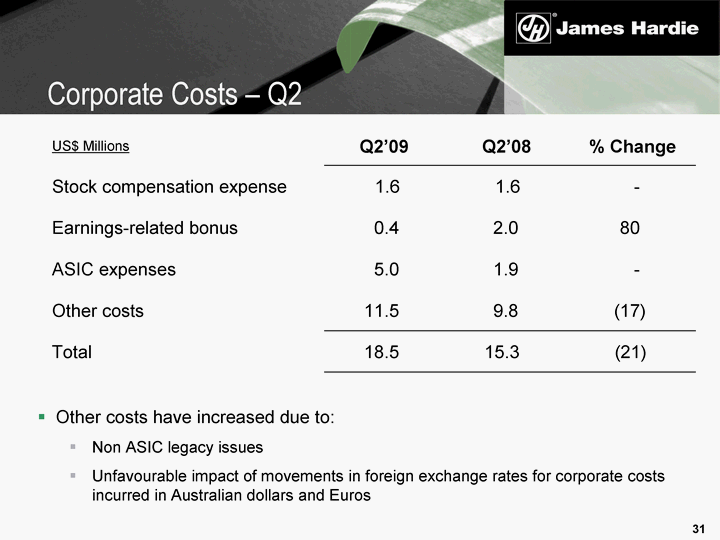
| US$ Millions Q2'09 Q2'08 % Change Stock compensation expense 1.6 1.6 - Earnings-related bonus 0.4 2.0 80 ASIC expenses 5.0 1.9 - Other costs 11.5 9.8 (17) Total 18.5 15.3 (21) Other costs have increased due to: Non ASIC legacy issues Unfavourable impact of movements in foreign exchange rates for corporate costs incurred in Australian dollars and Euros Corporate Costs - Q2 |
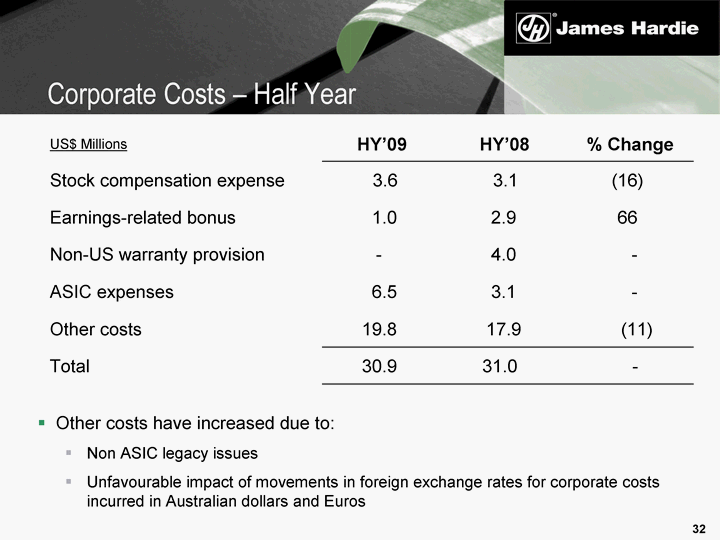
| US$ Millions HY'09 HY'08 % Change Stock compensation expense 3.6 3.1 (16) Earnings-related bonus 1.0 2.9 66 Non-US warranty provision - 4.0 - ASIC expenses 6.5 3.1 - Other costs 19.8 17.9 (11) Total 30.9 31.0 - Other costs have increased due to: Non ASIC legacy issues Unfavourable impact of movements in foreign exchange rates for corporate costs incurred in Australian dollars and Euros Corporate Costs - Half Year |
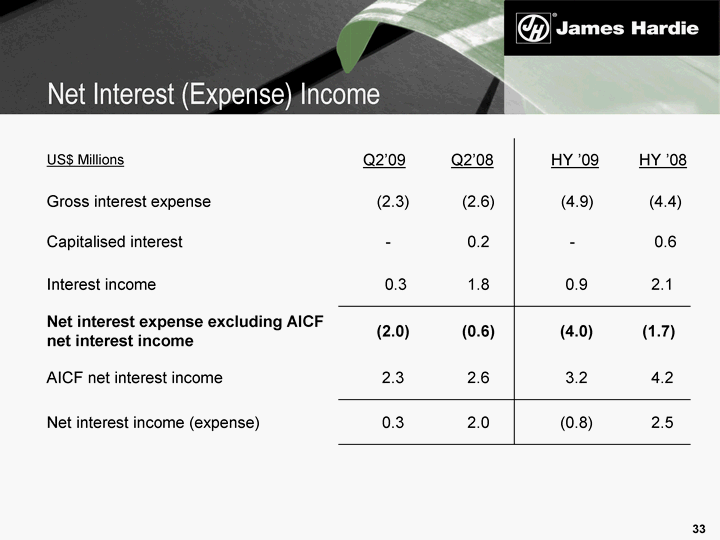
| US$ Millions Q2'09 Q2'08 HY '09 HY '08 Gross interest expense (2.3) (2.6) (4.9) (4.4) Capitalised interest - 0.2 - 0.6 Interest income 0.3 1.8 0.9 2.1 Net interest expense excluding AICF net interest income (2.0) (0.6) (4.0) (1.7) AICF net interest income 2.3 2.6 3.2 4.2 Net interest income (expense) 0.3 2.0 (0.8) 2.5 Net Interest (Expense) Income |
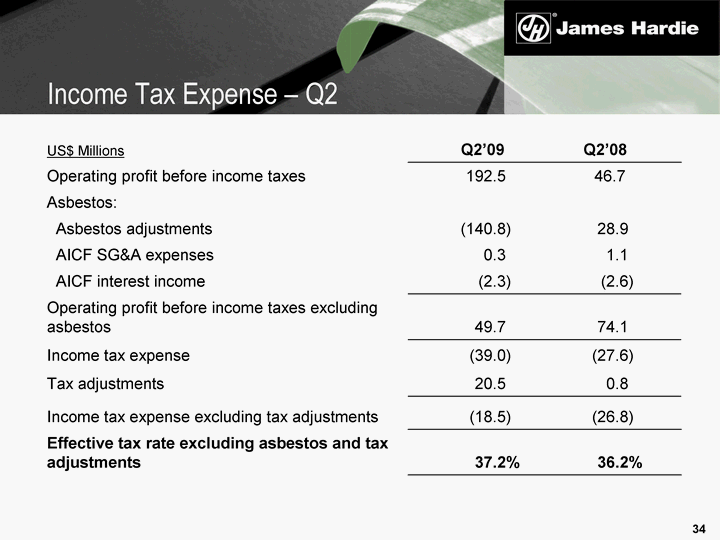
| US$ Millions US$ Millions Q2'09 Q2'08 Operating profit before income taxes Operating profit before income taxes 192.5 46.7 Asbestos: Asbestos: Asbestos adjustments Asbestos adjustments (140.8) 28.9 AICF SG&A expenses AICF SG&A expenses 0.3 1.1 AICF interest income AICF interest income (2.3) (2.6) Operating profit before income taxes excluding asbestos Operating profit before income taxes excluding asbestos 49.7 74.1 Income tax expense Income tax expense (39.0) (27.6) Tax adjustments Tax adjustments 20.5 0.8 Income tax expense excluding tax adjustments Income tax expense excluding tax adjustments (18.5) (26.8) Effective tax rate excluding asbestos and tax adjustments Effective tax rate excluding asbestos and tax adjustments 37.2% 36.2% Income Tax Expense - Q2 |

| US$ Millions HY'09 HY'08 Operating profit before income taxes 214.3 122.2 Asbestos: Asbestos adjustments (100.3) 59.0 AICF SG&A expenses 0.9 1.7 AICF interest income (3.2) (4.2) Operating profit before income taxes excluding asbestos 111.7 178.7 Income tax expense (59.4) (64.0) Asbestos: Tax expense related to asbestos adjustments - 0.4 Tax adjustments 17.4 1.6 Income tax expense excluding asbestos and tax adjustments (42.0) (62.0) Effective tax rate excluding asbestos and tax adjustments 37.6% 34.7% Income Tax Expense - Half Year |
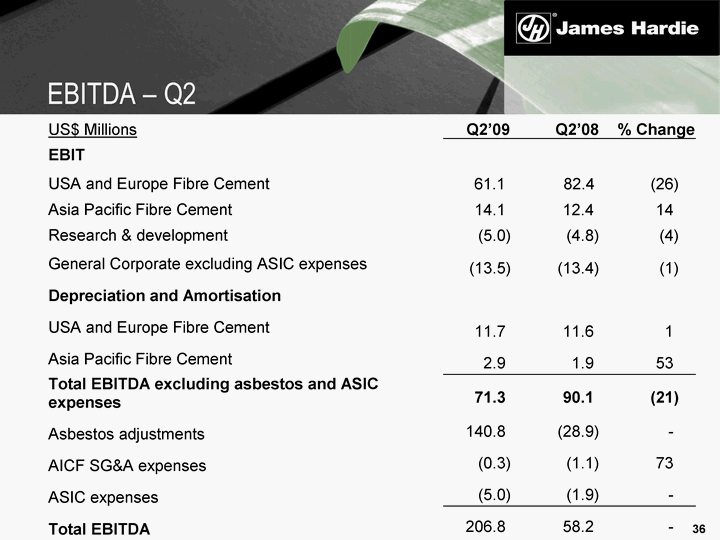
| US$ Millions Q2'09 Q2'08 % Change EBIT USA and Europe Fibre Cement 61.1 82.4 (26) Asia Pacific Fibre Cement 14.1 12.4 14 Research & development (5.0) (4.8) (4) General Corporate excluding ASIC expenses (13.5) (13.4) (1) Depreciation and Amortisation USA and Europe Fibre Cement 11.7 11.6 1 Asia Pacific Fibre Cement 2.9 1.9 53 Total EBITDA excluding asbestos and ASIC expenses 71.3 90.1 (21) Asbestos adjustments 140.8 (28.9) - AICF SG&A expenses (0.3) (1.1) 73 ASIC expenses (5.0) (1.9) - Total EBITDA 206.8 58.2 - EBITDA - Q2 |
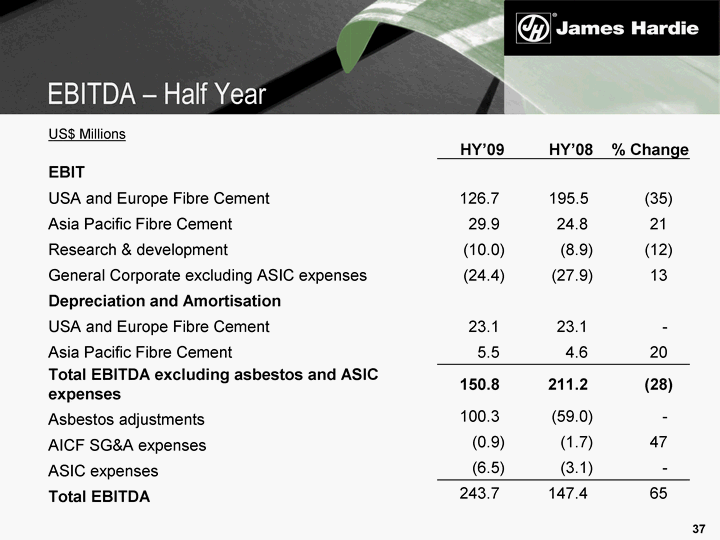
| US$ Millions HY'09 HY'08 % Change EBIT USA and Europe Fibre Cement 126.7 195.5 (35) Asia Pacific Fibre Cement 29.9 24.8 21 Research & development (10.0) (8.9) (12) General Corporate excluding ASIC expenses (24.4) (27.9) 13 Depreciation and Amortisation USA and Europe Fibre Cement 23.1 23.1 - Asia Pacific Fibre Cement 5.5 4.6 20 Total EBITDA excluding asbestos and ASIC expenses 150.8 211.2 (28) Asbestos adjustments 100.3 (59.0) - AICF SG&A expenses (0.9) (1.7) 47 ASIC expenses (6.5) (3.1) - Total EBITDA 243.7 147.4 65 EBITDA - Half Year |
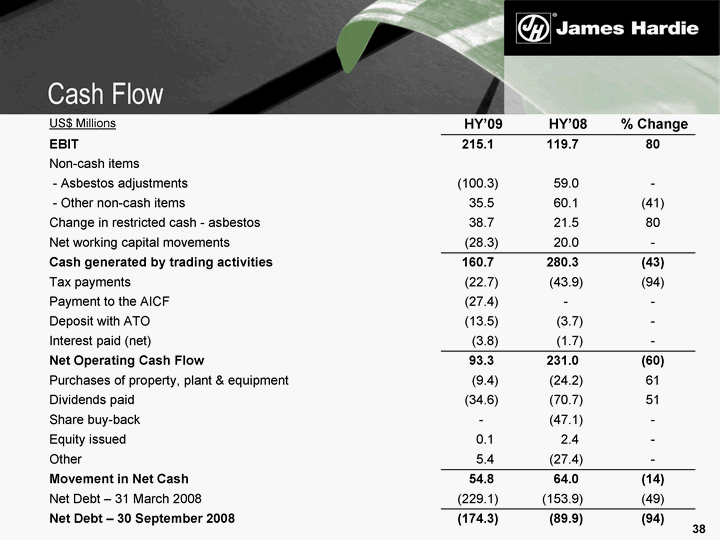
| US$ Millions HY'09 HY'08 % Change EBIT 215.1 119.7 80 Non-cash items - Asbestos adjustments (100.3) 59.0 - - Other non-cash items 35.5 60.1 (41) Change in restricted cash - asbestos 38.7 21.5 80 Net working capital movements (28.3) 20.0 - Cash generated by trading activities 160.7 280.3 (43) Tax payments (22.7) (43.9) (94) Payment to the AICF (27.4) - - Deposit with ATO (13.5) (3.7) - Interest paid (net) (3.8) (1.7) - Net Operating Cash Flow 93.3 231.0 (60) Purchases of property, plant & equipment (9.4) (24.2) 61 Dividends paid (34.6) (70.7) 51 Share buy-back - (47.1) - Equity issued 0.1 2.4 - Other 5.4 (27.4) - Movement in Net Cash 54.8 64.0 (14) Net Debt - 31 March 2008 (229.1) (153.9) (49) Net Debt - 30 September 2008 (174.3) (89.9) (94) Cash Flow |
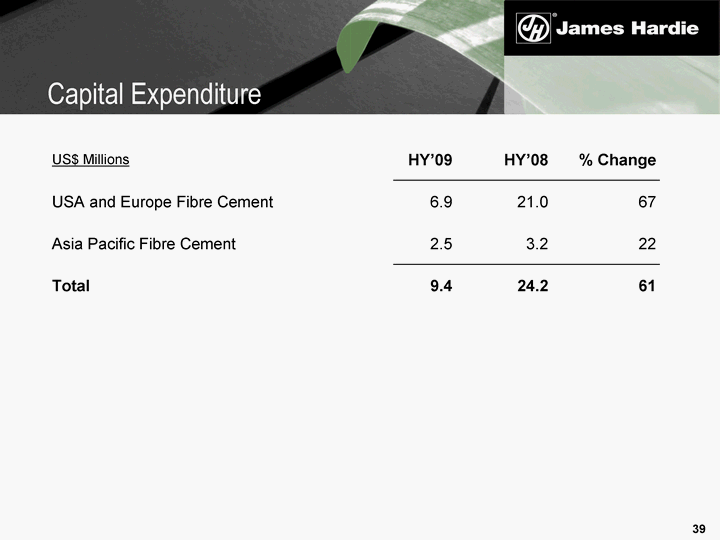
| US$ Millions HY'09 HY'08 % Change USA and Europe Fibre Cement 6.9 21.0 67 Asia Pacific Fibre Cement 2.5 3.2 22 Total 9.4 24.2 61 Capital Expenditure |
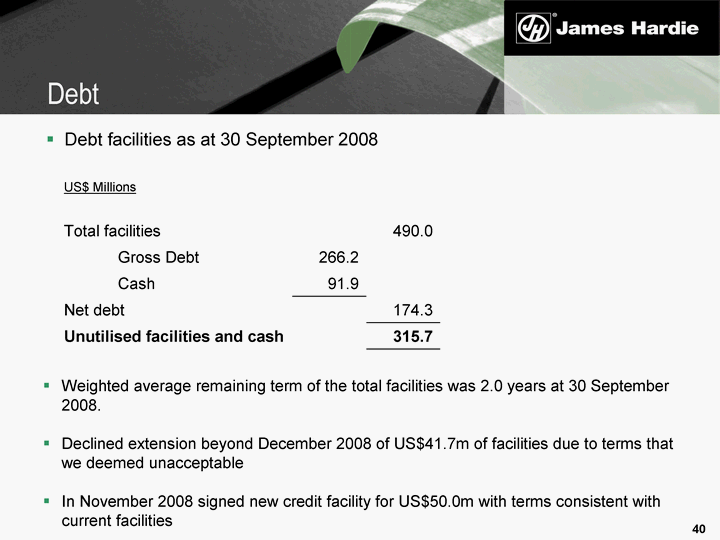
| Weighted average remaining term of the total facilities was 2.0 years at 30 September 2008. Declined extension beyond December 2008 of US$41.7m of facilities due to terms that we deemed unacceptable In November 2008 signed new credit facility for US$50.0m with terms consistent with current facilities US$ Millions Total facilities 490.0 Gross Debt 266.2 Cash 91.9 Net debt 174.3 Unutilised facilities and cash 315.7 Debt facilities as at 30 September 2008 Debt |
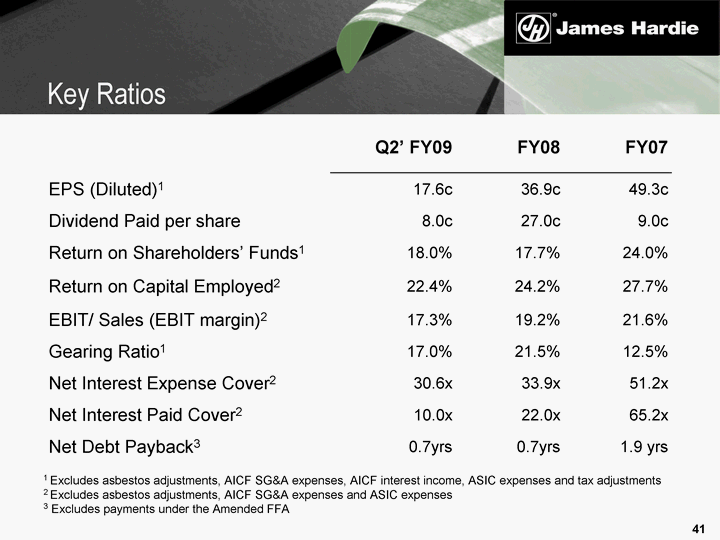
| Q2' FY09 FY08 FY07 EPS (Diluted)1 17.6c 36.9c 49.3c Dividend Paid per share 8.0c 27.0c 9.0c Return on Shareholders' Funds1 18.0% 17.7% 24.0% Return on Capital Employed2 22.4% 24.2% 27.7% EBIT/ Sales (EBIT margin)2 17.3% 19.2% 21.6% Gearing Ratio1 17.0% 21.5% 12.5% Net Interest Expense Cover2 30.6x 33.9x 51.2x Net Interest Paid Cover2 10.0x 22.0x 65.2x Net Debt Payback3 0.7yrs 0.7yrs 1.9 yrs 1 Excludes asbestos adjustments, AICF SG&A expenses, AICF interest income, ASIC expenses and tax adjustments 2 Excludes asbestos adjustments, AICF SG&A expenses and ASIC expenses 3 Excludes payments under the Amended FFA Key Ratios |
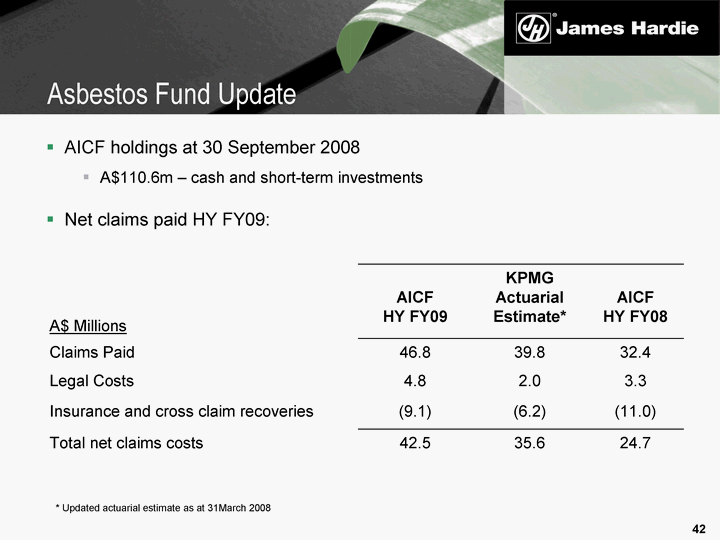
| AICF holdings at 30 September 2008 A$110.6m - cash and short-term investments Net claims paid HY FY09: A$ Millions AICF HY FY09 KPMG Actuarial Estimate* AICF HY FY08 Claims Paid 46.8 39.8 32.4 Legal Costs 4.8 2.0 3.3 Insurance and cross claim recoveries (9.1) (6.2) (11.0) Total net claims costs 42.5 35.6 24.7 * Updated actuarial estimate as at 31March 2008 Asbestos Fund Update |
| Net operating line affected by favourable asbestos adjustments, unfavourable ASIC expenses and unfavourable tax adjustments Results significantly affected by further declines in US housing market EBIT affected by reduced contribution from US business Ongoing business re-set to reduce US organisational cost base Fontana, Summerville, SG&A and MG&A Corporate costs continue to be affected by ongoing legacy issues Interim dividend omitted, dividend policy under review Results remain subject to fluctuation in A$ : US$ exchange rate for foreseeable future Summary |

| Questions & Answers |
| This Management Presentation contains forward-looking statements. We may from time to time make forward-looking statements in our periodic reports filed with or furnished to the United States Securities and Exchange Commission on Forms 20-F and 6-K, in our annual reports to shareholders, in offering circulars, invitation memoranda and prospectuses, in media releases and other written materials and in oral statements made by our officers, directors or employees to analysts, institutional investors, lenders and potential lenders, representatives of the media and others. Examples of forward-looking statements include: expectations about the timing and amount of payments to the Asbestos Injuries Compensation Fund (AICF), a special purpose fund for the compensation of proven Australian asbestos-related personal injury and death claims; statements regarding tax liabilities and related proceedings; statements as to the possible consequences of proceedings brought against us and certain of our former directors and officers by the Australian Securities and Investments Commission; expectations concerning indemnification obligations; expectations concerning the costs associated with the suspension or closure of operations at any of our plants and future plans with respect to any such plants; expectations that our credit facilities will be extended or renewed; expectations concerning dividend payments; projections of our operating results or financial condition; statements regarding our plans, objectives or goals, including those relating to competition, acquisitions, dispositions and our products; statements about our future performance; and statements about product or environmental liabilities. Words such as "believe," "anticipate," "plan," "expect," "intend," "target," "estimate," "project," "predict," "forecast," "guideline," "should," "aim" and similar expressions are intended to identify forward-looking statements but are not the exclusive means of identifying such statements. Forward-looking statements involve inherent risks and uncertainties. We caution you that a number of important factors could cause actual results to differ materially from the plans, objectives, expectations, estimates and intentions expressed in such forward-looking statements. These factors, some of which are discussed under "Key Information - Risk Factors" beginning on page 6 of our Form 20-F filed on 8 July 2008 with the Securities and Exchange Commission, include but are not limited to: all matters relating to or arising out of the prior manufacture of products that contained asbestos by current and former James Hardie subsidiaries; required contributions to the AICF and the effect of foreign exchange on the amount recorded in our financial statements as an asbestos liability; compliance with and changes in tax laws and treatments; competition and product pricing in the markets in which we operate; the consequences of product failures or defects; exposure to environmental, asbestos or other legal proceedings; general economic and market conditions; the supply and cost of raw materials; the success of our research and development efforts; our reliance on a small number of customers; compliance with and changes in environmental and health and safety laws; risks of conducting business internationally; compliance with and changes in laws and regulations; foreign exchange risks; and the effect of natural disasters and changes in our key management personnel. We caution you that the foregoing list of factors is not exclusive and that other risks and uncertainties may cause actual results to differ materially from those in forward-looking statements. Forward-looking statements speak only as of the date they are made. Disclaimer |
| This Management Presentation forms part of a package of information about the company's results. It should be read in conjunction with the other parts of this package, including Management's Analysis of Results, a Media Release and a Financial Report. Definitions Financial Measures - US GAAP equivalents EBIT and EBIT Margin - EBIT, as used in this document, is equivalent to the US GAAP measure of operating income. EBIT margin is defined as EBIT as a percentage of net sales. We believe EBIT and EBIT margin to be relevant and useful information as these are the primary measures used by our management to measure the operating profit or loss of our business. EBIT is one of several metrics used by our management to measure the earnings generated from our operations, excluding interest and income tax expenses. Additionally, EBIT is believed to be a primary measure and terminology used by our Australian investors. EBIT and EBIT margin should be considered in addition to, but not as a substitute for, other measures of financial performance reported in accordance with accounting principles generally accepted in the United States of America. EBIT and EBIT margin, as we have defined them, may not be comparable to similarly titled measures reported by other companies. Operating profit - is equivalent to the US GAAP measure of income. Net operating profit - is equivalent to the US GAAP measure of net income. Sales Volumes mmsf - million square feet, where a square foot is defined as a standard square foot of 5/16" thickness. msf - thousand square feet, where a square foot is defined as a standard square foot of 5/16" thickness. Endnotes |
| Financial Ratios Gearing Ratio - Net debt (cash) divided by net debt (cash) plus shareholders' equity. Net interest expense cover - EBIT divided by net interest expense. Net interest paid cover - EBIT divided by cash paid during the period for interest, net of amounts capitalised. Net debt payback - Net debt (cash) divided by cash flow from operations. Net debt (cash) - Short-term and long-term debt less cash and cash equivalents. Endnotes |
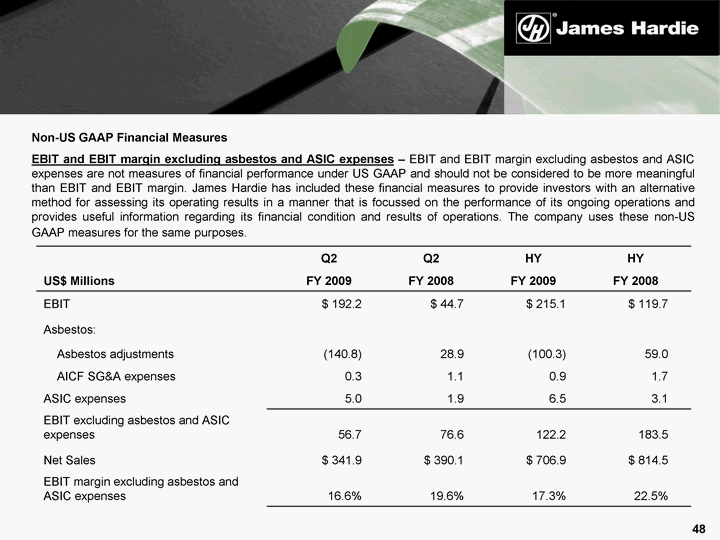
| Non-US GAAP Financial Measures EBIT and EBIT margin excluding asbestos and ASIC expenses - EBIT and EBIT margin excluding asbestos and ASIC expenses are not measures of financial performance under US GAAP and should not be considered to be more meaningful than EBIT and EBIT margin. James Hardie has included these financial measures to provide investors with an alternative method for assessing its operating results in a manner that is focussed on the performance of its ongoing operations and provides useful information regarding its financial condition and results of operations. The company uses these non-US GAAP measures for the same purposes. Q2 Q2 HY HY US$ Millions FY 2009 FY 2008 FY 2009 FY 2008 EBIT $ 192.2 $ 44.7 $ 215.1 $ 119.7 Asbestos: Asbestos adjustments (140.8) 28.9 (100.3) 59.0 AICF SG&A expenses 0.3 1.1 0.9 1.7 ASIC expenses 5.0 1.9 6.5 3.1 EBIT excluding asbestos and ASIC expenses 56.7 76.6 122.2 183.5 Net Sales $ 341.9 $ 390.1 $ 706.9 $ 814.5 EBIT margin excluding asbestos and ASIC expenses 16.6% 19.6% 17.3% 22.5% |
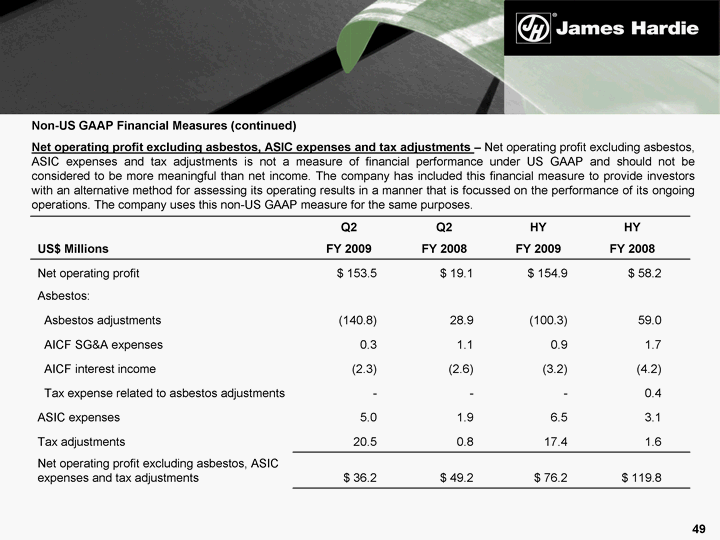
| Non-US GAAP Financial Measures (continued) Net operating profit excluding asbestos, ASIC expenses and tax adjustments - Net operating profit excluding asbestos, ASIC expenses and tax adjustments is not a measure of financial performance under US GAAP and should not be considered to be more meaningful than net income. The company has included this financial measure to provide investors with an alternative method for assessing its operating results in a manner that is focussed on the performance of its ongoing operations. The company uses this non-US GAAP measure for the same purposes. Q2 Q2 HY HY US$ Millions FY 2009 FY 2008 FY 2009 FY 2008 Net operating profit $ 153.5 $ 19.1 $ 154.9 $ 58.2 Asbestos: Asbestos adjustments (140.8) 28.9 (100.3) 59.0 AICF SG&A expenses 0.3 1.1 0.9 1.7 AICF interest income (2.3) (2.6) (3.2) (4.2) Tax expense related to asbestos adjustments - - - 0.4 ASIC expenses 5.0 1.9 6.5 3.1 Tax adjustments 20.5 0.8 17.4 1.6 Net operating profit excluding asbestos, ASIC expenses and tax adjustments $ 36.2 $ 49.2 $ 76.2 $ 119.8 |
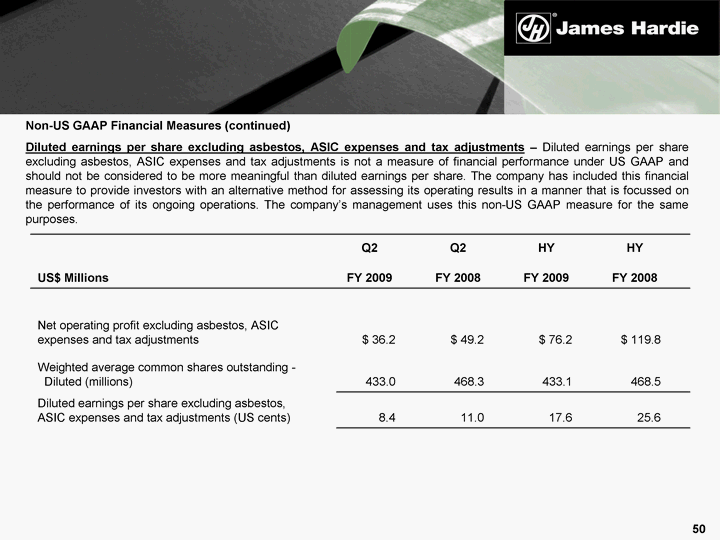
| Non-US GAAP Financial Measures (continued) Diluted earnings per share excluding asbestos, ASIC expenses and tax adjustments - Diluted earnings per share excluding asbestos, ASIC expenses and tax adjustments is not a measure of financial performance under US GAAP and should not be considered to be more meaningful than diluted earnings per share. The company has included this financial measure to provide investors with an alternative method for assessing its operating results in a manner that is focussed on the performance of its ongoing operations. The company's management uses this non-US GAAP measure for the same purposes. Q2 Q2 HY HY US$ Millions FY 2009 FY 2008 FY 2009 FY 2008 Net operating profit excluding asbestos, ASIC expenses and tax adjustments $ 36.2 $ 49.2 $ 76.2 $ 119.8 Weighted average common shares outstanding - Diluted (millions) 433.0 468.3 433.1 468.5 Diluted earnings per share excluding asbestos, ASIC expenses and tax adjustments (US cents) 8.4 11.0 17.6 25.6 |
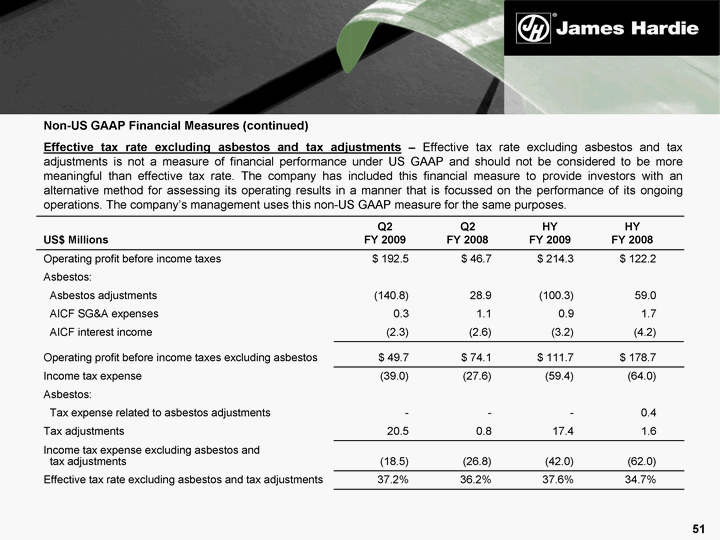
| Non-US GAAP Financial Measures (continued) Effective tax rate excluding asbestos and tax adjustments - Effective tax rate excluding asbestos and tax adjustments is not a measure of financial performance under US GAAP and should not be considered to be more meaningful than effective tax rate. The company has included this financial measure to provide investors with an alternative method for assessing its operating results in a manner that is focussed on the performance of its ongoing operations. The company's management uses this non-US GAAP measure for the same purposes. US$ Millions Q2 FY 2009 Q2 FY 2008 HY FY 2009 HY FY 2008 Operating profit before income taxes $ 192.5 $ 46.7 $ 214.3 $ 122.2 Asbestos: Asbestos adjustments (140.8) 28.9 (100.3) 59.0 AICF SG&A expenses 0.3 1.1 0.9 1.7 AICF interest income (2.3) (2.6) (3.2) (4.2) Operating profit before income taxes excluding asbestos $ 49.7 $ 74.1 $ 111.7 $ 178.7 Income tax expense (39.0) (27.6) (59.4) (64.0) Asbestos: Tax expense related to asbestos adjustments - - - 0.4 Tax adjustments 20.5 0.8 17.4 1.6 Income tax expense excluding asbestos and tax adjustments (18.5) (26.8) (42.0) (62.0) Effective tax rate excluding asbestos and tax adjustments 37.2% 36.2% 37.6% 34.7% |
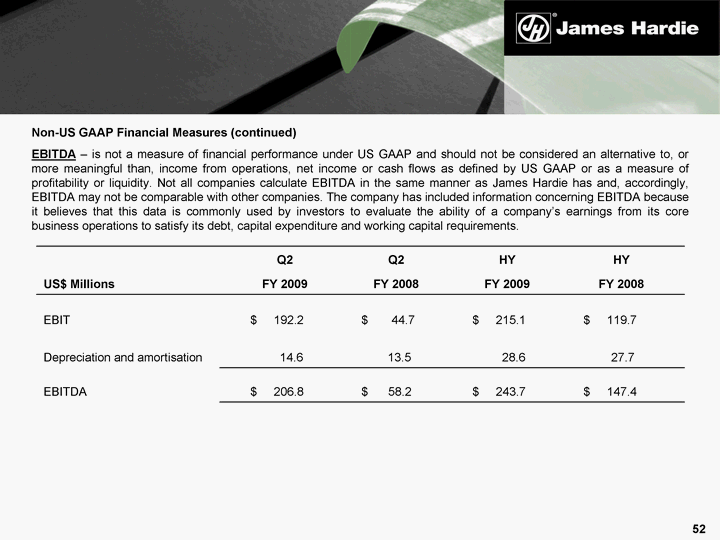
| Non-US GAAP Financial Measures (continued) EBITDA - is not a measure of financial performance under US GAAP and should not be considered an alternative to, or more meaningful than, income from operations, net income or cash flows as defined by US GAAP or as a measure of profitability or liquidity. Not all companies calculate EBITDA in the same manner as James Hardie has and, accordingly, EBITDA may not be comparable with other companies. The company has included information concerning EBITDA because it believes that this data is commonly used by investors to evaluate the ability of a company's earnings from its core business operations to satisfy its debt, capital expenditure and working capital requirements. Q2 Q2 HY HY US$ Millions FY 2009 FY 2008 FY 2009 FY 2008 EBIT $ 192.2 $ 44.7 $ 215.1 $ 119.7 Depreciation and amortisation 14.6 13.5 28.6 27.7 EBITDA $ 206.8 $ 58.2 $ 243.7 $ 147.4 |
| In this Management Presentation, James Hardie may present financial measures, sales volume terms, financial ratios, and Non- US GAAP financial measures included in the Definitions section of this document starting on page 46. The company presents financial measures that it believes are customarily used by its Australian investors. Specifically, these financial measures, which are equivalent to or derived from certain US GAAP measures as explained in the definitions, include "EBIT", "EBIT margin", "Operating profit" and "Net operating profit". The company may also present other terms for measuring its sales volumes ("million square feet or mmsf" and "thousand square feet or msf"); financial ratios ("Gearing ratio", "Net interest expense cover", "Net interest paid cover", "Net debt payback", "Net debt (cash)"); and Non-US GAAP financial measures ("EBIT excluding asbestos and ASIC expenses", "EBIT margin excluding asbestos and ASIC expenses", "Net operating profit excluding asbestos, ASIC expenses and tax adjustments", "Diluted earnings per share excluding asbestos, ASIC expenses and tax adjustments", "Operating profit before income taxes excluding asbestos and ASIC expenses" , "Effective tax rate excluding asbestos and tax adjustments" and "EBITDA"). Unless otherwise stated, results and comparisons are of the 2nd quarter and 1st half of the current fiscal year versus the 2nd quarter and 1st half of the prior fiscal year. James Hardie Q2 FY09 Results Management Presentation - 17 November 2008 |