
| James Hardie Q4 FY09 Results Management Presentation - 20 May 2009 In this Management Presentation, James Hardie may present financial measures, sales volume terms, financial ratios, and Non-US GAAP financial measures included in the Definitions section of this document starting on page 60. The company presents financial measures that it believes are customarily used by its Australian investors. Specifically, these financial measures, which are equivalent to or derived from certain US GAAP measures as explained in the definitions, include "EBIT", "EBIT margin", "Operating profit" and "Net operating profit". The company may also present other terms for measuring its sales volumes ("million square feet or mmsf" and "thousand square feet or msf"); financial ratios ("Gearing ratio", "Net interest expense cover", "Net interest paid cover", "Net debt payback", "Net debt (cash)"); and Non-US GAAP financial measures ("EBIT excluding asbestos, ASIC expenses and asset impairments", "EBIT margin excluding asbestos, ASIC expenses and asset impairments", "Net operating profit excluding asbestos, ASIC expenses, asset impairments and tax adjustments", "Diluted earnings per share excluding asbestos, ASIC expenses, asset impairments and tax adjustments", "Operating profit before income taxes excluding asbestos and asset impairments", "Effective tax rate excluding asbestos, asset impairments and tax adjustments", "EBITDA" and "Net cash (used in) provided by operating activities excluding payments to the AICF and ATO settlement payment"). Unless otherwise stated, results and comparisons are of the 4th quarter and current fiscal year versus the 4th quarter and full year of the prior fiscal year. |
| 2 Disclaimer This Management Presentation contains forward-looking statements. We may from time to time make forward-looking statements in our periodic reports filed with or furnished to the United States Securities and Exchange Commission on Forms 20-F and 6-K, in the annual reports to shareholders, in offering circulars, invitation memoranda and prospectuses, in media releases and other written materials and in oral statements made by our officers, directors or employees to analysts, institutional investors, existing and potential lenders, representatives of the media and others. Statements that are not historical facts are forward-looking statements and for US purposes such forward-looking statements are statements made pursuant to the Safe Harbor Provisions of the Private Securities Litigation Reform Act of 1995. Examples of forward-looking statements include: statements about our future performance; projections of our results of operations or financial condition; statements regarding our plans, objectives or goals, including those relating to our strategies, initiatives, competition, acquisitions, dispositions and/or our products; expectations concerning the costs associated with the suspension or closure of operations at any of our plants and future plans with respect to any such plants; expectations that our credit facilities will be extended or renewed; expectations concerning dividend payments; statements concerning our corporate and tax domiciles and potential changes to them; statements regarding tax liabilities and related audits and proceedings; statements as to the possible consequences of proceedings brought against us and certain of our former directors and officers by the Australian Securities & Investments Commission; expectations about the timing and amount of contributions to the Asbestos Injuries Compensation Fund, a special purpose fund for the compensation of proven Australian asbestos-related personal injury and death claims; expectations concerning indemnification obligations; and statements about product or environmental liabilities. Words such as "believe," "anticipate," "plan," "expect," "intend," "target," "estimate," "project," "predict," "forecast," "guideline," "aim," "will," "should," "continue" and similar expressions are intended to identify forward-looking statements but are not the exclusive means of identifying such statements. Readers are cautioned not to place undue reliance on these forward-looking statements and all such forward-looking statements are qualified in their entirety by reference to the following cautionary statements. Forward-looking statements are based on our estimates and assumptions and because forward-looking statements address future results, events and conditions, they, by their very nature, involve inherent risks and uncertainties. Such known and unknown risks, uncertainties and other factors may cause our actual results, performance or other achievements to differ materially from the anticipated results, performance or achievements expressed, projected or implied by these forward- looking statements. These factors, some of which are discussed under "Key Information - Risk Factors" beginning on page 6 of the Form 20-F filed on 8 July 2008 with the US Securities and Exchange Commission, include but are not limited to: all matters relating to or arising out of the prior manufacture of products that contained asbestos by current and former James Hardie subsidiaries; required contributions to the AICF and the effect of currency exchange rate movements on the amount recorded in our financial statements as an asbestos liability; compliance with and changes in tax laws and treatments; competition and product pricing in the markets in which we operate; the consequences of product failures or defects; exposure to environmental, asbestos or other legal proceedings; general economic and market conditions; the supply and cost of raw materials; the success of research and development efforts; reliance on a small number of customers; compliance with and changes in environmental and health and safety laws; risks of conducting business internationally; compliance with and changes in laws and regulations; currency exchange risks; the concentration of our customer base on large format retail customers, distributors and dealers; the effect of natural disasters; changes in our key management personnel; and all other risks identified in our reports filed with Australian, Dutch and US securities agencies and exchanges (as appropriate). We caution you that the foregoing list of factors is not exhaustive and that other risks and uncertainties may cause actual results to differ materially from those in forward- looking statements. Forward-looking statements speak only as of the date they are made and are statements of our current expectations concerning future results, events and conditions. |
| 3 Overview and Operating Review - Louis Gries, CEO Financial Review - Russell Chenu, CFO Questions and Answers Agenda |
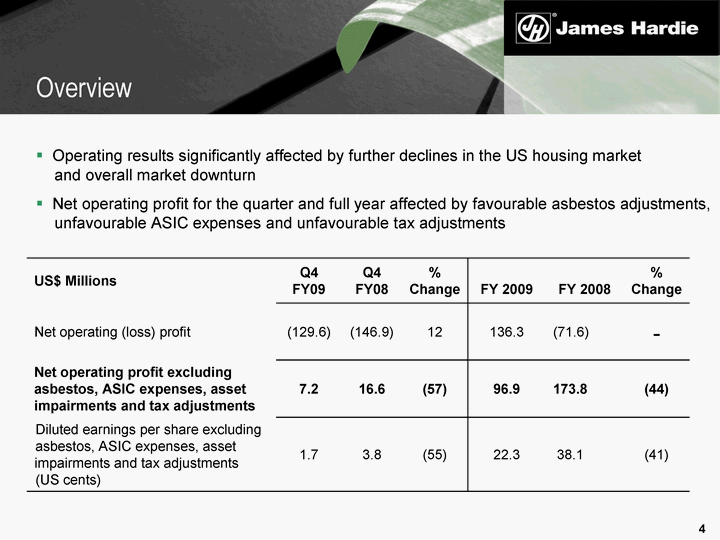
| 4 Overview Operating results significantly affected by further declines in the US housing market and overall market downturn Net operating profit for the quarter and full year affected by favourable asbestos adjustments, unfavourable ASIC expenses and unfavourable tax adjustments US$ Millions Q4 FY09 Q4 FY08 % Change FY 2009 FY 2008 % Change Net operating (loss) profit (129.6) (146.9) 12 136.3 (71.6) - Net operating profit excluding asbestos, ASIC expenses, asset impairments and tax adjustments 7.2 16.6 (57) 96.9 173.8 (44) Diluted earnings per share excluding asbestos, ASIC expenses, asset impairments and tax adjustments (US cents) 1.7 3.8 (55) 22.3 38.1 (41) |
| Operating Review Louis Gries, CEO |
| 6 Aggressively grow demand for our products in targeted market segments Grow our overall market position while defending our share in existing market segments Offer products with superior value to that of our competitors Introduce differentiated products to reduce direct price competition Global Strategy |
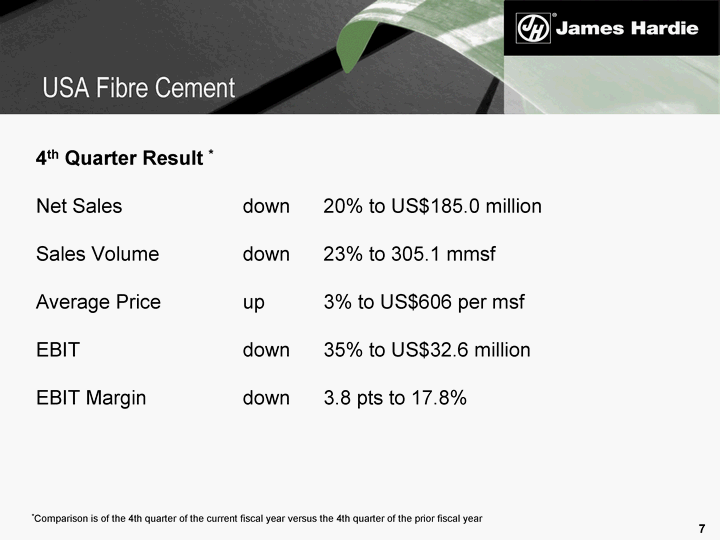
| 7 4th Quarter Result * Net Sales down 20% to US$185.0 million Sales Volume down 23% to 305.1 mmsf Average Price up 3% to US$606 per msf EBIT down 35% to US$32.6 million EBIT Margin down 3.8 pts to 17.8% USA Fibre Cement *Comparison is of the 4th quarter of the current fiscal year versus the 4th quarter of the prior fiscal year |
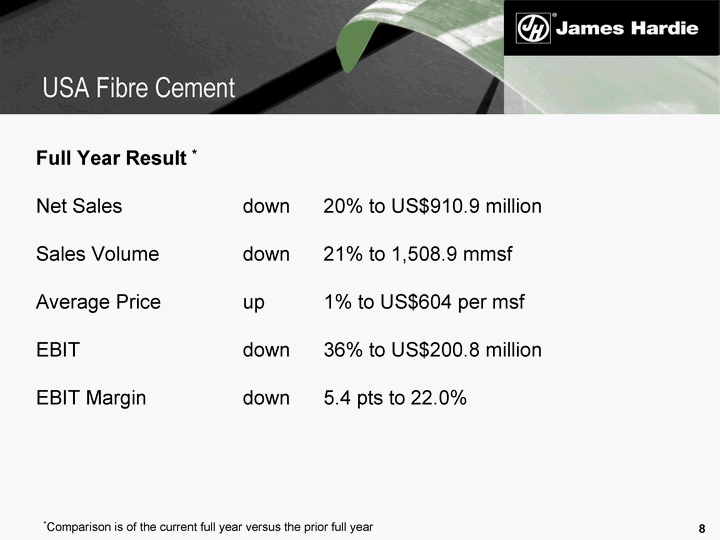
| 8 Full Year Result * Net Sales down 20% to US$910.9 million Sales Volume down 21% to 1,508.9 mmsf Average Price up 1% to US$604 per msf EBIT down 36% to US$200.8 million EBIT Margin down 5.4 pts to 22.0% USA Fibre Cement *Comparison is of the current full year versus the prior full year |
| 9 4th Quarter Market Conditions Ongoing deterioration in the US housing market - both new construction and repair and remodel continue to weaken March 2009 housing starts of 510,000* down 77% from January 2006 peak of 2.265 million* Q4 FY09 housing starts down 50% to 523,000* compared to Q4 FY08 FY09 housing starts down 38% to 787,400 compared to FY08 Repair & Remodel down, but to a lesser extent USA Fibre Cement *NAHB seasonally-adjusted annual rate |
| 10 4th Quarter Key Points Sales down due to declining market Sales volumes were lower across all regions ColorPlus(r) again increased as a percentage of our product mix Lower SG&A costs and higher average selling price partially offset lower volumes and higher unit costs USA Fibre Cement |
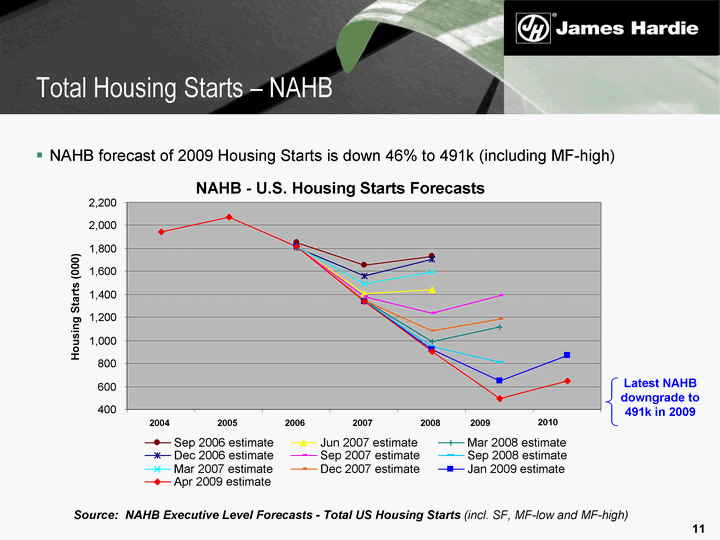
| 11 Total Housing Starts - NAHB NAHB forecast of 2009 Housing Starts is down 46% to 491k (including MF-high) Source: NAHB Executive Level Forecasts - Total US Housing Starts (incl. SF, MF-low and MF-high) Latest NAHB downgrade to 491k in 2009 2010 NAHB - U.S. Housing Starts Forecasts 400 600 800 1,000 1,200 1,400 1,600 1,800 2,000 2,200 2004 2005 2006 2007 2008 2009 Housing Starts (000) Sep 2006 estimate Jun 2007 estimate Mar 2008 estimate Dec 2006 estimate Sep 2007 estimate Sep 2008 estimate Mar 2007 estimate Dec 2007 estimate Jan 2009 estimate Apr 2009 estimate 2010 |
| 12 The HardieZone(tm) System James Hardie is currently undertaking a major product launch in the United States. The HardieZoneTM System: provides specific product performance attributes relative to the climate where the product is used across full range of engineered products - Plank, Panel, Trim, Fascia and Soffit, HardieWrap weather barrier clearly articulates why James Hardie is superior to generic fibre cements |
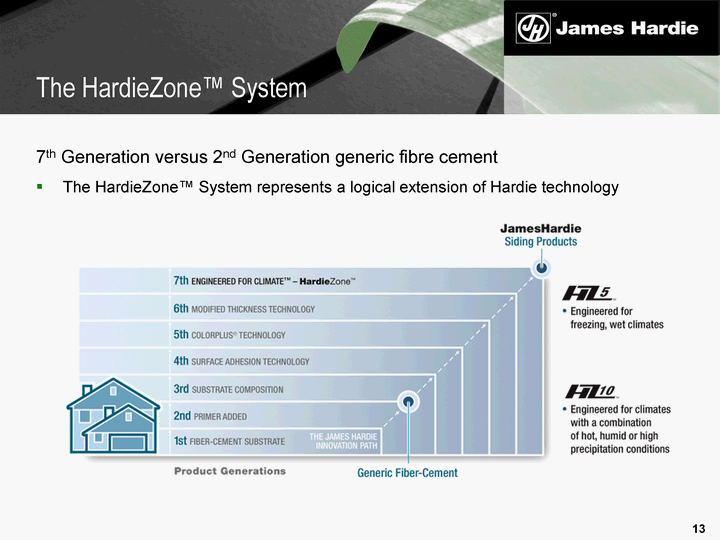
| 13 The HardieZone(tm) System 7th Generation versus 2nd Generation generic fibre cement The HardieZone(tm) System represents a logical extension of Hardie technology |
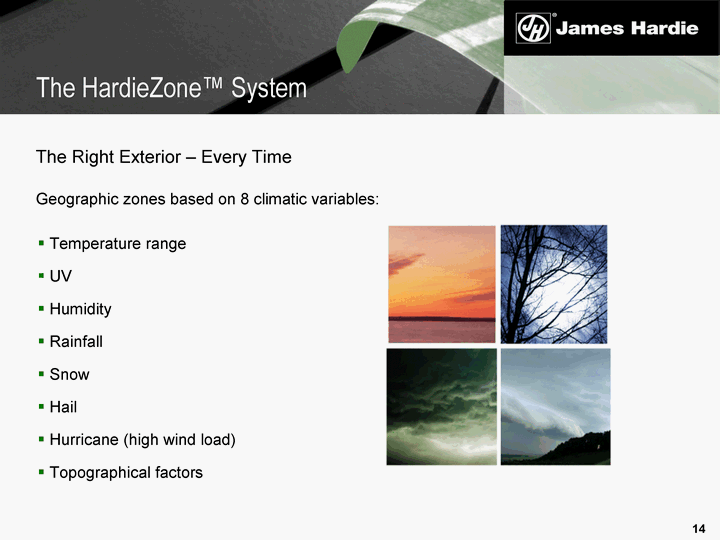
| 14 The HardieZone(tm) System The Right Exterior - Every Time Geographic zones based on 8 climatic variables: Temperature range UV Humidity Rainfall Snow Hail Hurricane (high wind load) Topographical factors |
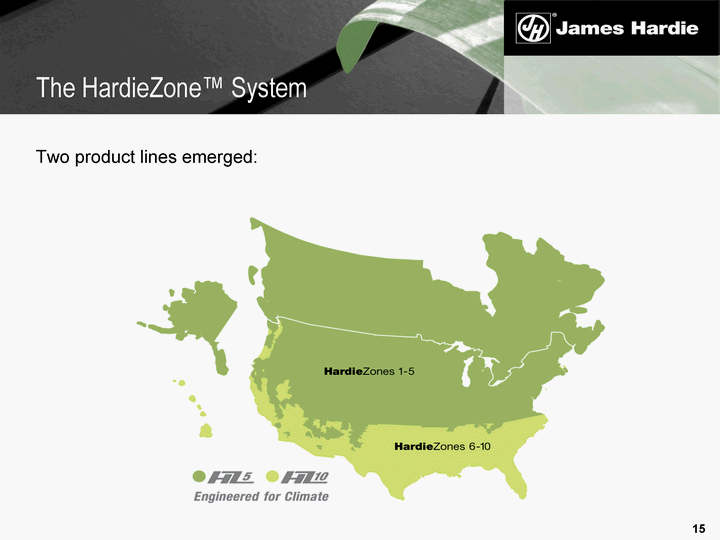
| 15 The HardieZone(tm) System Two product lines emerged: |
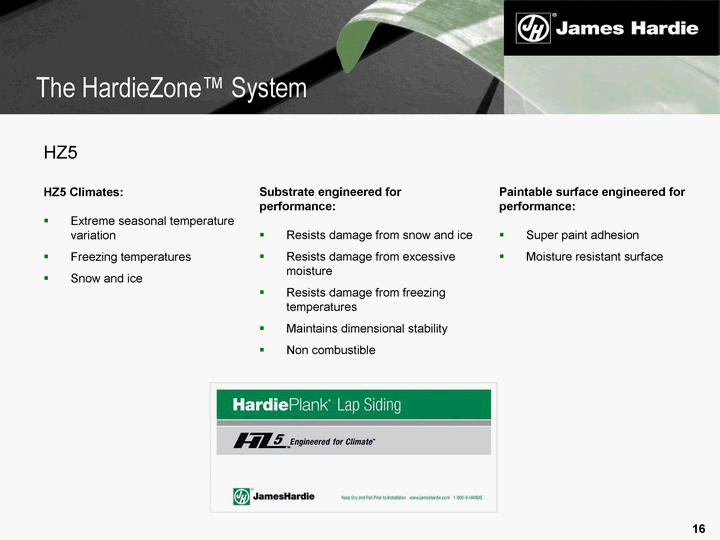
| 16 The HardieZone(tm) System HZ5 HZ5 Climates: Extreme seasonal temperature variation Freezing temperatures Snow and ice Substrate engineered for performance: Resists damage from snow and ice Resists damage from excessive moisture Resists damage from freezing temperatures Maintains dimensional stability Non combustible Paintable surface engineered for performance: Super paint adhesion Moisture resistant surface |
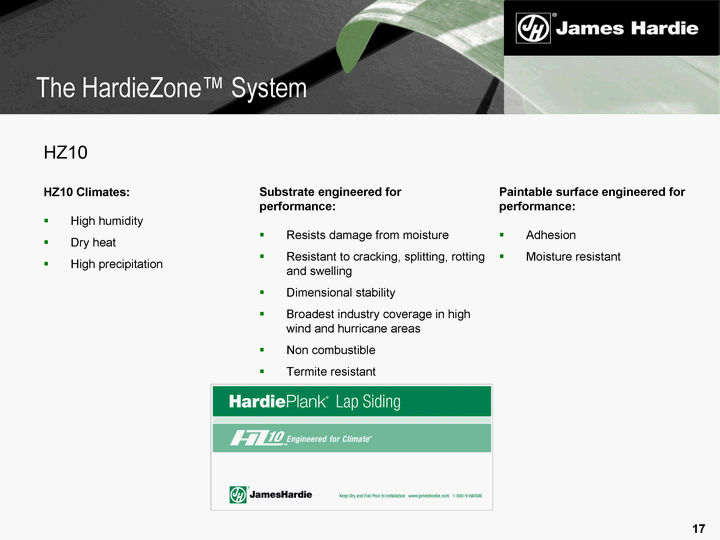
| 17 The HardieZone(tm) System HZ10 HZ10 Climates: High humidity Dry heat High precipitation Substrate engineered for performance: Resists damage from moisture Resistant to cracking, splitting, rotting and swelling Dimensional stability Broadest industry coverage in high wind and hurricane areas Non combustible Termite resistant Paintable surface engineered for performance: Adhesion Moisture resistant |
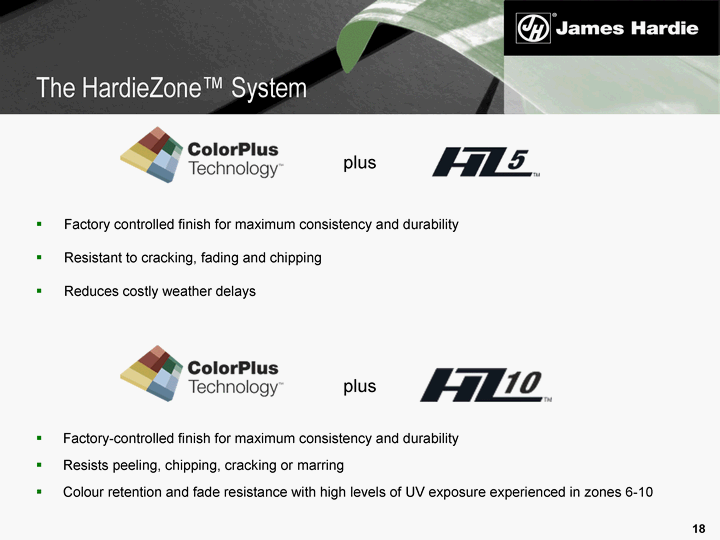
| 18 The HardieZone(tm) System plus Factory controlled finish for maximum consistency and durability Resistant to cracking, fading and chipping Reduces costly weather delays plus Factory-controlled finish for maximum consistency and durability Resists peeling, chipping, cracking or marring Colour retention and fade resistance with high levels of UV exposure experienced in zones 6-10 |
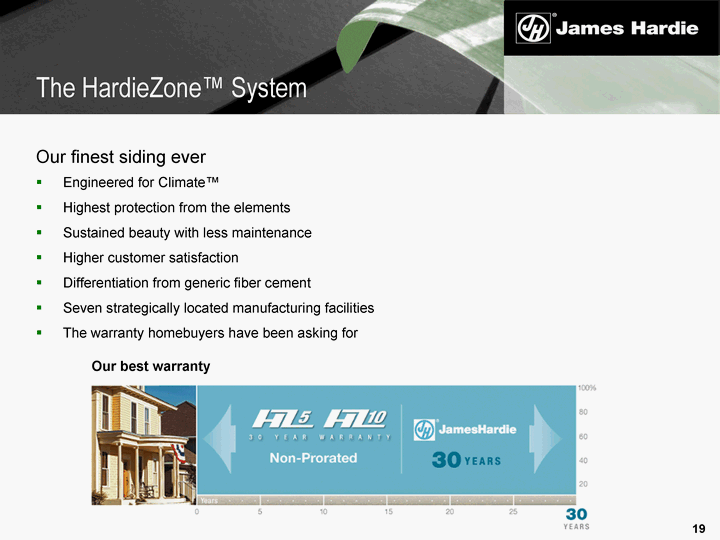
| 19 The HardieZone(tm) System Our finest siding ever Engineered for Climate(tm) Highest protection from the elements Sustained beauty with less maintenance Higher customer satisfaction Differentiation from generic fiber cement Seven strategically located manufacturing facilities The warranty homebuyers have been asking for Our best warranty |
| 20 Outlook Business has been set to optimise our results in a market that we think is close to bottoming out: Set for < 500,000 new construction starts Anticipate a reduction of > 15% in the Repair & Remodel opportunity The HardiZone(tm) System launch is planned to be completed in FY 2010 We expect the US business will continue to perform well in a difficult market USA Fibre Cement |
| 21 Outlook - continued At current low level of housing starts, market is nearing the bottom Affordability has improved as housing prices and mortgages have both declined Inventory level of new homes remains high Credit availability remains tight Consumer confidence has improved - but from very low levels USA Fibre Cement |
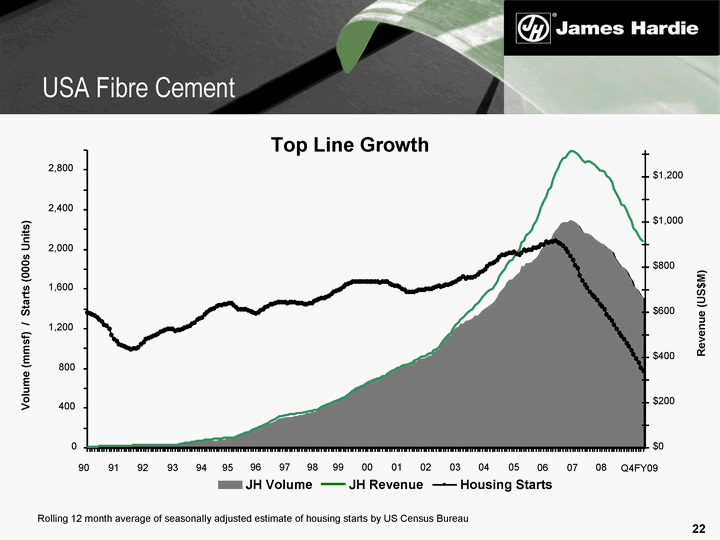
| 22 USA Fibre Cement Rolling 12 month average of seasonally adjusted estimate of housing starts by US Census Bureau Top Line Growth Volume (mmsf) / Starts (000s Units) Revenue (US$M) JH Volume JH Revenue Housing Starts 0 400 800 1,200 1,600 2,000 2,400 2,800 $0 $200 $400 $600 $800 $1,000 $1,200 90 91 92 93 94 95 96 97 98 99 00 01 02 03 04 05 06 07 08 Q4FY09 |
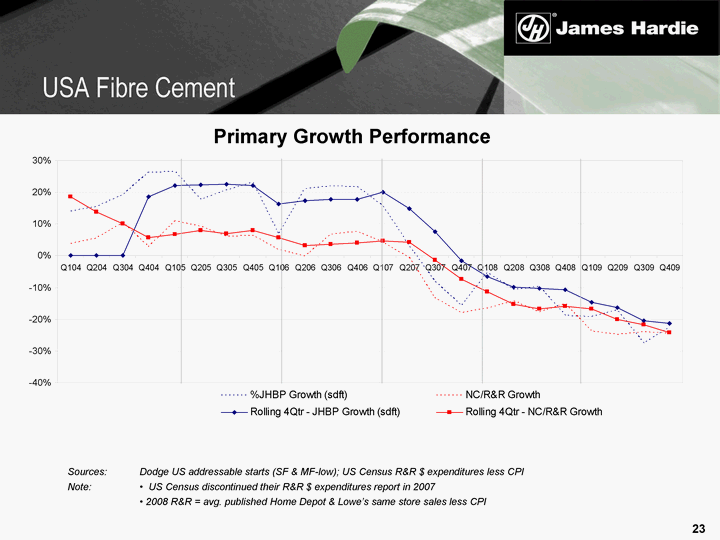
| 23 USA Fibre Cement Primary Growth Performance Sources: Dodge US addressable starts (SF & MF-low); US Census R&R $ expenditures less CPI Note: • US Census discontinued their R&R $ expenditures report in 2007 • 2008 R&R = avg. published Home Depot & Lowe's same store sales less CPI |
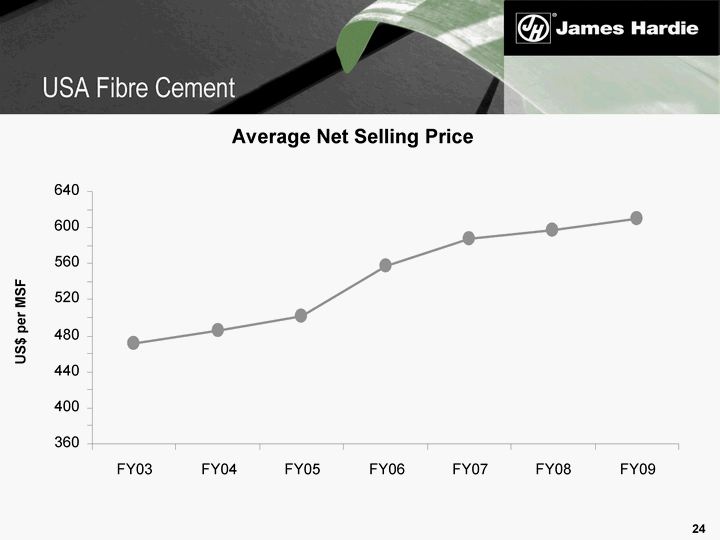
| 24 Average Net Selling Price US$ per MSF USA Fibre Cement 360 400 440 480 520 560 600 640 FY03 FY04 FY05 FY06 FY07 FY08 FY09 |
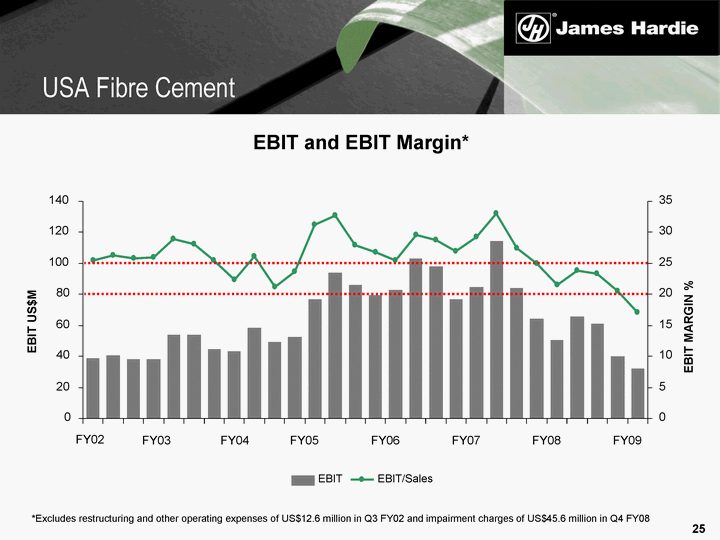
| 25 USA Fibre Cement *Excludes restructuring and other operating expenses of US$12.6 million in Q3 FY02 and impairment charges of US$45.6 million in Q4 FY08 EBIT and EBIT Margin* 0 20 40 60 80 100 120 140 FY03 FY04 FY05 FY06 FY07 FY08 FY09 EBIT US$M 0 5 10 15 20 25 30 35 EBIT MARGIN % EBIT EBIT/Sales FY02 |
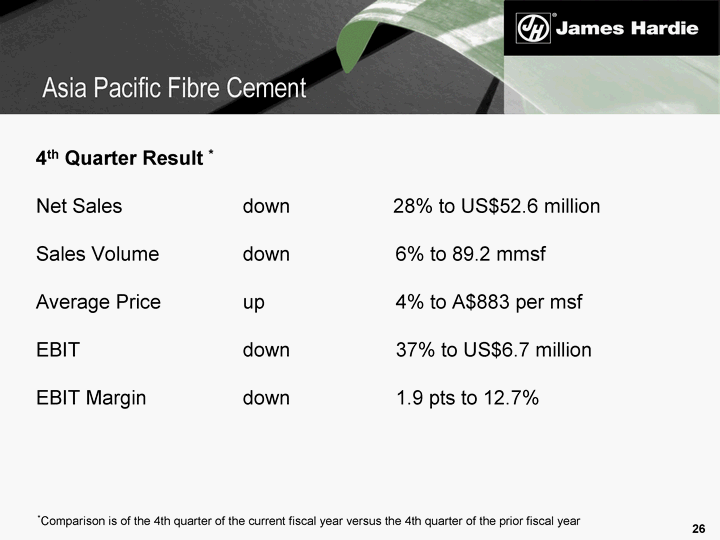
| 26 4th Quarter Result * Net Sales down 28% to US$52.6 million Sales Volume down 6% to 89.2 mmsf Average Price up 4% to A$883 per msf EBIT down 37% to US$6.7 million EBIT Margin down 1.9 pts to 12.7% Asia Pacific Fibre Cement *Comparison is of the 4th quarter of the current fiscal year versus the 4th quarter of the prior fiscal year |
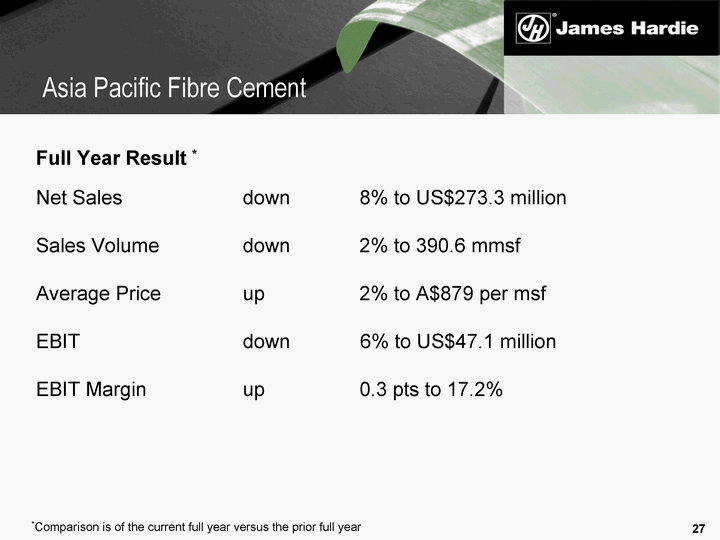
| 27 Full Year Result * Net Sales down 8% to US$273.3 million Sales Volume down 2% to 390.6 mmsf Average Price up 2% to A$879 per msf EBIT down 6% to US$47.1 million EBIT Margin up 0.3 pts to 17.2% Asia Pacific Fibre Cement *Comparison is of the current full year versus the prior full year |
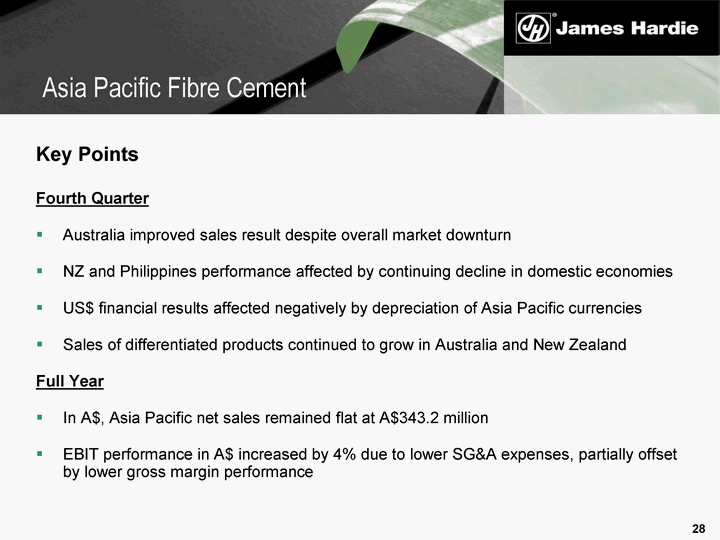
| 28 Key Points Fourth Quarter Australia improved sales result despite overall market downturn NZ and Philippines performance affected by continuing decline in domestic economies US$ financial results affected negatively by depreciation of Asia Pacific currencies Sales of differentiated products continued to grow in Australia and New Zealand Full Year In A$, Asia Pacific net sales remained flat at A$343.2 million EBIT performance in A$ increased by 4% due to lower SG&A expenses, partially offset by lower gross margin performance Asia Pacific Fibre Cement |
| 29 Outlook Building approvals expected to continue to fall in Australia, partially offset by increased activity in medium density dwellings, and renovations New Zealand housing approvals to remain at current levels Non-differentiated products in Australia are expected to remain subject to strong competition Continued growth in sales of differentiated products to help offset challenging operating environment Asia Pacific Fibre Cement |
| Financial Review Russell Chenu, CFO |
| 31 Overview Result affected by further decline in housing construction activity in all markets Net operating profit affected by asbestos, ASIC expenses and tax adjustments Third and fourth FY09 instalment payments to AICF during Q4 Reduced cash flow as a result of ATO settlement payment, quarterly instalment payments to AICF and reduced earnings contribution from US business Excluding ATO settlement payment and payments to AICF, cash flow from operations continues to be strong at US$166.4m Continuing low levels of capital expenditure Significant depreciation of A$ : US$ exchange rate affecting results |
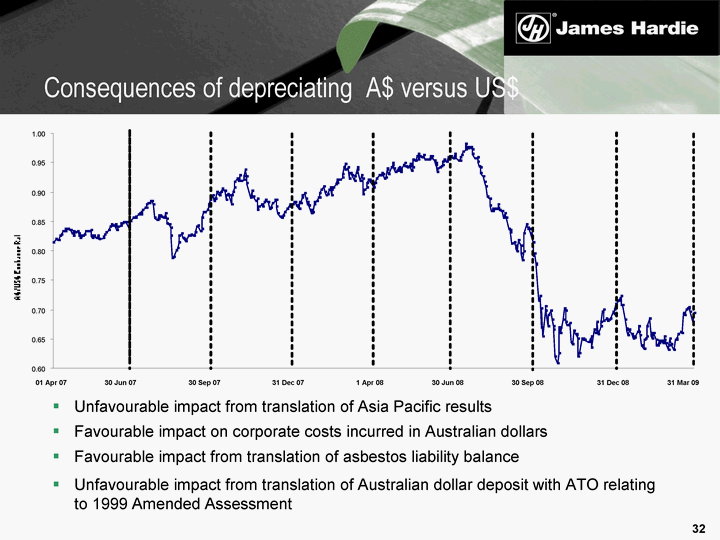
| 32 Consequences of depreciating A$ versus US$ Unfavourable impact from translation of Asia Pacific results Favourable impact on corporate costs incurred in Australian dollars Favourable impact from translation of asbestos liability balance Unfavourable impact from translation of Australian dollar deposit with ATO relating to 1999 Amended Assessment 0.60 0.65 0.70 0.75 0.80 0.85 0.90 0.95 1.00 01 Apr 07 30 Jun 07 30 Sep 07 31 Dec 07 1 Apr 08 30 Jun 08 30 Sep 08 31 Dec 08 31 Mar 09 |
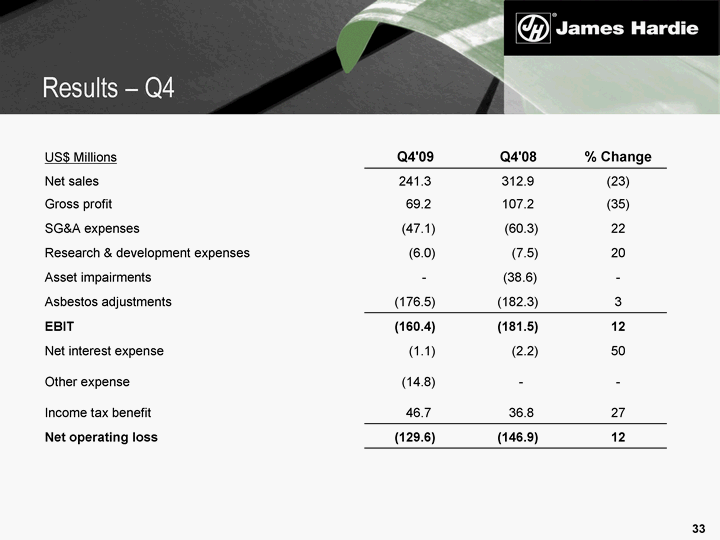
| 33 Results - Q4 US$ Millions Q4'09 Q4'08 % Change Net sales 241.3 312.9 (23) Gross profit 69.2 107.2 (35) SG&A expenses (47.1) (60.3) 22 Research & development expenses (6.0) (7.5) 20 Asset impairments - (38.6) - Asbestos adjustments (176.5) (182.3) 3 EBIT (160.4) (181.5) 12 Net interest expense (1.1) (2.2) 50 Other expense (14.8) - - Income tax benefit 46.7 36.8 27 Net operating loss (129.6) (146.9) 12 |
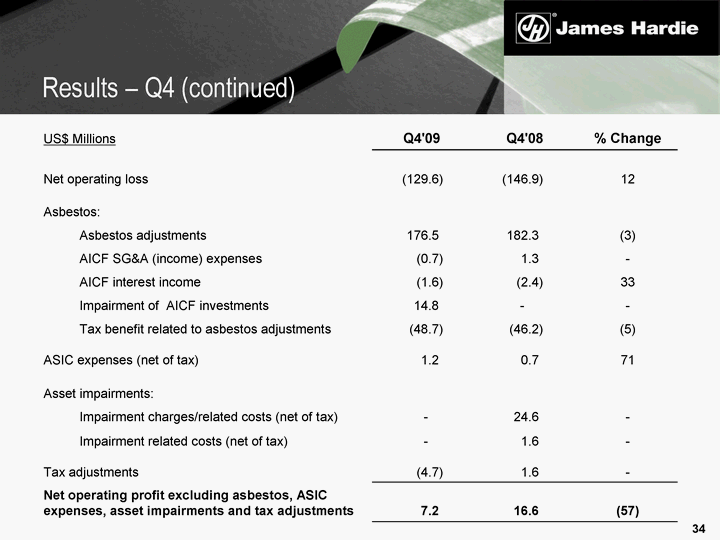
| 34 Results - Q4 (continued) US$ Millions Q4'09 Q4'08 % Change Net operating loss (129.6) (146.9) 12 Asbestos: Asbestos adjustments 176.5 182.3 (3) AICF SG&A (income) expenses (0.7) 1.3 - AICF interest income (1.6) (2.4) 33 Impairment of AICF investments 14.8 - - Tax benefit related to asbestos adjustments (48.7) (46.2) (5) ASIC expenses (net of tax) 1.2 0.7 71 Asset impairments: Impairment charges/related costs (net of tax) - 24.6 - Impairment related costs (net of tax) - 1.6 - Tax adjustments (4.7) 1.6 - Net operating profit excluding asbestos, ASIC expenses, asset impairments and tax adjustments 7.2 16.6 (57) |
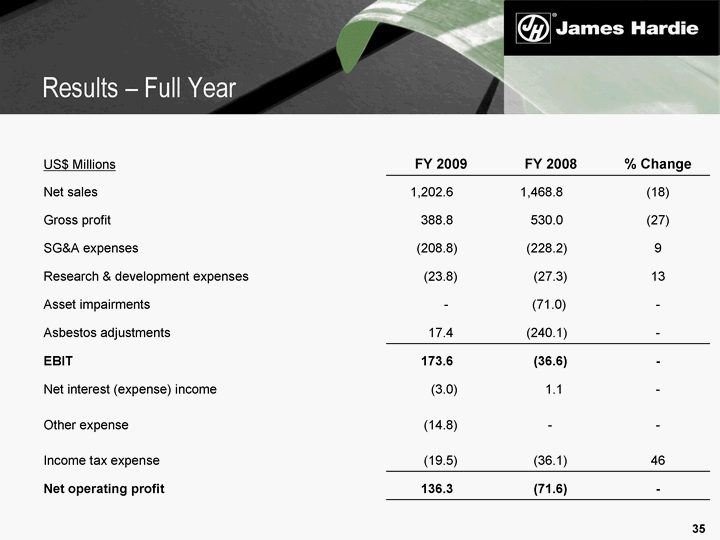
| 35 Results - Full Year US$ Millions FY 2009 FY 2008 % Change Net sales 1,202.6 1,468.8 (18) Gross profit 388.8 530.0 (27) SG&A expenses (208.8) (228.2) 9 Research & development expenses (23.8) (27.3) 13 Asset impairments - (71.0) - Asbestos adjustments 17.4 (240.1) - EBIT 173.6 (36.6) - Net interest (expense) income (3.0) 1.1 - Other expense (14.8) - - Income tax expense (19.5) (36.1) 46 Net operating profit 136.3 (71.6) - |
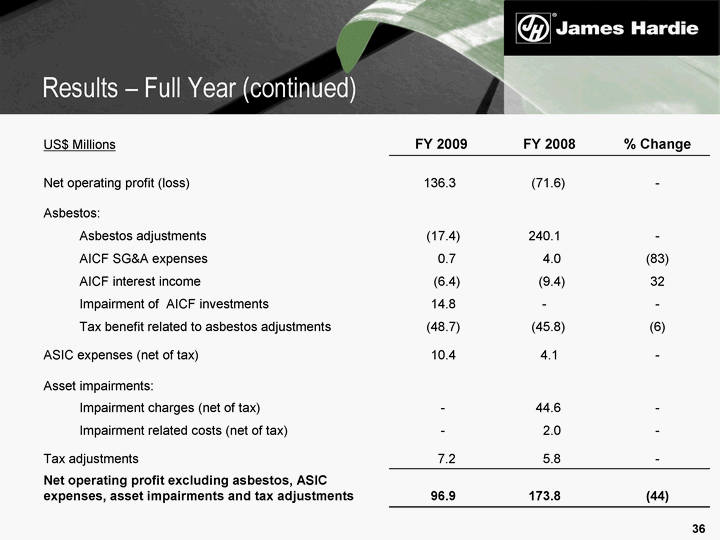
| 36 Results - Full Year (continued) US$ Millions FY 2009 FY 2008 % Change Net operating profit (loss) 136.3 (71.6) - Asbestos: Asbestos adjustments (17.4) 240.1 - AICF SG&A expenses 0.7 4.0 (83) AICF interest income (6.4) (9.4) 32 Impairment of AICF investments 14.8 - - Tax benefit related to asbestos adjustments (48.7) (45.8) (6) ASIC expenses (net of tax) 10.4 4.1 - Asset impairments: Impairment charges (net of tax) - 44.6 - Impairment related costs (net of tax) - 2.0 - Tax adjustments 7.2 5.8 - Net operating profit excluding asbestos, ASIC expenses, asset impairments and tax adjustments 96.9 173.8 (44) |
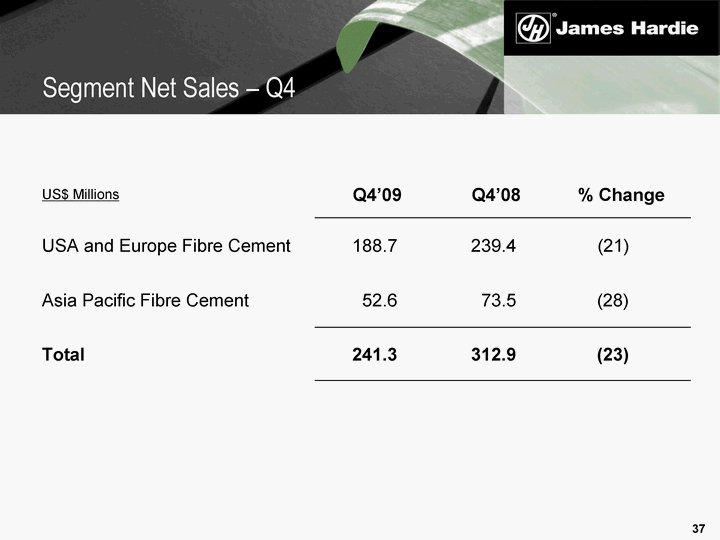
| 37 US$ Millions Q4'09 Q4'08 % Change USA and Europe Fibre Cement 188.7 239.4 (21) Asia Pacific Fibre Cement 52.6 73.5 (28) Total 241.3 312.9 (23) Segment Net Sales - Q4 |
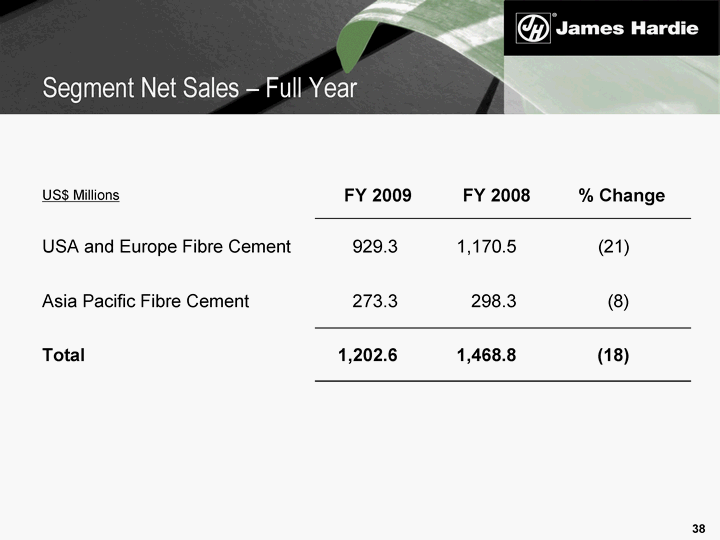
| 38 US$ Millions FY 2009 FY 2008 % Change USA and Europe Fibre Cement 929.3 1,170.5 (21) Asia Pacific Fibre Cement 273.3 298.3 (8) Total 1,202.6 1,468.8 (18) Segment Net Sales - Full Year |
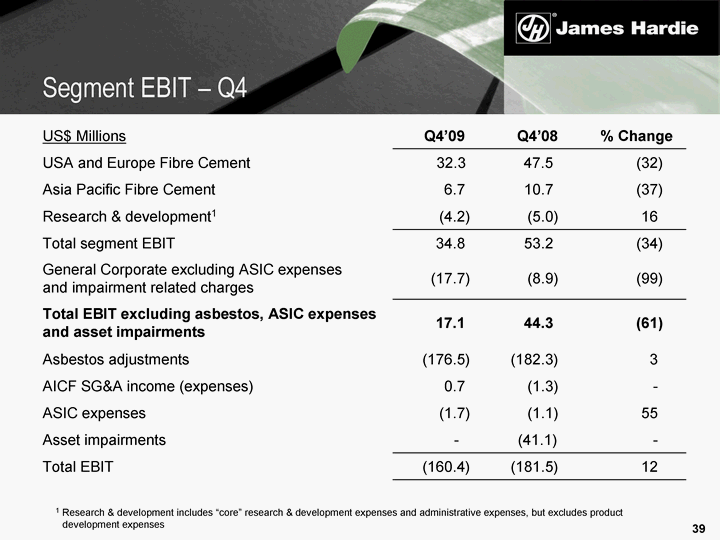
| 39 US$ Millions Q4'09 Q4'08 % Change USA and Europe Fibre Cement 32.3 47.5 (32) Asia Pacific Fibre Cement 6.7 10.7 (37) Research & development1 (4.2) (5.0) 16 Total segment EBIT 34.8 53.2 (34) General Corporate excluding ASIC expenses and impairment related charges (17.7) (8.9) (99) Total EBIT excluding asbestos, ASIC expenses and asset impairments 17.1 44.3 (61) Asbestos adjustments (176.5) (182.3) 3 AICF SG&A income (expenses) 0.7 (1.3) - ASIC expenses (1.7) (1.1) 55 Asset impairments - (41.1) - Total EBIT (160.4) (181.5) 12 1 Research & development includes "core" research & development expenses and administrative expenses, but excludes product development expenses Segment EBIT - Q4 |
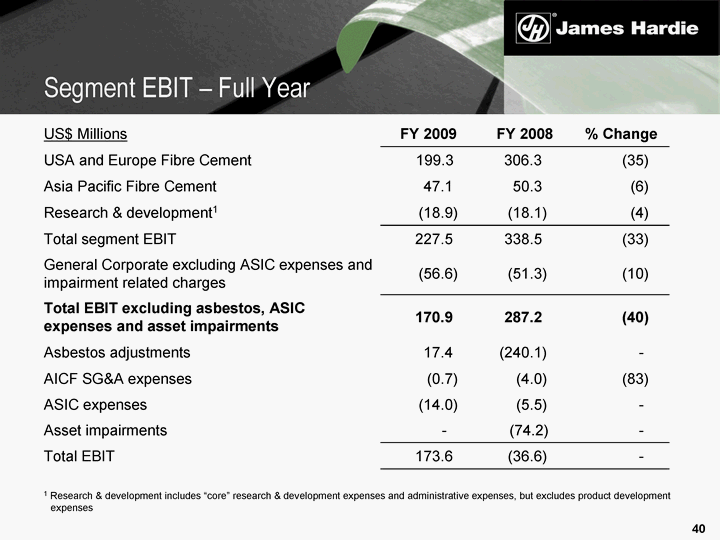
| 40 US$ Millions FY 2009 FY 2008 % Change USA and Europe Fibre Cement 199.3 306.3 (35) Asia Pacific Fibre Cement 47.1 50.3 (6) Research & development1 (18.9) (18.1) (4) Total segment EBIT 227.5 338.5 (33) General Corporate excluding ASIC expenses and impairment related charges (56.6) (51.3) (10) Total EBIT excluding asbestos, ASIC expenses and asset impairments 170.9 287.2 (40) Asbestos adjustments 17.4 (240.1) - AICF SG&A expenses (0.7) (4.0) (83) ASIC expenses (14.0) (5.5) - Asset impairments - (74.2) - Total EBIT 173.6 (36.6) - 1 Research & development includes "core" research & development expenses and administrative expenses, but excludes product development expenses Segment EBIT - Full Year |
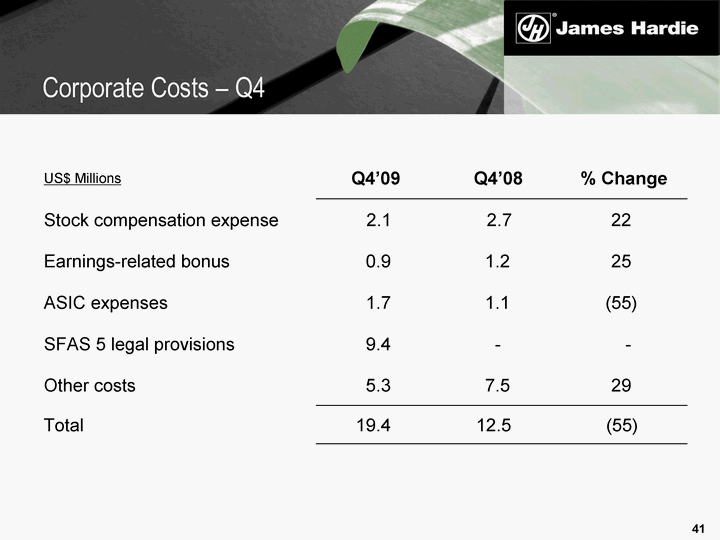
| 41 US$ Millions Q4'09 Q4'08 % Change Stock compensation expense 2.1 2.7 22 Earnings-related bonus 0.9 1.2 25 ASIC expenses 1.7 1.1 (55) SFAS 5 legal provisions 9.4 - - Other costs 5.3 7.5 29 Total 19.4 12.5 (55) Corporate Costs - Q4 |
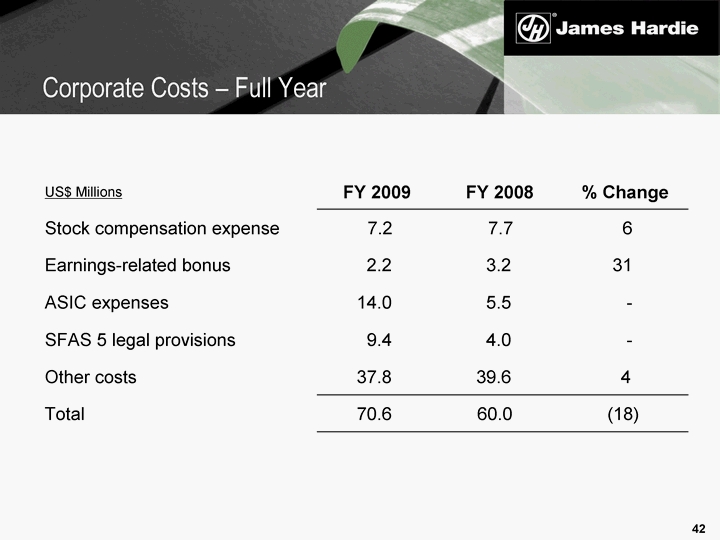
| 42 US$ Millions FY 2009 FY 2008 % Change Stock compensation expense 7.2 7.7 6 Earnings-related bonus 2.2 3.2 31 ASIC expenses 14.0 5.5 - SFAS 5 legal provisions 9.4 4.0 - Other costs 37.8 39.6 4 Total 70.6 60.0 (18) Corporate Costs - Full Year |
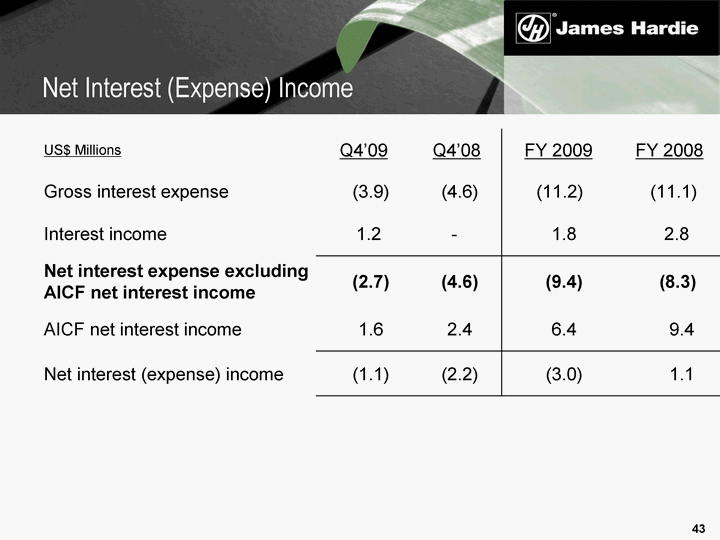
| 43 Net Interest (Expense) Income US$ Millions Q4'09 Q4'08 FY 2009 FY 2008 Gross interest expense (3.9) (4.6) (11.2) (11.1) Interest income 1.2 - 1.8 2.8 Net interest expense excluding AICF net interest income (2.7) (4.6) (9.4) (8.3) AICF net interest income 1.6 2.4 6.4 9.4 Net interest (expense) income (1.1) (2.2) (3.0) 1.1 |
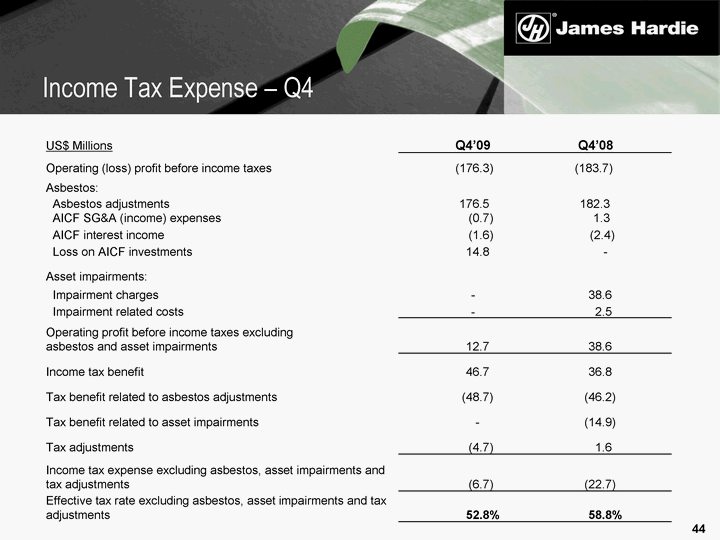
| 44 Income Tax Expense - Q4 US$ Millions Q4'09 Q4'08 Operating (loss) profit before income taxes (176.3) (183.7) Asbestos: Asbestos adjustments 176.5 182.3 AICF SG&A (income) expenses (0.7) 1.3 AICF interest income (1.6) (2.4) Loss on AICF investments 14.8 - Asset impairments: Impairment charges - 38.6 Impairment related costs - 2.5 Operating profit before income taxes excluding asbestos and asset impairments 12.7 38.6 Income tax benefit 46.7 36.8 Tax benefit related to asbestos adjustments (48.7) (46.2) Tax benefit related to asset impairments - (14.9) Tax adjustments (4.7) 1.6 Income tax expense excluding asbestos, asset impairments and tax adjustments (6.7) (22.7) Effective tax rate excluding asbestos, asset impairments and tax adjustments 52.8% 58.8% |
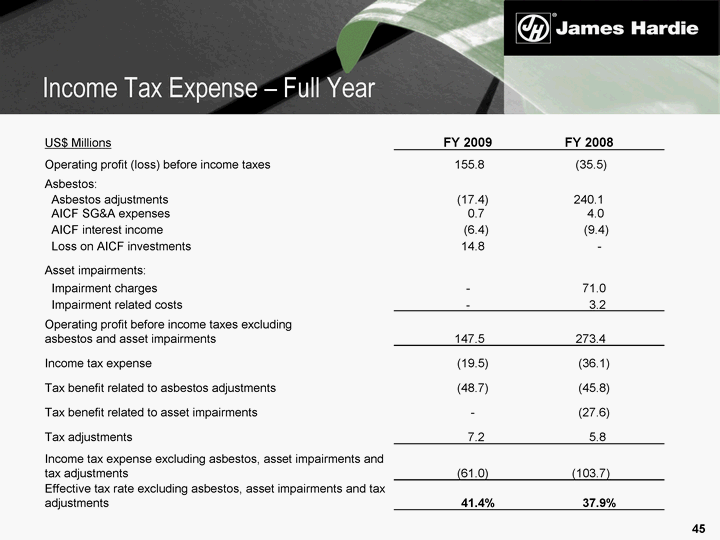
| 45 Income Tax Expense - Full Year US$ Millions FY 2009 FY 2008 Operating profit (loss) before income taxes 155.8 (35.5) Asbestos: Asbestos adjustments (17.4) 240.1 AICF SG&A expenses 0.7 4.0 AICF interest income (6.4) (9.4) Loss on AICF investments 14.8 - Asset impairments: Impairment charges - 71.0 Impairment related costs - 3.2 Operating profit before income taxes excluding asbestos and asset impairments 147.5 273.4 Income tax expense (19.5) (36.1) Tax benefit related to asbestos adjustments (48.7) (45.8) Tax benefit related to asset impairments - (27.6) Tax adjustments 7.2 5.8 Income tax expense excluding asbestos, asset impairments and tax adjustments (61.0) (103.7) Effective tax rate excluding asbestos, asset impairments and tax adjustments 41.4% 37.9% |
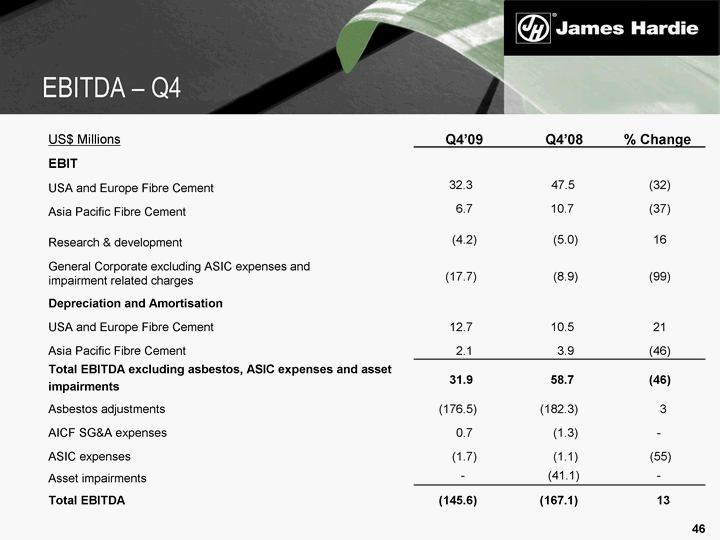
| 46 US$ Millions Q4'09 Q4'08 % Change EBIT USA and Europe Fibre Cement 32.3 47.5 (32) Asia Pacific Fibre Cement 6.7 10.7 (37) Research & development (4.2) (5.0) 16 General Corporate excluding ASIC expenses and impairment related charges (17.7) (8.9) (99) Depreciation and Amortisation USA and Europe Fibre Cement 12.7 10.5 21 Asia Pacific Fibre Cement 2.1 3.9 (46) Total EBITDA excluding asbestos, ASIC expenses and asset impairments 31.9 58.7 (46) Asbestos adjustments (176.5) (182.3) 3 AICF SG&A expenses 0.7 (1.3) - ASIC expenses (1.7) (1.1) (55) Asset impairments - (41.1) - Total EBITDA (145.6) (167.1) 13 EBITDA - Q4 |
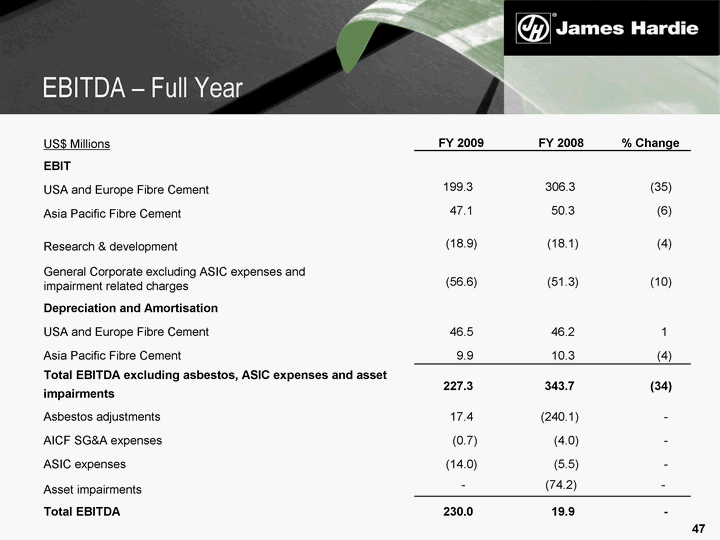
| 47 US$ Millions FY 2009 FY 2008 % Change EBIT USA and Europe Fibre Cement 199.3 306.3 (35) Asia Pacific Fibre Cement 47.1 50.3 (6) Research & development (18.9) (18.1) (4) General Corporate excluding ASIC expenses and impairment related charges (56.6) (51.3) (10) Depreciation and Amortisation USA and Europe Fibre Cement 46.5 46.2 1 Asia Pacific Fibre Cement 9.9 10.3 (4) Total EBITDA excluding asbestos, ASIC expenses and asset impairments 227.3 343.7 (34) Asbestos adjustments 17.4 (240.1) - AICF SG&A expenses (0.7) (4.0) - ASIC expenses (14.0) (5.5) - Asset impairments - (74.2) - Total EBITDA 230.0 19.9 - EBITDA - Full Year |
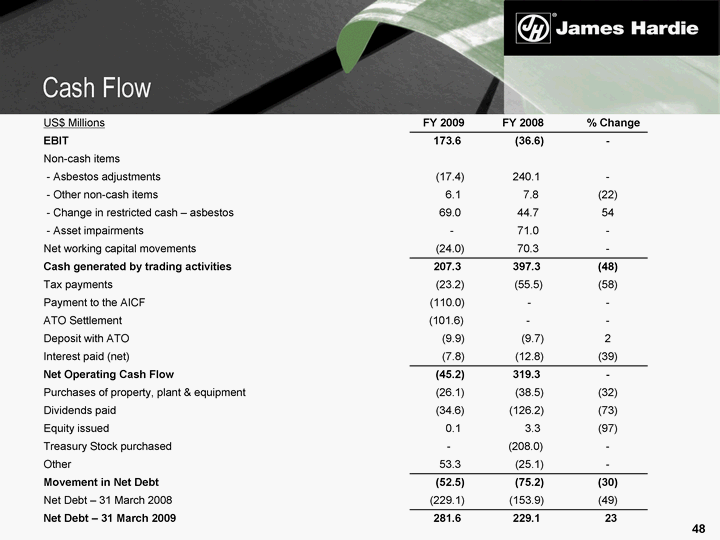
| 48 Cash Flow US$ Millions FY 2009 FY 2008 % Change EBIT 173.6 (36.6) - Non-cash items - Asbestos adjustments (17.4) 240.1 - - Other non-cash items 6.1 7.8 (22) - Change in restricted cash - asbestos 69.0 44.7 54 - Asset impairments - 71.0 - Net working capital movements (24.0) 70.3 - Cash generated by trading activities 207.3 397.3 (48) Tax payments (23.2) (55.5) (58) Payment to the AICF (110.0) - - ATO Settlement (101.6) - - Deposit with ATO (9.9) (9.7) 2 Interest paid (net) (7.8) (12.8) (39) Net Operating Cash Flow (45.2) 319.3 - Purchases of property, plant & equipment (26.1) (38.5) (32) Dividends paid (34.6) (126.2) (73) Equity issued 0.1 3.3 (97) Treasury Stock purchased - (208.0) - Other 53.3 (25.1) - Movement in Net Debt (52.5) (75.2) (30) Net Debt - 31 March 2008 (229.1) (153.9) (49) Net Debt - 31 March 2009 281.6 229.1 23 |
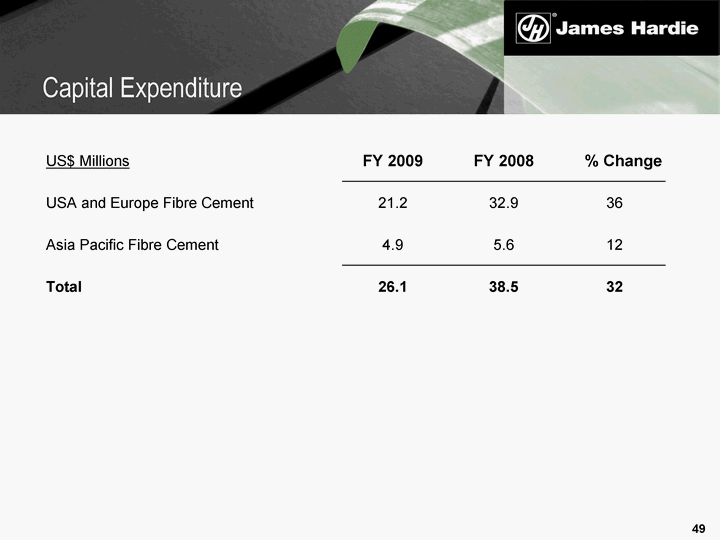
| 49 US$ Millions FY 2009 FY 2008 % Change USA and Europe Fibre Cement 21.2 32.9 36 Asia Pacific Fibre Cement 4.9 5.6 12 Total 26.1 38.5 32 Capital Expenditure |
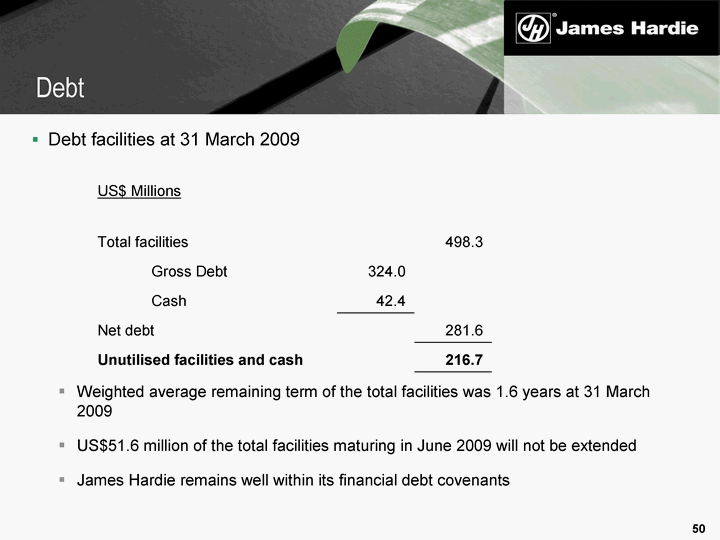
| 50 Debt Weighted average remaining term of the total facilities was 1.6 years at 31 March 2009 US$51.6 million of the total facilities maturing in June 2009 will not be extended James Hardie remains well within its financial debt covenants US$ Millions Total facilities 498.3 Gross Debt 324.0 Cash 42.4 Net debt 281.6 Unutilised facilities and cash 216.7 Debt facilities at 31 March 2009 |
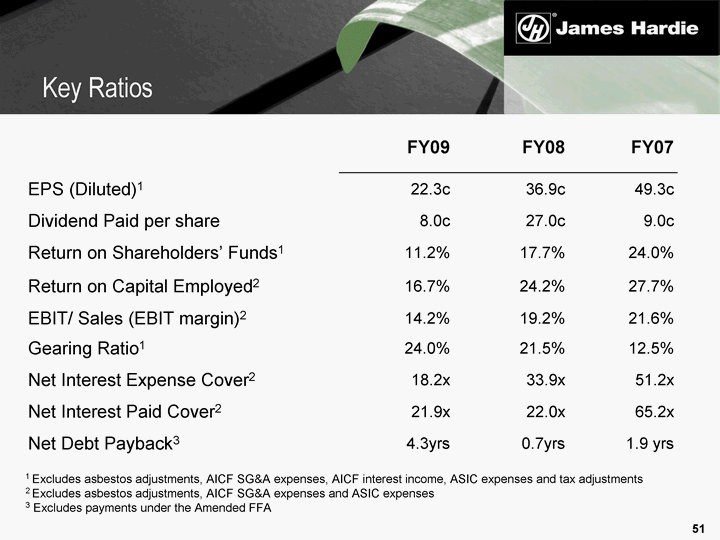
| 51 Key Ratios FY09 FY08 FY07 EPS (Diluted)1 22.3c 36.9c 49.3c Dividend Paid per share 8.0c 27.0c 9.0c Return on Shareholders' Funds1 11.2% 17.7% 24.0% Return on Capital Employed2 16.7% 24.2% 27.7% EBIT/ Sales (EBIT margin)2 14.2% 19.2% 21.6% Gearing Ratio1 24.0% 21.5% 12.5% Net Interest Expense Cover2 18.2x 33.9x 51.2x Net Interest Paid Cover2 21.9x 22.0x 65.2x Net Debt Payback3 4.3yrs 0.7yrs 1.9 yrs 1 Excludes asbestos adjustments, AICF SG&A expenses, AICF interest income, ASIC expenses and tax adjustments 2 Excludes asbestos adjustments, AICF SG&A expenses and ASIC expenses 3 Excludes payments under the Amended FFA |
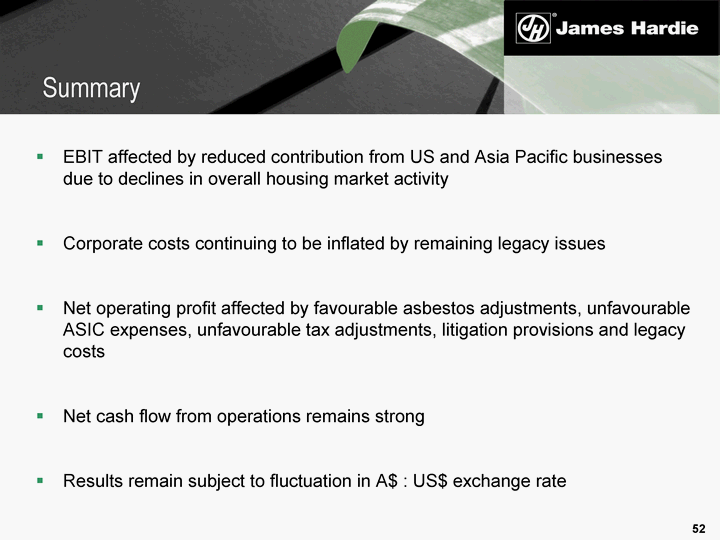
| 52 EBIT affected by reduced contribution from US and Asia Pacific businesses due to declines in overall housing market activity Corporate costs continuing to be inflated by remaining legacy issues Net operating profit affected by favourable asbestos adjustments, unfavourable ASIC expenses, unfavourable tax adjustments, litigation provisions and legacy costs Net cash flow from operations remains strong Results remain subject to fluctuation in A$ : US$ exchange rate Summary |
| 53 Legacy Issues Update ASIC Proceedings Further hearing in relation to exoneration and penalties pending ATO tax assessments Settled FY 2002-2006 audits Court hearing for FY1999 amended assessment scheduled for September 2009 Domicile Review continuing Complexity driven by Dutch corporate law, Australian and US securities law and tax law in all these jurisdictions |
| 54 Updated actuarial report completed as at 31 March 2009 Discounted central estimate increased to A$1,781.6 million from A$1,446.6 million As per AFFA, no contribution will be made to AICF in FY 2010 Asbestos Compensation Funding Arrangements |
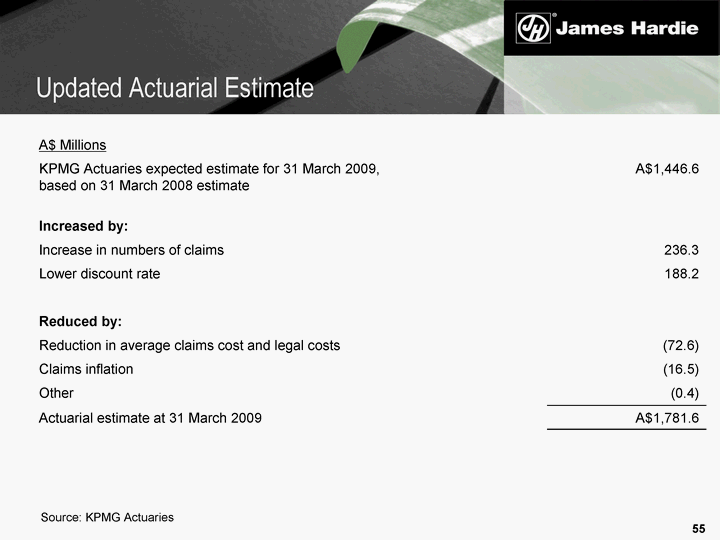
| 55 Updated Actuarial Estimate A$ Millions KPMG Actuaries expected estimate for 31 March 2009, based on 31 March 2008 estimate A$1,446.6 Increased by: Increase in numbers of claims 236.3 Lower discount rate 188.2 Reduced by: Reduction in average claims cost and legal costs (72.6) Claims inflation (16.5) Other (0.4) Actuarial estimate at 31 March 2009 A$1,781.6 Source: KPMG Actuaries |
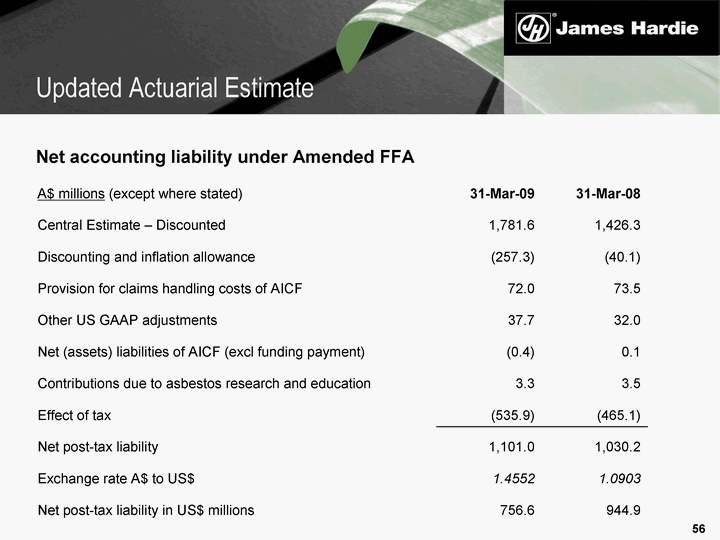
| 56 Updated Actuarial Estimate Net accounting liability under Amended FFA A$ millions (except where stated) 31-Mar-09 31-Mar-08 Central Estimate - Discounted 1,781.6 1,426.3 Discounting and inflation allowance (257.3) (40.1) Provision for claims handling costs of AICF 72.0 73.5 Other US GAAP adjustments 37.7 32.0 Net (assets) liabilities of AICF (excl funding payment) (0.4) 0.1 Contributions due to asbestos research and education 3.3 3.5 Effect of tax (535.9) (465.1) Net post-tax liability 1,101.0 1,030.2 Exchange rate A$ to US$ 1.4552 1.0903 Net post-tax liability in US$ millions 756.6 944.9 |
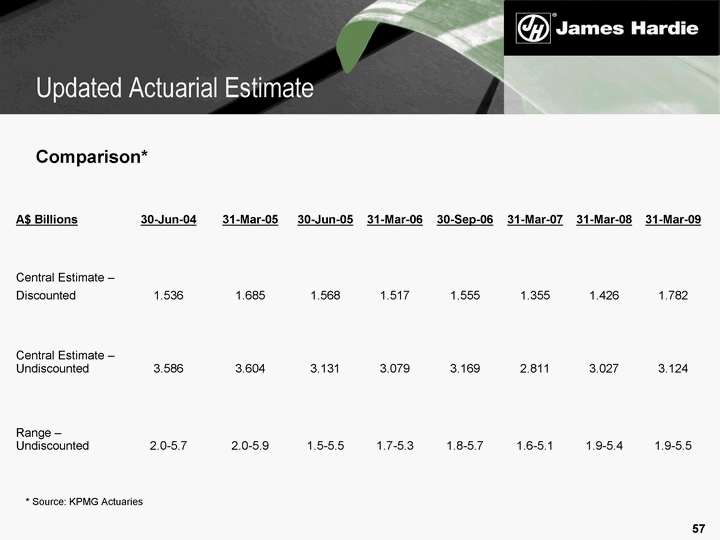
| 57 Updated Actuarial Estimate Comparison* A$ Billions 30-Jun-04 31-Mar-05 30-Jun-05 31-Mar-06 30-Sep-06 31-Mar-07 31-Mar-08 31-Mar-09 Central Estimate - Discounted 1.536 1.685 1.568 1.517 1.555 1.355 1.426 1.782 Central Estimate - Undiscounted 3.586 3.604 3.131 3.079 3.169 2.811 3.027 3.124 Range - Undiscounted 2.0-5.7 2.0-5.9 1.5-5.5 1.7-5.3 1.8-5.7 1.6-5.1 1.9-5.4 1.9-5.5 * Source: KPMG Actuaries |
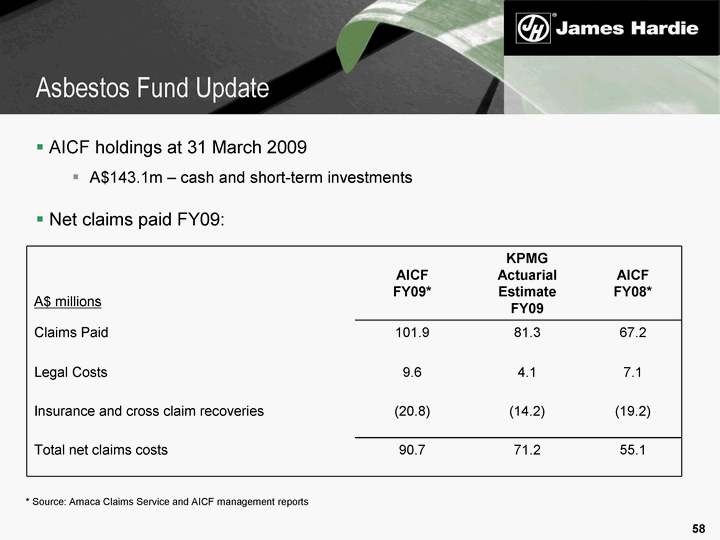
| 58 Asbestos Fund Update AICF holdings at 31 March 2009 A$143.1m - cash and short-term investments Net claims paid FY09: A$ millions AICF FY09* KPMG Actuarial Estimate FY09 AICF FY08* Claims Paid 101.9 81.3 67.2 Legal Costs 9.6 4.1 7.1 Insurance and cross claim recoveries (20.8) (14.2) (19.2) Total net claims costs 90.7 71.2 55.1 * Source: Amaca Claims Service and AICF management reports |
| Questions & Answers |
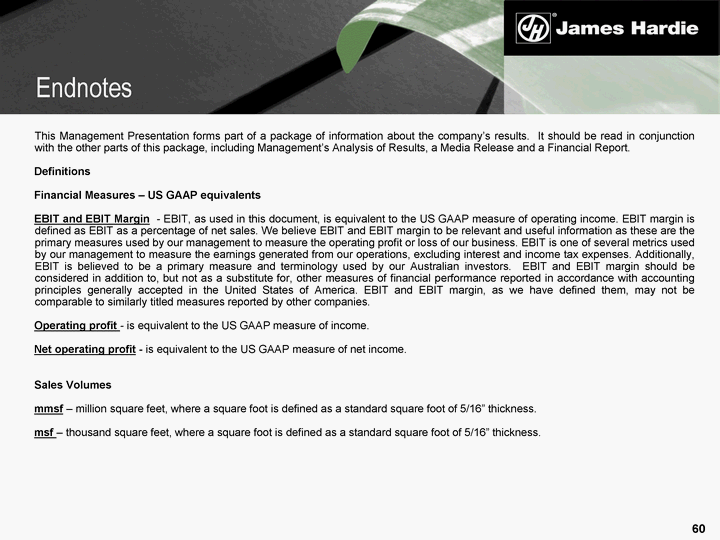
| 60 Endnotes This Management Presentation forms part of a package of information about the company's results. It should be read in conjunction with the other parts of this package, including Management's Analysis of Results, a Media Release and a Financial Report. Definitions Financial Measures - US GAAP equivalents EBIT and EBIT Margin - EBIT, as used in this document, is equivalent to the US GAAP measure of operating income. EBIT margin is defined as EBIT as a percentage of net sales. We believe EBIT and EBIT margin to be relevant and useful information as these are the primary measures used by our management to measure the operating profit or loss of our business. EBIT is one of several metrics used by our management to measure the earnings generated from our operations, excluding interest and income tax expenses. Additionally, EBIT is believed to be a primary measure and terminology used by our Australian investors. EBIT and EBIT margin should be considered in addition to, but not as a substitute for, other measures of financial performance reported in accordance with accounting principles generally accepted in the United States of America. EBIT and EBIT margin, as we have defined them, may not be comparable to similarly titled measures reported by other companies. Operating profit - is equivalent to the US GAAP measure of income. Net operating profit - is equivalent to the US GAAP measure of net income. Sales Volumes mmsf - million square feet, where a square foot is defined as a standard square foot of 5/16" thickness. msf - thousand square feet, where a square foot is defined as a standard square foot of 5/16" thickness. |
| 61 Endnotes Financial Ratios Gearing Ratio - Net debt (cash) divided by net debt (cash) plus shareholders' equity. Net interest expense cover - EBIT divided by net interest expense. Net interest paid cover - EBIT divided by cash paid during the period for interest, net of amounts capitalised. Net debt payback - Net debt (cash) divided by cash flow from operations. Net debt (cash) - Short-term and long-term debt less cash and cash equivalents. |
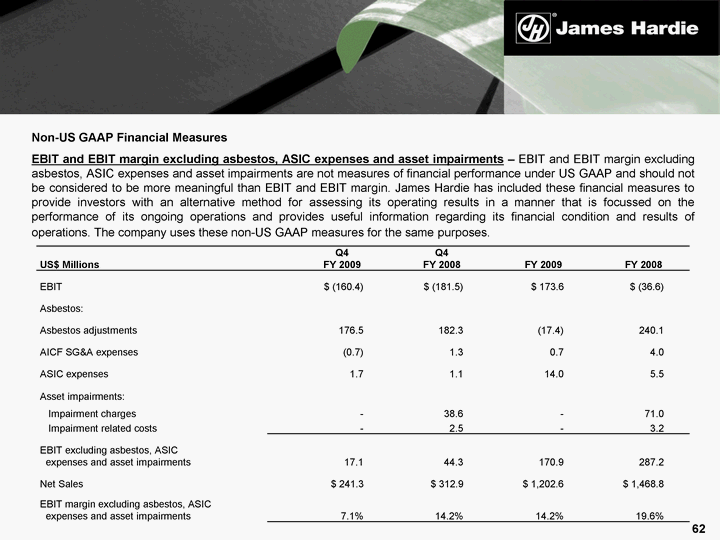
| 62 Non-US GAAP Financial Measures EBIT and EBIT margin excluding asbestos, ASIC expenses and asset impairments - EBIT and EBIT margin excluding asbestos, ASIC expenses and asset impairments are not measures of financial performance under US GAAP and should not be considered to be more meaningful than EBIT and EBIT margin. James Hardie has included these financial measures to provide investors with an alternative method for assessing its operating results in a manner that is focussed on the performance of its ongoing operations and provides useful information regarding its financial condition and results of operations. The company uses these non-US GAAP measures for the same purposes. Q4 Q4 US$ Millions FY 2009 FY 2008 FY 2009 FY 2008 EBIT $ (160.4) $ (181.5) $ 173.6 $ (36.6) Asbestos: Asbestos adjustments 176.5 182.3 (17.4) 240.1 AICF SG&A expenses (0.7) 1.3 0.7 4.0 ASIC expenses 1.7 1.1 14.0 5.5 Asset impairments: Impairment charges - 38.6 - 71.0 Impairment related costs - 2.5 - 3.2 EBIT excluding asbestos, ASIC expenses and asset impairments 17.1 44.3 170.9 287.2 Net Sales $ 241.3 $ 312.9 $ 1,202.6 $ 1,468.8 EBIT margin excluding asbestos, ASIC expenses and asset impairments 7.1% 14.2% 14.2% 19.6% |
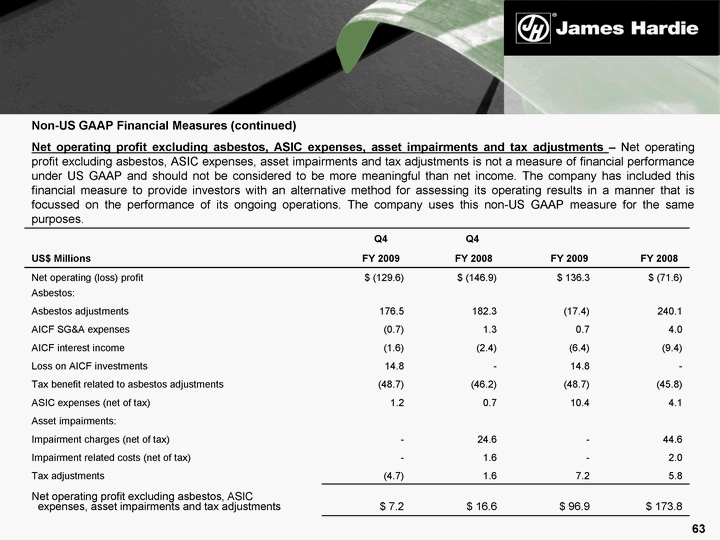
| 63 Non-US GAAP Financial Measures (continued) Net operating profit excluding asbestos, ASIC expenses, asset impairments and tax adjustments - Net operating profit excluding asbestos, ASIC expenses, asset impairments and tax adjustments is not a measure of financial performance under US GAAP and should not be considered to be more meaningful than net income. The company has included this financial measure to provide investors with an alternative method for assessing its operating results in a manner that is focussed on the performance of its ongoing operations. The company uses this non-US GAAP measure for the same purposes. Q4 Q4 US$ Millions FY 2009 FY 2008 FY 2009 FY 2008 Net operating (loss) profit $ (129.6) $ (146.9) $ 136.3 $ (71.6) Asbestos: Asbestos adjustments 176.5 182.3 (17.4) 240.1 AICF SG&A expenses (0.7) 1.3 0.7 4.0 AICF interest income (1.6) (2.4) (6.4) (9.4) Loss on AICF investments 14.8 - 14.8 - Tax benefit related to asbestos adjustments (48.7) (46.2) (48.7) (45.8) ASIC expenses (net of tax) 1.2 0.7 10.4 4.1 Asset impairments: Impairment charges (net of tax) - 24.6 - 44.6 Impairment related costs (net of tax) - 1.6 - 2.0 Tax adjustments (4.7) 1.6 7.2 5.8 Net operating profit excluding asbestos, ASIC expenses, asset impairments and tax adjustments $ 7.2 $ 16.6 $ 96.9 $ 173.8 |
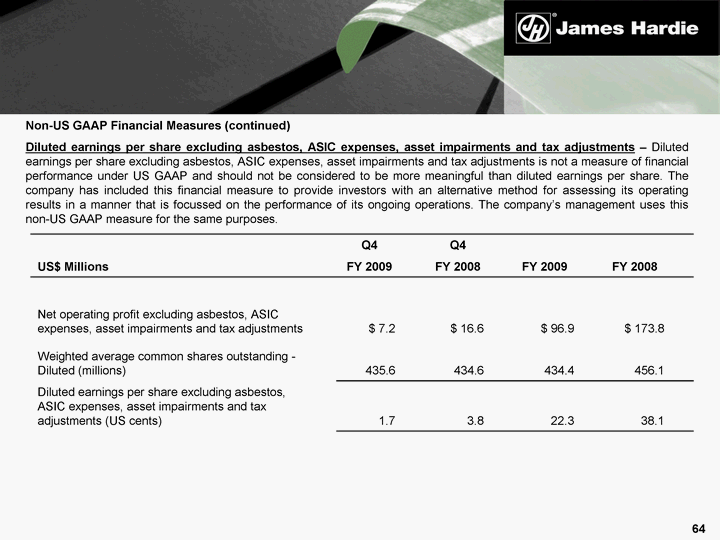
| 64 Non-US GAAP Financial Measures (continued) Diluted earnings per share excluding asbestos, ASIC expenses, asset impairments and tax adjustments - Diluted earnings per share excluding asbestos, ASIC expenses, asset impairments and tax adjustments is not a measure of financial performance under US GAAP and should not be considered to be more meaningful than diluted earnings per share. The company has included this financial measure to provide investors with an alternative method for assessing its operating results in a manner that is focussed on the performance of its ongoing operations. The company's management uses this non-US GAAP measure for the same purposes. Q4 Q4 US$ Millions FY 2009 FY 2008 FY 2009 FY 2008 Net operating profit excluding asbestos, ASIC expenses, asset impairments and tax adjustments $ 7.2 $ 16.6 $ 96.9 $ 173.8 Weighted average common shares outstanding - Diluted (millions) 435.6 434.6 434.4 456.1 Diluted earnings per share excluding asbestos, ASIC expenses, asset impairments and tax adjustments (US cents) 1.7 3.8 22.3 38.1 |
| 65 Non-US GAAP Financial Measures (continued) Effective tax rate excluding asbestos and tax adjustments - Effective tax rate excluding asbestos and tax adjustments is not a measure of financial performance under US GAAP and should not be considered to be more meaningful than effective tax rate. The company has included this financial measure to provide investors with an alternative method for assessing its operating results in a manner that is focussed on the performance of its ongoing operations. The company's management uses this non-US GAAP measure for the same purposes. |
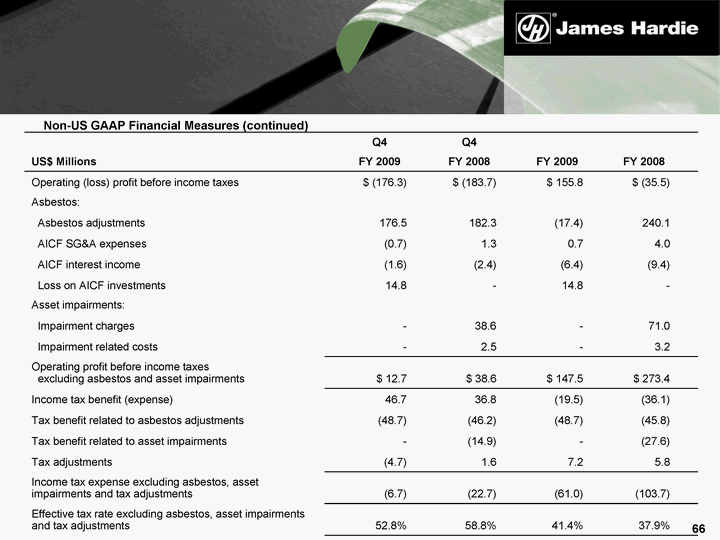
| 66 Non-US GAAP Financial Measures (continued) Q4 Q4 US$ Millions FY 2009 FY 2008 FY 2009 FY 2008 Operating (loss) profit before income taxes $ (176.3) $ (183.7) $ 155.8 $ (35.5) Asbestos: Asbestos adjustments 176.5 182.3 (17.4) 240.1 AICF SG&A expenses (0.7) 1.3 0.7 4.0 AICF interest income (1.6) (2.4) (6.4) (9.4) Loss on AICF investments 14.8 - 14.8 - Asset impairments: Impairment charges - 38.6 - 71.0 Impairment related costs - 2.5 - 3.2 Operating profit before income taxes excluding asbestos and asset impairments $ 12.7 $ 38.6 $ 147.5 $ 273.4 Income tax benefit (expense) 46.7 36.8 (19.5) (36.1) Tax benefit related to asbestos adjustments (48.7) (46.2) (48.7) (45.8) Tax benefit related to asset impairments - (14.9) - (27.6) Tax adjustments (4.7) 1.6 7.2 5.8 Income tax expense excluding asbestos, asset impairments and tax adjustments (6.7) (22.7) (61.0) (103.7) Effective tax rate excluding asbestos, asset impairments and tax adjustments 52.8% 58.8% 41.4% 37.9% |
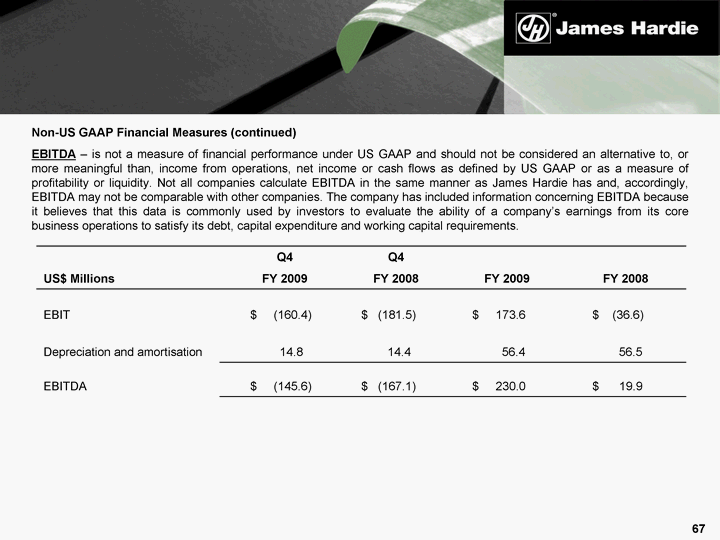
| 67 Non-US GAAP Financial Measures (continued) EBITDA - is not a measure of financial performance under US GAAP and should not be considered an alternative to, or more meaningful than, income from operations, net income or cash flows as defined by US GAAP or as a measure of profitability or liquidity. Not all companies calculate EBITDA in the same manner as James Hardie has and, accordingly, EBITDA may not be comparable with other companies. The company has included information concerning EBITDA because it believes that this data is commonly used by investors to evaluate the ability of a company's earnings from its core business operations to satisfy its debt, capital expenditure and working capital requirements. Q4 Q4 US$ Millions FY 2009 FY 2008 FY 2009 FY 2008 EBIT $ (160.4) $ (181.5) $ 173.6 $ (36.6) Depreciation and amortisation 14.8 14.4 56.4 56.5 EBITDA $ (145.6) $ (167.1) $ 230.0 $ 19.9 |
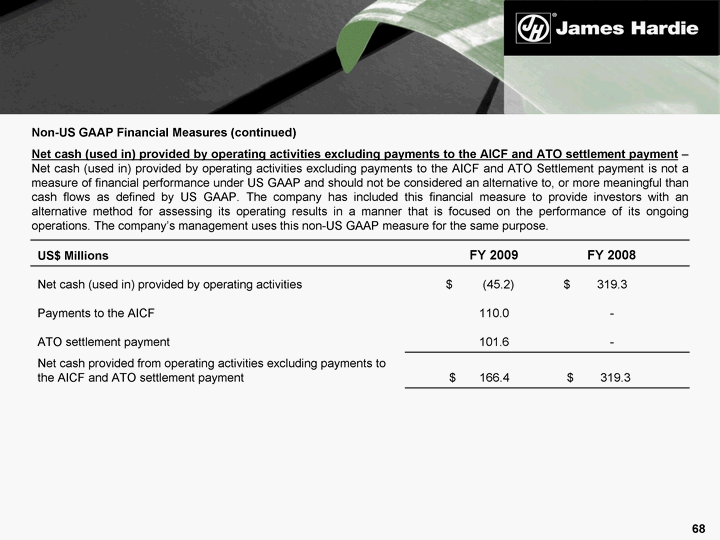
| 68 Non-US GAAP Financial Measures (continued) Net cash (used in) provided by operating activities excluding payments to the AICF and ATO settlement payment - Net cash (used in) provided by operating activities excluding payments to the AICF and ATO Settlement payment is not a measure of financial performance under US GAAP and should not be considered an alternative to, or more meaningful than cash flows as defined by US GAAP. The company has included this financial measure to provide investors with an alternative method for assessing its operating results in a manner that is focused on the performance of its ongoing operations. The company's management uses this non-US GAAP measure for the same purpose. US$ Millions FY 2009 FY 2008 Net cash (used in) provided by operating activities $ (45.2) $ 319.3 Payments to the AICF 110.0 - ATO settlement payment 101.6 - Net cash provided from operating activities excluding payments to the AICF and ATO settlement payment $ 166.4 $ 319.3 |
| James Hardie Q4 FY09 Results Management Presentation - 20 May 2009 In this Management Presentation, James Hardie may present financial measures, sales volume terms, financial ratios, and Non-US GAAP financial measures included in the Definitions section of this document starting on page 60. The company presents financial measures that it believes are customarily used by its Australian investors. Specifically, these financial measures, which are equivalent to or derived from certain US GAAP measures as explained in the definitions, include "EBIT", "EBIT margin", "Operating profit" and "Net operating profit". The company may also present other terms for measuring its sales volumes ("million square feet or mmsf" and "thousand square feet or msf"); financial ratios ("Gearing ratio", "Net interest expense cover", "Net interest paid cover", "Net debt payback", "Net debt (cash)"); and Non-US GAAP financial measures ("EBIT excluding asbestos, ASIC expenses and asset impairments", "EBIT margin excluding asbestos, ASIC expenses and asset impairments", "Net operating profit excluding asbestos, ASIC expenses, asset impairments and tax adjustments", "Diluted earnings per share excluding asbestos, ASIC expenses, asset impairments and tax adjustments", "Operating profit before income taxes excluding asbestos", "Effective tax rate excluding asbestos and tax adjustments", "EBITDA" and "Net cash (used in) provided by operating activities excluding payments to the AICF and ATO settlement payment"). Unless otherwise stated, results and comparisons are of the 4th quarter and current full fiscal year versus the 4th quarter and full year of the prior fiscal year. |