
| USA Fibre Cement December 2004 Orlando, Florida Exhibit 99.1 |
| USA Business History: 1990-1995 Commenced operations in 1990; primary focus on roofing A one plant, one line business in 1991 Shifted our focus from Roofing to Siding in 1992 Moved to high throughput, low unit cost manufacturing Strictly a sell and make approach Revenue growth led to investments in new capacity |
| USA Business History: 1995-2000 Direct competition entered the market ... Etex (Cemplank) - 1989 ABTco - 1997 Temple Inland - 1998 CertainTeed - 2000 After realising significant gains in process technology, we began to make advancements in product technology Selected "Product Leadership" as our go-forward strategic driver Started building significant marketing and product development capabilities onto our strong manufacturing and sales base capabilities |
| USA Business History: 2000-2004 Added regional flat capacity: Peru, IL - 2000 Waxahachie, TX - 2001 Purchased Cemplank - 2002 Currently commissioning our 9th plant (Reno. NV) Trim capacity investments in Cleburne and Peru, IL ColorPlus investments in Peru, IL 4yr CAGR: 20% Volume 24% Revenue 30% EBIT |
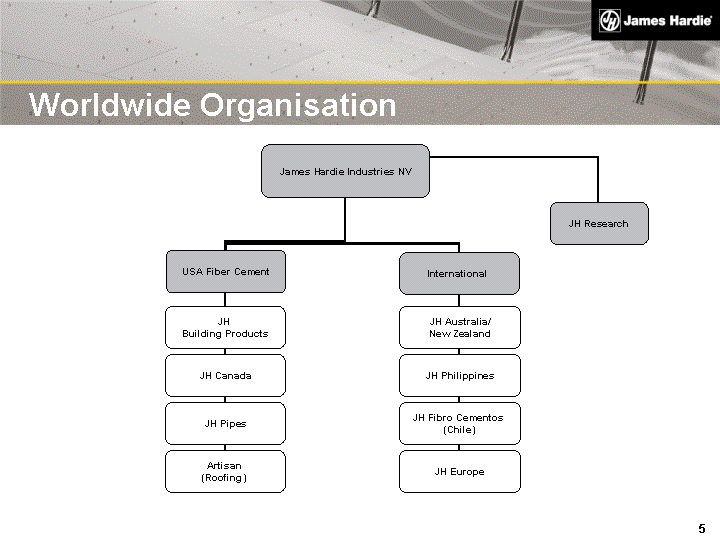
| Worldwide Organisation Worldwide Organisation |
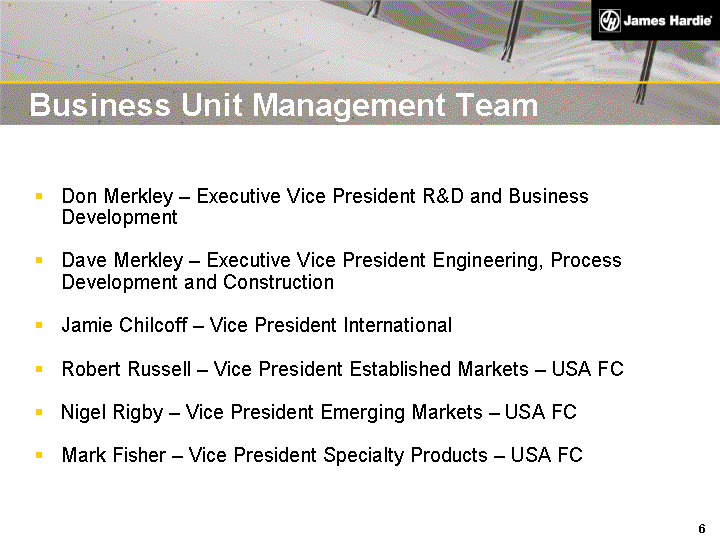
| Business Unit Management Team Don Merkley - Executive Vice President R&D and Business Development Dave Merkley - Executive Vice President Engineering, Process Development and Construction Jamie Chilcoff - Vice President International Robert Russell - Vice President Established Markets - USA FC Nigel Rigby - Vice President Emerging Markets - USA FC Mark Fisher - Vice President Specialty Products - USA FC |
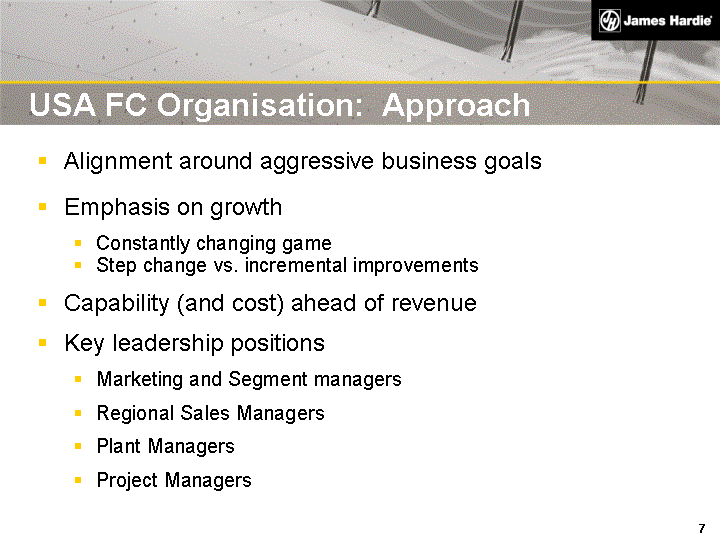
| Alignment around aggressive business goals Emphasis on growth Constantly changing game Step change vs. incremental improvements Capability (and cost) ahead of revenue Key leadership positions Marketing and Segment managers Regional Sales Managers Plant Managers Project Managers USA FC Organisation: Approach |
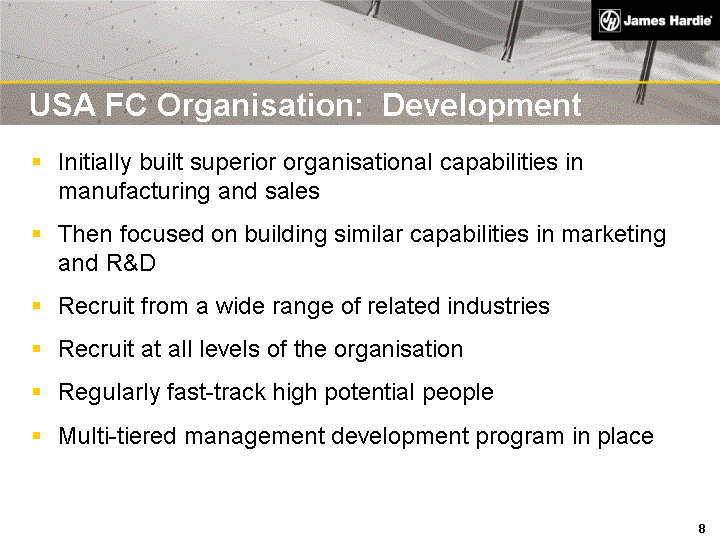
| Initially built superior organisational capabilities in manufacturing and sales Then focused on building similar capabilities in marketing and R&D Recruit from a wide range of related industries Recruit at all levels of the organisation Regularly fast-track high potential people Multi-tiered management development program in place USA FC Organisation: Development |
| USA FC Business Strategy Aggressively grow the market for fibre cement Secure our desired overall market position while defending our share in existing market segments Leverage our superior technology to offer differentiated products and systems of superior value to those of competitors, to reduce direct price competition |
| Primary Demand Create awareness at the consumer level Target the builder and contractor (decision maker) Access the market through traditional channels Category Share Brand program Differentiated product offering Long term price positioning Performance Indicators (Measurements) Revenue growth EBIT margin Manufacturing capabilities USA FC Top-Line Growth |
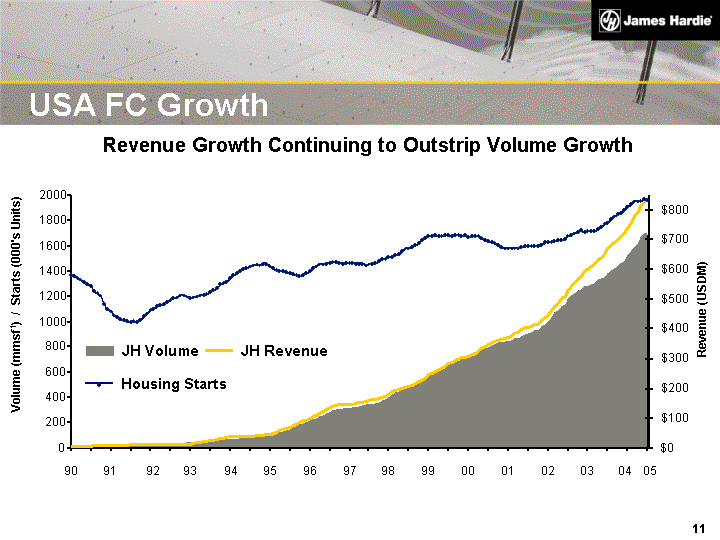
| USA FC Growth Revenue Growth Continuing to Outstrip Volume Growth 0 200 400 600 800 1000 1200 1400 1600 1800 2000 90 91 92 93 94 95 96 97 98 99 00 01 02 03 04 Volume (mmsf1) / Starts (000's Units) $0 $100 $200 $300 $400 $500 $600 $700 $800 Revenue (USDM) JH Volume JH Revenue Housing Starts 05 |
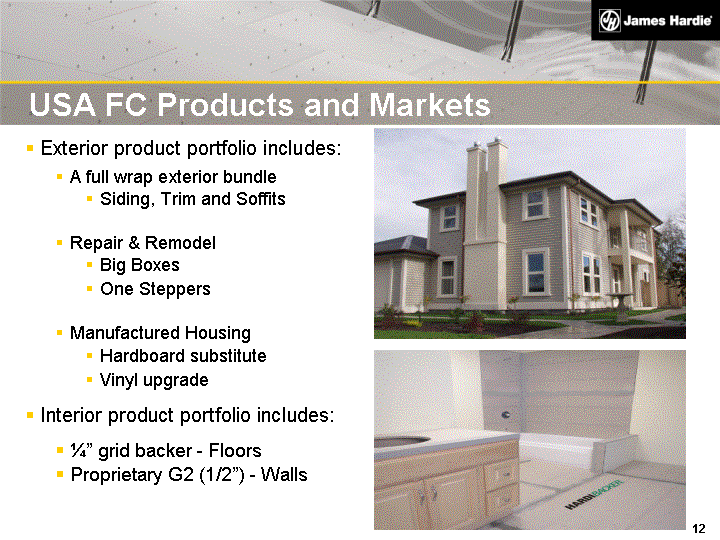
| Exterior product portfolio includes: A full wrap exterior bundle Siding, Trim and Soffits Repair & Remodel Big Boxes One Steppers Manufactured Housing Hardboard substitute Vinyl upgrade Interior product portfolio includes: 1/4" grid backer - Floors Proprietary G2 (1/2") - Walls Proprietary G2 (1/2") - Walls Proprietary G2 (1/2") - Walls Proprietary G2 (1/2") - Walls Proprietary G2 (1/2") - Walls Proprietary G2 (1/2") - Walls Proprietary G2 (1/2") - Walls Proprietary G2 (1/2") - Walls Proprietary G2 (1/2") - Walls Proprietary G2 (1/2") - Walls Proprietary G2 (1/2") - Walls Proprietary G2 (1/2") - Walls Proprietary G2 (1/2") - Walls Proprietary G2 (1/2") - Walls Proprietary G2 (1/2") - Walls USA FC Products and Markets |
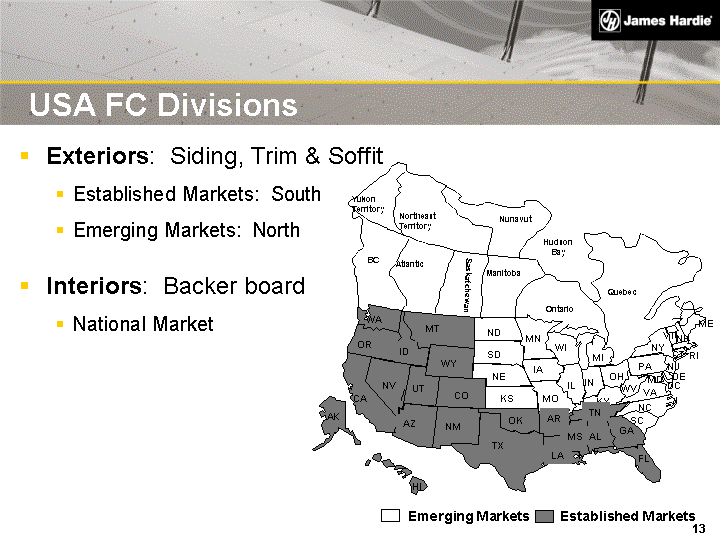
| Exteriors: Siding, Trim & Soffit Established Markets: South Emerging Markets: North Interiors: Backer board National Market Established Markets ME Emerging Markets RI NH CA NV AZ UT NM CO KS TX OK LA WI OH IA MS AR MO KY TN AL DC ND NE SD GA IL MN FL MI IN NJ NC SC DE MD WV VA VT NY PA CT HI OR WA ID MT WY Yukon Territory Northeast Territory Atlantic Saskatchewan Manitoba Ontario BC Quebec Nunavut Hudson Bay USA FC Divisions AK |

| USA FC Exteriors |
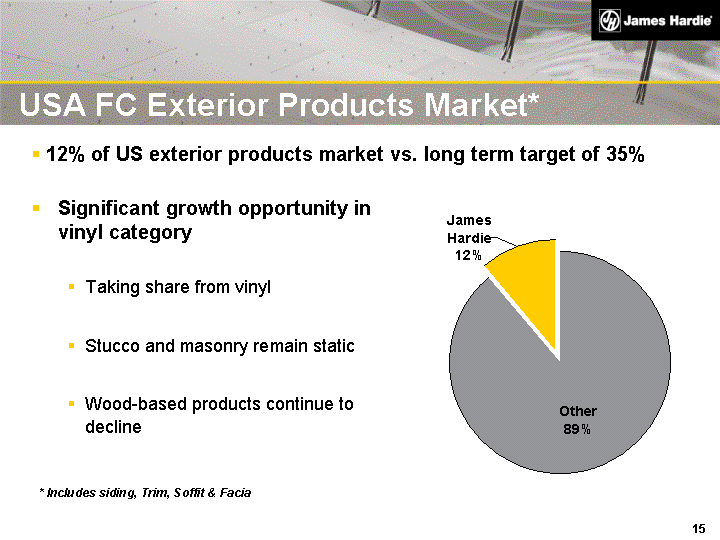
| USA FC Exterior Products Market* 12% of US exterior products market vs. long term target of 35% * Includes siding, Trim, Soffit & Facia James Hardie 12% Other 89% Significant growth opportunity in vinyl category Taking share from vinyl Stucco and masonry remain static Wood-based products continue to decline |
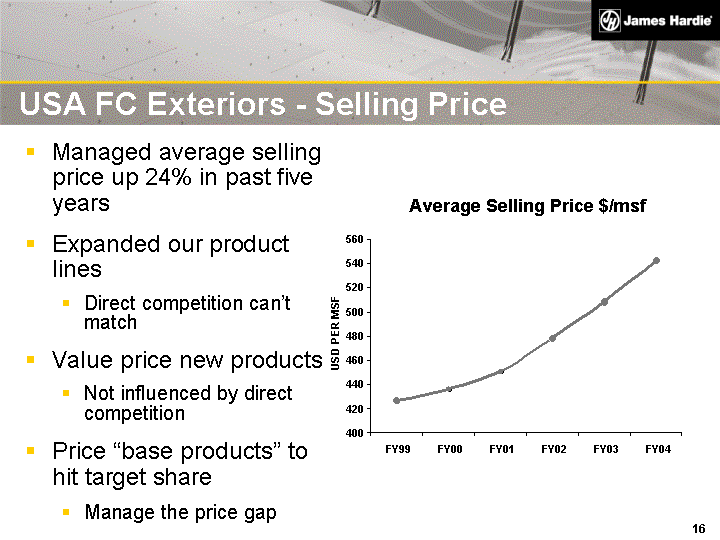
| USA FC Exteriors - Selling Price Managed average selling price up 24% in past five years Expanded our product lines Direct competition can't match Value price new products Not influenced by direct competition Price "base products" to hit target share Manage the price gap 400 420 440 460 480 500 520 540 560 Average Selling Price $/msf FY99 FY00 FY01 FY02 FY03 FY04 USD PER MSF |
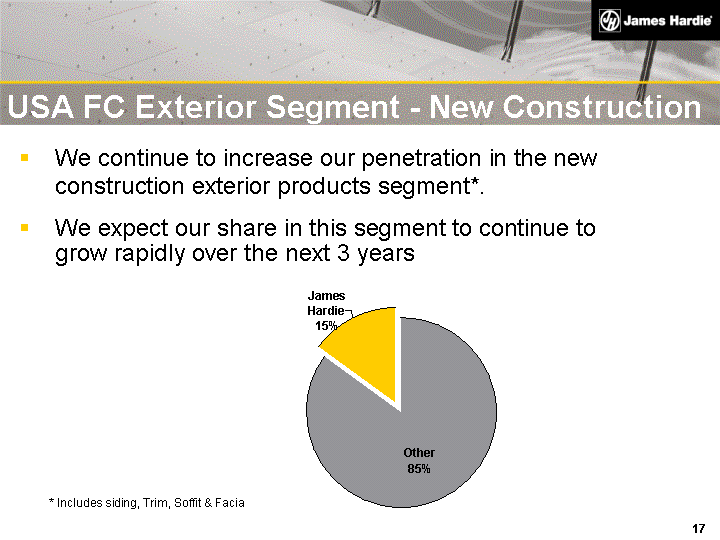
| We continue to increase our penetration in the new construction exterior products segment*. We expect our share in this segment to continue to grow rapidly over the next 3 years * Includes siding, Trim, Soffit & Facia James Hardie 15% Other 85% USA FC Exterior Segment - New Construction |
| USA FC Exterior Segment - Repair & Remodel Significant opportunity for growth in the R&R segment Our penetration in this segment is increasing but is still low Lower terminal FC share than new construction since we position a "remove and replace" solution against Vinyl's "recover" approach |
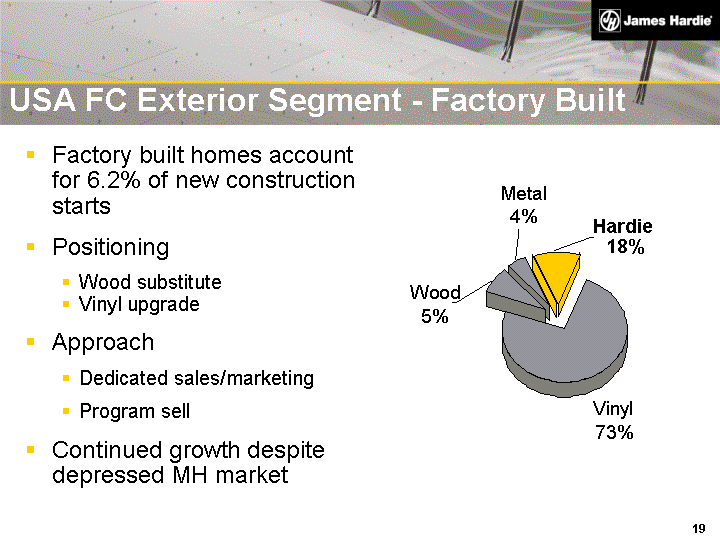
| USA FC Exterior Segment - Factory Built Factory built homes account for 6.2% of new construction starts Positioning Wood substitute Vinyl upgrade Approach Dedicated sales/marketing Program sell Continued growth despite depressed MH market Wood Vinyl 73% 5% Metal 4% Hardie 18% |

| USA FC Exterior Products - Siding Siding is the largest part of our business Our siding products continue to grow in all markets Expanding product range Penetration against vinyl Repair and remodelling segment Siding Growth 1997 1998 1999 2000 2001 2002 2003 2004 |

| Launched Harditrim in Nov 98 Positioning Durability and wood-like appearance Priced at a premium to other manufactured trims Launched XLD Allows increased thickness IP protection in place Demand increasing Additional capacity in FY05 (Peru, IL) USA FC Exterior Products - Harditrim Trim Growth 1998 1999 2000 2001 2002 2003 2004 |

| USA FC Exterior Products - Colorplus Launched Colorplus in Jan '02 Helps to take share from vinyl Lifts selling prices Lifts margins Internal color capability being developed Ramp up ongoing - Peru plant 20 by 20 Color and SKU regional matrix Supply chain compression |

| USA FC Exterior Products - Soffits Includes soffit panels, planks and premium vented soffit High throughput JH automated manufacturing capacity now in place Soffit Growth 1998 1999 2000 2001 2002 2003 2004 |
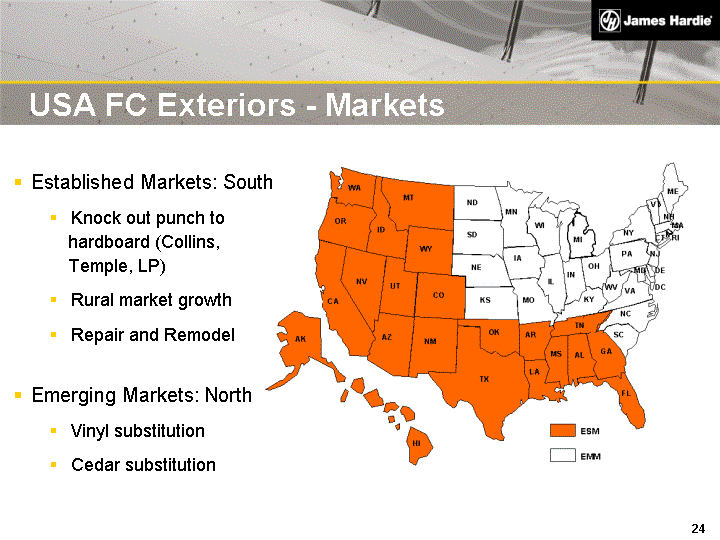
| USA FC Exteriors - Markets Established Markets: South Knock out punch to hardboard (Collins, Temple, LP) Rural market growth Repair and Remodel Emerging Markets: North Vinyl substitution Cedar substitution |

| Established Markets - Current State High share position in most markets Major builders and dealers High awareness of the JH brand Trade and consumers Continued growth Smaller builders More products per house Rural markets Repair and remodel |

| Established Markets - Current State FC accounts for 1/3 of siding sales in established markets EM account for over 76% of our exterior products sales High share position in most markets Major builders and dealers High awareness of the JH brand Trade and consumers Continued growth Smaller builders More products per house Rural markets JH Established Market Growth 1997 1998 1999 2000 2001 2002 2003 2004 |

| Terminal share of 40 - 50% 7% - 15% targeted growth band Hardboard and brick substitution in New Construction Vinyl alternative in R&R Rural market growth New product launches Protect category share Established Markets - Go Forward |

| Vinyl belt High population Strong growth in new const. Aging housing stock Emerging market opportunity Emerging Markets - Current State |

| Strategy: Segment the single family construction based on house value Target move-up and luxury homes Position Hardiplank as a viable upgrade to vinyl Tactics: Accelerate awareness at the consumer level (marketing) Align channel: actively manage "on the wall" cost (field sales) Leverage the early conversions thru co-branding programs with the builders (sales/marketing) Emerging Markets - Current State |
| Emerging Markets - Go Forward Color Plus as a substitute for vinyl Top 1/3 of the market Turn key capability Efficient supply chain Product bundle includes JH siding, trim and color |
| USA FC Interiors |
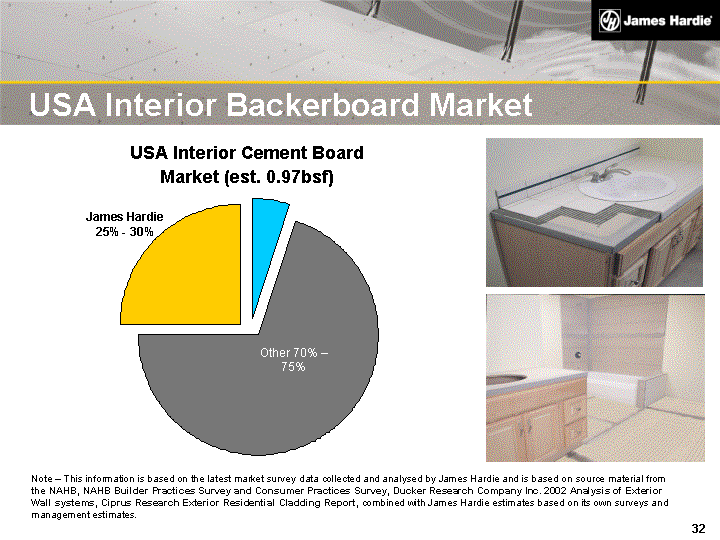
| USA Interior Backerboard Market USA Interior Cement Board Market (est. 0.97bsf) Note - This information is based on the latest market survey data collected and analysed by James Hardie and is based on source material from the NAHB, NAHB Builder Practices Survey and Consumer Practices Survey, Ducker Research Company Inc. 2002 Analysis of Exterior Wall systems, Ciprus Research Exterior Residential Cladding Report, combined with James Hardie estimates based on its own surveys and management estimates. James Hardie 25% - 30% Other 70% - 75% |
| Total cement board market estimated to be 1bsf JH has the leading position in the 1/4" market due to clear technology advantage for floor applications G2 technology driving penetration on wall applications Broad distribution base Pro-tile Lumber Dry-wall US Interiors - Current State Backer Volume Growth |

| Interior Growth - Hardibacker(r) Volume Growth Mar-90 Mar-91 Mar-92 Mar-93 Mar-94 Mar-95 Mar-96 Mar-97 Mar-98 Mar-99 Mar-00 Mar-01 Mar-02 Mar-03 Mar-04 |
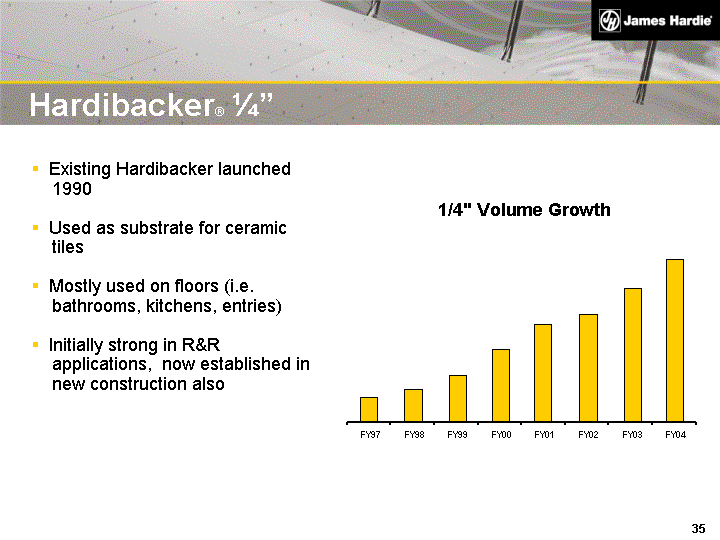
| Hardibacker(r) 1/4" Existing Hardibacker launched 1990 Used as substrate for ceramic tiles Mostly used on floors (i.e. bathrooms, kitchens, entries) Initially strong in R&R applications, now established in new construction also 1/4" Volume Growth FY97 FY98 FY99 FY00 FY01 FY02 FY03 FY04 |
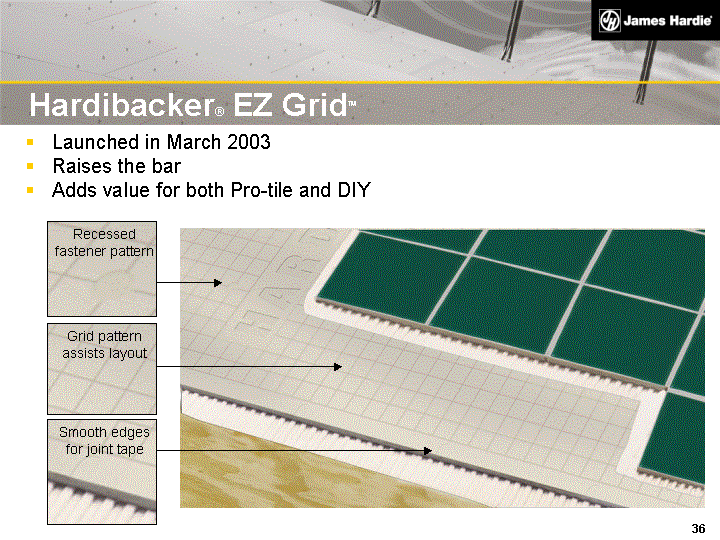
| Hardibacker(r) EZ GridTM Launched in March 2003 Raises the bar Adds value for both Pro-tile and DIY Grid pattern assists layout Smooth edges for joint tape Recessed fastener pattern |
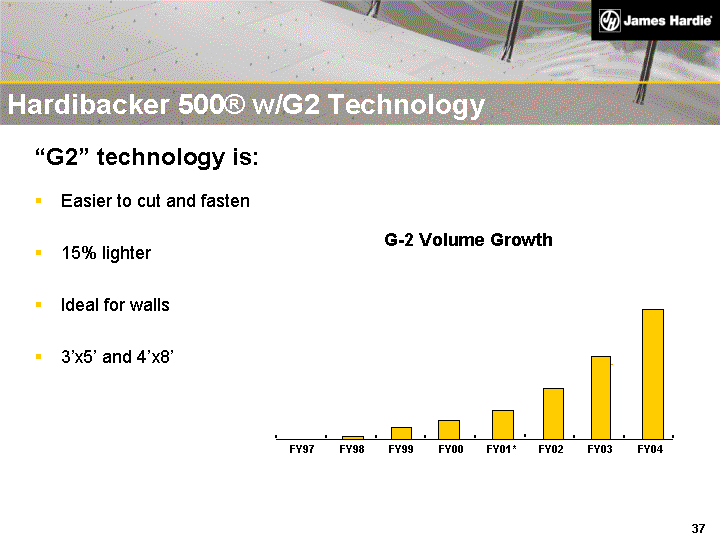
| Hardibacker 500(r) w/G2 Technology "G2" technology is: Easier to cut and fasten 15% lighter Ideal for walls 3'x5' and 4'x8' G-2 Volume Growth FY97 FY98 FY99 FY00 FY01* FY02 FY03 FY04 |
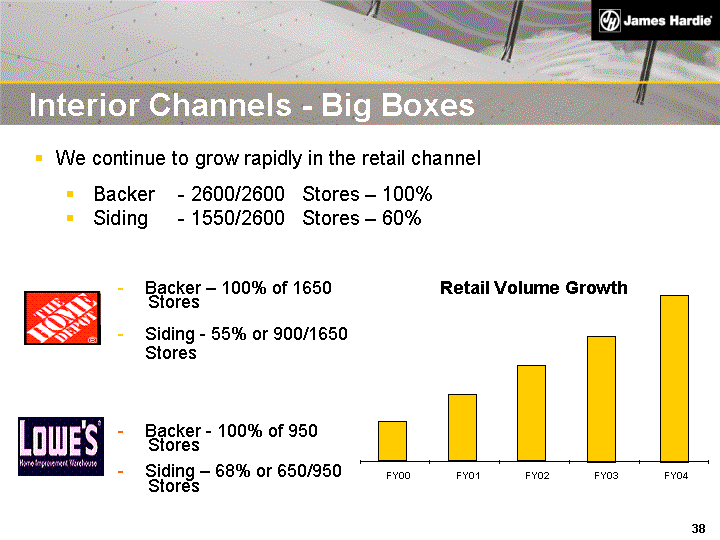
| Interior Channels - Big Boxes We continue to grow rapidly in the retail channel Backer - 2600/2600 Stores - 100% Siding - 1550/2600 Stores - 60% Backer - 100% of 1650 Stores Siding - 55% or 900/1650 Stores Backer - 100% of 950 Stores Siding - 68% or 650/950 Stores Retail Volume Growth FY00 FY01 FY02 FY03 FY04 |
| Interior Channels - Other Pro-tile Channel Manufacturer/distributors Import/distributors Dealers Lumber Channel National/regional building materials chains Independent yards Gypsum Channel Drywall distributors |
| Long-term - a high terminal share of US backer board market Penetrate against glass mesh and other cement boards on ceramic tile underlayment applications Substitute against green board in new construction Protect position in retail channel Interiors - Go Forward |
| Manufacturing Operations & Capacity |

| Manufacturing Advantage Capital Efficiency Unit cost of production Ability to deliver differentiated products Aligned Patterned Thick Scale to build purpose built machines Culture focused on operational and engineering step change |

| Manufacturing - Engineering Innovations Created centralised process engineering to support: New product development and launch Efficiency gap closure Design change projects Implement next generation ideas into the business units Created next generation engineering to work on step- change forming platforms and operational philosophies JH has gone from 1 to 3 major forming platforms over the last 4 years. |
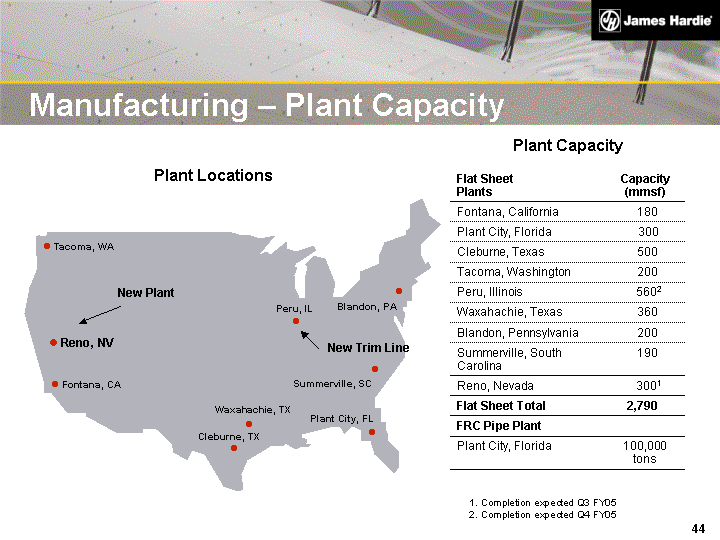
| Manufacturing - Plant Capacity Plant Locations Flat Sheet Plants Capacity (mmsf) Fontana, California 180 Plant City, Florida 300 Cleburne, Texas 500 Tacoma, Washington 200 Peru, Illinois 5602 Waxahachie, Texas 360 Blandon, Pennsylvania 200 Summerville, South Carolina 190 Reno, Nevada 3001 Flat Sheet Total 2,790 FRC Pipe Plant Plant City, Florida 100,000 tons Plant Capacity 1. Completion expected Q3 FY05 2. Completion expected Q4 FY05 Tacoma, WA Fontana, CA Plant City, FL Waxahachie, TX Cleburne, TX Peru, IL Blandon, PA Summerville, SC Reno, NV New Trim Line New Plant |
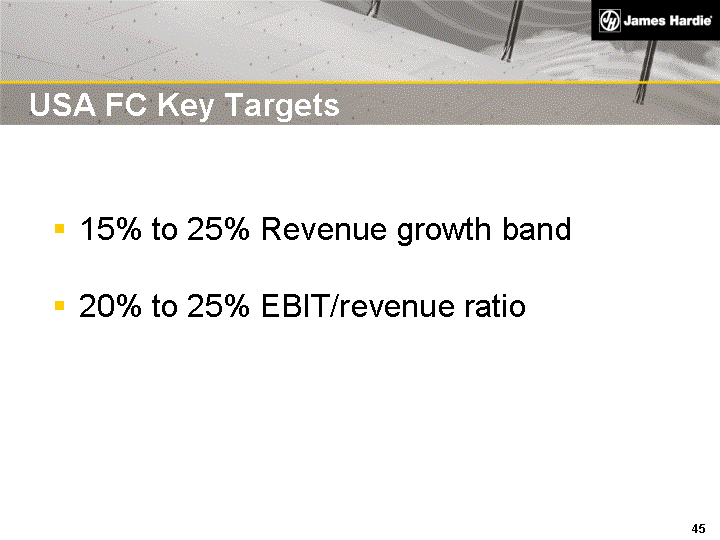
| 15% to 25% Revenue growth band 20% to 25% EBIT/revenue ratio USA FC Key Targets |

| USA FC Business Overview Revenue - 26% CAGR in Last 5 years 0 100 200 300 400 500 600 700 800 900 FY99 FY00 FY01 FY02 FY03 FY04 USDM |

| USA FC Business Overview Price 400 420 440 460 480 500 520 FY99 FY00 FY01 FY02 FY03 FY04 USD PER MSF |

| Cost: Normalised like for like, factory costs continue to decline Capacity ramp ups and start ups Waxahachie, Cleburne XLD, Blandon, Reno and Peru XLD Funding several key growth initiatives Market Development - R&R, Color Plus & Roofing USA FC Business Overview |
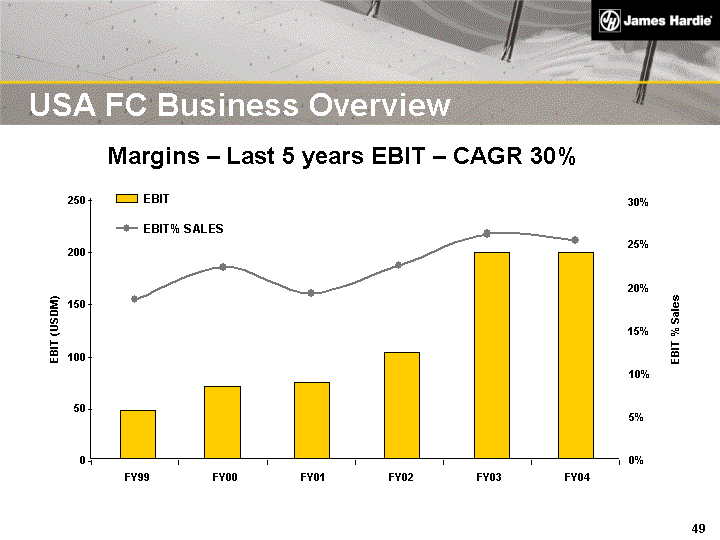
| USA FC Business Overview Margins - Last 5 years EBIT - CAGR 30% 0 50 100 150 200 250 FY99 FY00 FY01 FY02 FY03 FY04 EBIT (USDM) 0% 5% 10% 15% 20% 25% 30% EBIT % Sales EBIT EBIT% SALES |
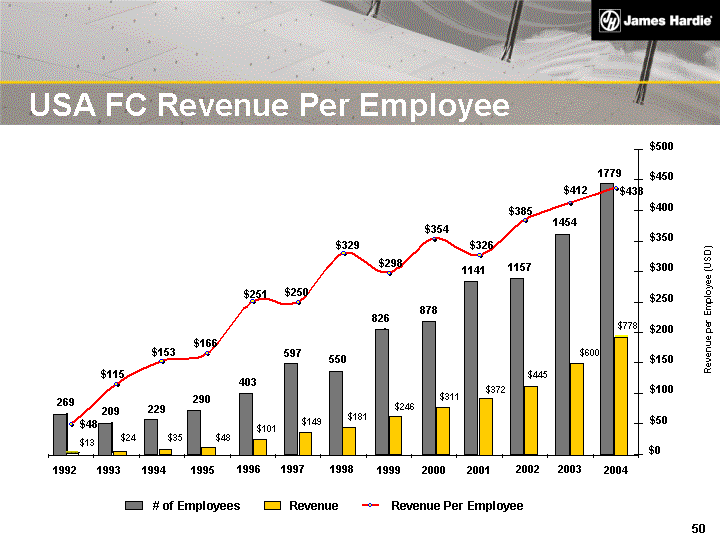
| USA FC Revenue Per Employee 826 Revenue per Employee (USD) 269 209 229 290 403 597 550 878 1141 1157 1454 1779 $778 $600 $445 $372 $311 $246 $181 $149 $101 $35 $24 $13 $48 $48 $115 $153 $166 $250 $251 $329 $298 $354 $326 $385 $412 $438 0 200 400 600 800 1000 1200 1400 1600 1800 2000 1992 1993 1994 1995 1996 1997 1998 1999 2000 2001 2002 2003 2004 $0 $50 $100 $150 $200 $250 $300 $350 $400 $450 $500 # of Employees Revenue Revenue Per Employee |
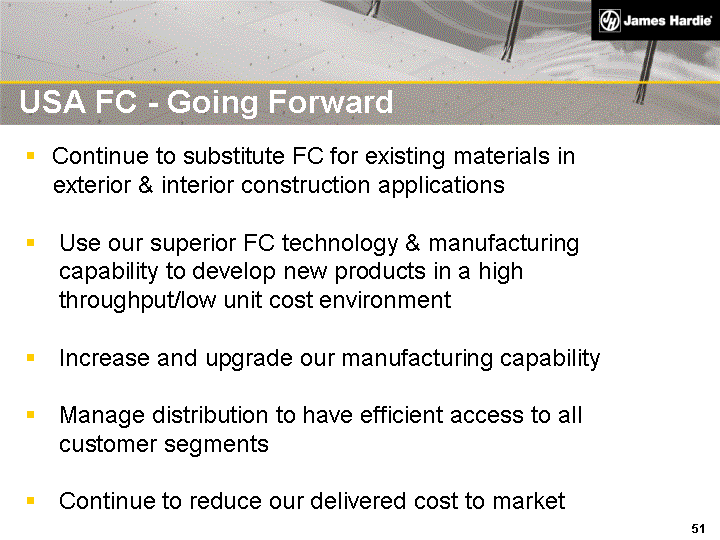
| Continue to substitute FC for existing materials in exterior & interior construction applications Use our superior FC technology & manufacturing capability to develop new products in a high throughput/low unit cost environment Increase and upgrade our manufacturing capability Manage distribution to have efficient access to all customer segments Continue to reduce our delivered cost to market USA FC - Going Forward |
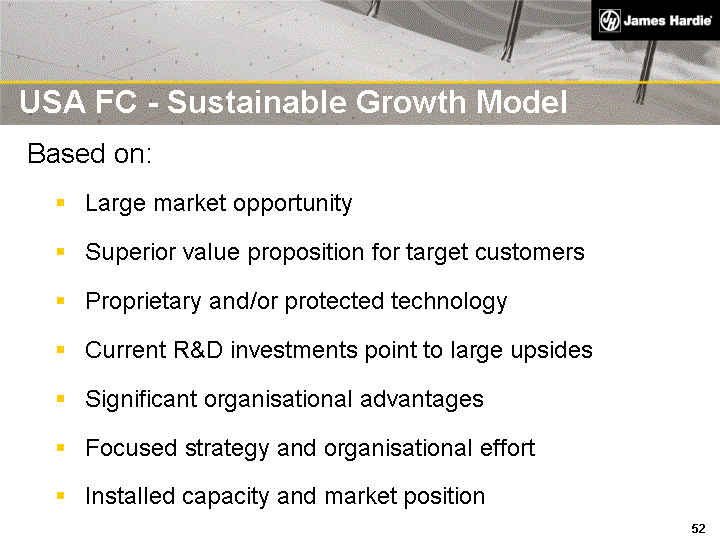
| Based on: Large market opportunity Superior value proposition for target customers Proprietary and/or protected technology Current R&D investments point to large upsides Significant organisational advantages Focused strategy and organisational effort Installed capacity and market position USA FC - Sustainable Growth Model |
| USA FC Q2 FYO5 Operating Review |

| 2nd Quarter Result Net Sales up 21% to US$231.0 million Sales Volume up 18% to 459.7 mmsf1 Average Price up 3% to US$503 per msf1 EBIT1 down 9% to US$49.0 million EBIT Margin1 down 6.9 pts to 21.2% USA FC |

| USA FC Key Points Continued strong demand for fibre cement Further penetration of established and emerging markets Strong sales growth in exterior and interior product markets Growth in differentiated, higher-priced products Operating issues at several plants Higher manufacturing and freight costs Price increase implemented |
| USA FC Plant Performance Issues Ramp up and management issues at Blandon, Pennsylvania; Summerville, South Carolina and Waxahachie, Texas Capacity constrained Increased operating costs - US$8M impact: Freight Labour Maintenance Issues addressed and largely behind us |

| USA FC Q2'05 US$m HY'05 US$m 4.7 8.2 6.2 11.3 4.6 11.6 EBIT/Sales Margin Higher costs Higher raw material prices Freight (capacity constraint related and higher fuel cost impact) SG&A (growth initiatives) Long term band 20-25% |
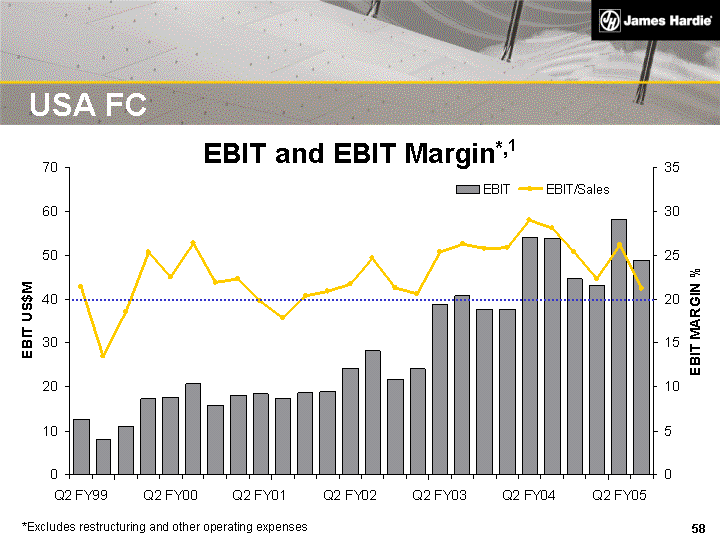
| USA FC *Excludes restructuring and other operating expenses EBIT and EBIT Margin*,1 |

| USA FC Outlook Continued strong demand for fibre cement Housing construction to remain strong over short term Low interest rates New starts, permits and builder confidence at healthy levels Sales growth to continue Further penetration in established and emerging markets and across product range Improved manufacturing performance Declining pulp prices Several plant start-ups in second half |

| Hardie(r) Pipe |

| FRC pipes manufactured in Australia for over 70 years Entered US market in 2000 in Florida, with capacity at Plant City 100,000 tons machine to service the SE region USA Hardie(r) Pipe History 2000 - 2004 |

| USA Hardie(r) Pipe Business Case Position as an RCP equivalent in mid-diameter range between plastic & RCP Installation time and cost savings High throughput/high yield manufacturing Target markets nationally |
| USA Hardie(r) Pipe - Current State The market recognises FRCP value in mid-diameters Full range of 12" to 36" diameters now available Florida penetration curve consistent with our forecasts Manufacturing progress has continued, but targets have still not been met Approaching cash breakeven |
| Artisan Roofing |
| Artisan - History $15M CER approved in 02 Prove scalability of roofing technology Product Design Product Performance Manufacturing capability Market positioning |

| Positioning Wood shake and natural slate substitute Light weight, fire resistant, nailable & walkable Price Equivalent to fire treated wood shake / FC competitors Distribution One step roofing distribution Southern California only Artisan - Market Strategy |
| Overall Company Summary Lower than expected Q2 result Sub-standard US manufacturing performance - issues largely behind us High input costs Ramp-up costs of growth initiatives High corporate costs (SCI related) Remain on track to meet business growth targets |

| Overall Business Outlook Top line growth momentum of first half continuing into 3rd quarter Improved manufacturing performance in North America business Several start-ups planned for the 2nd half Reno Peru XLD Trim Peru ColorPlus Expected operating profit US$135M to US$145M* *Expected operating profit from continuing operations excluding SCI and associated development costs |
| Disclaimer This presentation contains forward-looking statements. We may from time to time make forward-looking statements in our periodic reports filed with the Securities and Exchange Commission on Forms 20-F and 6-K, in our annual reports to shareholders, in offering circulars and prospectuses, in media releases and other written materials and in oral statements made by our officers, directors or employees to analysts, institutional investors, representatives of the media and others. Examples of such forward-looking statements include: projections of our operating results or financial condition; statements of our plans, objectives or goals, including those relating to competition, acquisitions, dispositions and our products; statements about our future economic performance or that of the United States, Australia or other countries in which we operate; and statements about product or environmental liabilities. Words such as "believe," "anticipate," "plan," "expect," "intend," "target," "estimate," "project," "predict," "forecast," "guideline," "should," "aim" and similar expressions are intended to identify forward-looking statements but are not the exclusive means of identifying such statements. Forward-looking statements involve inherent risks and uncertainties. We caution you that a number of important factors could cause actual results to differ materially from the plans, objectives, expectations, estimates and intentions expressed in such forward-looking statements. These factors include but are not limited to: all matters relating to or arising out of the prior manufacture of asbestos by ABN 60 and certain former subsidiaries; competition and product pricing in the markets in which we operate; general economic and market conditions; compliance with and possible changes in environmental and health and safety laws; the successful transition of new senior management; the success of our research and development efforts; the supply and cost of raw materials; our reliance on a small number of product distributors; the consequences of product failures or defects; exposure to environmental, asbestos or other legal proceedings; risks of conducting business internationally; compliance with and changes in tax laws and treatments; and foreign exchange risks. We caution you that the foregoing list of factors is not exclusive and that other risks and uncertainties may cause actual results to differ materially from those in forward-looking statements. Forward-looking statements speak only as of the date they are made. |

| Endnotes This Management Presentation forms part of a package of information about the company's results. It should be read in conjunction with the other parts of this package, including Management's Analysis of Results, a Media Release, a Financial Report and Results at a Glance document. 1Definitions EBIT and EBIT Margin - EBIT is defined as operating income. EBIT margin is defined as EBIT as a percentage of our net sales. We believe EBIT and EBIT margin to be relevant and useful information as these are the primary measures used by our management to measure the operating profit or loss of our business. EBIT is one of several metrics used by our management to measure the cash generated from our operations, excluding interest and income tax expenses. Additionally, EBIT is believed to be a primary measure and terminology used by our Australian investors. EBIT and EBIT margin should be considered in addition to, but not as a substitute for, other measures of financial performance reported in accordance with accounting principles generally accepted in the United States of America. EBIT and EBIT margin, as we have defined them, may not be comparable to similarly titled measures reported by other companies. EBIT and EBIT margin, as used in this document, are equivalent to the US GAAP measures of operating income and operating income margin. EBITDA - is not a measure of financial performance under US GAAP and should not be considered as an alternative to , or more meaningful than, income from operations, net income or cash flows as defined by US GAAP or as a measure of profitability or liquidity. All companies do not calculate EBITDA in the same manner and, accordingly, EBITDA may not be comparable with other companies. We have included information concerning EBITDA because we believe that EBITDA is commonly used by investors to evaluate the ability of a company's earnings from its core business operations to satisfy its debt, capital expenditure and working capital requirements. EBIT and EBIT Margin before restructuring and other operating (expense) income - presentation of EBIT and EBIT Margin before restructuring and other operating (expense )income are not measures of financial performance under US GAAP and should not be considered to be more meaningful than EBIT and EBIT Margin. The Company has included these financial measures to provide investors with an alternative method for assessing the Company's operating results in a manner that is focused on the performance of the Company's ongoing operations. The Company's management uses these non-GAAP measures for the same purposes. Operating profit from continuing operations before income taxes - is equivalent to the US GAAP measure of income from continuing operations before income taxes. Operating profit from continuing operations - is equivalent to the US GAAP measure of income from continuing operations. Net operating profit including discontinued operations - is equivalent to the US GAAP measure of net income. Gearing Ratio -is borrowings less cash (net debt) divided by net debt plus shareholders' equity. mmsf - million square feet msf - thousand square feet |