Exhibit 99.1
Results for Announcement to the Market
James Hardie Industries N.V.
ARBN 097 829 895
| |
|
|
|
|
|
|
|
|
|
|
|
|
|
|
|
|
|
|
|
|
|
|
| |
| |
3rd Quarter Ended 31 December 2004 |
|
|
| |
Key Information |
|
|
Nine Months Ended 31 December |
|
|
| |
|
|
|
2004 |
|
|
|
2003 |
|
|
|
|
|
|
|
|
|
|
|
|
| |
|
|
|
US$M |
|
|
|
US$M |
|
|
|
Movement |
|
|
| |
Net Sales From Ordinary Activities |
|
|
|
894.0 |
|
|
|
|
730.6 |
|
|
|
up |
|
|
|
22 |
% |
|
| |
Operating Profit From Continuing Operations After Tax
Attributable to Shareholders |
|
|
|
81.6 |
|
|
|
|
94.0 |
|
|
|
down |
|
|
|
13 |
% |
|
| |
Operating Profit including Discontinued Operations
Attributable to Shareholders |
|
|
|
80.6 |
|
|
|
|
97.6 |
|
|
|
down |
|
|
|
17 |
% |
|
| |
Net Tangible Assets per Ordinary Share |
|
|
US$ |
1.26 |
|
|
|
US$ |
1.00 |
|
|
|
up |
|
|
|
26 |
% |
|
| |
Dividend Information
Given that the NSW Government Review of Legal and Administrative Costs in Dust Diseases
Compensation Claims will not be finalised until
late February/early March, the outcome of which impinges upon the estimate of future funding
required for legitimate asbestos diseases
claims against former subsidiary companies, the Board has decided it would be inappropriate
to declare an interim dividend at this time.
Details of the dividend declared for 2004-05 will be included with the 31 March 2005 year end
results scheduled to be announced on 11 May
2005. Dividends were paid 16 December 2003 of US2.5 cents per share/CUFS and 1 July 2004 of
US3 cents per share/CUFS.
Movements in Controlled Entities
The following entities were merged into James Hardie Building Products,
Inc. during the nine months ended 31 December 2004: Wallace O’Connor, LLC (30
April 2004); James Hardie Trading Co. Inc. (19 April 2004); Wallace O’Connor
Inc. (2 April 2004). James Hardie Building Products, Inc. is a wholly owned
subsidiary of James Hardie Industries N.V. and is incorporated in the USA.
The following entities were liquidated during the nine months ended 31 December
2004: RCI Malta Holdings Ltd. (14 August 2004); RCI Malta Investments Ltd. (14
August 2004).
Results for the 3rd Quarter and nine months ended 31 December 2004
Contents
1. Media Release
2. Results At A Glance
3. Management’s Analysis of Results
4. Consolidated Financial Statements
5. Management Presentation
The consolidated Financial Statements included in this results
announcement have been prepared using USGAAP and have not been subject to an
independent review by external auditors.
The information contained in the above documents should be read in conjunction
with the James Hardie 2004 Annual Report. It should also be read in the context
of the public announcements made by James Hardie Industries N.V. in accordance
with the continuous disclosure obligations arising under the Corporations Act
2001 and the ASX Listing Rules since the release of that Annual Report. The
James Hardie 2004 Annual Report and links to the company’s public announcements
can be found on the company website at www.jameshardie.com. James Hardie
Industries N.V. is incorporated in The Netherlands with corporate seat in
Amsterdam. The liability of members is limited.

| |
|
|
|
|
|
|
|
|
Analyst and Media enquiries about |
|
|
|
|
results, please contact Steve Ashe on |
14 February 2005
|
|
|
|
Tel: 61 2 8274 5246 |
|
|
|
|
Mob: 0408 164 011 |
Strong top-line growth
Bottom line lower due to SCI related costs
James Hardie today announced a 21% increase in revenue and an operating profit from continuing
operations of US$19.8 million for the three months ended 31 December 2004.
Despite strong top-line growth, earnings for the quarter were 30% lower than the same period last
year due to significant costs related to the NSW Government Special Commission of Inquiry into the
Medical Research and Compensation Foundation (SCI) and associated developments. Excluding these
costs, the 3rd quarter operating profit from continuing operations was 11% higher, at US$31.5
million1.
Gross profit was up 11% and EBIT (excluding SCI and associated developments costs) was up 19% to
US$49.2 million1 for the quarter.
The USA Fibre Cement business was the standout performer for the quarter, lifting net sales 26% and
EBIT 17% compared to the same period a year ago. In Asia Pacific Fibre Cement, net sales increased
4% due to favourable foreign currency movements, and EBIT fell 10% due to a softer Australian
housing market, higher raw material prices and the impact of product bans and boycotts in
Australia.
The 3rd quarter result lifted operating profit from continuing operations for the nine
months ended 31 December 2004 to US$81.6 million, but this is 13% lower than the same period last
year mainly due to costs related to the SCI and associated developments. Excluding these costs,
operating profit from continuing operations was up 8% to US$101.9 million1. EBIT from
USA Fibre Cement and Asia Pacific Fibre Cement segments were up 8% and 18% respectively for the
nine months.
Diluted earnings per share from continuing operations decreased from US 6.1 cents to US 4.3 cents
for the 3rd quarter and from US 20.4 cents to US 17.7 cents for the nine months.
The 3rd quarter and nine months net operating profit including discontinued operations
includes additional costs related to business and property sales disposed of in prior periods.
3rdQuarter and Year-To-Date at a Glance
| |
|
|
|
|
|
|
|
|
|
|
|
|
|
|
|
|
|
|
|
|
|
|
|
|
| |
| US$ Million |
|
Q3FY05 |
|
|
Q3FY04 |
|
|
%+ (-) |
|
|
YTDFY05 |
|
|
YTDFY04 |
|
|
%+ (-) |
|
Net Sales |
|
$ |
287.0 |
|
|
$ |
237.5 |
|
|
|
21 |
|
|
$ |
894.0 |
|
|
$ |
730.6 |
|
|
|
22 |
|
Gross Profit |
|
|
96.7 |
|
|
|
87.5 |
|
|
|
11 |
|
|
|
305.1 |
|
|
|
269.2 |
|
|
|
13 |
|
Special Commission of Inquiry related expenses |
|
|
(15.9 |
) |
|
|
— |
|
|
|
— |
|
|
|
(24.4 |
) |
|
|
— |
|
|
|
— |
|
EBIT1 |
|
|
33.3 |
|
|
|
41.2 |
|
|
|
(19 |
) |
|
|
131.6 |
|
|
|
137.4 |
|
|
|
(4 |
) |
Net Interest Expense |
|
|
(0.7 |
) |
|
|
(2.8 |
) |
|
|
(75 |
) |
|
|
(4.5 |
) |
|
|
(7.5 |
) |
|
|
(40 |
) |
Income Tax Expense |
|
|
(13.2 |
) |
|
|
(10.0 |
) |
|
|
32 |
|
|
|
(44.0 |
) |
|
|
(32.5 |
) |
|
|
35 |
|
Operating Profit from continuing operations1 |
|
|
19.8 |
|
|
|
28.3 |
|
|
|
(30 |
) |
|
|
81.6 |
|
|
|
94.0 |
|
|
|
(13 |
) |
Net Operating Profit including discontinued
operations1 |
|
|
19.5 |
|
|
|
30.1 |
|
|
|
(35 |
) |
|
|
80.6 |
|
|
|
97.6 |
|
|
|
(17 |
) |
| |
Unless otherwise
stated, results are for continuing operations only and comparisons are of the 3rdquarter of the current fiscal year versus the 3rdquarter of the prior fiscal year
Note:Please refer to Definitions for explanation of certain financial terms used within this document.
Commentary
James Hardie CEO, Louis Gries, said: “The 3rd quarter results reflect a continuation of
the growth momentum evident in the first half and a return to normal operating performance for our
US plants.
“Early indications are that the growth momentum of the first nine months is continuing into the
4th quarter and a solid and satisfactory full year operational result is in prospect.
“The bottom line for the quarter was again affected by costs related to the SCI and other
associated matters, including our involvement in preparing the landmark Heads of Agreement with the
NSW Government, Unions NSW and asbestos representative groups, which was signed by all parties in
December.
“We expect that the Heads of Agreement will lead to a long-term funding proposal for asbestos
compensation being put to shareholders around the middle of this year, but there are still a number
of steps to complete – and this means more costs are expected to be incurred,” Mr Gries said.
USA Fibre Cement – Continued Strong Top-Line Growth
Net sales increased 26% to US$220.3 million in the 3rd quarter due to a 21% increase in
sales volumes to 432.4 million square feet and a 4% increase in the average net sales price to
US$509 per thousand square feet.
Strong demand for fibre cement continued and market share increased in the exterior and interior
product categories and in both our emerging and established markets.
The increase in average sales price reflects a price increase on some products implemented on 1
July 2004 and sales of higher-priced, differentiated products representing an increased proportion
of total sales. A further price increase for certain products became effective on 1 January 2005.
Plant manufacturing performance returned to acceptable levels during the quarter.
Strong top-line growth more than offset increased raw material and freight costs and spending on
ramping-up growth initiatives, and helped lift EBIT 17% to US$52.3 million for the quarter. The
EBIT margin improved over the 2nd quarter to 23.7%.
For the nine months, net sales are up 25% and EBIT increased 8% to US$164.4 million. The EBIT
margin was lower for the nine months, at 23.8%.
Australia and New Zealand (ANZ) Fibre Cement
Net sales increased 2% to US$51.8 million due to favourable foreign currency movements. Sales
volumes were down 6% to 68.2 million square feet reflecting a softer Australian housing market and
the impact of product bans and boycotts in Australia. Housing activity in New Zealand was flat
compared to the 3rd quarter last year.
ANZ EBIT fell 15% to US$9.1 million for the quarter due to lower sales and higher raw material
prices, but was up 13% for the nine months at US$31.2 million. The EBIT margin decreased to 17.6%
for the quarter but was also up for the nine months at 19.6%.
Philippines – Positive EBIT1
The Philippines recorded an increased positive EBIT in both the quarter and for the nine months due
to higher sales and manufacturing cost savings.
Media Release: James
Hardie – 3rd Quarter and Nine Months Results FY05
2
Chile – Small Positive EBIT1
The business recorded a small positive EBIT for the quarter and nine months as it continued to
penetrate the domestic flat sheet market.
USA Hardie Pipe – Sales Growth and More Manufacturing Efficiencies
Strong volume growth and higher prices resulted in a significant lift in 3rd quarter net
sales. However, as expected, the business incurred an EBIT1 loss for the quarter and
for the nine months, albeit considerably lower than for the same periods last year due to a
stronger sales performance and the achievement of further manufacturing efficiency gains in the
3rd quarter and nine months.
Europe Fibre Cement
Net sales for the quarter were up again as awareness of our backer and siding products increased
among distributors, builders and contractors following the launch of these products in the UK and
French markets in the first quarter last year.
Artisan™ Roofing
Commercial sales of our new generation of fibre cement roofing products were made during the
quarter. The business continues to focus on market development and manufacturing cost savings
initiatives.
Heads of Agreement – voluntary asbestos compensation funding arrangement
On 21 December 2004, the company announced that it had entered into a non-binding Heads of
Agreement with the NSW Government, The Australian Council of Trade Unions, Unions NSW and various
groups representing asbestos claimants which is expected to form the basis of a proposed binding
agreement (the “Principal Agreement”) to establish and fund a special purpose fund to provide
funding on a long-term basis for asbestos claims against Amaba and Amaca (former James Hardie
subsidiaries). The company is currently in negotiations related to the Principal Agreement.
The principles set out in the Heads of Agreement on which the company and/or member(s) of the Group
would provide funding include:
| - |
the establishment of a special purpose fund (“SPF”) to compensate asbestos victims; |
| |
| - |
initial funding of the SPF by the company on the basis of the November 2004 KPMG Actuaries’
report (which provided a net present value of A$1.5 billion in present and future claims at 30
June 2004). The actuarial assessment is to be updated annually; |
| |
| - |
a two year rolling cash buffer in the SPF and an annual contribution in advance based on
actuarial assessments of expected claims for the next three years, revised annually; |
| |
| - |
a cap on the annual payments made by the company to the SPF, initially set at 35% of annual
net operating cash flow (defined as cash from operations in accordance with US GAAP) of the
company for the immediately preceding year, with provisions for the percentage to decline over
time depending upon the company’s financial performance and claims outlook; and |
| |
| - |
no cap on individual payments to claimants. |
The Heads of Agreement is expected to form the basis of a Principal Agreement to be settled between
the company and the NSW Government which, in turn, will require the support of the company’s
lenders and shareholders. The Principal Agreement will be a legally binding agreement.
Media Release: James
Hardie – 3rd Quarter and Nine Months Results FY05
3
The Principal Agreement will be subject to a number of conditions precedent, including the
approval of the company’s shareholders and lenders and the adoption by the NSW Government of
reforms following a review, announced on 18 November 2004, of legal and administrative costs in
dust diseases compensation. A copy of the company’s announcement made on that date welcoming the
development can be downloaded at www.irjameshardie.com.au.
The parties have announced their intention to execute the Principal Agreement by the end of March
2005, depending on the timing of the NSW Government review, and for the binding agreement to
commence around the middle of 2005.
As part of the discussions surrounding the Principal Agreement the company is examining all
relevant options in relation to the establishment of the special purpose fund referred to above,
including the possibility of reacquiring all of the share capital of Amaba, Amaba and/or ABN 60.
The Heads of Agreement contains an agreement from the NSW Government to provide releases to the
James Hardie group and to its directors, officers and employees from all civil liabilities other
than the liabilities of James Hardie to be set out in the Principal Agreement. These releases may
well take the form of legislation passed by the NSW Parliament. The precise form of the releases
remain to be settled.
If an agreement is reached with the NSW Government and approved by the company’s lenders and
shareholders, the company may be required to make a substantial provision in its accounts at a
later date, and it is possible that the company may need to seek additional borrowing facilities.
Additionally, it is possible that any future resolution of this issue may result in the company
having negative shareholders’ equity, which may restrict its ability to pay dividends to its
shareholders. If the terms of a future resolution involve James Hardie making payments, either on
an annual or other basis, pursuant to a statutory scheme or other form of arrangement, James
Hardie’s financial position, results of operations and cash flows could be materially adversely
affected.
As noted above, the NSW Government is conducting a review of legal and administrative costs in dust
diseases compensation in NSW. The intention of this review is primarily to determine ways to
reduce legal and administrative costs, and to consider the current processes for handling and
resolving dust diseases compensation claims. The review is expected to report to the NSW
Government in March 2005. The company is unable to predict the outcome of this review.
Accordingly, the company has not established a provision for asbestos-related liabilities as of 31
December 2004 because at this time it is neither probable nor estimable.
Readers are referred to note 8 of the company’s financial statements for further information on the
SCI and associated developments.
Outlook
In North America, indicators of future housing construction activity remain positive with unused
building permits, builder confidence and positive trends in employment and household income
suggesting a continuation of buoyant conditions.
Interest rates remain low and anticipated increases for the year are expected to have a modest
impact only on demand for new housing. The US-based National Association of Home Builders is
expecting a decline of 3-4% in housing starts for the 2005 calendar year, off near record levels in
2004.
Further strong top-line growth is expected as we continue to grow primary demand for fibre cement
and win share from alternative materials in our emerging and established markets. Raw material and
freight costs are expected to remain high over the short term.
Media Release: James
Hardie – 3rd Quarter and Nine Months Results FY05
4
In the ANZ business, a drop in building approvals in Australia over recent months suggests a
further softening in new housing and renovations activity over the short term. In New Zealand,
housing construction activity is expected to remain at previously high levels. Demand and
profitability for the ANZ business may continue to be adversely affected by product bans and
boycotts.
In the Philippines, increased domestic demand is expected as we move into the seasonally stronger
building months. Further market share gains are expected as the plywood industry continues to slow
down due to raw material supply issues.
In our emerging Chile Fibre Cement, Europe Fibre Cement and US Hardie Pipe businesses, further
sales growth and market share are expected as awareness of their products increases among builders,
contractors and distributors.
The company is continuing to incur costs associated with SCI related developments including:
preparation and negotiation of a Principal Agreement with the NSW Government to provide long-term
funding of asbestos related claims for proven Australian personal injury claimants against former
Australian James Hardie subsidiary companies; participation in the NSW Government’s Review; and in
co-operating with the Australian Securities and Investments Commission’s investigation into the
circumstances surrounding the establishment of the MRCF. These costs are likely to be material
over the short term.
Strong sales growth in North America is continuing into the 4th quarter and there is
good prospect for satisfactory full year operating results for the company. Further costs related
to the SCI and associated developments are expected to continue to have an adverse impact on
reported earnings.
Excluding SCI and related developments costs, operating profit from continuing operations for the
year ending 31 March 2005 is expected to fall within the range of US$135 million to US$145 million.
Ends.
Media/Analyst Enquiries:
Steve Ashe
Vice President Investor Relations
Telephone: 61 2 8274 5246
Mobile: 0408 164 011
Email: [email protected]
Facsimile: 61 2 8274 5218
The release and the accompanying management’s analysis of results and management presentation,
along with the audio webcast of the presentation, are available from the Investor Relations section
of the company website at www.jameshardie.com
This media release forms part of a package of information about the company’s results. It should be
read in conjunction with the other parts of this package, including Management’s Analysis of
Results, a Management Presentation, a Financial Report and a Results at a Glance document.
Media Release: James
Hardie –
3rd Quarter and Nine Months Results FY05
5
1Definitions
EBIT and EBIT Margin - EBIT is defined as operating income. EBIT margin is defined as
EBIT as a percentage of our net sales. We believe EBIT and EBIT margin to be relevant and useful
information as these are the primary measures used by our management to measure the operating
profit or loss of our business. EBIT is one of several metrics used by our management to measure
the earnings generated by our operations, excluding interest and income tax expenses. Additionally,
EBIT is believed to be a primary measure and terminology used by our Australian investors. EBIT
and EBIT margin should be considered in addition to, but not as a substitute for, other measures of
financial performance reported in accordance with accounting principles generally accepted in the
United States of America. EBIT and EBIT margin, as we have defined them, may not be comparable to
similarly titled measures reported by other companies.
EBIT and EBIT margin, as used in this document, are equivalent to the US GAAP measures of operating
income and operating income margin.
EBIT excluding SCI and associated developments costs - is not a measure of financial
performance under US GAAP and should not be considered to be more meaningful than EBIT. The
company has included this financial measure to provide investors with an alternative method for
assessing the company’s operating results in a manner that is focused on the performance of the
company’s ongoing operations. The company’s management uses this non-GAAP measure for the same
purposes.
Operating profit from continuing operations excluding costs related to the SCI and associated
developments - is not a measure of financial performance under US GAAP and should not be
considered to be more meaningful than operating profit. The company has included this financial
measure to provide investors with an alternative method for assessing the company’s operating
results in a manner that is focused on the performance of the company’s ongoing operations. The
company’s management uses this non-GAAP measure for the same purposes.
Operating profit from continuing operations - is equivalent to the US GAAP measure of
income from continuing operations.
Net operating profit including discontinued operations - is equivalent to the US GAAP
measure of net income.
Disclaimer
This Media Release contains forward-looking statements. We may from time to time make
forward-looking statements in our periodic reports filed with the Securities and Exchange
Commission on Forms 20-F and 6-K, in our annual reports to shareholders, in offering circulars and
prospectuses, in media releases and other written materials and in oral statements made by our
officers, directors or employees to analysts, institutional investors, representatives of the media
and others. Examples of such forward-looking statements include:
| |
• |
projections of our operating results or financial condition; |
| |
| |
• |
statements of our plans, objectives or goals, including those relating to
competition, acquisitions, dispositions and our products; |
| |
| |
• |
statements about our future economic performance or that of the United States,
Australia or other countries in which we operate; and |
| |
| |
• |
statements about product or environmental liabilities. |
Words such as “believe,” “anticipate,” “plan,” “expect,” “intend,” “target,” “estimate,” “project,”
“predict,” “forecast,” “guideline,” “should,” “aim” and similar expressions are intended to
identify forward-looking statements but are not the exclusive means of identifying such statements.
Forward-looking statements involve inherent risks and uncertainties. We caution you that a number
of important factors could cause actual results to differ materially from the plans, objectives,
expectations, estimates and intentions expressed in such forward-looking statements. These factors
include but are not limited to: all matters relating to or arising out of the prior manufacture of
asbestos by ABN 60 and certain former subsidiaries; competition and product pricing in the markets
in which we operate; general economic and market conditions; compliance with and possible changes
in environmental and health and safety laws; the successful transition of new senior management;
the success of our research and development efforts; the supply and cost of raw materials; our
reliance on a small number of product distributors; the consequences of product failures or
defects; exposure to environmental, asbestos or other legal proceedings; risks of conducting
business internationally; compliance with and changes in tax laws and treatments; and foreign
exchange risks. We caution you that the foregoing list of factors is not exclusive and that other
risks and uncertainties may cause actual results to differ materially from those in forward-looking
statements. Forward-looking statements speak only as of the date they are made.
Media Release: James
Hardie
– 3rd
Quarter and Nine Months Results FY05
6

3rd Quarter and Year To Date – 31 December 2004
| |
|
|
|
|
|
|
|
|
|
|
|
|
|
|
|
|
|
|
|
|
|
|
|
|
| |
|
3rd QTR FY05 |
|
|
YTD FY05 |
|
James Hardie |
|
|
|
|
|
|
|
|
|
|
|
|
|
|
|
|
|
|
|
|
|
|
|
|
|
|
|
|
|
|
|
|
|
|
|
|
|
|
|
|
|
|
|
|
|
|
|
|
|
Net Sales |
|
Up |
|
|
21 |
% |
|
to |
|
US$ |
287.0 |
|
|
Up |
|
|
22 |
% |
|
to |
|
US$ |
894.0 |
|
EBIT1 |
|
Down |
|
|
19 |
% |
|
to |
|
US$ |
33.3 |
|
|
Down |
|
|
4 |
% |
|
to |
|
US$ |
131.6 |
|
Operating Profit from
Continuing
Operations1 |
|
Down |
|
|
30 |
% |
|
to |
|
US$ |
19.8 |
|
|
Down |
|
|
13 |
% |
|
to |
|
US$ |
81.6 |
|
Net Operating Profit
Including Discontinued
Operations1 |
|
Down |
|
|
35 |
% |
|
to |
|
US$ |
19.5 |
|
|
Down |
|
|
17 |
% |
|
to |
|
US$ |
80.6 |
|
EBIT Margin1 |
|
Down |
|
5.7pts |
|
to |
|
|
11.6 |
% |
|
Down |
|
4.1pts |
|
to |
|
|
14.7 |
% |
|
|
|
|
|
|
|
|
|
|
|
|
|
|
|
|
|
|
|
|
|
|
|
|
|
USA Fibre Cement |
|
|
|
|
|
|
|
|
|
|
|
|
|
|
|
|
|
|
|
|
|
|
|
|
|
|
|
|
|
|
|
|
|
|
|
|
|
|
|
|
|
|
|
|
|
|
|
|
|
Net Sales |
|
Up |
|
|
26 |
% |
|
to |
|
US$ |
220.3 |
|
|
Up |
|
|
25 |
% |
|
to |
|
US$ |
692.0 |
|
EBIT1 |
|
Up |
|
|
17 |
% |
|
to |
|
US$ |
52.3 |
|
|
Up |
|
|
8 |
% |
|
to |
|
US$ |
164.4 |
|
EBIT Margin1 |
|
Down |
|
1.7pts |
|
to |
|
|
23.7 |
% |
|
Down |
|
3.7pts |
|
to |
|
|
23.8 |
% |
Volume |
|
Up |
|
|
21 |
% |
|
to |
|
432.4 mmsf1 |
|
Up |
|
|
22 |
% |
|
to |
|
1382.5 mmsf1 |
|
|
|
|
|
|
|
|
|
|
|
|
|
|
|
|
|
|
|
|
|
|
|
|
|
Asia Pacific Fibre Cement |
|
|
|
|
|
|
|
|
|
|
|
|
|
|
|
|
|
|
|
|
|
|
|
|
|
|
|
|
|
|
|
|
|
|
|
|
|
|
|
|
|
|
|
|
|
|
|
|
|
Net Sales |
|
Up |
|
|
4 |
% |
|
to |
|
US$ |
58.1 |
|
|
Up |
|
|
11 |
% |
|
to |
|
US$ |
177.9 |
|
EBIT1 |
|
Down |
|
|
10 |
% |
|
to |
|
US$ |
10.2 |
|
|
Up |
|
|
18 |
% |
|
to |
|
US$ |
34.5 |
|
EBIT Margin1 |
|
Down |
|
2.6pts |
|
to |
|
|
17.6 |
% |
|
Up |
|
1.2pts |
|
to |
|
|
19.4 |
% |
Volume |
|
Down |
|
|
2 |
% |
|
to |
|
90.6 mmsf1 |
|
Up |
|
|
5 |
% |
|
to |
|
287.4 mmsf1 |
|
|
|
|
|
|
|
|
|
|
|
|
|
|
|
|
|
|
|
|
|
|
|
|
|
Key Ratios |
|
|
|
|
|
|
|
|
|
|
|
|
|
|
|
|
|
|
|
|
|
|
|
|
|
|
|
|
|
|
|
|
|
|
|
|
|
|
|
|
|
|
|
|
|
|
|
|
|
| Earnings Per Share (Diluted) |
|
|
|
|
|
17.7 |
cents |
|
|
|
| EBIT Margin1 |
|
|
|
|
|
14.7 |
% |
|
|
|
| Return on Shareholders Funds (Annualised – including discontinued operations) |
|
|
|
|
|
19.8 |
% |
|
|
|
| Return on Capital Employed (Annualised) |
|
|
|
|
|
21.5 |
% |
|
|
|
| Gearing1 |
|
|
|
|
|
13.0 |
% |
|
|
|
| Net Interest Cover (EBIT1 / Net interest expense) |
|
|
|
|
|
29.0 |
x |
|
|
|
All comparisons are against the 3rd quarter or 9 months of the previous fiscal year.
All dollar amounts are in US$ millions. Results are for continuing businesses only unless
otherwise stated. Note: This document should be read in conjunction with other 3rd
quarter and
9 months results materials including a Media Release, a Management’s Discussion and Analysis, a
Management Presentation and a Financial Report.
1Definitions
EBIT and EBIT Margin - EBIT is defined as operating income. EBIT margin is defined as EBIT
as a percentage of our net sales. We believe EBIT and EBIT margin to be relevant and useful
information as these are the primary measures used by our management to measure the operating
profit or loss of our business. EBIT is one of several metrics used by our management to measure
the earnings generated by our operations, excluding interest and income tax expenses. Additionally,
EBIT is believed to be a primary measure and terminology used by our Australian investors. EBIT
and EBIT margin should be considered in addition to, but not as a substitute for, other measures of
financial performance reported in accordance with accounting principles generally accepted in the
United States of America. EBIT and EBIT margin, as we have defined them, may not be comparable to
similarly titled measures reported by other companies.
EBIT and EBIT margin, as used in this document, are equivalent to the US GAAP measures of operating
income and operating income margin.
Operating profit from continuing operations - is equivalent to the US GAAP measure of
income from continuing operations.
Net operating profit including discontinued operations - is equivalent to the US GAAP
measure of net income.
Gearing – Is borrowings less cash (net debt) divided by net debt plus shareholders’ equity.
mmsf – million square feet
msf – thousand square feet

| |
|
|
|
|
14 February 2005
|
|
|
|
Analyst and Media enquiries about |
|
|
|
|
results, please contact Steve Ashe on |
|
|
|
|
Tel: 61 2 8274 5246 Mob: 0408 164 011 |
James Hardie Industries N.V.
Results for the 3rd Quarter Ended 31 December 2004
| |
|
|
|
|
|
|
|
|
|
|
|
|
|
|
|
|
| |
|
|
Three Months Ended 31 December |
|
|
| USGAAP - US$ Millions |
|
|
FY 2005 |
|
|
|
FY 2004 |
|
|
|
% Change |
|
|
Net Sales |
|
|
|
|
|
|
|
|
|
|
|
|
|
|
|
|
USA Fibre Cement |
|
|
$ |
220.3 |
|
|
|
$ |
175.3 |
|
|
|
|
26 |
|
|
Asia Pacific Fibre Cement |
|
|
|
58.1 |
|
|
|
|
55.9 |
|
|
|
|
4 |
|
|
Other Fibre Cement |
|
|
|
8.6 |
|
|
|
|
6.3 |
|
|
|
|
37 |
|
|
| |
|
|
|
|
|
|
|
|
|
|
Total Net Sales |
|
|
|
287.0 |
|
|
|
|
237.5 |
|
|
|
|
21 |
|
|
| |
|
|
|
|
|
|
|
|
|
|
|
|
|
|
|
|
|
|
|
|
|
|
|
|
|
|
|
Net Sales |
|
|
$ |
287.0 |
|
|
|
$ |
237.5 |
|
|
|
|
21 |
|
|
Cost of goods sold |
|
|
|
(190.3 |
) |
|
|
|
(150.0 |
) |
|
|
|
27 |
|
|
Gross profit |
|
|
|
96.7 |
|
|
|
|
87.5 |
|
|
|
|
11 |
|
|
Selling general and administrative expenses |
|
|
|
(41.5 |
) |
|
|
|
(40.6 |
) |
|
|
|
2 |
|
|
Research and development expenses |
|
|
|
(6.1 |
) |
|
|
|
(5.7 |
) |
|
|
|
7 |
|
|
Special Commission of Inquiry related expenses |
|
|
|
(15.9 |
) |
|
|
|
— |
|
|
|
|
— |
|
|
Other operating expenses |
|
|
|
0.1 |
|
|
|
|
— |
|
|
|
|
— |
|
|
EBIT 1 |
|
|
|
33.3 |
|
|
|
|
41.2 |
|
|
|
|
(19 |
) |
|
Net interest expense |
|
|
|
(0.7 |
) |
|
|
|
(2.8 |
) |
|
|
|
(75 |
) |
|
Other income (expenses), net |
|
|
|
0.4 |
|
|
|
|
(0.1 |
) |
|
|
|
— |
|
|
Operating profit from continuing operations before income taxes
1 |
|
|
|
33.0 |
|
|
|
|
38.3 |
|
|
|
|
(14 |
) |
|
Income tax expense |
|
|
|
(13.2 |
) |
|
|
|
(10.0 |
) |
|
|
|
32 |
|
|
Operating Profit From Continuing Operations 1 |
|
|
$ |
19.8 |
|
|
|
$ |
28.3 |
|
|
|
|
(30 |
) |
|
| |
|
|
|
|
|
|
|
|
|
|
|
|
|
|
|
|
|
|
|
|
|
|
|
|
|
|
|
Net Operating Profit Including Discontinued Operations 1 |
|
|
$ |
19.5 |
|
|
|
$ |
30.1 |
|
|
|
|
(35 |
) |
|
| |
|
|
|
|
|
|
|
|
|
|
Tax rate |
|
|
|
40.0 |
% |
|
|
|
26.1 |
% |
|
|
|
|
|
|
|
|
|
|
|
|
|
|
|
|
|
|
|
|
|
|
|
Volume (mmsf1) |
|
|
|
|
|
|
|
|
|
|
|
|
|
|
|
|
USA Fibre Cement |
|
|
|
432.4 |
|
|
|
|
358.3 |
|
|
|
|
21 |
|
|
Asia Pacific Fibre Cement* |
|
|
|
90.6 |
|
|
|
|
92.1 |
|
|
|
|
(2 |
) |
|
|
|
|
|
|
|
|
|
|
|
|
|
|
|
|
|
|
Average net sales price per unit (per msf1) |
|
|
|
|
|
|
|
|
|
|
|
|
|
|
|
|
USA Fibre Cement |
|
|
US$ |
509 |
|
|
|
US$ |
489 |
|
|
|
|
4 |
|
|
Asia Pacific Fibre Cement* |
|
|
A$ |
851 |
|
|
|
A$ |
854 |
|
|
|
|
— |
|
|
Unless otherwise stated, results are for continuing operations only and comparisons are of the 3rd quarter of the current fiscal year versus the 3rd quarter
of the prior fiscal year.
Total Net Sales
Total net sales increased 21% compared to the same quarter of the previous year, from US$237.5
million to US$287.0 million.
Net sales from USA Fibre Cement increased 26% from US$175.3 million to US$220.3 million due to
continued strong growth in sales volumes and a higher average net sales price.
Net sales from Asia Pacific Fibre Cement increased 4% from US$55.9 million to US$58.1 million due
to favourable foreign currency movements.
Net sales from Other Fibre Cement increased 37% from US$6.3 million to US$8.6 million as the
Chilean flat sheet business, the US-based Hardie Pipe business and European Fibre Cement business
continued to grow.
USA Fibre Cement
Net sales increased 26% from US$175.3 million to US$220.3 million due to increased sales volumes
and a higher average net sales price.
Sales volume increased 21% from 358.3 million square feet to 432.4 million square feet, primarily
due to growth in primary demand for fibre cement, continued market penetration, a favourable
housing construction market and the impact of delayed sales for some products due to supply issues
in the second quarter.
The residential housing market remained healthy during the quarter, buoyed by low interest rates,
improving consumer confidence and strong house prices.
Volume growth was evident across all major markets. Market share increased in the exterior and
interior product categories and in both our emerging and established markets.
In our exterior products market, we continued to grow sales of higher priced, differentiated
products such as vented soffits, Heritageâ panels, the ColorPlus® Collection of pre-painted
siding and Harditrim® XLD® Planks. In our emerging markets, the business remains focussed on its
strategy to move sales of its exterior products to 100% pre-painted over the medium to longer-term.
In our interior product market, further market share gains were achieved, with sales of Hardibacker
500â half-inch backerboard growing strongly compared to the same period last year.
The average net sales price increased 4% from US$489 per thousand square feet to US$509 per
thousand square feet. The increase was due to a price increase for some products that became
effective on 1 July 2004 and proportionally stronger growth of differentiated, higher-priced
products.
During the quarter, we continued construction of our new green-field fibre cement plant in Reno,
Nevada. Product was successfully being produced from the new plant by quarter-end and full
commissioning of the plant is expected in the fourth quarter. Construction of our new 160 million
square foot trim line in Peru, Illinois, continued during the quarter.
Asia Pacific Fibre Cement (See Endnotes)
Net sales increased 4% from US$55.9 million to US$58.1 million. Net sales decreased 2% in
Australian dollars. Sales volume decreased 2% from 92.1 million square feet to 90.6 million square
feet.
| |
|
|
James Hardie 3rd Quarter FY05 Management’s Analysis of Results
|
|
2 |
Australia and New Zealand Fibre Cement
Net sales increased 2% from US$50.7 million to US$51.8 million due to favourable foreign currency
movements and a higher average net sales price, partly offset by lower sales volumes. In
Australian dollars, net sales decreased 4%.
Sales volumes decreased 6% from 72.4 million square feet to 68.2 million square feet due to weaker
market conditions and the impact of product bans and boycotts in Australia.
In Australia, the slow-down in both new residential housing and renovations activity continued
during the quarter with the impact being particularly prevalent in New South Wales and Victoria.
The Queensland market continued to perform reasonably well.
In New Zealand, new residential housing construction was flat compared to the same period last
year. Demand for weatherboards, eaves and soffits remained strong. Our Lineaâ range of
weatherboards continues to grow in popularity with builders and consumers in New Zealand resulting
in further strong demand for Lineaâ during the quarter.
The average net sales price increased 2% in Australian dollars due mainly to favourable foreign
currency movements between the New Zealand and Australian dollars.
Philippines Fibre Cement
Net sales increased 21% from US$5.2 million to US$6.3 million due to increased sales volumes and a
higher average net sales price. In local currency, net sales increased 24%.
Despite an unusually wet end to the seasonally-slower season, sales volumes increased 14% from 19.8
million square feet to 22.5 million square feet due to increased domestic and export market
penetration.
The average net sales price increased 9% compared to the same period last year due mainly to higher
domestic prices.
Other Fibre Cement
Chile Fibre Cement
The business continued to build awareness of its products among builders, distributors and
contractors, and to penetrate its target markets.
Net sales increased compared to the same quarter last year due to growth in sales volume and a
higher average net sales price. The increase in average net sales price was due to higher domestic
prices, partly offset by lower export prices due to the impact of a weaker US dollar on export
sales.
Hardie Pipe
Our US Hardie Pipe business continued to penetrate the Florida market of the United States and grow
sales strongly. Increased sales volumes and higher prices resulted in net sales for the quarter
being significantly higher compared to the same quarter last year.
The heavy building materials industry in Florida continued to be strong.
The average net sales price continued to increase this quarter reflecting favourable market
conditions and improved customer focus by the business.
| |
|
|
James Hardie 3rd Quarter FY05 Management’s Analysis of Results
|
|
3 |
Further gains were achieved in the manufacturing performance of the plant during the quarter, but
operating costs are still above our targets.
Europe Fibre Cement
Our European business continued to grow sales as it expanded distribution channels in the UK and
French markets and acquired new customers.
During the quarter, there was strong growth in siding sales in the French market as a result of
obtaining product approvals, and from sales and marketing initiatives.
Sales are continuing to build since commencement of operations in the first quarter of the previous
fiscal year. Net sales this quarter increased significantly compared to the same quarter last
year, albeit off a low base.
Artisan™ roofing
In June 2003, we began to commission and trial our pilot roofing plant in Fontana, California. The
pilot plant, which has a design capacity of 25 million square feet, was built to test our
proprietary manufacturing technology and to provide product for market testing in Southern
California.
The business is continuing to prove its business model and remains focussed on market testing,
refining the manufacturing operation and improving productivity.
Gross Profit
Gross profit increased 11% from US$87.5 million to US$96.7 million due mainly to a strong
improvement in our USA Fibre Cement, partly offset by a decline in the gross profit performance of
our Asia Pacific Fibre Cement business. The gross profit margin decreased 3.1 percentage points to
33.7%.
USA Fibre Cement gross profit increased 13% compared to the same quarter last year due to increased
net sales, partly offset by higher unit cost of sales and unit freight costs. The higher unit cost
of sales resulted primarily from increased sales of higher-priced, differentiated products, higher
raw material prices and ramp-up costs associated with planned growth initiatives. Higher freight
costs were primarily related to an increase in length of haul and fuel surcharges. The gross profit
margin decreased 4.0 percentage points.
Asia Pacific Fibre Cement gross profit decreased 4% following a 7% decline in Australia and New
Zealand Fibre Cement gross profit, partly offset by a 46% increase in Philippines Fibre Cement
gross profit. The decline in Australia and New Zealand was due to a decrease in net sales and
increased costs associated with higher raw material prices and restructuring costs connected with
the move from a seven to five day work-week at our Carol Park, Queensland plant. In the
Philippines, increased net sales, cost savings and improved manufacturing efficiencies accounted
for the stronger gross profit performance. The Asia Pacific Fibre Cement gross profit margin
decreased 2.7 percentage points.
Selling, General and Administrative (SG&A) Expenses
SG&A expenses increased 2% compared to the same quarter last year, from US$40.6 million to US$41.5
million. The increase in SG&A expenses was due mainly to increased spending on sales and marketing
in Asia Pacific Fibre Cement. As a percentage of sales, SG&A expenses were 2.6 percentage points
lower at 14.5%.
| |
|
|
James Hardie 3rd Quarter FY05 Management’s Analysis of Results
|
|
4 |
Research and Development Expenses
Research and development expenses include costs associated with “core” research projects that are
designed to benefit all fibre cement business units. These costs are recorded in the Research and
Development segment rather than being attributed to individual business units. These costs
decreased 14% for the quarter to US$3.1 million.
Other research and development costs associated with commercialisation projects in business units
are included in the business related unit segment results. In total, these costs increased 43% to
US$3.0 million.
Special Commission of Inquiry Related Expenses
Costs incurred during the quarter associated with the NSW Government Special Commission of Inquiry
into the Medical Research and Compensation Foundation (MRCF) and associated developments total
US$15.9 million and include: US$3.3 million related to the internal investigation conducted by
independent legal advisers, consistent with US Securities regulations, of allegations of illegal
conduct raised during the SCI and any potential impacts on the financial statements; US$1.0 million
related to the Australian Securities and Investments Commission investigation into the
circumstances surrounding the creation of the MRCF; US$3.8 million for resolution advisory
services; US$6.0 million in severance payments to former executives; and US$1.8 million for other
matters.
EBIT1
EBIT1 decreased 19% from US$41.2 million to US$33.3 million. The EBIT
margin1 decreased 5.7 percentage points to 11.6%. Excluding costs associated with the
NSW Special Commission of Inquiry into the Medical Research and Compensation Foundation and other
related developments, EBIT increased 19%1 compared to the same quarter last year and the
EBIT margin was 17.1%1.
USA Fibre Cement EBIT increased 17% from US$44.6 million to US$52.3 million. The increase was due
to higher sales volumes and prices, partly offset by higher unit cost of sales and unit freight
costs. The higher unit cost of sales resulted primarily from increased sales of higher-priced,
differentiated products, higher raw material prices and ramp-up costs associated with planned
growth initiatives. Higher freight costs were primarily related to an increase in length of haul
and fuel surcharges. The EBIT margin decreased 1.7 percentage points to 23.7%.
Asia Pacific Fibre Cement EBIT decreased 10% from US$11.3 million to US$10.2 million. The EBIT
margin decreased 2.6 percentage points to 17.6%.
Australia and New Zealand Fibre Cement EBIT decreased 15% from US$10.7 million to US$9.1 million.
In Australian dollars, EBIT decreased 20%. The decrease in EBIT in Australian dollars was due to
reduced net sales compared to the same period last year and raw material price increases. The EBIT
margin was 3.5 percentage points lower, at 17.6%.
Philippines Fibre Cement business recorded another positive EBIT for the quarter due to increased
net sales and lower manufacturing costs.
The Chile Fibre Cement business recorded another small positive EBIT for the quarter due to
increased net sales.
Our US Hardie Pipe business incurred a small EBIT loss for the quarter despite higher selling
prices and further improvements in operating performance. Overall business performance for the
quarter was adversely affected by the impact of severe whether in Florida.
| |
|
|
James Hardie 3rd Quarter FY05 Management’s Analysis of Results
|
|
5 |
Our Europe Fibre Cement business incurred an EBIT loss for the quarter as expected, following its
commencement in the prior fiscal year.
General corporate costs increased US$16.4 million from US$6.3 million to US$22.7 million. This
increase was primarily due to US$15.9 million of expenses related to the SCI and associated
developments, and a net increase in professional service fees, directors fees and retiring
allowances, and other general corporate costs. These increases were partly offset by a US$1.8
million decrease in employee bonus plan expense and a US$0.4 million decrease in employee share
based compensation expense from stock appreciation rights primarily caused by a decrease in the
company’s share price.
Net Interest Expense
Net interest expenses decreased by US$2.1 million from US$2.8 million to US$0.7 million primarily
due to a higher amount of interest expense capitalised on construction projects in the current year
than in the prior year, higher interest income due to higher average cash balances and lower
interest expense due to lower average debt balances.
Other Income (Expenses), Net
Other income (expenses), net consists primarily of a US$0.7 million gain on an investment, partly
offset by a US$0.3 million impairment charge that we recorded on an investment in a company that
filed for voluntary petition for reorganisation under Chapter 11 of the US bankruptcy code.
Income Tax Expense
Income tax expense increased by US$3.2 million from US$10.0 million to US$13.2 million. Although
our profit before tax decreased, our current year effective tax rate estimate is higher than the
prior year effective tax rate due to non-deductible SCI related costs and estimated income tax
contingencies recorded during the period. Reviews by taxing jurisdiction authorities of various
tax matters are ongoing.
Operating Profit from Continuing Operations 1
Operating profit from continuing operations decreased by 30%, from US$28.3 million to US$19.8
million, due mainly to expenses associated with the SCI and other associated developments.
Excluding these expenses, operating profit from continuing operations for the quarter increased 11%
to US$31.5 million1.
Discontinued Operations
Net expense of US$0.3 million relates primarily to settlement of a dispute associated with a former
business.
Special Commission of Inquiry – Associated Developments
On 28 October 2004, the NSW Premier announced that the NSW Government would seek the agreement of
the Ministerial Council comprising of Ministers of the Commonwealth and the Australian States and
Territories to allow the NSW Government to pass legislation which he announced would “wind back
James Hardie’s corporate restructure and rescind the cancellation of A$1.9 billion in partly paid
shares”. The announcement said that “the laws will effectively enforce the liability [for
asbestos-related claims] against the Dutch parent company”. On 5 November 2004, the Australian
Attorney-General and the Parliamentary Secretary to the Treasurer (the two relevant ministers of
the Australian
| |
|
|
James Hardie 3rd Quarter FY05 Management’s Analysis of Results
|
|
6 |
Federal Government) issued a news release stating that the Ministerial Council for Corporations
(the relevant body of Federal, State and Territory Ministers, “MINCO”) had unanimously agreed “to
support a negotiated settlement that will ensure that victims of asbestos-related diseases receive
full and timely compensation from James Hardie” and if “the current negotiations between James
Hardie, the ACTU and asbestos victims do not reach an acceptable conclusion, MINCO also agreed in
principle to consider options for legislative reform”. The news release of 5 November 2004
indicated that treaties to enforce Australian judgments in Dutch and US courts are not required but
that the Australian Government has been involved in communications with Dutch and US authorities
regarding arrangements to ensure that Australian judgments are able to be enforced where necessary.
Should negotiations not lead to an acceptable conclusion, James Hardie is aware of suggestions of
legislative intervention but has no detailed information as to its likely content.
Heads of Agreement
On 21 December 2004, the company announced that it had entered into a non-binding Heads of
Agreement with the NSW Government, The Australian Council of Trade Unions, Unions NSW and various
groups representing asbestos claimants (the Representatives) which is expected to form the basis of
a proposed binding agreement (the “Principal Agreement”) to establish and fund a special purpose
fund to provide funding on a long-term basis for asbestos claims against Amaca and Amaba, former
James Hardie subsidiaries. The company is currently in negotiations related to the Principal
Agreement.
The principles set out in the Heads of Agreement on which the company and/or member(s) of the Group
would provide funding include:
| - |
the establishment of a special purpose fund (“SPF”) to compensate asbestos victims; |
| |
| - |
initial funding of the SPF by the company on the basis of the November 2004 KPMG Actuaries’
report (which provided a net present value of A$1.5 billion in present and future claims at 30
June 2004). The actuarial assessment is to be updated annually; |
| |
| - |
a two-year rolling cash buffer in the SPF and an annual contribution in advance based on
actuarial assessments of expected claims for the next three years, revised annually; |
| |
| - |
a cap on the annual payments made by the company to the SPF, initially set at 35% of annual
net operating cash flow (defined as cash from operations in accordance with US GAAP) of the
company for the immediately preceding year, with provisions for the percentage to decline over
time depending upon the company’s financial performance and claims outlook; and |
| |
| - |
no cap on individual payments to claimants. |
The Heads of Agreement is expected to form the basis of a Principal Agreement to be settled between
the company and the NSW Government which, in turn, will require the support of the company’s
lenders and shareholders. The Principal Agreement will be a legally binding agreement.
The Principal Agreement will be subject to a number of conditions precedent, including the approval
of the company’s shareholders and lenders and the adoption by the NSW Government of reforms
following a review, announced on 18 November 2004, of legal and administrative costs in dust
diseases compensation in New South Wales. A copy of the company’s announcement made on that date
welcoming the development can be downloaded at
www.irjameshardie.com.au.
The parties have announced their intention to execute the Principal Agreement by the end of March
2005, depending on the timing of the NSW Government Review, and for the binding agreement to
commence around the middle of 2005.
| |
|
|
James Hardie 3rd Quarter FY05 Management’s Analysis of Results
|
|
7 |
As part of the discussions surrounding the Principal Agreement the company is examining all
relevant options in relation to the establishment of the special purpose fund referred to above,
including the possibility of reacquiring all of the share capital of Amaba, Amaba and/or ABN 60.
The Heads of Agreement contains an agreement from the NSW Government to provide releases to the
James Hardie group and to its directors, officers and employees from all civil liabilities other
than the liabilities of James Hardie to be set out in the Principal Agreement. These releases may
well take the form of legislation passed by the NSW Parliament. The precise form of the releases
remains to be settled.
If an agreement is reached with the NSW Government and approved by the company’s lenders and
shareholders, the company may be required to make a substantial provision in its accounts at a
later date, and it is possible that the company may need to seek additional borrowing facilities.
Additionally, it is possible that any future resolution of this issue may result in the company
having negative shareholders’ equity, which may restrict its ability to pay dividends to its
shareholders. If the terms of a future resolution involve James Hardie making payments, either on
an annual or other basis, pursuant to a statutory scheme or other form of arrangement, James
Hardie’s financial position, results of operations and cash flows could be materially adversely
affected.
As noted above, the NSW Government is conducting a review of legal and administrative costs in dust
diseases compensation in NSW. The intention of this review is primarily to determine ways to
reduce legal and administrative costs, and to consider the current processes for handling and
resolving dust diseases compensation claims. The review is expected to report to the NSW
Government early in March 2005. The company is unable to predict the outcome of this review.
Updated Actuarial Study
In October 2004, the company commissioned an updated actuarial study of potential asbestos-related
liabilities. Based on the results of the study, which was updated as at 30 June 2004, it is
estimated that the discounted value of the central estimate for asbestos-related claims in
Australia for death or personal injury against Amaca, Amaba and ABN 60 was approximately A$1.536
billion. Actual liabilities of those companies for such asbestos-related claims could vary,
perhaps materially, from the discounted central estimate described above.
In estimating the potential financial exposure, the actuaries made assumptions related to total
number of claims which were reasonably estimated to be asserted through to the year 2071, the
typical cost of settlement (which is sensitive to the industry in which the plaintiff claims
exposure, the alleged disease type and the jurisdiction in which the action is being brought), the
rate of receipt of claims, the settlement strategy in dealing with outstanding claims and the
timing of settlements.
Further, the actuaries have relied on the data and information provided by the Medical Research and
Compensation Foundation and Litigation Management Group Pty Limited and assumed that it is accurate
and complete in all material respects. The actuaries have not verified that information
independently nor established the reliability, accuracy or completeness of the data and information
provided or used for the preparation of their report, and were not provided with the information
required to carry out such a verification exercise.
Due to inherent uncertainties in the legal and medical environment; the number and timing of future
claim notifications and settlements; the recoverability of claims against insurance contracts and
in estimating the future trends in average claim awards as well as the extent to which the
above-named entities will contribute to the overall settlements, the outcome could differ
materially from that currently projected.
| |
|
|
James Hardie 3rd Quarter FY05 Management’s Analysis of Results
|
|
8 |
Sensitivity analysis has been performed, showing how the actuarial estimates would change if the
outcome of certain assumptions (being the rate of superimposed inflation, the average costs of
claims and legal fees, and the projected numbers of claims) were different to that included within
the central estimates. This shows that the discounted central estimates could fall in a range
A$1.0 billion to A$2.3 billion (undiscounted estimates of A$2.0 billion to A$5.7 billion) based on
the current information available and reflecting current trends. It should be noted that the
actual cost of the liabilities could fall outside that range depending on the actual outcome of the
assumptions made.
Accordingly, the company has not established a provision for asbestos-related liabilities as of 31
December 2004 because at this time it is neither probable nor estimable.
Australian Securities and Investments Commission Investigation
The Australian Securities and Investments Commission (“ASIC”) has announced that it is conducting
an investigation into the events examined by the SCI, without limiting itself to the evidence
compiled by the SCI. ASIC has served notices to produce relevant documents upon the company,
various directors and officers of the company and on certain of its advisers and auditors at the
time of the separation and restructure transactions described above. To date, ASIC has announced
that it is investigating various matters, but it has not specified the particulars of alleged
contraventions under investigation, nor has it announced that it has reached any conclusion that
any person or entity has contravened any relevant law.
To assist ASIC’s investigation, the Federal Government has enacted legislation to abrogate the
legal professional privilege which would otherwise have attached to certain documents relevant to
matters under investigation or to any future proceedings to be taken following that investigation.
The legislation is set out in the James Hardie (Investigations and Proceedings) Act 2004.
The company may incur costs of current or former officers of the James Hardie Group to the extent
that those costs are covered by indemnity arrangements granted by the James Hardie Group to those
persons. To date, no claims have been received by any current or former officers in relation to
the ASIC investigation and, if claims do arise, the company may be reimbursed under directors’ and
officers’ insurance policies taken out by the company.
Severance Agreements
On 20 October 2004, Mr Peter Shafron resigned from his position as Chief Financial Officer and on
21 October 2004, Mr Peter Macdonald resigned from his position on the Managing Board and as Chief
Executive Officer. In connection with these resignations, the company incurred costs of $8.9
million in the three and nine months ended 31 December 2004. These costs comprised $6.0 million of
additional expense and $2.9 million of previously existing accruals.
ABN 60 Indemnity
The company has undertaken a number of initiatives to ensure that asbestos-related claims
processing by the Medical Research and Compensation Foundation (MRCF) is not interrupted prior to
the entry into the Principal Agreement in accordance with the principles and within the proposed
timing described above. These initiatives are described further below, but the company believes
that the MRCF is unlikely to need to avail itself of the assistance which has been offered by the
company, on the basis that on 3 December 2004 and in part as a result of the initiatives taken by
the company, the MRCF received a payment of approximately A$88.5 million from ABN 60 for use in
processing and meeting asbestos-related injury claims.
The company facilitated the payment of such funds by granting an indemnity to the directors of ABN
60, which it announced on 16 November 2004. Under the terms of that indemnity, the company agreed
to meet any liability incurred by the ABN 60 directors resulting from the release of the A$88.5
million by ABN 60 to the MRCF. The company believes that the release of the funding by ABN 60 is in
accordance with law and contracts in place and therefore the company should not incur liability
under this indemnity.
| |
|
|
James Hardie 3rd Quarter FY05 Management’s Analysis of Results
|
|
9 |
Additionally, on 16 November 2004, the company offered to provide funding to the MRCF on an interim
basis for a period of up to six months from that date. Such funding would only be provided once
existing MRCF funds have been exhausted. The company believes, based on actuarial and legal advice
that claims against the MRCF should not exceed the funds which are available to the MRCF
(particularly in light of its receipt of the A$88.5 million described above) or which are expected
to become available to the MRCF during the period of the interim funding proposal. The company has
not recorded a provision for either the proposed indemnity or the potential payments under the
interim funding proposal.
MRCF
On the basis of the current cash and financial position of the MRCF subsidiaries (Amaca Pty Limited
and Amaba Pty Limited) and following the company’s entry into the Heads of Agreement, the
applications previously made to the Supreme Court of NSW for the appointment of a provisional
liquidator to the MRCF’s subsidiaries have been dismissed with their consent.
End.
Media/Analysts call:
Steve Ashe
Vice President Investor Relations
Telephone: 61 2 8274 5246
Mobile: 0408 164 011
Email:[email protected]
Facsimile: 61 2 8274 5218
The Management’s Analysis of Results and accompanying release and management presentation, along
with an audio webcast of the presentation, will be available from the Investor Relations website at
www.jameshardie.com
This Management’s Analysis of Results document forms part of a package of information about the
company’s results. It should be read in conjunction with the other parts of this package,
including a Media Release, a Management Presentation, a Financial Report and a Results at a
Glance document.
| |
|
|
James Hardie 3rd Quarter FY05 Management’s Analysis of Results
|
|
10 |
Endnotes:
Volume and Average Net
Sales Price - Asia Pacific Fibre Cement - Adjusted:
In fiscal 2003 and 2004, our Asia Pacific Fibre Cement segment reported incorrect
volume figures due to errors when converting to our standard square feet metric and due
to our Philippines Fibre Cement business including intercompany volume during fiscal
2004. The following table presents adjusted volume and average net sales price for our
Asia Pacific Fibre Cement business segment. This Management’s Analysis of Results uses
these revised volume and average net sales price. These adjustments did not have a
material impact on total net sales or EBIT.
| |
|
|
|
|
|
|
|
|
|
|
|
|
|
|
|
|
| |
|
|
|
|
|
30 |
|
|
31 |
|
|
|
|
| |
|
30 June |
|
|
September |
|
|
December |
|
|
31 March |
|
| Fiscal 2003 |
|
2002 |
|
|
2002 |
|
|
2002 |
|
|
2003 |
|
Quarter |
|
|
|
|
|
|
|
|
|
|
|
|
|
|
|
|
Volume (mmsf1) |
|
|
83.1 |
|
|
|
90.6 |
|
|
|
88.7 |
|
|
|
87.5 |
|
Average net sales price per unit (per msf1) |
|
A$ |
888 |
|
|
A$ |
905 |
|
|
A$ |
898 |
|
|
A$ |
857 |
|
|
|
|
|
|
|
|
|
|
|
|
|
|
|
|
|
|
Year-to-date |
|
|
|
|
|
|
|
|
|
|
|
|
|
|
|
|
Volume (mmsf1) |
|
|
83.1 |
|
|
|
173.7 |
|
|
|
262.4 |
|
|
|
349.9 |
|
Average net sales price per unit (per msf1) |
|
A$ |
888 |
|
|
A$ |
897 |
|
|
A$ |
897 |
|
|
A$ |
887 |
|
| |
|
|
|
|
|
|
|
|
|
|
|
|
|
|
|
|
| |
|
|
|
|
|
30 |
|
|
31 |
|
|
|
|
| |
|
30 June |
|
|
September |
|
|
December |
|
|
31 March |
|
| Fiscal 2004 |
|
2003 |
|
|
2003 |
|
|
2003 |
|
|
2004 |
|
Quarter |
|
|
|
|
|
|
|
|
|
|
|
|
|
|
|
|
Volume (mmsf1) |
|
|
87.0 |
|
|
|
94.0 |
|
|
|
92.1 |
|
|
|
89.0 |
|
Average net sales price per unit (per msf1) |
|
A$ |
874 |
|
|
A$ |
865 |
|
|
A$ |
854 |
|
|
A$ |
854 |
|
|
|
|
|
|
|
|
|
|
|
|
|
|
|
|
|
|
Year-to-date |
|
|
|
|
|
|
|
|
|
|
|
|
|
|
|
|
Volume (mmsf1) |
|
|
87.0 |
|
|
|
181.0 |
|
|
|
273.1 |
|
|
|
362.1 |
|
Average net sales price per unit (per msf1) |
|
A$ |
874 |
|
|
A$ |
869 |
|
|
A$ |
864 |
|
|
A$ |
862 |
|
Net
Sales - Philippines Fibre Cement - Adjusted:
In fiscal 2004, our Philippines business incorrectly reported intercompany
transfers as external net sales and cost of sales. Adjustment to the Philippines Fibre
Cement discussion is necessary to provide an accurate quarter-to-quarter discussion of
Philippines Fibre Cement net sales. Therefore, for discussion purposes only, for the
Philippines Fibre Cement business, we adjusted the prior year Philippines Fibre Cement
net sales. We have not restated the Asia Pacific Fibre Cement business segment results
or the consolidated financial statements since these adjustments are not material to
our Asia Pacific Fibre Cement segment or to the consolidated financial statements taken
as a whole. The following table presents the adjustment to Philippines Fibre Cement net
sales for each quarter and year-to-date periods in fiscal 2004 (amounts in millions):
| |
|
|
|
|
|
|
|
|
|
|
|
|
|
|
|
|
| |
|
|
|
|
|
30 |
|
|
31 |
|
|
|
|
| |
|
30 June |
|
|
September |
|
|
December |
|
|
31 March |
|
| |
|
2003 |
|
|
2003 |
|
|
2003 |
|
|
2004 |
|
Quarters: |
|
|
|
|
|
|
|
|
|
|
|
|
|
|
|
|
Previously Reported |
|
US$ |
6.2 |
|
|
US$ |
6.9 |
|
|
US$ |
5.2 |
|
|
US$ |
5.9 |
|
Adjustment |
|
|
(1.4 |
) |
|
|
(1.2 |
) |
|
|
— |
|
|
|
(0.8 |
) |
| |
|
|
Adjusted Net Sales |
|
US$ |
4.8 |
|
|
US$ |
5.7 |
|
|
US$ |
5.2 |
|
|
US$ |
5.1 |
|
|
|
|
|
|
|
|
|
|
|
|
|
|
|
|
|
|
Year to date: |
|
|
|
|
|
|
|
|
|
|
|
|
|
|
|
|
Previously Reported |
|
US$ |
6.2 |
|
|
US$ |
13.1 |
|
|
US$ |
18.3 |
|
|
US$ |
24.2 |
|
Adjustment |
|
|
(1.4 |
) |
|
|
(2.6 |
) |
|
|
(2.6 |
) |
|
|
(3.4 |
) |
| |
|
|
Adjusted Net Sales |
|
US$ |
4.8 |
|
|
US$ |
10.5 |
|
|
US$ |
15.7 |
|
|
US$ |
20.8 |
|
| |
|
|
James Hardie 3rd Quarter FY05 Management’s Analysis of Results
|
|
11 |
EBIT and EBIT Margin - EBIT is defined as operating income. EBIT margin is defined as
EBIT as a percentage of our net sales. We believe EBIT and EBIT margin to be relevant and useful
information as these are the primary measures used by our management to measure the operating
profit or loss of our business. EBIT is one of several metrics used by our management to measure
the earnings generated by our operations, excluding interest and income tax expenses. Additionally,
EBIT is believed to be a primary measure and terminology used by our Australian investors. EBIT
and EBIT margin should be considered in addition to, but not as a substitute for, other measures of
financial performance reported in accordance with accounting principles generally accepted in the
United States of America. EBIT and EBIT margin, as we have defined them, may not be comparable to
similarly titled measures reported by other companies.
EBIT and EBIT margin, as used in this document, are equivalent to the US GAAP measures of operating
income and operating income margin.
EBIT
and EBIT Margin excluding costs associated with the SCI and associated developments -
not a measure of financial performance under US GAAP and should not be considered to be more
meaningful than EBIT and EBIT Margin. The company has included this financial measure to provide
investors with an alternative method for assessing the company’s operating results in a manner that
is focused on the performance of the company’s ongoing operations. The company’s management uses
this non-GAAP measure for the same purposes.
Operating profit from continuing operations excluding costs associated with the SCI and
associated developments – not a measure of financial performance under US GAAP and should not
be considered to be more meaningful than operating profit. The company has included this financial
measure to provide investors with an alternative method for assessing the company’s operating
results in a manner that is focused on the performance of the company’s ongoing operations. The
company’s management uses this non-GAAP measure for the same purposes.
Operating profit from continuing operations before income taxes - is equivalent to the US
GAAP measure of income from continuing operations before income taxes.
Operating profit from continuing operations - is equivalent to the US GAAP measure of
income from continuing operations.
Net operating profit including discontinued operations - is equivalent to the US GAAP
measure of net income.
mmsf – million square feet
msf – thousand square feet
Disclaimer
This Management’s Analysis of Results contains forward-looking statements. We may from time to time
make forward-looking statements in our periodic reports filed with the Securities and Exchange
Commission on Forms 20-F and 6-K, in our annual reports to shareholders, in offering circulars and
prospectuses, in media releases and other written materials and in oral statements made by our
officers, directors or employees to analysts, institutional investors, representatives of the media
and others. Examples of such forward-looking statements include:
| |
• |
projections of our operating results or financial condition; |
| |
| |
• |
statements of our plans, objectives or goals, including those relating to
competition, acquisitions, dispositions and our products; |
| |
| |
• |
statements about our future economic performance or that of the United States,
Australia or other countries in which we operate; and |
| |
| |
• |
statements about product or environmental liabilities. |
Words such as “believe,” “anticipate,” “plan,” “expect,” “intend,” “target,” “estimate,” “project,”
“predict,” “forecast,” “guideline,” “should,” “aim” and similar expressions are intended to
identify forward-looking statements but are not the exclusive means of identifying such statements.
| |
|
|
James Hardie 3rd Quarter FY05 Management’s Analysis of Results
|
|
12 |
Forward-looking statements involve inherent risks and uncertainties. We caution you that a number
of important factors could cause actual results to differ materially from the plans, objectives,
expectations, estimates and intentions expressed in such forward-looking statements. These factors
include but are not limited to: all matters relating to or arising out of the prior manufacture of
asbestos by ABN 60 and certain former subsidiaries; competition and product pricing in the markets
in which we operate; general economic and market conditions; compliance with and possible changes
in environmental and health and safety laws; the successful transition of new senior management;
the success of our research and development efforts; the supply and cost of raw materials; our
reliance on a small number of product distributors; the consequences of product failures or
defects; exposure to environmental, asbestos or other legal proceedings; risks of conducting
business internationally; compliance with and changes in tax laws and treatments; and foreign
exchange risks. We caution you that the foregoing list of factors is not exclusive and that other
risks and uncertainties may cause actual results to differ materially from those in forward-looking
statements. Forward-looking statements speak only as of the date they are made.
| |
|
|
James Hardie 3rd Quarter FY05 Management’s Analysis of Results
|
|
13 |

| |
|
|
14 February 2005
|
|
Analyst and Media enquiries about |
|
|
results, please contact Steve Ashe on |
|
|
Tel: 61 2 8274 5246 |
|
|
Mob: 0408 164 011 |
James Hardie Industries N.V.
Results for the Nine Months Ended 31 December 2004
| |
|
|
|
|
|
|
|
|
|
|
|
|
|
|
|
|
|
|
|
|
Nine Months Ended 31 December |
|
|
| USGAAP - US$
Millions |
|
|
FY 2005 |
|
|
|
FY 2004 |
|
|
|
% Change |
|
|
Net Sales |
|
|
|
|
|
|
|
|
|
|
|
|
|
|
|
|
USA Fibre Cement |
|
|
$ |
692.0 |
|
|
|
$ |
553.5 |
|
|
|
|
25 |
|
|
Asia Pacific Fibre Cement |
|
|
|
177.9 |
|
|
|
|
160.8 |
|
|
|
|
11 |
|
|
Other Fibre Cement |
|
|
|
24.1 |
|
|
|
|
16.3 |
|
|
|
|
48 |
|
|
| |
|
|
|
|
|
|
|
|
|
|
Total Net Sales |
|
|
|
894.0 |
|
|
|
|
730.6 |
|
|
|
|
22 |
|
|
| |
|
|
|
|
|
|
|
|
|
|
|
|
|
|
|
|
|
|
|
|
|
|
|
|
|
|
|
Net Sales |
|
|
$ |
894.0 |
|
|
|
$ |
730.6 |
|
|
|
|
22 |
|
|
Cost of goods sold |
|
|
|
(588.9 |
) |
|
|
|
(461.4 |
) |
|
|
|
28 |
|
|
Gross profit |
|
|
|
305.1 |
|
|
|
|
269.2 |
|
|
|
|
13 |
|
|
Selling general and administrative expenses |
|
|
|
(132.1 |
) |
|
|
|
(115.7 |
) |
|
|
|
14 |
|
|
Research and development expenses |
|
|
|
(16.4 |
) |
|
|
|
(16.1 |
) |
|
|
|
2 |
|
|
Special Commission of Inquiry related expenses |
|
|
|
(24.4 |
) |
|
|
|
— |
|
|
|
|
— |
|
|
Other operating expenses |
|
|
|
(0.6 |
) |
|
|
|
— |
|
|
|
|
— |
|
|
EBIT 1 |
|
|
|
131.6 |
|
|
|
|
137.4 |
|
|
|
|
(4 |
) |
|
Net interest expense |
|
|
|
(4.5 |
) |
|
|
|
(7.5 |
) |
|
|
|
(40 |
) |
|
Other expenses, net |
|
|
|
(1.5 |
) |
|
|
|
(3.4 |
) |
|
|
|
(56 |
) |
|
|
|
|
|
|
|
|
|
|
|
|
|
|
|
|
|
|
Operating profit from continuing operations before
income taxes 1 |
|
|
|
125.6 |
|
|
|
|
126.5 |
|
|
|
|
(1 |
) |
|
Income tax expense |
|
|
|
(44.0 |
) |
|
|
|
(32.5 |
) |
|
|
|
35 |
|
|
| |
|
|
|
|
|
|
|
|
|
|
Operating Profit From Continuing Operations 1 |
|
|
$ |
81.6 |
|
|
|
$ |
94.0 |
|
|
|
|
(13 |
) |
|
|
|
|
|
|
|
|
|
|
|
|
|
|
|
|
|
|
| |
|
|
|
|
|
|
|
|
|
|
Net Operating Profit Including Discontinued Operations
1 |
|
|
$ |
80.6 |
|
|
|
$ |
97.6 |
|
|
|
|
(17 |
) |
|
| |
|
|
|
|
|
|
|
|
|
|
|
|
|
|
|
|
|
|
|
|
|
|
|
|
|
|
|
Tax rate |
|
|
|
35.0 |
% |
|
|
|
25.7 |
% |
|
|
|
|
|
|
|
|
|
|
|
|
|
|
|
|
|
|
|
|
|
|
|
Volume (mmsf1) |
|
|
|
|
|
|
|
|
|
|
|
|
|
|
|
|
USA Fibre Cement |
|
|
|
1382.5 |
|
|
|
|
1136.3 |
|
|
|
|
22 |
|
|
Asia Pacific Fibre Cement* |
|
|
|
287.4 |
|
|
|
|
273.1 |
|
|
|
|
5 |
|
|
|
|
|
|
|
|
|
|
|
|
|
|
|
|
|
|
|
Average net sales price per unit (per msf1) |
|
|
|
|
|
|
|
|
|
|
|
|
|
|
|
|
USA Fibre Cement |
|
|
US$ |
501 |
|
|
|
US$ |
487 |
|
|
|
|
3 |
|
|
Asia Pacific Fibre Cement* |
|
|
A$ |
850 |
|
|
|
A$ |
864 |
|
|
|
|
(2 |
) |
|
Unless otherwise stated, results are for continuing operations only and comparisons are of the first nine months of the
current fiscal year versus the first nine months of the prior fiscal year.
Total Net Sales
Total net sales increased 22% compared to the same period of the previous year, from US$730.6
million to US$894.0 million.
Net sales from USA Fibre Cement increased 25% from US$553.5 million to US$692.0 million due to
continued strong growth in sales volumes and a higher average net sales price.
Net sales from Asia Pacific Fibre Cement increased 11% from US$160.8 million to US$177.9 million
due to increased sales volumes and favourable foreign currency movements.
Net sales from Other Fibre Cement increased 48% from US$16.3 million to US$24.1 million as the
Chilean flat sheet business, the USA-based Hardie® Pipe business and European Fibre Cement business
continued to grow.
USA Fibre Cement
Net sales increased 25% from US$553.5 million to US$692.0 million due to increased sales volumes
and a higher average net sales price.
Sales volume increased 22% from 1136.3 million square feet to 1382.5 million square feet, primarily
due to continued strong growth in primary demand for fibre cement and a favourable housing
construction market.
New residential housing construction remained buoyant during the period due to strong consumer
demand and low inventories of houses for sale, fuelled by low interest rates, solid house prices
and a strengthening domestic economy.
We continued to grow sales in both our emerging and established geographic markets and in our
exterior and interior product markets.
Further market share was gained in our emerging geographic markets as our exterior products
continued to penetrate against alternative materials, primarily wood-based and vinyl siding. There
continued to be growth in sales of higher-priced, differentiated products such as vented soffits,
Heritageâ panels, the ColorPlusä Collection of pre-painted siding and Harditrim® XLD®
Planks.
There were further market share gains in the interior products market, with sales of Hardibacker
500â half-inch backerboard up strongly compared to the same period last year.
The average net sales price increased 3% from US$487 per thousand square feet to US$501 per
thousand square feet. The increase was due to proportionally stronger growth of differentiated,
higher priced products, including Harditrimâ, vented soffit and the ColorPlusä
Collection, and a price increase for some products that became effective on 1 July 2004.
During the period, we continued construction of our new green-field fibre cement plant in Reno,
Nevada. Product was successfully being produced from the new plant by end of the third quarter and
full commissioning of the plant is expected in the fourth quarter. Construction of our new 160
million square foot trim line in Peru, Illinois continued during the period.
Asia Pacific Fibre Cement (See Endnotes)
Net sales increased 11% from US$160.8 million to US$177.9 million. Net sales increased 2% in
Australian dollars. Sales volume increased 5% from 273.1 million square feet to 287.4 million
square feet.
| |
|
|
James Hardie nine months FY05 Management’s Analysis of Results
|
|
2 |
Australia and New Zealand Fibre Cement
Net sales increased 12% from US$142.4 million to US$159.2 million due to increased sales volume, a
higher average net sales price and favourable foreign currency movements. In Australian dollars,
net sales increased 3%.
Sales volumes increased 2% from 215.5 million square feet to 218.9 million square feet primarily
due to growth in sales of building products in both Australia and New Zealand. Despite the overall
increase, we believe sales volumes were affected to some extent by product bans and boycotts in
Australia connected with the NSW Government Special Commission of Inquiry into the Medical Research
and Compensation Foundation and the release of the report of the Inquiry.
In Australia, new residential housing activity improved early in the period led by buoyant activity
in Queensland, and the renovation and commercial segments also remained strong early. However,
both new residential housing and renovations activity softened over the last six months of the
period.
In New Zealand, new residential housing activity was robust and there was increased demand for
weatherboards, eaves and soffits. Sales of our Lineaâ range of weatherboards continued to
grow strongly.
The average net sales price increased 1% in Australian dollars due mainly to a change in sales mix.
During the period, we launched Eclipsaä Eaves Lining, a new pre-painted eave product, across
Australia. Eclipsaä offers cost benefits and construction advantages over non-painted eave
products and we expect that it will be received favourably by builders.
Philippines Fibre Cement
Net sales increased 19% from US$15.7 million to US$18.7 million. In local currency, net sales
increased 23%. This increase was due to a 19% increase in sales volume and a 3% increase in the
average net sales price.
The increase in the net sales price was due to a change in sales mix between domestic and export
sales.
Improved construction activity in the Philippines, increased market penetration and regional
exports resulted in stronger demand during the first nine months of the year.
Other Fibre Cement
Chile Fibre Cement
Our Chilean business continued to increase its penetration of the domestic flat sheet market and
increased sales of higher-priced, differentiated products and build regional exports.
Net sales increased compared to the nine months of the previous year due to growth in sales volume,
partly offset by a lower average net sales price. The lower average net sales price was due to an
increased proportion of domestic sales and the impact of a weaker US dollar on export sales.
Construction activity in Chile continued to show signs of improvement.
| |
|
|
James Hardie nine months FY05 Management’s Analysis of Results
|
|
3 |
Hardie Pipe
Our US Hardie Pipe business continued to penetrate the Florida market of the United States and to
improve its manufacturing efficiency.
Despite net sales in the second quarter being adversely affected by severe weather in Florida, net
sales for the nine months increased strongly compared to the same period last year due to an
increase in sales volume and a higher average net sales price. The increase in sales volume was
due to market share gains and buoyant construction activity in Florida.
The average net sales price has continued to improve during the first nine months and increased
compared to the same period last year.
The manufacturing performance of the plant improved further during the nine months, but operating
costs are still above our targets.
Europe Fibre Cement
Our European business continued to grow demand by building awareness of our products among
distributors, builders and contractors, and by adding further distribution outlets in both the UK
and French markets.
Sales have continued to build steadily since commencement of operations in the first quarter of the
previous fiscal year. Net sales this period increased significantly compared to the same period
last year, albeit off a low base, due to stronger demand across the range of interior and exterior
products.
Artisan™ roofing
In June 2003, we began to commission and trial our pilot roofing plant in Fontana, California. The
pilot plant, which has a design capacity of 25 million square feet, was built to test our
proprietary manufacturing technology and to provide product for market testing in Southern
California.
The business is continuing to prove its business model and remains focussed on market testing,
refining the manufacturing operation and improving productivity.
Gross Profit
Gross profit increased 13% from US$269.2 million to US$305.1 million due to improvements in our
major businesses. The gross profit margin decreased 2.7 percentage points to 34.1%.
USA Fibre Cement gross profit increased 11% due to higher net sales, partly offset by an increase
in unit cost of sales and increased freight costs. The higher unit cost of sales resulted
primarily from increased sales of higher-priced, differentiated products, higher pulp and cement
costs, maintenance expenses and a reduction in manufacturing efficiency at some plants that
occurred during the second quarter. Higher freight costs were primarily related to an increase in
length of haul of some products due to supply issues associated with a temporary reduction in plant
manufacturing efficiency in the second quarter, and higher fuel costs and general liability
insurance. The gross profit margin decreased 4.4 percentage points.
| |
|
|
James Hardie nine months FY05 Management’s Analysis of Results
|
|
4 |
Asia Pacific Fibre Cement gross profit increased 16% following improvements from Australia and New
Zealand Fibre Cement and Philippines Fibre Cement, which increased 13% and 51%, respectively. The
improved result for Australia and New Zealand was due to increased net sales and manufacturing
efficiency improvements. In the Philippines, lower costs and increased margins accounted for the
stronger gross profit performance. The Asia Pacific Fibre Cement gross profit margin increased 1.5
percentage points.
Selling, General and Administrative (SG&A) Expenses
SG&A expenses increased 14% compared to the same period last year, from US$115.7 million to
US$132.1 million. The increase in SG&A expenses was due mainly to increased sales and marketing,
information technology and other expenses associated with growth initiatives in the United States.
As a percentage of sales, SG&A expenses for the nine months were 1.0 percentage point lower at
14.8%.
Research and Development Expenses
Research and development expenses include costs associated with “core” research projects that are
designed to benefit all fibre cement business units. These costs are recorded in the Research and
Development segment rather than being attributed to individual business units. These costs
decreased 9% for the period, at US$9.0 million.
Other research and development costs associated with commercialisation projects in business units
are included in the business related unit segment results. In total, these costs increased 19% to
US$7.4 million for the nine months.
Special Commission of Inquiry Related Expenses
Costs incurred during the period associated with the NSW Government Special Commission of Inquiry
into the Medical Research and Compensation Foundation (SCI) and associated developments total
US$24.4 million and include: US$6.3 million related to the SCI; US$4.4 million related to the
internal investigation conducted by independent legal advisers, consistent with US Securities
regulations, of allegations of illegal conduct raised during the SCI and any potential impacts on
the financial statements; US$1.0 million related to the Australian Securities and Investments
Commission investigation into the circumstances surrounding the creation of the MRCF; US$4.5
million for resolution advisory services; US$6.0 million in severance payments to former
executives; and US$2.2 million for other matters.
Other Operating Expense
Other operating expense of US$0.6 million primarily related to a loss on the sale of land in
Sacramento, California.
EBIT1
EBIT decreased 4% from US$137.4 million to US$131.6 million. The EBIT margin decreased 4.1
percentage points to 14.7%. Excluding costs associated with the NSW Government Special Commission
of Inquiry into the Medical Research and Compensation Foundation and associated developments, EBIT
increased 14% and the EBIT margin is 17.4%.
| |
|
|
James Hardie nine months FY05 Management’s Analysis of Results
|
|
5 |
USA Fibre Cement EBIT increased 8% from US$152.4 million to US$164.4 million. The increase was due
to growth in net sales, partly offset by an increase in unit cost of sales, unit freight cost,
general liability insurance and SG&A expenses. The increase in unit cost of sales was due to
increased sales of higher cost differentiated products, higher pulp and cement costs, increased
maintenance expenses and a temporary reduction in manufacturing efficiency at some plants that
occurred during the second quarter. Higher freight costs were primarily related to an increase in
length of haul of some products due to supply issues associated with the temporary reduction in
plant manufacturing efficiency and higher fuel costs. The EBIT margin decreased 3.7 percentage
points to 23.8%.
Asia Pacific Fibre Cement EBIT increased 18% from US$29.3 million to US$34.5 million. The EBIT
margin increased 1.2 percentage points to 19.4%.
Australia and New Zealand Fibre Cement EBIT increased 13% from US$27.7 million to US$31.2 million.
In Australian dollars, EBIT increased 4%. The increase in EBIT in Australian dollars was due to
increased net sales compared to the first nine months last year and improved manufacturing
efficiencies. The EBIT margin increased 0.1 of a percentage point to 19.6%.
Philippines Fibre Cement business more than doubled its positive EBIT performance compared to the
same period last year due to increased net sales and cost savings.
The Chile Fibre Cement business recorded a small positive EBIT for the nine months.
Our US Hardie Pipe business significantly reduced its EBIT loss compared to the first nine months
last year due to increased sales volumes, higher selling prices and manufacturing cost savings.
Our Europe Fibre Cement business incurred an EBIT loss for the nine months as expected.
General corporate costs increased US$25.3 million from US$20.5 million to US$45.8 million. This
increase was primarily due to US$24.4 million of expenses related to the SCI and associated
developments, a US$0.7 million loss on sale of land in Sacramento, California, and a net increase
in professional service fees, directors fees and retiring allowances, and other general corporate
costs. These increases were partly offset by a US$1.1 million decrease in employee bonus plan
expense and a US$3.1 million decrease in employee share based compensation expense from stock
appreciation rights primarily caused by a decrease in the company’s share price.
Net Interest Expense
Net interest expense decreased by US$3.0 million from US$7.5 million to US$4.5 million, primarily
due to a higher amount of interest expense capitalised on construction projects in the current year
than in the prior year, higher interest income due to higher average cash balances and lower
interest expense due to lower average debt balances.
Other Expenses, Net
Other operating expenses consist primarily of a US$2.2 million impairment charge that we recorded
on an investment in a company that filed a voluntary petition for reorganisation under Chapter 11
of the US bankruptcy code, partly offset by a US$0.7 million gain on a separate investment. In the
prior year, we incurred an expense of US$3.2 million primarily due to a capital duty fee paid in
conjunction with our Dutch legal structure, incurred to extend the scope of our international
finance subsidiary to lend to global operations.
| |
|
|
James Hardie nine months FY05 Management’s Analysis of Results
|
|
6 |
Income Tax Expense
Income tax expense increased by US$11.5 million from US$32.5 million to US$44.0 million due to
non-deductible SCI and related costs and estimated income tax contingencies recorded during the
period. Reviews by taxing jurisdiction authorities of various tax matters are ongoing.
Operating Profit from Continuing Operations1
Operating profit from continuing operations decreased 13% from US$94.0 million to US$81.6
million. Excluding costs associated with the SCI and associated developments, operating profit
from continuing operations for the nine months increased 8% to US$101.9 million1.
Discontinued Operations
Net expense of US$1.0 million relates primarily to additional costs associated with the sale of New
Zealand land in March 2004, and settlement of a dispute associated with a former business.
Liquidity and Capital Resources
We have historically met our working capital needs and capital expenditure requirements through a
combination of cash flow from operations, proceeds from the divestiture of businesses, credit
facilities and other borrowings, proceeds from the sale of property, plant and equipment and
proceeds from the redemption of investments. Seasonal fluctuations in working capital generally
have not had a significant impact on our short-term or long-term liquidity. We believe that we can
meet our present working capital requirements for at least the next 12 months based on our current
capital resources.
We had cash and cash equivalents of US$73.5 million as of 31 December 2004. At that date we also
had credit facilities totalling US$452.9 million of which US$159.9 million was outstanding. Our
credit facilities are all uncollateralised and consist of the following:
| |
|
|
James Hardie nine months FY05 Management’s Analysis of Results
|
|
7 |
| |
|
|
|
|
|
|
|
|
|
|
|
|
| |
|
Effective |
|
|
|
|
|
|
Principal |
|
| |
|
Interest Rate |
|
|
Total Facility |
|
|
Outstanding |
|
| |
|
at |
|
|
at |
|
|
at |
|
| Description |
|
31 Dec 2004 |
|
|
31 Dec 2004 |
|
|
31 Dec 2004 |
|
| |
|
|
|
|
|
(US$ millions) |
|
|
|
|
|
US$ notes, fixed
interest, repayable
annually in varying
tranches from November
2005 through November
2013 |
|
|
7.12 |
% |
|
$ |
147.4 |
|
|
$ |
147.4 |
|
|
|
|
|
|
|
|
|
|
|
|
|
|
A$ revolving loan, can
be drawn down in either
US$ or A$, variable
interest based on US$
LIBOR or A$ bank bill
rate plus margin, can
be repaid and redrawn
until maturity in
November 2006 |
|
|
N/A |
|
|
|
158.0 |
|
|
|
— |
|
|
|
|
|
|
|
|
|
|
|
|
|
|
US$ stand-by loan, can
be drawn down in either
US$ or A$, variable
interest based on US$
LIBOR or A$ bank bill
rate plus margin until
maturity in April 2005 |
|
|
N/A |
|
|
|
132.5 |
|
|
|
— |
|
|
|
|
|
|
|
|
|
|
|
|
|
|
US$ line of credit, can
be drawn down in
Chilean Pesos, variable
interest based on
Chilean Tasa Activa
Bancaria rate plus
margin until maturity
in April and December
2005 |
|
|
3.52 |
% |
|
|
15.0 |
|
|
|
12.5 |
|
|
|
|
|
|
|
|
|
|
|
|
Total |
|
|
|
|
|
$ |
452.9 |
|
|
$ |
159.9 |
|
|
|
|
|
|
|
|
|
|
|
|
Historically, we have sought to renew our revolving loan and stand-by loan facilities each year
under substantially the same terms and conditions. In this regard, we are currently in
negotiations with a number of banks which participate in our current debt facilities in order to
renew these facilities in a manner that provides us with the same amount of liquidity. However,
in light of the events resulting from the Special Commission of Inquiry: we may not be able to
renew these facilities by the time they expire in April 2005 and November 2006, or at all; we may
not be able to enter into new agreements on terms that provide the same level of liquidity as our
current agreement provide; we may have to pay additional fees and expenses that we might not have
to pay under normal circumstances; and we may have to agree to other terms that substantially
increase the cost of having these debt facilities in place. If we are not able to renew these debt
facilities on substantially the same terms, we may have to scale back our capital expenditure
associated with our expansion plans and may have to take other measures to conserve cash to meet
our future cash flow requirements.
Cash Flow
Net operating cash inflows increased by US$29.2 million from US$122.7 million to US$151.9 million
for the nine months ended 31 December 2004 compared to the same period in the prior year, primarily
due to changes in our operating assets and liabilities.
Net investing activities produced a cash outflow of US$122.1 million for the nine months ended 31
December 2004 compared to US$50.7 million for the same period in the prior year. The increase in
the cash outflow was primarily due to additional capital expenditures of US$69.4 million for the
nine months ended 31 December 2004 and US$5.0 million cash received in the prior year from the sale
of our New Zealand Building Systems in May 2003 that did not recur in the current period, partly
offset by proceeds of US$3.4 million from the sale of land in Sacramento, California in the current
period.
| |
|
|
James Hardie nine months FY05 Management’s Analysis of Results
|
|
8 |
Net financing activities resulted in an outflow of US$29.4 million for the nine months ended 31
December 2004 compared to US$88.3 million in the same period in the prior year. The decrease in
cash outflow was primarily due to a US$68.7 million repayment of capital in the prior year that did
not recur in the current period and a US$9.2 million decrease in dividends paid, partly offset by a
US$17.6 million scheduled debt repayment in the current period.
Special Commission of
Inquiry - Associated Developments
On 28 October 2004, the NSW Premier announced that the NSW Government would seek the agreement of
the Ministerial Council comprising of Ministers of the Commonwealth and the Australian States and
Territories to allow the NSW Government to pass legislation which he announced would “wind back
James Hardie’s corporate restructure and rescind the cancellation of A$1.9 billion in partly paid
shares”. The announcement said that “the laws will effectively enforce the liability [for
asbestos-related claims] against the Dutch parent company”. On 5 November 2004, the Australian
Attorney-General and the Parliamentary Secretary to the Treasurer (the two relevant ministers of
the Australian Federal Government) issued a news release stating that the Ministerial Council for
Corporations (the relevant body of Federal, State and Territory Ministers, “MINCO”) had unanimously
agreed “to support a negotiated settlement that will ensure that victims of asbestos-related
diseases receive full and timely compensation from James Hardie” and if “the current negotiations
between James Hardie, the ACTU and asbestos victims do not reach an acceptable conclusion, MINCO
also agreed in principle to consider options for legislative reform”. The news release of 5
November 2004 indicated that treaties to enforce Australian judgments in Dutch and US courts are
not required but that the Australian Government has been involved in communications with Dutch and
US authorities regarding arrangements to ensure that Australian judgments are able to be enforced
where necessary. Should negotiations not lead to an acceptable conclusion, James Hardie is aware
of suggestions of legislative intervention but has no detailed information as to its likely
content.
Heads of Agreement
On 21 December 2004, the Company announced that it had entered into a non-binding Heads of
Agreement with the NSW Government, The Australian Council of Trade Unions, Unions NSW and various
groups representing asbestos claimants (the Representatives) which is expected to form the basis of
a proposed binding agreement (the “Principal Agreement”) to establish and fund a special purpose
fund to provide funding on a long-term basis for Asbestos Claims against Amaba and Amaca, former
James Hardie subsidiaries.
The principles set out in the Heads of Agreement on which the company and/or member(s) of the Group
would provide funding include:
| - |
the establishment of a special purpose fund (“SPF”) to compensate asbestos victims; |
| |
| - |
initial funding of the SPF by the company on the basis of the November 2004 KPMG Actuaries’
report (which provided a net present value of A$1.5 billion in present and future claims at 30
June 2004). The actuarial assessment is to be updated annually; |
| |
| - |
a two year rolling cash buffer in the SPF and an annual contribution in advance based on
actuarial assessments of expected claims for the next three years, revised annually; |
| |
| - |
a cap on the annual payments made by the company to the SPF, initially set at 35% of annual
net operating cash flow (defined as cash from operations in accordance with US GAAP) of the
company for the immediately preceding year, with provisions for the percentage to decline over
time depending upon the company’s financial performance and claims outlook; and |
| |
| - |
no cap on individual payments to claimants. |
| |
|
|
James Hardie nine months FY05 Management’s Analysis of Results
|
|
9 |
The Heads of Agreement are expected to form the basis of a Principal Agreement to be settled
between the company and the NSW Government which, in turn, will require the support of the
company’s lenders and shareholders. The Principal Agreement is to be a legally binding agreement.
The Principal Agreement will be subject to a number of conditions precedent, including the approval
of the company’s shareholders and lenders and the adoption by the NSW Government of reforms
following a review, announced on 18 November 2004, of legal and administrative costs in dust
diseases compensation in New South Wales. A copy of the company’s announcement made on that date
welcoming the development can be downloaded at
www.irjameshardie.com.au.
The parties have announced their intention to execute a Principal Agreement, depending on the
timing of the NSW Government Review, and for the binding agreement to commence around the middle of
2005.
As part of the discussions surrounding the Principal Agreement the company is examining all
relevant options in relation to the establishment of the special purpose fund referred to above,
including the possibility of reacquiring all of the share capital of Amaba, Amaba and/or ABN 60.
The Heads of Agreement contain an agreement from the NSW Government to provide releases to the
James Hardie group and to its directors, officers and employees from all civil liabilities other
than the liabilities of James Hardie to be set out in the Principal Agreement. This release may
well take the form of legislation passed by the NSW Parliament. The precise form of the release
remains to be settled.
If an agreement is reached with the NSW Government and approved by the company’s lenders and
shareholders, the company may be required to make a substantial provision in its accounts at a
later date, and it is possible that the company would need to seek additional borrowing facilities.
Additionally, it is possible that any future resolution of this issue may result in the company
having negative shareholders’ equity, which would be likely to restrict its ability to pay
dividends to its shareholders. If the terms of a future resolution involve James Hardie making
payments, either on an annual or other basis, pursuant to a statutory scheme or other form of
arrangement, James Hardie’s financial position, results of operations and cash flows could be
materially adversely affected.
As noted above, the NSW Government is conducting a review of legal and administrative costs in dust
diseases compensation in NSW. The intention of this review is primarily to determine ways to
reduce legal and administrative costs, and to consider the current processes for handling and
resolving dust diseases compensation claims. The review is expected to report to the NSW
Government early in 2005. The company is unable to predict the outcome of this review.
Updated Actuarial Study
In October 2004, the company commissioned an updated actuarial study of potential asbestos-related
liabilities. Based on the results of the study, which was updated as at 30 June 2004, it is
estimated that the discounted value of the central estimate for asbestos-related claims in
Australia for death or personal injury against Amaca, Amaba and ABN 60 was approximately A$1.536
billion. Actual liabilities of those companies for such asbestos-related claims could vary,
perhaps materially, from the discounted central estimate described above.
In estimating the potential financial exposure, the actuaries made assumptions related to total
number of claims which were reasonably estimated to be asserted through 2071, the typical cost of
settlement (which is sensitive to the industry in which the plaintiff claims exposure, the alleged
disease type and the jurisdiction in which the action is being brought), the rate of receipt of
claims, the settlement strategy in dealing with outstanding claims and the timing of settlements.
| |
|
|
James Hardie nine months FY05 Management’s Analysis of Results
|
|
10 |
Further, the actuaries have relied on the data and information provided by the Medical Research and
Compensation Foundation and Litigation Management Group Pty Limited and assumed that it is accurate
and complete in all material respects. The actuaries have not verified that information
independently nor established the reliability, accuracy or completeness of the data and information
provided or used for the preparation of their report, and were not provided with the information
required to carry out such a verification exercise.
Due to inherent uncertainties in the legal and medical environment; the number and timing of future
claim notifications and settlements; the recoverability of claims against insurance contracts and
in estimating the future trends in average claim awards as well as the extent to which the
above-named entities will contribute to the overall settlements, the outcome could differ
materially from that currently projected.
Sensitivity analysis has been performed, showing how the actuarial estimates would change if the
outcome of certain assumptions (being the rate of superimposed inflation, the average costs of
claims and legal fees, and the projected numbers of claims) were different to that included within
the central estimates. This shows that the discounted central estimates could fall in a range
A$1.0 billion to A$2.3 billion (undiscounted estimates of A$2.0 billion to A$5.7 billion) based on
the current information available and reflecting current trends. It should be noted that the
actual cost of the liabilities could fall outside that range depending on the actual outcome of the
assumptions made.
Accordingly, the company has not established a provision for asbestos-related liabilities as of 31
December 2004 because at this time it is neither probable nor estimable.
Australian Securities and Investments Commission Investigation
The Australian Securities and Investments Commission (“ASIC”) has announced that it is conducting
an investigation into the events examined by the SCI, without limiting itself to the evidence
compiled by the SCI. ASIC has served notices to produce relevant documents upon the company,
various directors and officers of the company and on certain of its advisers and auditors at the
time of the separation and restructure transactions described above. To date, ASIC has announced
that it is investigating various matters, but it has not specified the particulars of alleged
contraventions under investigation, nor has it announced that it has reached any conclusion that
any person or entity has contravened any relevant law.
To assist ASIC’s investigation, the Federal Government has enacted legislation to abrogate the
legal professional privilege which would otherwise have attached to certain documents relevant to
matters under investigation or to any future proceedings to be taken following that investigation.
The legislation is set out in the James Hardie (Investigations and Proceedings) Act 2004.
The company may incur costs of current or former officers of the James Hardie Group to the extent
that those costs are covered by indemnity arrangements granted by the James Hardie Group to those
persons. To date, no claims have been received by any current or former officers in relation to
the ASIC investigation and, if claims do arise, the company may be reimbursed under directors’ and
officers’ insurance policies taken out by the company.
Severance Agreements
On 20 October 2004, Mr. Peter Shafron resigned from his position as Chief Financial Officer and on
21 October 2004, Mr. Peter Macdonald resigned from his position on the Managing Board and as Chief
Executive Officer. In connection with these resignations, the company incurred costs of $8.9
million in the three and nine months ended 31 December 2004. These costs comprised $6.0 million
additional expense and $2.9 million of previously existing accruals.
| |
|
|
James Hardie nine months FY05 Management’s Analysis of Results
|
|
11 |
ABN 60 Indemnity
The company has undertaken a number of initiatives to ensure that asbestos-related claims
processing by the Medical Research and Compensation Foundation (MRCF) is not interrupted prior to
the entry into the Principal Agreement in accordance with the principles and within the proposed
timing described above. These initiatives are described further below, but the company believes
that the MRCF is unlikely to need to avail itself of the assistance which has been offered by the
company, on the basis that on 3 December 2004 and in part as a result of the initiatives taken by
the company, the MRCF received a payment of approximately A$88.5 million from ABN 60 for use in
processing and meeting asbestos-related injury claims.
The company facilitated the payment of such funds by granting an indemnity to the directors of ABN
60, which it announced on 16 November 2004. Under the terms of that indemnity, the company agreed
to meet any liability incurred by the ABN 60 directors resulting from the release of the A$88.5
million by ABN 60 to the MRCF. The company believes that the release of the funding by ABN 60 is in
accordance with law and contracts in place and therefore the company should not incur liability
under this indemnity.
Additionally, on 16 November 2004, the company offered to provide funding to the MRCF on an interim
basis for a period of up to six months from that date. Such funding would only be provided once
existing MRCF funds have been exhausted. The company believes, based on actuarial and legal advice
that claims against the MRCF should not exceed the funds which are available to the MRCF
(particularly in light of its receipt of the A$88.5 million described above) or which are expected
to become available to the MRCF during the period of the interim funding proposal. The company has
not recorded a provision for either the proposed indemnity or the potential payments under the
interim funding proposal.
MRCF
On the basis of the current cash and financial position of the MRCF subsidiaries (Amaca Pty Limited
and Amaba Pty Limited) and following the company’s entry into the Heads of Agreement, the
applications previously made to the Supreme Court of NSW for the appointment of a provisional
liquidator to the MRCF’s subsidiaries have been dismissed with their consent.
End.
Media/Analysts call:
Steve Ashe
Vice President Investor Relations
Telephone: 61 2 8274 5246
Mobile: 0408 164 011
Email: [email protected]
Facsimile: 61 2 8274 5218
The Management’s Analysis of Results and accompanying release and management presentation, along
with an audio webcast of the presentation, will be available from the Investor Relations website at
www.jameshardie.com
This Management’s Analysis of Results document forms part of a package of information about the
company’s results. It should be read in conjunction with the other parts of this package,
including a Media Release, a Management Presentation, a Financial Report and a Results at a
Glance document.
| |
|
|
James Hardie nine months FY05 Management’s Analysis of Results
|
|
12 |
Endnotes:
Volume and Average Net
Sales Price - Asia Pacific Fibre Cement - Adjusted:
In fiscal 2003 and 2004, our Asia Pacific Fibre Cement segment reported incorrect
volume figures due to errors when converting to our standard square feet metric and due
to our Philippines Fibre Cement business including intercompany volume during fiscal
2004. The following table presents adjusted volume and average net sales price for our
Asia Pacific Fibre Cement business segment. This Management’s Analysis of Results uses
these revised volume and average net sales price. These adjustments did not have a
material impact on total net sales or EBIT.
| |
|
|
|
|
|
|
|
|
|
|
|
|
|
|
|
|
| |
|
|
|
|
|
30 |
|
|
31 |
|
|
|
|
| |
|
30 June |
|
|
September |
|
|
December |
|
|
31 March |
|
| Fiscal 2003 |
|
2002 |
|
|
2002 |
|
|
2002 |
|
|
2003 |
|
Quarter |
|
|
|
|
|
|
|
|
|
|
|
|
|
|
|
|
Volume (mmsf1) |
|
|
83.1 |
|
|
|
90.6 |
|
|
|
88.7 |
|
|
|
87.5 |
|
Average net sales price per unit (per msf1) |
|
A$ |
888 |
|
|
A$ |
905 |
|
|
A$ |
898 |
|
|
A$ |
857 |
|
|
|
|
|
|
|
|
|
|
|
|
|
|
|
|
|
|
Year-to-date |
|
|
|
|
|
|
|
|
|
|
|
|
|
|
|
|
Volume (mmsf1) |
|
|
83.1 |
|
|
|
173.7 |
|
|
|
262.4 |
|
|
|
349.9 |
|
Average net sales price per unit (per msf1) |
|
A$ |
888 |
|
|
A$ |
897 |
|
|
A$ |
897 |
|
|
A$ |
887 |
|
| |
|
|
|
|
|
|
|
|
|
|
|
|
|
|
|
|
| |
|
|
|
|
|
30 |
|
|
31 |
|
|
|
|
| |
|
30 June |
|
|
September |
|
|
December |
|
|
31 March |
|
| Fiscal 2004 |
|
2003 |
|
|
2003 |
|
|
2003 |
|
|
2004 |
|
Quarter |
|
|
|
|
|
|
|
|
|
|
|
|
|
|
|
|
Volume (mmsf1) |
|
|
87.0 |
|
|
|
94.0 |
|
|
|
92.1 |
|
|
|
89.0 |
|
Average net sales price per unit (per msf1) |
|
A$ |
874 |
|
|
A$ |
865 |
|
|
A$ |
854 |
|
|
A$ |
854 |
|
|
|
|
|
|
|
|
|
|
|
|
|
|
|
|
|
|
Year-to-date |
|
|
|
|
|
|
|
|
|
|
|
|
|
|
|
|
Volume (mmsf1) |
|
|
87.0 |
|
|
|
181.0 |
|
|
|
273.1 |
|
|
|
362.1 |
|
Average net sales price per unit (per msf1) |
|
A$ |
874 |
|
|
A$ |
869 |
|
|
A$ |
864 |
|
|
A$ |
862 |
|
Net Sales - Philippines
Fibre Cement - Adjusted:
In fiscal 2004, our Philippines business incorrectly reported intercompany
transfers as external net sales and cost of sales. Adjustment to the Philippines Fibre
Cement discussion is necessary to provide an accurate quarter-to-quarter discussion of
Philippines Fibre Cement net sales. Therefore, for discussion purposes only, for the
Philippines Fibre Cement business, we adjusted the prior year Philippines Fibre Cement
net sales. We have not restated the Asia Pacific Fibre Cement business segment results
or the consolidated financial statements since these adjustments are not material to
our Asia Pacific Fibre Cement segment or to the consolidated financial statements taken
as a whole. The following table presents the adjustment to Philippines Fibre Cement net
sales for each quarter and year-to-date periods in fiscal 2004 (amounts in millions):
| |
|
|
|
|
|
|
|
|
|
|
|
|
|
|
|
|
| |
|
|
|
|
|
30 |
|
|
31 |
|
|
|
|
| |
|
30 June |
|
|
September |
|
|
December |
|
|
31 March |
|
| |
|
2003 |
|
|
2003 |
|
|
2003 |
|
|
2004 |
|
Quarters: |
|
|
|
|
|
|
|
|
|
|
|
|
|
|
|
|
Previously Reported |
|
US$ |
6.2 |
|
|
US$ |
6.9 |
|
|
US$ |
5.2 |
|
|
US$ |
5.9 |
|
Adjustment |
|
|
(1.4 |
) |
|
|
(1.2 |
) |
|
|
— |
|
|
|
(0.8 |
) |
| |
|
|
Adjusted Net Sales |
|
US$ |
4.8 |
|
|
US$ |
5.7 |
|
|
US$ |
5.2 |
|
|
US$ |
5.1 |
|
|
|
|
|
|
|
|
|
|
|
|
|
|
|
|
|
|
Year to date: |
|
|
|
|
|
|
|
|
|
|
|
|
|
|
|
|
Previously Reported |
|
US$ |
6.2 |
|
|
US$ |
13.1 |
|
|
US$ |
18.3 |
|
|
US$ |
24.2 |
|
Adjustment |
|
|
(1.4 |
) |
|
|
(2.6 |
) |
|
|
(2.6 |
) |
|
|
(3.4 |
) |
| |
|
|
Adjusted Net Sales |
|
US$ |
4.8 |
|
|
US$ |
10.5 |
|
|
US$ |
15.7 |
|
|
US$ |
20.8 |
|
| |
|
|
James Hardie nine months FY05 Management’s Analysis of Results
|
|
13 |
1Definitions
EBIT and EBIT Margin - EBIT is defined as operating income. EBIT margin is defined as
EBIT as a percentage of our net sales. We believe EBIT and EBIT margin to be relevant and useful
information as these are the primary measures used by our management to measure the operating
profit or loss of our business. EBIT is one of several metrics used by our management to measure
the earnings generated by our operations, excluding interest and income tax expenses. Additionally,
EBIT is believed to be a primary measure and terminology used by our Australian investors. EBIT
and EBIT margin should be considered in addition to, but not as a substitute for, other measures of
financial performance reported in accordance with accounting principles generally accepted in the
United States of America. EBIT and EBIT margin, as we have defined them, may not be comparable to
similarly titled measures reported by other companies.
EBIT and EBIT margin, as used in this document, are equivalent to the US GAAP measures of operating
income and operating income margin.
EBIT and EBIT Margin excluding costs associated with the SCI and associated developments -
not a measure of financial performance under US GAAP and should not be considered to be more
meaningful than EBIT and EBIT Margin. The company has included this financial measure to provide
investors with an alternative method for assessing the company’s operating results in a manner that
is focused on the performance of the company’s ongoing operations. The company’s management uses
this non-GAAP measure for the same purposes.
Operating profit from continuing operations excluding costs associated with the SCI and
associated developments – not a measure of financial performance under US GAAP and should not
be considered to be more meaningful than operating profit. The company has included this financial
measure to provide investors with an alternative method for assessing the company’s operating
results in a manner that is focused on the performance of the company’s ongoing operations. The
company’s management uses this non-GAAP measure for the same purposes.
Operating profit from continuing operations before income taxes - is equivalent to the US
GAAP measure of income from continuing operations before income taxes.
Operating profit from continuing operations - is equivalent to the US GAAP measure of
income from continuing operations.
Net operating profit including discontinued operations - is equivalent to the US GAAP
measure of net income.
mmsf – million square feet
msf – thousand square feet
Disclaimer
This Management’s Analysis of Results contains forward-looking statements. We may from time to
time make forward-looking statements in our periodic reports filed with the Securities and Exchange
Commission on Forms 20-F and 6-K, in our annual reports to shareholders, in offering circulars and
prospectuses, in media releases and other written materials and in oral statements made by our
officers, directors or employees to analysts, institutional investors, representatives of the media
and others. Examples of such forward-looking statements include:
| |
• |
projections of our operating results or financial condition; |
| |
| |
• |
statements of our plans, objectives or goals, including those relating to
competition, acquisitions, dispositions and our products; |
| |
| |
• |
statements about our future economic performance or that of the United States,
Australia or other countries in which we operate; and |
| |
| |
• |
statements about product or environmental liabilities. |
Words such as “believe,” “anticipate,” “plan,” “expect,” “intend,” “target,” “estimate,” “project,”
“predict,” “forecast,” “guideline,” “should,” “aim” and similar expressions are intended to
identify forward-looking statements but are not the exclusive means of identifying such statements.
|
|
|
| James Hardie nine months
FY05 Management’s Analysis of Results
|
|
|
| |
|
14 |
Forward-looking statements involve inherent risks and uncertainties. We caution you that a number
of important factors could cause actual results to differ materially from the plans, objectives,
expectations, estimates and intentions expressed in such forward-looking statements. These factors
include but are not limited to: all matters relating to or arising out of the prior manufacture of
asbestos by ABN 60 and certain former subsidiaries; competition and product pricing in the markets
in which we operate; general economic and market conditions; compliance with and possible changes
in environmental and health and safety laws; the successful transition of new senior management;
the success of our research and development efforts; the supply and cost of raw materials; our
reliance on a small number of product distributors; the consequences of product failures or
defects; exposure to environmental, asbestos or other legal proceedings; risks of conducting
business internationally; compliance with and changes in tax laws and treatments; and foreign
exchange risks. We caution you that the foregoing list of factors is not exclusive and that other
risks and uncertainties may cause actual results to differ materially from those in forward-looking
statements. Forward-looking statements speak only as of the date they are made.
James Hardie nine months FY05
Management’s Analysis of Results
15
INDEX
| |
|
|
|
|
|
|
| |
|
|
|
Page |
|
Item 1. |
|
Financial Statements |
|
|
|
|
|
|
|
|
|
|
|
|
|
Consolidated Balance Sheets as of 31 December 2004 and 31 March 2004 (unaudited) |
|
|
2 |
|
|
|
|
|
|
|
|
|
|
Consolidated Statements of Income for the Three and Nine Months Ended 31 December 2004 |
|
|
|
|
|
|
and 2003 (unaudited) |
|
|
3 |
|
|
|
|
|
|
|
|
|
|
Consolidated Statements of Cash Flows for the Nine Months Ended 31 December 2004 and |
|
|
|
|
|
|
2003 (unaudited) |
|
|
5 |
|
|
|
|
|
|
|
|
|
|
Consolidated Statements of Changes in Shareholders' Equity for the Nine Months Ended 31 December 2004 (unaudited) |
|
|
7 |
|
|
|
|
|
|
|
|
|
|
Notes to Consolidated Financial Statements (unaudited) |
|
|
8 |
|
|
|
|
|
|
|
|
Item 2. |
|
Quantitative and Qualitative Disclosures About Market Risk |
|
|
20 |
|
Item 1. Financial Statements
JAMES HARDIE INDUSTRIES N.V. AND SUBSIDIARIES
CONSOLIDATED BALANCE SHEETS
(Unaudited)
| |
|
|
|
|
|
|
|
|
|
|
|
|
|
|
|
|
| |
|
(Millions of US dollars) |
|
|
(Millions of Australian dollars) |
|
| |
|
31 December |
|
|
31 March |
|
|
31 December |
|
|
31 March |
|
| |
|
2004 |
|
|
2004 |
|
|
2004 |
|
|
2004 |
|
| |
|
|
|
|
ASSETS |
|
|
|
|
|
|
|
|
|
|
|
|
|
|
|
|
Current assets: |
|
|
|
|
|
|
|
|
|
|
|
|
|
|
|
|
Cash and cash equivalents |
|
$ |
73.5 |
|
|
$ |
72.3 |
|
|
A$ |
93.1 |
|
|
A$ |
95.1 |
|
Accounts and notes receivable, net of allowance for
doubtful accounts of $1.5 million (A$1.9 million) and
$1.2 million (A$1.6 million) as of 31 December 2004 and
31 March 2004, respectively |
|
|
106.3 |
|
|
|
118.4 |
|
|
|
134.6 |
|
|
|
155.8 |
|
Inventories |
|
|
93.3 |
|
|
|
103.2 |
|
|
|
118.1 |
|
|
|
135.8 |
|
Refundable income taxes |
|
|
14.4 |
|
|
|
37.8 |
|
|
|
18.2 |
|
|
|
49.7 |
|
Prepaid expenses and other current assets |
|
|
17.9 |
|
|
|
8.8 |
|
|
|
22.7 |
|
|
|
11.6 |
|
Deferred tax assets |
|
|
23.9 |
|
|
|
24.7 |
|
|
|
30.3 |
|
|
|
32.5 |
|
| |
|
|
|
|
Total current assets |
|
|
329.3 |
|
|
|
365.2 |
|
|
|
417.0 |
|
|
|
480.5 |
|
Long-term receivables and other assets |
|
|
2.9 |
|
|
|
9.8 |
|
|
|
3.7 |
|
|
|
12.9 |
|
Property, plant and equipment, net |
|
|
670.2 |
|
|
|
567.1 |
|
|
|
848.6 |
|
|
|
746.1 |
|
Intangible assets, net |
|
|
3.2 |
|
|
|
3.0 |
|
|
|
4.1 |
|
|
|
3.9 |
|
Prepaid pension cost |
|
|
14.9 |
|
|
|
14.1 |
|
|
|
18.9 |
|
|
|
18.5 |
|
Deferred tax assets |
|
|
14.6 |
|
|
|
12.0 |
|
|
|
18.5 |
|
|
|
15.8 |
|
| |
|
|
|
|
Total assets |
|
$ |
1,035.1 |
|
|
$ |
971.2 |
|
|
A$ |
1,310.8 |
|
|
A$ |
1,277.7 |
|
| |
|
|
|
|
LIABILITIES AND SHAREHOLDERS’ EQUITY |
|
|
|
|
|
|
|
|
|
|
|
|
|
|
|
|
Current liabilities: |
|
|
|
|
|
|
|
|
|
|
|
|
|
|
|
|
Accounts payable and accrued liabilities |
|
$ |
85.1 |
|
|
$ |
78.5 |
|
|
A$ |
107.8 |
|
|
A$ |
103.3 |
|
Current portion of long-term debt |
|
|
25.7 |
|
|
|
17.6 |
|
|
|
32.5 |
|
|
|
23.2 |
|
Short-term debt |
|
|
12.5 |
|
|
|
10.8 |
|
|
|
15.8 |
|
|
|
14.2 |
|
Accrued payroll and employee benefits |
|
|
32.8 |
|
|
|
41.1 |
|
|
|
41.5 |
|
|
|
54.1 |
|
Accrued product warranties |
|
|
8.9 |
|
|
|
9.7 |
|
|
|
11.3 |
|
|
|
12.8 |
|
Income taxes payable |
|
|
12.7 |
|
|
|
9.8 |
|
|
|
16.1 |
|
|
|
12.9 |
|
Other liabilities |
|
|
2.3 |
|
|
|
1.8 |
|
|
|
2.9 |
|
|
|
2.4 |
|
| |
|
|
|
|
Total current liabilities |
|
|
180.0 |
|
|
|
169.3 |
|
|
|
227.9 |
|
|
|
222.9 |
|
Long-term debt |
|
|
121.7 |
|
|
|
147.4 |
|
|
|
154.1 |
|
|
|
193.9 |
|
Deferred income taxes |
|
|
79.6 |
|
|
|
65.2 |
|
|
|
100.8 |
|
|
|
85.8 |
|
Accrued product warranties |
|
|
2.7 |
|
|
|
2.3 |
|
|
|
3.4 |
|
|
|
3.0 |
|
Other liabilities |
|
|
68.0 |
|
|
|
82.3 |
|
|
|
86.1 |
|
|
|
108.3 |
|
| |
|
|
|
|
Total liabilities |
|
|
452.0 |
|
|
|
466.5 |
|
|
A$ |
572.3 |
|
|
A$ |
613.9 |
|
| |
|
|
|
|
Commitments and contingencies (Note 8) |
|
|
|
|
|
|
|
|
|
|
|
|
|
|
|
|
|
|
|
|
|
|
|
|
|
|
|
|
|
|
|
|
|
Shareholders’ equity: |
|
|
|
|
|
|
|
|
|
|
|
|
|
|
|
|
Common stock, Euro 0.59 par value, 2.0 billion shares
authorised; 459,047,434 shares issued and
outstanding at 31 December 2004 and 458,558,436
shares issued and outstanding at 31 March 2004 |
|
|
245.6 |
|
|
|
245.2 |
|
|
|
|
|
|
|
|
|
Additional paid-in capital |
|
|
137.0 |
|
|
|
134.0 |
|
|
|
|
|
|
|
|
|
Retained earnings |
|
|
218.0 |
|
|
|
151.1 |
|
|
|
|
|
|
|
|
|
Employee loans |
|
|
(0.8 |
) |
|
|
(1.3 |
) |
|
|
|
|
|
|
|
|
Accumulated other comprehensive loss |
|
|
(16.7 |
) |
|
|
(24.3 |
) |
|
|
|
|
|
|
|
|
| |
|
|
|
|
|
|
|
|
|
|
Total shareholders’ equity |
|
|
583.1 |
|
|
|
504.7 |
|
|
|
|
|
|
|
|
|
| |
|
|
|
|
|
|
|
|
|
|
Total liabilities and shareholders’ equity |
|
$ |
1,035.1 |
|
|
$ |
971.2 |
|
|
|
|
|
|
|
|
|
| |
|
|
|
|
|
|
|
|
|
|
The accompanying notes are an integral part of these interim consolidated financial statements.
F-2
JAMES HARDIE INDUSTRIES N.V. AND SUBSIDIARIES
CONSOLIDATED STATEMENTS OF INCOME
(Unaudited)
| |
|
|
|
|
|
|
|
|
|
|
|
|
|
|
|
|
| |
|
Three Months |
|
|
Nine Months |
|
| |
|
Ended 31 December |
|
|
Ended 31 December |
|
| (Millions of US dollars, except per share data) |
|
2004 |
|
|
2003 |
|
|
2004 |
|
|
2003 |
|
| |
|
|
Net sales |
|
$ |
287.0 |
|
|
$ |
237.5 |
|
|
$ |
894.0 |
|
|
$ |
730.6 |
|
Cost of goods sold |
|
|
(190.3 |
) |
|
|
(150.0 |
) |
|
|
(588.9 |
) |
|
|
(461.4 |
) |
| |
|
|
|
|
Gross profit |
|
|
96.7 |
|
|
|
87.5 |
|
|
|
305.1 |
|
|
|
269.2 |
|
| |
Selling, general and administrative expenses |
|
|
(41.5 |
) |
|
|
(40.6 |
) |
|
|
(132.1 |
) |
|
|
(115.7 |
) |
Research and development expenses |
|
|
(6.1 |
) |
|
|
(5.7 |
) |
|
|
(16.4 |
) |
|
|
(16.1 |
) |
SCI and other related expenses |
|
|
(15.9 |
) |
|
|
— |
|
|
|
(24.4 |
) |
|
|
— |
|
Other operating income (expense) |
|
|
0.1 |
|
|
|
— |
|
|
|
(0.6 |
) |
|
|
— |
|
| |
|
|
|
|
Operating income |
|
|
33.3 |
|
|
|
41.2 |
|
|
|
131.6 |
|
|
|
137.4 |
|
| |
Interest expense |
|
|
(1.3 |
) |
|
|
(3.0 |
) |
|
|
(6.0 |
) |
|
|
(8.3 |
) |
Interest income |
|
|
0.6 |
|
|
|
0.2 |
|
|
|
1.5 |
|
|
|
0.8 |
|
Other income (expense) |
|
|
0.4 |
|
|
|
(0.1 |
) |
|
|
(1.5 |
) |
|
|
(3.4 |
) |
| |
|
|
|
|
Income from continuing operations before income taxes |
|
|
33.0 |
|
|
|
38.3 |
|
|
|
125.6 |
|
|
|
126.5 |
|
| |
Income tax expense |
|
|
(13.2 |
) |
|
|
(10.0 |
) |
|
|
(44.0 |
) |
|
|
(32.5 |
) |
| |
|
|
|
|
Income from continuing operations |
|
|
19.8 |
|
|
|
28.3 |
|
|
|
81.6 |
|
|
|
94.0 |
|
| |
|
|
|
|
| |
Discontinued operations: |
|
|
|
|
|
|
|
|
|
|
|
|
|
|
|
|
(Loss) income from discontinued operations, net of income
tax benefit of $0.2 million for the three months ended
31 December 2004 and net of income tax benefit (expense)
of $0.2 million and ($0.1) million for the nine months
ended 31 December 2004 and 2003, respectively |
|
|
(0.3 |
) |
|
|
— |
|
|
|
(0.3 |
) |
|
|
0.2 |
|
| |
Gain (loss) on disposal of discontinued operations, net of
income tax benefit of $4.3 million for the three
months ended 31 December 2003 and net of
income tax benefit of $4.4 million for the nine months
ended 31 December 2003 |
|
|
— |
|
|
|
1.8 |
|
|
|
(0.7 |
) |
|
|
3.4 |
|
| |
|
|
|
|
(Loss) income from discontinued operations |
|
|
(0.3 |
) |
|
|
1.8 |
|
|
|
(1.0 |
) |
|
|
3.6 |
|
| |
|
|
|
|
Net income |
|
$ |
19.5 |
|
|
$ |
30.1 |
|
|
$ |
80.6 |
|
|
$ |
97.6 |
|
| |
|
|
|
|
Income per
share - basic: |
|
|
|
|
|
|
|
|
|
|
|
|
|
|
|
|
Income from continuing operations |
|
$ |
0.04 |
|
|
$ |
0.06 |
|
|
$ |
0.18 |
|
|
$ |
0.20 |
|
(Loss) income from discontinued operations |
|
|
— |
|
|
|
0.01 |
|
|
|
— |
|
|
|
0.01 |
|
| |
|
|
|
|
Net income
per share - basic |
|
$ |
0.04 |
|
|
$ |
0.07 |
|
|
$ |
0.18 |
|
|
$ |
0.21 |
|
| |
|
|
|
|
Income per
share - diluted: |
|
|
|
|
|
|
|
|
|
|
|
|
|
|
|
|
Income from continuing operations |
|
$ |
0.04 |
|
|
$ |
0.06 |
|
|
$ |
0.18 |
|
|
$ |
0.20 |
|
(Loss) income from discontinued operations |
|
|
— |
|
|
|
0.01 |
|
|
|
— |
|
|
|
0.01 |
|
| |
|
|
|
|
Net income
per share - diluted |
|
$ |
0.04 |
|
|
$ |
0.07 |
|
|
$ |
0.18 |
|
|
$ |
0.21 |
|
| |
|
|
|
|
Weighted average common shares outstanding (Millions): |
|
|
|
|
|
|
|
|
|
|
|
|
|
|
|
|
Basic |
|
|
458.9 |
|
|
|
458.2 |
|
|
|
458.7 |
|
|
|
457.9 |
|
Diluted |
|
|
461.1 |
|
|
|
461.9 |
|
|
|
460.7 |
|
|
|
461.3 |
|
The accompanying notes are an integral part of these interim consolidated financial statements.
F-3
JAMES HARDIE INDUSTRIES N.V. AND SUBSIDIARIES
CONSOLIDATED STATEMENTS OF INCOME
(Unaudited)
| |
|
|
|
|
|
|
|
|
|
|
|
|
|
|
|
|
| |
|
Three Months |
|
|
Nine Months |
|
| |
|
Ended 31 December |
|
|
Ended 31 December |
|
| (Millions of Australian dollars, except per share data) |
|
2004 |
|
|
2003 |
|
|
2004 |
|
|
2003 |
|
| |
Net sales |
|
A$ |
394.6 |
|
|
A$ |
354.4 |
|
|
A$ |
1,229.1 |
|
|
A$ |
1,090.3 |
|
Cost of goods sold |
|
|
(261.6 |
) |
|
|
(223.9 |
) |
|
|
(809.6 |
) |
|
|
(688.6 |
) |
| |
|
|
|
|
Gross profit |
|
|
133.0 |
|
|
|
130.5 |
|
|
|
419.5 |
|
|
|
401.7 |
|
| |
Selling, general and administrative expenses |
|
|
(57.1 |
) |
|
|
(60.6 |
) |
|
|
(181.6 |
) |
|
|
(172.7 |
) |
Research and development expenses |
|
|
(8.4 |
) |
|
|
(8.5 |
) |
|
|
(22.5 |
) |
|
|
(24.0 |
) |
SCI and other related expenses |
|
|
(21.9 |
) |
|
|
— |
|
|
|
(33.5 |
) |
|
|
— |
|
Other operating income (expense) |
|
|
0.1 |
|
|
|
— |
|
|
|
(0.8 |
) |
|
|
— |
|
| |
|
|
|
|
Operating income |
|
|
45.7 |
|
|
|
61.4 |
|
|
|
181.1 |
|
|
|
205.0 |
|
| |
Interest expense |
|
|
(1.8 |
) |
|
|
(4.5 |
) |
|
|
(8.2 |
) |
|
|
(12.4 |
) |
Interest income |
|
|
0.8 |
|
|
|
0.3 |
|
|
|
2.1 |
|
|
|
1.2 |
|
Other income (expense) |
|
|
0.5 |
|
|
|
(0.1 |
) |
|
|
(2.1 |
) |
|
|
(5.1 |
) |
| |
|
|
|
|
Income from continuing operations before income taxes |
|
|
45.2 |
|
|
|
57.1 |
|
|
|
172.9 |
|
|
|
188.7 |
|
| |
Income tax expense |
|
|
(18.1 |
) |
|
|
(14.9 |
) |
|
|
(60.5 |
) |
|
|
(48.5 |
) |
| |
|
|
|
|
Income from continuing operations |
|
|
27.1 |
|
|
|
42.2 |
|
|
|
112.4 |
|
|
|
140.2 |
|
| |
|
|
|
|
Discontinued operations: |
|
|
|
|
|
|
|
|
|
|
|
|
|
|
|
|
(Loss) income from discontinued operations, net of income
tax benefit of A$0.3 million for the three months ended
31 December 2004 and net of income tax benefit (expense)
of A$0.3 million and (A$0.1) million or the nine months
ended 31 December 2004 and 2003, respectively |
|
|
(0.4 |
) |
|
|
— |
|
|
|
(0.4 |
) |
|
|
0.3 |
|
| |
Gain (loss) on disposal of discontinued operations, net of
income tax benefit of A$6.4 million for the three
months ended 31 December 2003 and net of
income tax benefit of A$6.6 million for the nine months
ended 31 December 2003 |
|
|
— |
|
|
|
2.7 |
|
|
|
(1.0 |
) |
|
|
5.1 |
|
| |
|
|
|
|
(Loss) income from discontinued operations |
|
|
(0.4 |
) |
|
|
2.7 |
|
|
|
(1.4 |
) |
|
|
5.4 |
|
| |
|
|
|
|
Net income |
|
A$ |
26.7 |
|
|
A$ |
44.9 |
|
|
A$ |
111.0 |
|
|
A$ |
145.6 |
|
| |
|
|
|
|
Income per
share - basic: |
|
|
|
|
|
|
|
|
|
|
|
|
|
|
|
|
Income from continuing operations |
|
A$ |
0.06 |
|
|
A$ |
0.09 |
|
|
A$ |
0.25 |
|
|
A$ |
0.31 |
|
(Loss) income from discontinued operations |
|
|
— |
|
|
|
0.01 |
|
|
|
(0.01 |
) |
|
|
0.01 |
|
| |
|
|
|
|
Net income
per share - basic |
|
A$ |
0.06 |
|
|
A$ |
0.10 |
|
|
A$ |
0.24 |
|
|
A$ |
0.32 |
|
| |
|
|
|
|
Income per
share - diluted: |
|
|
|
|
|
|
|
|
|
|
|
|
|
|
|
|
Income from continuing operations |
|
A$ |
0.06 |
|
|
A$ |
0.09 |
|
|
A$ |
0.24 |
|
|
A$ |
0.31 |
|
(Loss) income from discontinued operations |
|
|
— |
|
|
|
0.01 |
|
|
|
— |
|
|
|
0.01 |
|
| |
|
|
|
|
Net income
per share - diluted |
|
A$ |
0.06 |
|
|
A$ |
0.10 |
|
|
A$ |
0.24 |
|
|
A$ |
0.32 |
|
| |
|
|
|
|
Weighted average common shares outstanding (Millions): |
|
|
|
|
|
|
|
|
|
|
|
|
|
|
|
|
Basic |
|
|
458.9 |
|
|
|
458.2 |
|
|
|
458.7 |
|
|
|
457.9 |
|
Diluted |
|
|
461.1 |
|
|
|
461.9 |
|
|
|
460.7 |
|
|
|
461.3 |
|
The accompanying notes are an integral part of these interim consolidated financial statements.
F-4
JAMES HARDIE INDUSTRIES N.V. AND SUBSIDIARIES
CONSOLIDATED STATEMENTS OF CASH FLOWS
(Unaudited)
| |
|
|
|
|
|
|
|
|
| |
|
Nine Months |
|
| |
|
Ended 31 December |
|
| (Millions of US dollars) |
|
2004 |
|
|
2003 |
|
| |
Cash flows from operating activities: |
|
|
|
|
|
|
|
|
Net income |
|
$ |
80.6 |
|
|
$ |
97.6 |
|
Adjustments to reconcile net income to net cash provided by operating
activities: |
|
|
|
|
|
|
|
|
Gain on disposal of subsidiaries and businesses |
|
|
— |
|
|
|
(3.4 |
) |
Depreciation and amortisation |
|
|
26.6 |
|
|
|
26.2 |
|
Deferred income taxes |
|
|
13.3 |
|
|
|
9.8 |
|
Prepaid pension cost |
|
|
2.1 |
|
|
|
— |
|
Tax benefit from stock options exercised |
|
|
0.3 |
|
|
|
0.1 |
|
Stock compensation |
|
|
1.7 |
|
|
|
2.0 |
|
Other |
|
|
2.8 |
|
|
|
0.2 |
|
Changes in operating assets and liabilities: |
|
|
|
|
|
|
|
|
Accounts receivable |
|
|
15.5 |
|
|
|
1.6 |
|
Inventories |
|
|
11.6 |
|
|
|
(12.3 |
) |
Prepaids and other current assets |
|
|
12.2 |
|
|
|
13.5 |
|
Accounts payable |
|
|
4.9 |
|
|
|
(12.4 |
) |
Accrued liabilities and other liabilities |
|
|
(19.7 |
) |
|
|
(0.2 |
) |
|
|
|
|
|
|
|
Net cash provided by operating activities |
|
|
151.9 |
|
|
|
122.7 |
|
|
|
|
|
|
|
|
Cash flows from investing activities: |
|
|
|
|
|
|
|
|
Purchases of property, plant and equipment |
|
|
(125.9 |
) |
|
|
(56.5 |
) |
Proceeds from sale of property, plant and equipment |
|
|
3.4 |
|
|
|
0.1 |
|
Proceeds from disposal of subsidiaries and businesses, net of
cash invested |
|
|
— |
|
|
|
5.0 |
|
Collections on loans receivable |
|
|
0.4 |
|
|
|
0.7 |
|
|
|
|
|
|
|
|
Net cash used in investing activities |
|
|
(122.1 |
) |
|
|
(50.7 |
) |
|
|
|
|
|
|
|
Cash flows from financing activities: |
|
|
|
|
|
|
|
|
Net proceeds from line of credit |
|
|
0.5 |
|
|
|
0.5 |
|
Repayments of long-term debt |
|
|
(17.6 |
) |
|
|
— |
|
Proceeds from issuance of shares |
|
|
1.4 |
|
|
|
2.8 |
|
Repayments of capital |
|
|
— |
|
|
|
(68.7 |
) |
Dividends paid |
|
|
(13.7 |
) |
|
|
(22.9 |
) |
|
|
|
|
|
|
|
Net cash used in financing activities |
|
|
(29.4 |
) |
|
|
(88.3 |
) |
|
|
|
|
|
|
|
Effects of exchange rate changes on cash |
|
|
0.8 |
|
|
|
0.2 |
|
Net increase in cash and cash equivalents |
|
|
1.2 |
|
|
|
(16.1 |
) |
Cash and cash equivalents at beginning of period |
|
|
72.3 |
|
|
|
54.6 |
|
|
|
|
|
|
|
|
Cash and cash equivalents at end of period |
|
|
73.5 |
|
|
|
38.5 |
|
|
|
|
|
|
|
|
Components of cash and cash equivalents: |
|
|
|
|
|
|
|
|
Cash at bank and on hand |
|
|
24.5 |
|
|
|
11.5 |
|
Short-term deposits |
|
|
49.0 |
|
|
|
27.0 |
|
|
|
|
|
|
|
|
Cash and cash equivalents at end of period |
|
$ |
73.5 |
|
|
$ |
38.5 |
|
|
|
|
|
|
|
|
The accompanying notes are an integral part of these interim consolidated financial statements.
F-5
JAMES HARDIE INDUSTRIES N.V. AND SUBSIDIARIES
CONSOLIDATED STATEMENTS OF CASH FLOWS
(Unaudited)
| |
|
|
|
|
|
|
|
|
| |
|
Nine Months |
|
| |
|
Ended 31 December |
|
| (Millions of Australian dollars) |
|
2004 |
|
|
2003 |
|
| |
Cash flows from operating activities: |
|
|
|
|
|
|
|
|
Net income |
|
A$ |
111.0 |
|
|
A$ |
145.6 |
|
Adjustments to reconcile net income to net cash provided by operating
activities: |
|
|
|
|
|
|
|
|
Gain on disposal of subsidiaries and businesses |
|
|
— |
|
|
|
(5.1 |
) |
Depreciation and amortisation |
|
|
36.6 |
|
|
|
39.1 |
|
Deferred income taxes |
|
|
18.3 |
|
|
|
14.6 |
|
Prepaid pension cost |
|
|
2.9 |
|
|
|
— |
|
Tax benefit from stock options exercised |
|
|
0.4 |
|
|
|
0.1 |
|
Stock compensation |
|
|
2.3 |
|
|
|
3.0 |
|
Other |
|
|
3.8 |
|
|
|
0.3 |
|
Changes in operating assets and liabilities: |
|
|
|
|
|
|
|
|
Accounts receivable |
|
|
21.3 |
|
|
|
2.4 |
|
Inventories |
|
|
15.9 |
|
|
|
(18.4 |
) |
Prepaids and other current assets |
|
|
16.8 |
|
|
|
20.1 |
|
Accounts payable |
|
|
6.7 |
|
|
|
(18.5 |
) |
Accrued liabilities and other liabilities |
|
|
(27.1 |
) |
|
|
(0.4 |
) |
|
|
|
|
|
|
|
Net cash provided by operating activities |
|
|
208.9 |
|
|
|
182.8 |
|
|
|
|
|
|
|
|
Cash flows from investing activities: |
|
|
|
|
|
|
|
|
Purchases of property, plant and equipment |
|
|
(173.1 |
) |
|
|
(84.3 |
) |
Proceeds from sale of property, plant and equipment |
|
|
4.7 |
|
|
|
0.1 |
|
Proceeds from disposal of subsidiaries and businesses, net of
cash invested |
|
|
— |
|
|
|
7.5 |
|
Collections on loans receivable |
|
|
0.5 |
|
|
|
1.0 |
|
|
|
|
|
|
|
|
Net cash used in investing activities |
|
|
(167.9 |
) |
|
|
(75.7 |
) |
|
|
|
|
|
|
|
Cash flows from financing activities: |
|
|
|
|
|
|
|
|
Net proceeds from line of credit |
|
|
0.7 |
|
|
|
0.7 |
|
Repayments of long-term debt |
|
|
(24.2 |
) |
|
|
— |
|
Proceeds from issuance of shares |
|
|
1.9 |
|
|
|
4.2 |
|
Repayments of capital |
|
|
— |
|
|
|
(102.5 |
) |
Dividends paid |
|
|
(18.8 |
) |
|
|
(34.2 |
) |
|
|
|
|
|
|
|
Net cash used in financing activities |
|
|
(40.4 |
) |
|
|
(131.8 |
) |
|
|
|
|
|
|
|
Effects of exchange rate changes on cash |
|
|
(2.6 |
) |
|
|
(14.4 |
) |
Net increase in cash and cash equivalents |
|
|
(2.0 |
) |
|
|
(39.1 |
) |
Cash and cash equivalents at beginning of period |
|
|
95.1 |
|
|
|
90.4 |
|
|
|
|
|
|
|
|
Cash and cash equivalents at end of period |
|
|
93.1 |
|
|
|
51.3 |
|
|
|
|
|
|
|
|
Components of cash and cash equivalents: |
|
|
|
|
|
|
|
|
Cash at bank and on hand |
|
|
31.0 |
|
|
|
15.3 |
|
Short-term deposits |
|
|
62.1 |
|
|
|
36.0 |
|
|
|
|
|
|
|
|
Cash and cash equivalents at end of period |
|
A$ |
93.1 |
|
|
A$ |
51.3 |
|
|
|
|
|
|
|
|
The accompanying notes are an integral part of these interim consolidated financial statements.
F-6
JAMES HARDIE INDUSTRIES N.V. AND SUBSIDIARIES
CONSOLIDATED STATEMENTS OF CHANGES IN SHAREHOLDERS’ EQUITY
(Unaudited)
| |
|
|
|
|
|
|
|
|
|
|
|
|
|
|
|
|
|
|
|
|
|
|
|
|
| |
|
|
|
|
|
|
|
|
|
|
|
|
|
|
|
|
|
Accumulated |
|
|
|
|
| |
|
|
|
|
|
Additional |
|
|
|
|
|
|
|
|
|
|
Other |
|
|
|
|
| |
|
Common |
|
|
Paid-in |
|
|
Retained |
|
|
Employee |
|
|
Comprehensive |
|
|
|
|
| (Millions of US dollars) |
|
Stock |
|
|
Capital |
|
|
Earnings |
|
|
Loans |
|
|
Income (Loss) |
|
|
Total |
|
| |
Balances as of 31 March 2004 |
|
$ |
245.2 |
|
|
$ |
134.0 |
|
|
$ |
151.1 |
|
|
$ |
(1.3 |
) |
|
$ |
(24.3 |
) |
|
$ |
504.7 |
|
| |
Comprehensive income: |
|
|
|
|
|
|
|
|
|
|
|
|
|
|
|
|
|
|
|
|
|
|
|
|
Net income |
|
|
— |
|
|
|
— |
|
|
|
80.6 |
|
|
|
— |
|
|
|
|
|
|
|
80.6 |
|
Other comprehensive income: |
|
|
|
|
|
|
|
|
|
|
|
|
|
|
|
|
|
|
|
|
|
|
|
|
Amortisation of unrealised transition
loss on derivative instruments |
|
|
— |
|
|
|
— |
|
|
|
— |
|
|
|
— |
|
|
|
0.9 |
|
|
|
0.9 |
|
Foreign currency translation gain |
|
|
— |
|
|
|
— |
|
|
|
— |
|
|
|
— |
|
|
|
6.7 |
|
|
|
6.7 |
|
| |
|
|
Other comprehensive income |
|
|
— |
|
|
|
— |
|
|
|
— |
|
|
|
— |
|
|
|
7.6 |
|
|
|
7.6 |
|
|
|
|
|
|
|
|
|
|
|
|
|
|
|
|
|
|
|
|
|
|
|
|
Total comprehensive income |
|
|
|
|
|
|
|
|
|
|
|
|
|
|
|
|
|
|
|
|
|
|
88.2 |
|
Dividends paid |
|
|
— |
|
|
|
— |
|
|
|
(13.7 |
) |
|
|
— |
|
|
|
— |
|
|
|
(13.7 |
) |
Stock compensation |
|
|
— |
|
|
|
1.7 |
|
|
|
— |
|
|
|
— |
|
|
|
— |
|
|
|
1.7 |
|
Tax benefit from stock options
exercised |
|
|
— |
|
|
|
0.3 |
|
|
|
— |
|
|
|
— |
|
|
|
— |
|
|
|
0.3 |
|
Employee loans movement |
|
|
— |
|
|
|
— |
|
|
|
— |
|
|
|
0.5 |
|
|
|
— |
|
|
|
0.5 |
|
Stock options exercised |
|
|
0.4 |
|
|
|
1.0 |
|
|
|
— |
|
|
|
— |
|
|
|
— |
|
|
|
1.4 |
|
| |
|
|
Balances as of 31 December 2004 |
|
$ |
245.6 |
|
|
$ |
137.0 |
|
|
$ |
218.0 |
|
|
$ |
(0.8 |
) |
|
$ |
(16.7 |
) |
|
$ |
583.1 |
|
| |
|
|
The accompanying notes are an integral part of these interim consolidated financial statements.
F-7
JAMES HARDIE INDUSTRIES N.V. AND SUBSIDIARIES
NOTES TO CONSOLIDATED FINANCIAL STATEMENTS
(Unaudited)
1. Basis of Presentation
The consolidated financial statements represent the financial position and results of operations of James Hardie Industries
N.V. (“JHI NV”) and its wholly owned subsidiaries, collectively referred to as either the “Company” or “James Hardie,” unless
the context indicates otherwise.
In the opinion of management, the accompanying financial statements reflect all adjustments, which are of a normal
recurring nature, necessary for a fair statement of financial position as of 31 December and 31 March 2004 and the results
of operations for the three and nine months ended 31 December 2004 and 2003 and cash flows for the nine months ended
31 December 2004 and 2003. These consolidated financial statements and notes are to be read in conjunction with the
audited consolidated financial statements of James Hardie Industries N.V. and Subsidiaries for the three years ended 31
March 2004. The results of operations for the nine months ended 31 December 2004 are not necessarily indicative of the
results to be expected for the full fiscal year ending 31 March 2005.
Convenience Translation
The assets, liabilities, income statement and cash flows of the Company have been presented with accompanying
Australian dollar (A$) convenience translations. These A$ amounts are presented solely for the convenience of the reader
and are not prepared in accordance with accounting principles generally accepted in the United States of America. No
representation is made that the US dollar amounts shown could have been, or could be converted into A$ at that or any
other rate. The exchange rates used to calculate the convenience translations are as follows (US$1 = A$):
| |
|
|
|
|
|
|
|
|
|
|
|
|
| |
|
31 March |
|
|
31 December |
|
| |
|
2004 |
|
|
2004 |
|
|
2003 |
|
| |
|
|
Assets and liabilities |
|
|
1.3156 |
|
|
|
1.2662 |
|
|
|
n/a |
|
Income statement |
|
|
n/a |
|
|
|
1.3748 |
|
|
|
1.4924 |
|
Cash flows
- - beginning cash |
|
|
n/a |
|
|
|
1.3156 |
|
|
|
1.6559 |
|
Cash flows - ending cash |
|
|
n/a |
|
|
|
1.2662 |
|
|
|
1.3314 |
|
Cash flows - current period movements |
|
|
n/a |
|
|
|
1.3748 |
|
|
|
1.4924 |
|
2. Summary of Significant Accounting Policies
Reclassifications
Certain prior year balances have been reclassified to conform with the current year presentation.
Earnings per Share
The Company is required to disclose basic and diluted earnings per share (“EPS”). Basic EPS is calculated using income
divided by the weighted average number of common shares outstanding during the period. Diluted EPS is similar to basic
EPS except that the weighted average number of common shares outstanding is increased to include the number of
additional common shares calculated using the treasury method that would have been outstanding if the dilutive potential
common shares, such as options, had been issued. Accordingly, basic and dilutive common shares outstanding used in
determining net income per share are as follows:
| |
|
|
|
|
|
|
|
|
|
|
|
|
|
|
|
|
| |
|
Three Months |
|
|
Nine Months |
|
| |
|
Ended 31 December |
|
|
Ended 31 December |
|
| (Millions) |
|
2004 |
|
|
2003 |
|
|
2004 |
|
|
2003 |
|
| |
Basic common shares outstanding |
|
|
458.9 |
|
|
|
458.2 |
|
|
|
458.7 |
|
|
|
457.9 |
|
Dilutive effect of stock options |
|
|
2.2 |
|
|
|
3.7 |
|
|
|
2.0 |
|
|
|
3.4 |
|
| |
|
|
|
|
Diluted common shares outstanding |
|
|
461.1 |
|
|
|
461.9 |
|
|
|
460.7 |
|
|
|
461.3 |
|
| |
|
|
|
|
Potential common shares of 7.7 million and 8.8 million for the three and nine months ended 31 December 2004,
respectively, have been excluded from the calculation of diluted shares outstanding because the effect of their
inclusion would be anti-dilutive.
F-8
JAMES HARDIE INDUSTRIES N.V. AND SUBSIDIARIES
NOTES TO CONSOLIDATED FINANCIAL STATEMENTS (Continued)
(Unaudited)
Advertising
The Company expenses the production costs of advertising the first time the advertising takes place. Advertising expense
was $3.7 million and $3.7 million for the three months ended 31 December 2004 and 2003, respectively, and $12.8 million
and $10.8 million for the nine months ended 31 December 2004 and 2003, respectively.
Stock-Based Compensation
The Company estimates the fair value of its stock option grants on the date of grant using the Black-Scholes option-pricing
model and recognises this value as compensation expense over the periods in which the options vest. Accordingly, the
Company recognised stock-based compensation expense (included in selling, general and administrative expenses) of
$0.5 million and $0.8 million for the three months ended 31 December 2004 and 2003, respectively, and $1.7 million and
$2.0 million for the nine months ended 31 December 2004 and 2003, respectively.
Recent Accounting Pronouncements
Employers’ Disclosures about Pensions and Other Postretirement Benefits
In December 2003, the
FASB issued Statement of Financial Accounting Standards No.132 (revised 2003) (“SFAS No. 132R”),
“Employers’ Disclosures about Pensions and Other Postretirement Benefits, an amendment of FASB Statement 87,
“Employers’ Accounting for Pensions,” No. 88, “Employers’ Accounting for Settlement and Curtailments of Defined Benefit
Pension Plans and for Termination Benefits,” and No. 106, “Employers’ Accounting for Postretirement Benefits Other than
Pensions,” which it replaces. SFAS No. 132R requires additional disclosures about the assets, obligations, cash flows and
net periodic benefit/cost of defined benefit pension plans and other defined benefit postretirement plans. SFAS No. 132R is
effective for foreign plans for fiscal years ending after 15 September 2004 and for interim periods beginning after 15
December 2003. The adoption of this standard did not have a significant impact on the Company’s consolidated financial
statements.
Consolidation of Variable Interest Entities
In December 2003, the FASB issued FASB Interpretation No. (“FIN”) 46 (revised December 2003), “Consolidation of
Variable Interest Entities” (“FIN 46R”), which addresses how a business should evaluate whether it has a controlling
financial interest in an entity through means other than voting rights and accordingly should consolidate the entity. FIN
46R replaced FIN 46 which was issued in January 2003. FIN 46 or FIN 46R applies immediately to entities created
after 31 January 2003 and no later than the end of the first reporting period that ended after 15 December 2003 to
entities considered to be special-purpose entities (“SPEs”). FIN 46R is effective for all other entities no later than the
end of the first interim or annual reporting period ending after 15 March 2004. The adoption of the provisions of FIN 46
or FIN 46R relative to SPEs and for entities created after 31 January 2003 did not have a material impact on the
Company’s consolidated financial statements. The adoption of the other provisions of FIN 46R did not have a material
impact on the Company’s consolidated financial statements.
The Meaning of Other-Than-Temporary Impairment and its Application to Certain Investments
In March 2004, the Emerging Issues Task Force (“EITF”) ratified the provisions of Issue 03-01, “The Meaning of
Other-Than-Temporary Impairment and its Application to Certain Investments” (“Issue 03-01”), which clarifies the definition
of other-than-temporary impairment for certain investments accounted for under the cost method. The recognition and
measurement guidance in Issue 03-01 should be applied to other-than-temporary impairment evaluations in reporting
periods beginning after 15 June 2004. For all other investments within the scope of this issue, the disclosure requirements
are effective for fiscal years ending after 15 June 2004. The adoption of this issue did not have an impact on the
Company’s consolidated financial statements.
F-9
JAMES HARDIE INDUSTRIES N.V. AND SUBSIDIARIES
NOTES TO CONSOLIDATED FINANCIAL STATEMENTS (Continued)
(Unaudited)
Inventory Costs
In November 2004, the FASB issued Statement of Financial Accounting Standards No. 151 (“SFAS No.151”), “Inventory
Costs - an amendment of ARB No. 43, Chapter 4.” SFAS No. 151 requires abnormal amounts of inventory costs related to
idle facility, freight handling and wasted material expenses to be recognized as current period charges. Additionally, SFAS
No. 151 requires that allocation of fixed production overheads to the costs of conversion be based on the normal capacity of
the production facilities. SFAS No. 151 is effective for fiscal years beginning after 15 June 2005. The Company is in the
process of assessing the impact that SFAS No. 151 will have on its consolidated financial statements.
American Jobs Creation Act
In October 2004, the President of the Untied States signed into law the American Jobs Creation Act (the “Act”). The Act
allows for a US federal income tax deduction for a percentage of income earned from certain US production activities. Based
on the effective date of the Act, the Company will be eligible for this deduction in the first quarter of fiscal 2006. Additionally, in
December 2004, the FASB issued FASB Staff Position 109-1, “Application of FASB Statement No. 109, Accounting for
Income Taxes (“SFAS No. 109”), to the Tax Deduction on Qualified Production Activities Provided by the American Jobs
Creation Act of 2004” (“FSP 109-1”). FSP 109-1, which was effective upon issuance, states the deduction under this
provision of the Act should be accounted for as a special deduction in accordance with SFAS No 109. The Company is in
the process of quantifying the impact this provision of the Act will have on the Company’s consolidated financial statements.
The Act also allows for an 85% dividends received deduction on the repatriation of certain earnings of foreign subsidiaries. In
December 2004, the FASB issued FASB Staff Position 109-2, “Accounting and Disclosure Guidance for the Foreign
Earnings Repatriation Provision within the American Jobs Creation Act of 2004” (“FSP 109-2”). FSP 109-2, which was
effective upon issuance, allows companies time beyond the financial reporting period of enactment to evaluate the effect of
the Act on its plan for reinvestment or repatriation of foreign earnings for purposes of applying SFAS No. 109. Additionally,
FSP 109-2 provides guidance regarding the required disclosures surrounding a company’s reinvestment or repatriation of
foreign earnings. The Company continues to evaluate this provision of the Act and as such, has not quantified the impact
this provision will have on the Company’s consolidated financial statements.
3. Inventories
Inventories consist of the following components:
| |
|
|
|
|
|
|
|
|
| |
|
31 December |
|
|
31 March |
|
| (Millions of US dollars) |
|
2004 |
|
|
2004 |
|
| |
Finished goods |
|
$ |
67.2 |
|
|
$ |
76.7 |
|
Work-in-process |
|
|
7.7 |
|
|
|
6.4 |
|
Raw materials and supplies |
|
|
21.2 |
|
|
|
22.3 |
|
Provision for obsolete finished goods and raw materials |
|
|
(2.8 |
) |
|
|
(2.2 |
) |
| |
|
|
Total inventories |
|
$ |
93.3 |
|
|
$ |
103.2 |
|
| |
|
|
F-10
JAMES HARDIE INDUSTRIES N.V. AND SUBSIDIARIES
NOTES TO CONSOLIDATED FINANCIAL STATEMENTS (Continued)
(Unaudited)
The Company sponsors a retirement plan for its Australian employees that is accounted for as a defined benefit plan.
Pension expense is determined using various actuarial cost methods to estimate the total benefits ultimately payable to
participants and allocates this cost to service periods. The actuarial assumptions used to calculate pension costs are
reviewed annually. The Company made contributions of $0.5 million and $1.7 million for the three and nine months ended
31 December 2004, respectively. The Company expects to make a contribution to the pension plan of approximately $0.6
million for the remainder of fiscal year 2005.
The following are the components of net periodic pension cost for the Australian defined benefit pension plan:
| |
|
|
|
|
|
|
|
|
|
|
|
|
|
|
|
|
| |
|
Three Months |
|
|
Nine Months |
|
| |
|
Ended 31 December |
|
|
Ended 31 December |
|
| (Millions of US dollars) |
|
2004 |
|
|
2003 |
|
|
2004 |
|
|
2003 |
|
| |
Service cost |
|
$ |
0.8 |
|
|
$ |
0.7 |
|
|
$ |
2.3 |
|
|
$ |
2.1 |
|
Interest cost |
|
|
0.6 |
|
|
|
0.8 |
|
|
|
1.8 |
|
|
|
2.2 |
|
Expected return on plan assets |
|
|
(0.8 |
) |
|
|
(0.9 |
) |
|
|
(2.3 |
) |
|
|
(2.6 |
) |
Amortisation of unrecognised
transition costs |
|
|
— |
|
|
|
(0.3 |
) |
|
|
— |
|
|
|
(0.7 |
) |
Recognised net actuarial loss |
|
|
0.1 |
|
|
|
0.1 |
|
|
|
0.3 |
|
|
|
0.3 |
|
| |
|
|
|
|
Net periodic pension cost |
|
$ |
0.7 |
|
|
$ |
0.4 |
|
|
$ |
2.1 |
|
|
$ |
1.3 |
|
| |
|
|
|
|
| 5. |
Discontinued Operations |
Building Systems
On 30 May 2003, the Company sold its New Zealand Building Systems business to a third party. A gain of $1.9
million represented the excess of net proceeds from the sale of $6.7 million over the net book value of assets
sold of $4.8 million. The proceeds from the sale were comprised of cash of $5.0 million and a note receivable in
the amount of $1.7 million.
The following are the results of operations of discontinued businesses:
| |
|
|
|
|
|
|
|
|
|
|
|
|
|
|
|
|
| |
|
Three Months |
|
|
Nine Months |
|
| |
|
Ended 31 December |
|
|
Ended 31 December |
|
| (Millions of US dollars) |
|
2004 |
|
|
2003 |
|
|
2004 |
|
|
2003 |
|
| |
Building Systems |
|
|
|
|
|
|
|
|
|
|
|
|
|
|
|
|
Net sales |
|
$ |
— |
|
|
$ |
— |
|
|
$ |
— |
|
|
$ |
2.9 |
|
(Loss) income before income taxes |
|
|
(0.5 |
) |
|
|
— |
|
|
|
(0.5 |
) |
|
|
0.3 |
|
Income tax benefit (expense) |
|
|
0.2 |
|
|
|
— |
|
|
|
0.2 |
|
|
|
(0.1 |
) |
| |
|
|
|
|
Net (loss) income |
|
|
(0.3 |
) |
|
|
— |
|
|
|
(0.3 |
) |
|
|
0.2 |
|
| |
|
|
|
|
Gain (loss) on disposal, net of income taxes |
|
|
— |
|
|
|
1.8 |
|
|
|
(0.7 |
) |
|
|
3.4 |
|
| |
|
|
|
|
(Loss) income from discontinued operations |
|
$ |
(0.3 |
) |
|
$ |
1.8 |
|
|
$ |
(1.0 |
) |
|
$ |
3.6 |
|
| |
|
|
|
|
F-11
JAMES HARDIE INDUSTRIES N.V. AND SUBSIDIARIES
NOTES TO CONSOLIDATED FINANCIAL STATEMENTS (Continued)
(Unaudited)
| 6. |
Operating Segment Information and Concentrations of Risk |
The Company has reported its operating segment information in the format that the operating segment information is
available to and evaluated by the Board of Directors. USA Fibre Cement manufactures and sells fibre cement flat
sheet products in the United States. Asia Pacific Fibre Cement includes all fibre cement manufactured in Australia,
New Zealand and the Philippines and sold in Australia, New Zealand and Asia. Research and Development
represents the costs incurred by the research and development centres. Other includes the manufacture and sale of
fibre cement products in Chile, the manufacture and sale of fibre cement reinforced pipes in the United States, fibre
cement operations in Europe and fibre cement roofing operations in the United States. The Company’s reportable
operating segments are strategic operating units that are managed separately due to their different products and/or
geographical location.
Operating Segments
The following are the Company’s operating segments and geographical information:
| |
|
|
|
|
|
|
|
|
|
|
|
|
|
|
|
|
| |
|
Net Sales to Customers |
|
|
Net Sales to Customers |
|
| |
|
Three Months |
|
|
Nine Months |
|
| |
|
Ended 31 December |
|
|
Ended 31 December |
|
| (Millions of US dollars) |
|
2004 |
2003 |
|
|
2004 |
2003 |
|
USA Fibre Cement |
|
$ |
220.3 |
|
|
$ |
175.3 |
|
|
$ |
692.0 |
|
|
$ |
553.5 |
|
Asia Pacific Fibre Cement |
|
|
58.1 |
|
|
|
55.9 |
|
|
|
177.9 |
|
|
|
160.8 |
|
Other Fibre Cement |
|
|
8.6 |
|
|
|
6.3 |
|
|
|
24.1 |
|
|
|
16.3 |
|
| |
|
|
|
|
Worldwide total from continuing operations |
|
$ |
287.0 |
|
|
$ |
237.5 |
|
|
$ |
894.0 |
|
|
$ |
730.6 |
|
| |
|
|
|
|
| |
|
|
|
|
|
|
|
|
|
|
|
|
|
|
|
|
| |
|
Income (Loss) from |
|
|
Income (Loss) from |
|
| |
|
Continuing Operations |
|
|
Continuing Operations |
|
| |
|
Three Months |
|
|
Nine Months |
|
| |
|
Ended 31 December |
|
|
Ended 31 December |
|
| (Millions of US dollars) |
|
2004 |
|
|
2003 |
|
|
2004 |
|
|
2003 |
|
| |
|
|
|
|
USA Fibre Cement |
|
$ |
52.3 |
|
|
$ |
44.6 |
|
|
$ |
164.4 |
|
|
$ |
152.4 |
|
Asia Pacific Fibre Cement |
|
|
10.2 |
|
|
|
11.3 |
|
|
|
34.5 |
|
|
|
29.3 |
|
Research and Development |
|
|
(3.9 |
) |
|
|
(4.6 |
) |
|
|
(11.4 |
) |
|
|
(12.0 |
) |
Other Fibre Cement |
|
|
(2.6 |
) |
|
|
(3.8 |
) |
|
|
(10.1 |
) |
|
|
(11.8 |
) |
|
|
|
|
|
Segments total |
|
|
56.0 |
|
|
|
47.5 |
|
|
|
177.4 |
|
|
|
157.9 |
|
General Corporate |
|
|
(22.7 |
) |
|
|
(6.3 |
) |
|
|
(45.8 |
) |
|
|
(20.5 |
) |
|
|
|
|
|
Total operating income |
|
|
33.3 |
|
|
|
41.2 |
|
|
|
131.6 |
|
|
|
137.4 |
|
Net interest expense |
|
|
(0.7 |
) |
|
|
(2.8 |
) |
|
|
(4.5 |
) |
|
|
(7.5 |
) |
Other income (expense) |
|
|
0.4 |
|
|
|
(0.1 |
) |
|
|
(1.5 |
) |
|
|
(3.4 |
) |
|
|
|
|
|
Worldwide total from continuing operations |
|
$ |
33.0 |
|
|
$ |
38.3 |
|
|
$ |
125.6 |
|
|
$ |
126.5 |
|
|
|
|
|
|
| |
|
|
|
|
|
|
|
|
| |
|
Total Identifiable Assets |
|
| |
|
31 December |
|
|
31 March |
|
| (Millions of US dollars) |
|
2004 |
|
|
2004 |
|
| |
USA Fibre Cement |
|
$ |
616.5 |
|
|
$ |
554.9 |
|
Asia Pacific Fibre Cement |
|
|
190.9 |
|
|
|
175.9 |
|
Other Fibre Cement |
|
|
82.6 |
|
|
|
74.7 |
|
| |
|
|
Segments total |
|
|
890.0 |
|
|
|
805.5 |
|
General Corporate |
|
|
145.1 |
|
|
|
165.7 |
|
| |
|
|
Worldwide total |
|
$ |
1,035.1 |
|
|
$ |
971.2 |
|
| |
|
|
F-12
JAMES HARDIE INDUSTRIES N.V. AND SUBSIDIARIES
NOTES TO CONSOLIDATED FINANCIAL STATEMENTS (Continued)
(Unaudited)
Geographic Areas
| |
|
|
|
|
|
|
|
|
|
|
|
|
|
|
|
|
| |
|
Net Sales to Customers |
|
|
Net Sales to Customers |
|
| |
|
Three Months |
|
|
Nine Months |
|
| |
|
Ended 31 December |
|
|
Ended 31 December |
|
| (Millions of US dollars) |
|
2004 |
|
|
2003 |
|
|
2004 |
|
|
2003 |
|
| |
|
|
USA |
|
$ |
223.8 |
|
|
$ |
177.8 |
|
|
$ |
703.9 |
|
|
$ |
560.8 |
|
Australia |
|
|
38.4 |
|
|
|
39.9 |
|
|
|
122.6 |
|
|
|
112.8 |
|
New Zealand |
|
|
13.4 |
|
|
|
10.8 |
|
|
|
36.6 |
|
|
|
29.6 |
|
Other Countries |
|
|
11.4 |
|
|
|
9.0 |
|
|
|
30.9 |
|
|
|
27.4 |
|
| |
|
|
|
|
Worldwide total from continuing operations |
|
$ |
287.0 |
|
|
$ |
237.5 |
|
|
$ |
894.0 |
|
|
$ |
730.6 |
|
| |
|
|
|
|
| |
|
|
|
|
|
|
|
|
| |
|
Total Identifiable Assets |
|
| |
|
31 December |
|
|
31 March |
|
| (Millions of US dollars) |
|
2004 |
|
|
2004 |
|
| |
USA |
|
$ |
673.1 |
|
|
$ |
609.8 |
|
Australia |
|
|
128.7 |
|
|
|
119.1 |
|
New Zealand |
|
|
25.9 |
|
|
|
19.7 |
|
Other Countries |
|
|
62.3 |
|
|
|
56.9 |
|
| |
|
|
Segments total |
|
|
890.0 |
|
|
|
805.5 |
|
General Corporate |
|
|
145.1 |
|
|
|
165.7 |
|
| |
|
|
Worldwide total |
|
$ |
1,035.1 |
|
|
$ |
971.2 |
|
| |
|
|
| 7. |
Accumulated Other Comprehensive Loss |
The following are the components of total accumulated other comprehensive loss, net of related taxes, which is
displayed in the accompanying consolidated balance sheets:
| |
|
|
|
|
|
|
|
|
| |
|
31 December |
|
|
31 March |
|
| (Millions of US dollars) |
|
2004 |
|
|
2004 |
|
| |
Unrealised transition loss on derivative instruments classified as
cash flow hedges |
|
$ |
(4.9 |
) |
|
$ |
(4.9 |
) |
Accumulated amortisation of unrealised transition loss on
derivative instruments |
|
|
4.2 |
|
|
|
3.3 |
|
Accumulated foreign currency losses on translation of foreign subsidiaries |
|
|
(16.0 |
) |
|
|
(22.7 |
) |
| |
|
|
Total accumulated other comprehensive loss |
|
$ |
(16.7 |
) |
|
$ |
(24.3 |
) |
| |
|
|
| 8. |
Commitments and Contingencies |
Environmental
The operations of the Company, like those of other companies engaged in similar businesses, are subject to various
federal, state and local laws and regulations on air and water quality, waste handling and disposal. The Company’s
policy is to accrue for environmental costs when it is determined that it is probable that an obligation exists and the
amount can be reasonably estimated. In the opinion of management, based on information presently known, the
ultimate liability for such matters should not have a material adverse effect on either the Company’s consolidated
financial position, results of operations or cash flows.
Legal
The Company is involved from time to time in various legal proceedings and administrative actions incidental to the normal
conduct of its business. Although it is impossible to predict the outcome of any pending legal proceeding, management
believes that such proceedings and actions in the normal conduct of business should not, individually or in the aggregate,
have a material adverse effect on either its consolidated financial position, results of operations or cash flows.
F-13
JAMES HARDIE INDUSTRIES N.V. AND SUBSIDIARIES
NOTES TO CONSOLIDATED FINANCIAL STATEMENTS (Continued)
(Unaudited)
Claims Against Former
Subsidiaries
Amaca Pty Ltd, Amaba Pty Ltd and ABN 60
In February 2001, ABN 60, formerly known as James Hardie Industries Limited (“JHIL”), established the Medical Research
and Compensation Foundation (the “Foundation”) by gifting A$3.0 million ($1.7 million) in cash and transferring ownership
of Amaca Pty Ltd (formerly James Hardie & Coy Pty Ltd) (“Amaca”) and Amaba Pty Ltd (formerly Jsekarb Pty Ltd)
(“Amaba”) to the Foundation. The Foundation is a special purpose charitable foundation established to fund medical and
scientific research into asbestos-related diseases. Amaca and Amaba were Australian companies which had
manufactured and marketed asbestos-related products prior to 1987.
The Foundation is managed by independent trustees and operates entirely independently of the Company and its current
subsidiaries. The Company does not control (directly or indirectly) the activities of the Foundation in any way and, effective
from 16 February 2001, has not owned, or controlled (directly or indirectly) the activities of, Amaca or Amaba. In particular,
the trustees are responsible for the effective management of claims against Amaca and Amaba, and for the investment of
their assets. The Company has no economic interest in the Foundation, Amaca or Amaba and it has no right to dividends or
capital distributions made by the Foundation.
On 31 March 2003, James Hardie transferred control of ABN 60 to a newly established company named ABN 60
Foundation Pty Ltd (“ABN 60 Foundation”). ABN 60 Foundation was established to be the sole shareholder of ABN 60 and
to ensure ABN 60 meets its payment obligations to the Foundation. Following the establishment of the ABN 60 Foundation,
James Hardie no longer owns any shares in ABN 60. ABN 60 Foundation is managed by independent directors and
operates entirely independently of James Hardie. James Hardie does not control the activities of ABN 60 or ABN 60
Foundation in any way, it has no economic interest in ABN 60 or ABN 60 Foundation and has no right to dividends or capital
distributions made by the ABN 60 Foundation.
Up to the date of the establishment of the Foundation, Amaca and Amaba incurred costs of asbestos-related litigation and
settlements. From time to time, ABN 60 was joined as a party to asbestos suits which were primarily directed at Amaca
and Amaba. As Amaca, Amaba and ABN 60 are no longer a part of James Hardie, and all relevant claims against ABN 60
had been successfully defended, no provision for asbestos-related claims was established in the Company’s accounts at
31 December 2004 and 31 March 2004.
It is possible that JHI NV or any member of the James Hardie Group could become subject to suits for damages for personal
injury or death in connection with the former manufacture or sale of asbestos products that are or may be filed against
Amaca, Amaba or ABN 60. However, as described further below, the ability of any claimants to initiate or pursue such suits
may be restricted or removed by legislation which the NSW Government has agreed to contemplate following James
Hardie’s entry into a Heads of Agreement, also described further below. Although it is difficult to predict the incidence or
outcome of future litigation, the Company believes that in the absence of governmental action introducing legislation or a
change in jurisprudence as previously adopted in prior case law before the New South Wales (“NSW”) Supreme Court and
Federal High Court, as more fully described below, the risk that such suits could be successfully asserted against the
Company is low to remote. This belief is based in part on the fact that following the transfers of Amaca and Amaba to the
Foundation and of ABN 60 to the ABN 60 Foundation, none of those companies are part of James Hardie; the separateness
of corporate entities under Australian law; the limited circumstances where “piercing the corporate veil” might occur under
Australian and Dutch law; there being no equivalent under Australian law of the U.S. legal doctrine of “successor liability”;
and because JHI NV has been advised that the principle applicable under Dutch law, to the effect that transferees of assets
may be held liable for the transferor’s liabilities when they acquire assets at a price that leaves the transferor with insufficient
assets to meet claims, is not triggered by the restructuring or previous group transactions. The courts in Australia have
generally refused to hold parent entities responsible for the liabilities of their subsidiaries absent any finding of fraud, agency,
direct operational responsibility or the like. However, if suits are made possible and/or successfully brought, they could have
a material adverse effect on the Company’s business, results of operations or financial condition.
During the period ended 31 December 2004, James Hardie has not been a party to any material asbestos litigation and has
not made any settlement payments in relation to such litigation.
F-14
JAMES HARDIE INDUSTRIES N.V. AND SUBSIDIARIES
NOTES TO CONSOLIDATED FINANCIAL STATEMENTS (Continued)
(Unaudited)
Special Commission of Inquiry
On 29 October 2003, the Foundation issued a press release stating that its “most recent actuarial analysis estimates that
the compensation bill for the organization could reach one billion Australian dollars in addition to those funds already paid
out to claimants since the Foundation was formed and that existing funding could be exhausted within five years.” In
February 2004, the Government of the State of New South Wales, Australia established a Special Commission of Inquiry
(“SCI”) to investigate, among other matters described below, the circumstances in which the Foundation was established.
The SCI was instructed to determine the current financial position of the Foundation and whether it is likely to meet its future
asbestos-related claims in the medium to long-term. It was also instructed to report on the circumstances in which the
Foundation was separated from James Hardie and whether this may have resulted in or contributed to a possible
insufficiency of assets to meet its future asbestos-related liabilities, and the circumstances in which any corporate
restructure or asset transfers occurred within or in relation to the James Hardie group prior to the funding of the
Foundation to the extent that this may have affected the Foundation’s ability to meet its current and future liabilities. The SCI
was also instructed to report on the adequacy of current arrangements available to the Foundation under the Corporations
Act of Australia to assist the Foundation in managing its liabilities and whether reform is desirable in order to assist the
Foundation in managing its obligations to current and future claimants.
On 14 July 2004, the Company lodged a submission with the SCI stating that the Company would recommend that
shareholders approve the provision of an unspecified amount of additional funding to enable an effective statute-based
scheme to compensate all future claimants for asbestos-related injuries for which Amaca and Amaba are liable. The
Company proposed that the statutory scheme include the following elements: speedy, fair and equitable compensation for
all existing and future claimants; objective criteria to reduce superimposed (judicial) inflation; contributions to be made in a
manner which provide certainty to claimants as to their entitlement, the scheme administrator as to the amount
available for distribution, and the proposed contributors (including James Hardie) as to the ultimate amount of their
contributions; significant reductions in legal costs through reduced and more abbreviated litigation; and limitation of legal
avenues outside of the scheme. The submission stated that the proposal was made without any admission of liability or
prejudice to the Company’s rights or defences.
The SCI finished taking evidence on 13 August 2004 and issued its report on 21 September 2004. The SCI indicated that
the establishment of the Foundation and the establishment of the ABN 60 Foundation were legally effective and that,
accordingly, although any liabilities in relation to the asbestos claims for claimants remained with Amaca, Amaba or ABN 60
(as the case may be), no significant liabilities for those claims could likely be assessed directly against JHI NV or any other
James Hardie entities.
In relation to the assertions by the Foundation concerning the circumstances of its establishment, the SCI examined these
in detail. Although the SCI made certain adverse findings against Mr. Macdonald (former CEO) and Mr. Shafron (former
CFO), it did not find that their conduct caused any material loss to the Foundation or the asbestos claimants which would
create a valuable cause of action against, and therefore a material liability of, any James Hardie entity or would lead to any
of the restructuring arrangements being reversed. Indeed, the SCI specifically noted that there were significant hurdles,
which might be insuperable, to establishing any liability in respect of these claims against the Company, ABN 60 or their
respective directors and that, even if liability were established, there were further hurdles which might prove to be
insuperable against any substantial recovery or remedy by such potential claimants in respect of them.
In relation to the question of the funding of the Foundation, the SCI found that there was a significant funding shortfall. In part,
this was based on actuarial work indicating that the discounted value of the central estimate of the asbestos liabilities of
Amaca and Amaba was approximately A$1.573 billion as of 30 June 2003. The SCI found that the net assets of the
Foundation and the ABN 60 Foundation were not sufficient to meet these prospective liabilities and were likely to be
exhausted in the first half of 2007.
In relation to the Company’s statutory scheme proposal, the SCI reported that there were several issues that needed to
be refined quite significantly but that it would be an appropriate starting point for devising an appropriate compensation
scheme.
The SCI’s findings are not binding and a later court consideration of the issues could lead to one or more different
conclusions.
F-15
JAMES HARDIE INDUSTRIES N.V. AND SUBSIDIARIES
NOTES TO CONSOLIDATED FINANCIAL STATEMENTS (Continued)
(Unaudited)
The NSW Government stated that it would not consider assisting the implementation of any proposal advanced by the
Company unless it was the result of an agreement reached with the union movement acting through the Australian Council
of Trade Unions (“ACTU”) and the Labour Council of NSW as well as the representatives of the asbestos claimants
(together, the “Representatives”). The statutory scheme that the Company recommended on 14 July 2004 was rejected by
the Representatives.
The Company’s view is that, except to the extent that it agrees otherwise as a result of these discussions, under current
Australian law it is not legally liable for any shortfall in the assets of Amaca, Amaba, the Foundation, the ABN 60 Foundation
or ABN 60.
It is also possible that the Representatives and/or others may encourage or continue to encourage consumers and union
members in Australia and elsewhere to boycott the Company’s products, to demonstrate or otherwise create negative
publicity toward the Company in order to influence the Company’s approach to the discussions with the Representatives or
to encourage governmental action if the discussions are unsuccessful. The Representatives and/or others might also take
such actions in an effort to influence the Company’s shareholders, a significant number of which are located in Australia, to
approve any proposed arrangement. Any such measures, and the influences resulting from them, could have a material
adverse impact on the Company’s financial position, results of operations and cash flows.
On 28 October 2004, the NSW Premier announced that the NSW Government would seek the agreement of the Ministerial
Council comprising of Ministers of the Commonwealth and the Australian States and Territories to allow the NSW
Government to pass legislation which he announced would “wind back James Hardie’s corporate restructure and rescind
the cancellation of A$1.9 billion in partly paid shares.” The announcement said that “the laws will effectively enforce the
liability [for asbestos-related claims] against the Dutch parent company.” On 5 November 2004, the Australian
Attorney-General and the Parliamentary Secretary to the Treasurer (the two relevant ministers of the Australian Federal
Government) issued a news release stating that the Ministerial Council for Corporations (the relevant body of Federal,
State and Territory Ministers, “MINCO”) had unanimously agreed “to support a negotiated settlement that will ensure that
victims of asbestos-related diseases receive full and timely compensation from James Hardie” and if “the current
negotiations between James Hardie, the ACTU and asbestos victims do not reach an acceptable conclusion, MINCO
also agreed in principle to consider options for legislative reform.” The news release of 5 November 2004 indicated that
treaties to enforce Australian judgments in Dutch and U.S. courts are not required but that the Australian Government has
been involved in communications with Dutch and U.S. authorities regarding arrangements to ensure that Australian
judgments are able to be enforced where necessary. Should negotiations not lead to an acceptable conclusion, James
Hardie is aware of suggestions of legislative intervention but has no detailed information as to its likely content.
Heads of Agreement
On 21 December 2004, the Company announced that it had entered into a non-binding Heads of Agreement with the NSW
Government and the Representatives which is expected to form the basis of a proposed binding agreement (the “Principal
Agreement”) to establish and fund a special purpose fund to provide funding on a long-term basis for Asbestos Claims
against Amaba and Amaca, former James Hardie subsidiaries. The Company is currently in negotiations related to the
Principal Agreement.
The principles set out in the Heads of Agreement on which the Company and/or member(s) of the Group would provide
funding include:
| |
– |
the establishment of a special purpose fund (“SPF”) to compensate asbestos victims; |
| |
| |
– |
initial funding of the SPF by the Company on the basis of a November 2004 KPMG actuaries’ report (which provided a
net present value of A$1.5 billion in present and future claims at 30 June 2004). The actuarial assessment is to be
updated annually; |
| |
| |
– |
a two year rolling cash buffer in the SPF and an annual contribution in advance based on actuarial assessments of
expected claims for the next three years, revised annually; |
| |
| |
– |
a cap on the annual payments made by the Company to the SPF, initially set at 35% of annual net operating cash flow
(defined as cash from operations in accordance with US GAAP) of the Company for the immediately preceding year,
with provisions for the percentage to decline over time depending upon the Company’s financial performance and
claims outlook; and |
| |
| |
– |
no cap on individual payments to claimants. |
F-16
JAMES HARDIE INDUSTRIES N.V. AND SUBSIDIARIES
NOTES TO CONSOLIDATED FINANCIAL STATEMENTS (Continued)
(Unaudited)
The Heads of Agreement is expected to form the basis of a Principal Agreement to be settled between the Company and
the NSW Government which, in turn, will require the support of the Company’s lenders and shareholders. The Principal
Agreement will be a legally binding agreement.
The Principal Agreement will be subject to a number of conditions precedent, including the approval of the Company’s
shareholders and lenders, and the adoption by the NSW Government of reforms following a review, announced on 18
November 2004, of legal and administrative costs in dust diseases compensation.
The parties have announced their intention to execute the Principal Agreement, depending on the timing of the NSW
Government review, and for the binding agreement to commence in or around the middle of 2005.
As part of the discussions surrounding the Principal Agreement the Company is examining all relevant options in relation to
the establishment of the special purpose fund referred to above, including the possibility of reacquiring all of the share capital
of Amaba, Amaba and/or ABN 60.
The Heads of Agreement contains an agreement from the NSW Government to provide releases to the James Hardie group
and to its directors, officers and employees from all civil liabilities other than the liabilities of James Hardie to be set out in the
Principal Agreement. These releases may well take the form of legislation passed by the NSW Parliament. The precise
form of the releases remains to be settled.
If an agreement is reached with the NSW Government and approved by the Company’s lenders and shareholders, the
Company may be required to make a substantial provision in its accounts at a later date, and it is possible that the Company
may need to seek additional borrowing facilities. Additionally, it is possible that any future resolution of this issue may result
in the Company having negative shareholders’ equity, which may restrict its ability to pay dividends to its shareholders. If the
terms of a future resolution involve James Hardie making payments, either on an annual or other basis, pursuant to a
statutory scheme or other form of arrangement, James Hardie’s financial position, results of operations and cash flows
could be materially adversely affected.
As noted above, the NSW Government is conducting a review of legal and administrative costs in dust diseases
compensation in NSW. The intention of this review is primarily to determine ways to reduce legal and administrative costs,
and to consider the current processes for handling and resolving dust diseases compensation claims. The review is
expected to report to the NSW Government in March 2005. The Company is unable to predict the outcome of this review.
Updated Actuarial Study
In October 2004, the Company commissioned an updated actuarial study of potential asbestos-related liabilities. Based on
the results of the study, which was updated as at 30 June 2004, it is estimated that the discounted value of the central
estimate for asbestos-related claims in Australia for death or personal injury against Amaca, Amaba and ABN 60 was
approximately A$1.536 billion. Actual liabilities of those companies for such asbestos-related claims could vary, perhaps
materially, from the discounted central estimate described above.
In estimating the potential financial exposure, the actuaries made assumptions related to the total number of claims which
were reasonably estimated to be asserted through 2071, the typical cost of settlement (which is sensitive to the industry in
which the plaintiff claims exposure, the alleged disease type and the jurisdiction in which the action is being brought), the
rate of receipt of claims, the settlement strategy in dealing with outstanding claims and the timing of settlements.
Further, the actuaries have relied on the data and information provided by the Medical Research and Compensation
Foundation and Litigation Management Group Pty Limited and assumed that it is accurate and complete in all material
respects. The actuaries have not verified that information independently nor established the reliability, accuracy or
completeness of the data and information provided or used for the preparation of their report, and were not provided with
the information required to carry out such a verification exercise.
Due to inherent uncertainties in the legal and medical environment; the number and timing of future claim notifications and
settlements; the recoverability of claims against insurance contracts and in estimating the future trends in average claim
awards as well as the extent to which the above-named entities will contribute to the overall settlements, the outcome could
differ materially from that currently projected.
F-17
JAMES HARDIE INDUSTRIES N.V. AND SUBSIDIARIES
NOTES TO CONSOLIDATED FINANCIAL STATEMENTS (Continued)
(Unaudited)
Sensitivity analysis has been performed, showing how the actuarial estimates would change if the outcome of certain
assumptions (being the rate of superimposed inflation, the average costs of claims and legal fees, and the projected
numbers of claims) were different to that included within the central estimates. This shows that the discounted central
estimates could fall in a range of A$1.0 billion to A$2.3 billion (undiscounted estimates of A$2.0 billion to A$5.7 billion) based
on the current information available and reflecting current trends. It should be noted that the actual cost of the liabilities
could fall outside of that range depending on the actual outcome of the assumptions made.
Accordingly, the Company has not established a provision for asbestos-related liabilities as of 31 December 2004 because
at this time it is neither probable nor estimable.
The Company has incurred substantial costs associated with the SCI and may incur material costs in the future related to
the SCI or subsequent legal proceedings. The following are the components of SCI related expenses:
| |
|
|
|
|
|
|
|
|
| |
|
Three Months |
|
|
Nine Months |
|
| |
|
Ended |
|
|
Ended |
|
| |
|
31 December |
|
|
31 December |
|
| (Millions of US dollars) |
|
2004 |
|
|
2004 |
|
| |
SCI |
|
$ |
— |
|
|
$ |
6.3 |
|
Internal investigation |
|
|
3.3 |
|
|
|
4.4 |
|
ASIC investigation |
|
|
1.0 |
|
|
|
1.0 |
|
Severance and consulting |
|
|
6.0 |
|
|
|
6.0 |
|
Resolution advisory fees |
|
|
3.8 |
|
|
|
4.5 |
|
Funding advice |
|
|
0.6 |
|
|
|
0.6 |
|
Other |
|
|
1.2 |
|
|
|
1.6 |
|
|
|
|
|
|
Total SCI related expenses |
|
$ |
15.9 |
|
|
$ |
24.4 |
|
|
|
|
|
|
Internal investigation costs relate to an internal investigation conducted by independent legal advisors to investigate
allegations raised during the SCI and in order to assist in completion of the preparation and filing of the Company’s
accounts in the United States. It is currently the Company’s policy to expense any legal costs as incurred.
Australian Securities and Investments Commission Investigation
The Australian Securities and Investments Commission (“ASIC”) has announced that it is conducting an investigation into
the events examined by SCI, without limiting itself to the evidence compiled by the SCI. ASIC has served notices to produce
relevant documents upon the Company, various directors and officers of the Company and on certain of its advisers and
auditors at the time of the separation and restructure transactions described above. To date, ASIC has announced that it is
investigating various matters, but it has not specified the particulars of alleged contraventions under investigation, nor has it
announced that it has reached any conclusion that any person or entity has contravened any relevant law. Further, the
scope of action, if any, to be taken by ASIC following such an investigation will potentially be affected by the releases
described below.
To assist ASIC’s investigation, the Federal Government has enacted legislation to abrogate the legal professional privilege
which would otherwise have attached to certain documents relevant to matters under investigation or to any future
proceedings to be taken. The legislation is set out in the James Hardie (Investigations and Proceedings) Act 2004.
The Company may incur costs of current or former officers of the James Hardie Group to the extent that those costs are
covered by indemnity arrangements granted by the James Hardie Group to those persons. To date, no claims have been
received by any current or former officers in relation to the ASIC investigation and, if claims do arise, the Company may be
reimbursed under directors’ and officers’ insurance policies taken out by the Company.
Severance Agreements
On 20 October 2004, Mr. Peter Shafron resigned from his position as Chief Financial Officer and on 21 October 2004, Mr.
Peter Macdonald resigned from his position on the Managing Board and as Chief Executive Officer. In connection with these
resignations, the Company incurred costs of $8.9 million in the three and nine months ended 31 December 2004. These
costs were comprised of $6.0 million of additional expense and $2.9 million of previously existing accruals.
F-18
JAMES HARDIE INDUSTRIES N.V. AND SUBSIDIARIES
NOTES TO CONSOLIDATED FINANCIAL STATEMENTS (Continued)
(Unaudited)
ABN 60 Indemnity
The Company has undertaken a number of initiatives to seek to ensure that asbestos-related claims processing by the
Foundation is not interrupted prior to entry into of the Principal Agreement in accordance with the principles and within the
proposed timing described above. Those initiatives are described further below, but the Company believes that the
Foundation is unlikely to need to avail itself of the assistance which has been offered by the Company, on the basis that on
3 December 2004 and in part as a result of the initiatives undertaken by the Company, the Foundation received a payment of
approximately A$88.5 million from ABN 60 for use in processing and meeting asbestos-related personal injury claims.
The Company facilitated the payment of such funds by granting an indemnity to the directors of ABN 60, which it announced
on 16 November 2004. Under the terms of that indemnity, the Company agreed to meet any liability incurred by the ABN 60
directors resulting from the release of the A$88.5 million by ABN 60 to the Foundation. The Company believes that the
release of funding by ABN 60 is in accordance with law and contracts in place and therefore the Company should not incur
liability under this indemnity.
Additionally, on 16 November 2004 the Company offered to provide funding to the Foundation on an interim basis for a period
of up to six months from that date. Such funding would only be provided once existing Foundation funds have been
exhausted. The Company believes, based on actuarial and legal advice that claims against the Foundation should not
exceed the funds which are available to the Foundation (particularly in the light of its receipt of the A$88.5 million described
above) or which are expected to become available to the Foundation during the period of the interim funding proposal.
The Company believes, based on actuarial and legal advice, that claims against the Foundation should not exceed the funds
which are or which are expected to become available to the Foundation during the period of the interim funding proposal.
The Company has not recorded a provision for either the proposed indemnity or the potential payments under the interim
funding proposal.
MRCF
On the basis of the current cash and financial position of the Foundation’s subsidiaries (Amaca Pty Limited and Amaba Pty
Limited) and following the Company’s entry into the Heads of Agreement, the applications previously made to the Supreme
Court of NSW for the appointment of a provisional liquidator to the Foundation’s subsidiaries have been dismissed with their
consent.
F-19
Item 2. Quantitative and Qualitative Disclosures About Market Risk
In this report, James Hardie Industries N.V. and its subsidiaries are collectively referred to as
“we,” “us,” or “our,” and the terms “US$”, “A$”, “NZ$”, “PHP”, refer to United States dollars,
Australian dollars, New Zealand dollars and Philippine pesos, respectively.
We have operations in foreign countries and, as a result, are exposed to foreign currency exchange
rate risk inherent in purchases, sales, assets and liabilities denominated in currencies other than
the U.S. dollar. We also are exposed to interest rate risk associated with our long-term debt and
to changes in prices of commodities we use in production.
Our policy is to enter into derivative instruments solely to mitigate risks in our business and not
for trading or speculative purposes.
Foreign Currency Exchange Rate Risk
We have significant operations outside of the United States and, as a result, are exposed to
changes in exchange rates which affect our financial position, results of operations and cash
flows. For the nine months ended 31 December 2004, the following currencies comprised the
following percentages of our net sales, cost of goods sold, expenses and liabilities:
| |
|
|
|
|
|
|
|
|
|
|
|
|
|
|
|
|
| |
|
US$ |
|
|
A$ |
|
|
NZ$ |
|
|
Other (1) |
|
Net sales |
|
|
78.7 |
% |
|
|
13.7 |
% |
|
|
4.1 |
% |
|
|
3.5 |
% |
|
|
|
|
|
|
|
|
|
|
|
|
|
|
|
|
|
Cost of goods sold |
|
|
82.2 |
% |
|
|
12.1 |
% |
|
|
2.9 |
% |
|
|
2.8 |
% |
|
|
|
|
|
|
|
|
|
|
|
|
|
|
|
|
|
Expenses |
|
|
61.0 |
% |
|
|
31.0 |
% |
|
|
2.5 |
% |
|
|
5.5 |
% |
|
|
|
|
|
|
|
|
|
|
|
|
|
|
|
|
|
Liabilities (excluding borrowings) |
|
|
83.8 |
% |
|
|
6.6 |
% |
|
|
6.0 |
% |
|
|
3.6 |
% |
| (1) |
|
Comprised of Philippine pesos, Euros and Chilean pesos. |
We purchase raw materials and fixed assets and sell some finished product for amounts denominated
in currencies other than the functional currency of the business in which the related transaction
is generated. In order to protect against foreign exchange rate movements, we may enter into
forward exchange contracts timed to mature when settlement of the underlying transaction is due to
occur. At 31 December 2004, outstanding foreign exchange contracts were not material.
Interest Rate Risk
We have market risk from changes in interest rates, primarily related to our borrowings. At 31
December 2004, 92% of our borrowings were fixed-rate and 8% variable-rate. The large percentage of
fixed-rate debt reduces the earnings volatility that would result from changes in interest rates.
From time to time, we may enter into interest rate swap contracts in an effort to mitigate interest
rate risk. During the nine months ended 31 December 2004, no interest rate swap contracts were
entered into and no contracts were outstanding.
The following table presents our long-term borrowings at 31 December 2004, the expected maturity
date of future principal repayments and related weighted average interest rates. The fair value of
our outstanding debt is what we likely would have to pay over the term of the loan if we were to
enter into debt on substantially the same terms today. At 31 December 2004, all of our outstanding
fixed-rate borrowings were denominated in U.S. dollars.
F-20
Future Principal Repayments by Expected Maturity Date
(in millions of US dollars, except percentages)
For the Years Ended 31 March
| |
|
|
|
|
|
|
|
|
|
|
|
|
|
|
|
|
|
|
|
|
|
|
|
|
|
|
|
|
| |
|
2006 |
|
|
2007 |
|
|
2008 |
|
|
2009 |
|
|
Thereafter |
|
|
Total |
|
|
Fair Value |
|
Fixed rate debt |
|
$ |
25.7 |
|
|
$ |
27.1 |
|
|
$ |
8.1 |
|
|
$ |
46.2 |
|
|
$ |
40.3 |
|
|
$ |
147.4 |
|
|
$ |
173.1 |
|
|
|
|
|
|
|
|
|
|
|
|
|
|
|
|
|
|
|
|
|
|
|
|
|
|
|
|
|
|
Weighted-average
interest rate |
|
|
6.92 |
% |
|
|
6.99 |
% |
|
|
7.05 |
% |
|
|
7.12 |
% |
|
|
7.35 |
% |
|
|
7.12 |
% |
|
|
|
|
|
|
|
|
|
|
|
|
|
|
|
|
|
|
|
|
|
|
|
|
|
|
|
|
|
|
|
|
|
Variable rate debt |
|
$ |
12.5 |
|
|
|
— |
|
|
|
— |
|
|
|
— |
|
|
|
— |
|
|
$ |
12.5 |
|
|
$ |
12.5 |
|
|
|
|
|
|
|
|
|
|
|
|
|
|
|
|
|
|
|
|
|
|
|
|
|
|
|
|
|
|
Weighted-average
interest rate |
|
|
3.52 |
% |
|
|
— |
|
|
|
— |
|
|
|
— |
|
|
|
— |
|
|
|
3.52 |
% |
|
|
|
|
Commodity Price Risk
Pulp is a raw material we use to produce fibre cement, and it has historically demonstrated more
price sensitivity than other raw materials we use in our manufacturing process. Although we have
entered into contracts to hedge pulp prices in the past, we do not anticipate entering in such
transactions in the near future.
F-21
This Financial Report forms part of a package of information about the company’s results. It
should be read in conjunction with the other parts of this package, including a Media Release, a
Management Presentation, a Management’s Analysis of Results, and a Results at a Glance document.
Disclaimer
This Financial Report contains forward-looking statements. We may from time to time make
forward-looking statements in our periodic reports filed with the Securities and Exchange
Commission on Forms 20-F and 6-K, in our annual reports to shareholders, in offering circulars and
prospectuses, in media releases and other written materials and in oral statements made by our
officers, directors or employees to analysts, institutional investors, representatives of the media
and others. Examples of such forward-looking statements include:
| |
• |
projections of our operating results or financial condition; |
| |
| |
• |
statements of our plans, objectives or goals, including those relating to
competition, acquisitions, dispositions and our products; |
| |
| |
• |
statements about our future economic performance or that of the United States,
Australia or other countries in which we operate; and |
| |
| |
• |
statements about product or environmental liabilities. |
Words such as “believe,” “anticipate,” “plan,” “expect,” “intend,” “target,” “estimate,” “project,”
“predict,” “forecast,” “guideline,” “should,” “aim” and similar expressions are intended to
identify forward-looking statements but are not the exclusive means of identifying such statements.
Forward-looking statements involve inherent risks and uncertainties. We caution you that a number
of important factors could cause actual results to differ materially from the plans, objectives,
expectations, estimates and intentions expressed in such forward-looking statements. These factors
include but are not limited to: all matters relating to or arising out of the prior manufacture of
asbestos by ABN 60 and certain former subsidiaries; competition and product pricing in the markets
in which we operate; general economic and market conditions; compliance with and possible changes
in environmental and health and safety laws; the successful transition of new senior management;
the success of our research and development efforts; the supply and cost of raw materials; our
reliance on a small number of product distributors; the consequences of product failures or
defects; exposure to environmental, asbestos or other legal proceedings; risks of conducting
business internationally; compliance with and changes in tax laws and treatments; and foreign
exchange risks. We caution you that the foregoing list of factors is not exclusive and that other
risks and uncertainties may cause actual results to differ materially from those in forward-looking
statements. Forward-looking statements speak only as of the date they are made.
F-22
|
FY05 3rd Quarter and Year To Date Results
14 February 2005
Unless otherwise stated, results are for continuing operations only and comparisons are of the 3rd quarter
of the current fiscal year versus the 3rd quarter of the prior fiscal year.
|
|
Overview - Louis Gries, CEO
Financial Review - Russell Chenu, CFO
Operating Review - Louis Gries, CEO
Special Commission of Inquiry -
Associated Developments - Russell Chenu, CFO
Questions and Answers
Agenda
|
|
Overview
Continued strong top-line growth
Improved USA Fibre Cement results
Plant performance back to acceptable levels
Bottom line lower due to SCI related costs
|
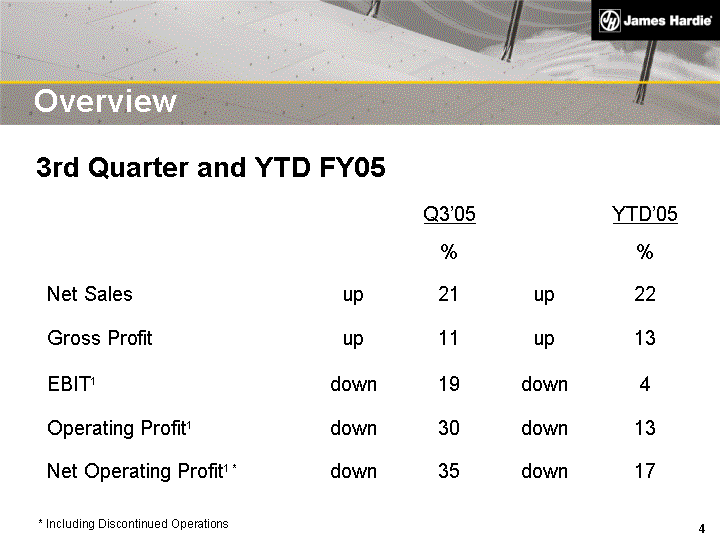
|
* Including Discontinued Operations
Overview
3rd Quarter and YTD FY05
Q3'05 YTD'05
% %
Net Sales
up 21 up 22
Gross Profit up 11 up 13
EBIT1 down 19 down 4
Operating Profit1 down 30 down 13
Net Operating Profit1 * down 35 down 17
|
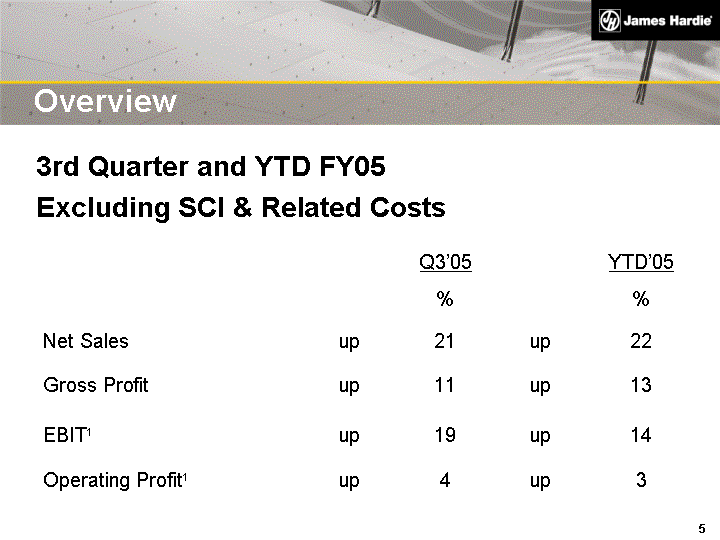
|
Overview
3rd Quarter and YTD FY05
Excluding SCI & Related Costs
Q3'05 YTD'05
% %
Net Sales
up 21 up 22
Gross Profit up 11 up 13
EBIT1 up 19 up 14
Operating Profit1 up 4 up 3
|
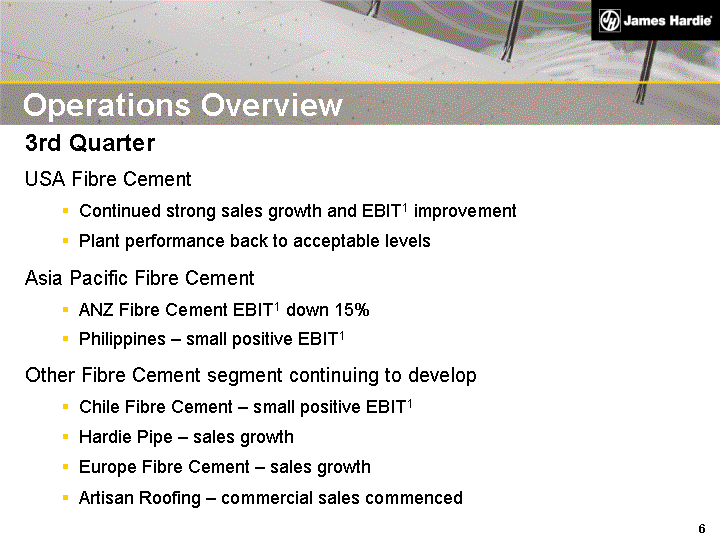
|
Operations Overview
3rd Quarter
USA Fibre Cement
Continued strong sales growth and EBIT1 improvement
Plant performance back to acceptable levels
Asia Pacific Fibre Cement
ANZ Fibre Cement EBIT1 down 15%
Philippines - small positive EBIT1
Other Fibre Cement segment continuing to develop
Chile Fibre Cement - small positive EBIT1
Hardie Pipe - sales growth
Europe Fibre Cement - sales growth
Artisan Roofing - commercial sales commenced
|

|
Financial Review
Russell Chenu, CFO
|
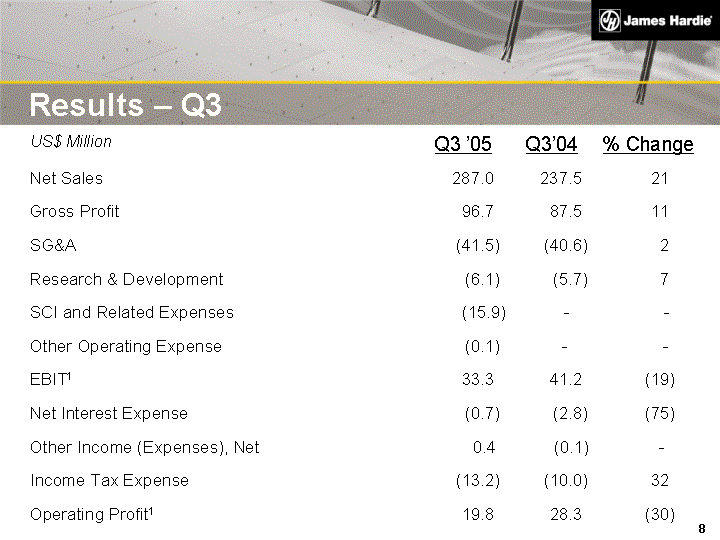
|
US$ Million
Q3 '05
Q3'04
% Change
Net Sales 287.0 237.5 21
Gross Profit 96.7 87.5 11
SG&A (41.5) (40.6) 2
Research & Development (6.1) (5.7) 7
SCI and Related Expenses (15.9) - -
Other Operating Expense (0.1) - -
EBIT1 33.3 41.2 (19)
Net Interest Expense (0.7) (2.8) (75)
Other Income (Expenses), Net 0.4 (0.1) -
Income Tax Expense (13.2) (10.0) 32
Operating Profit1 19.8 28.3 (30)
Results - Q3
|
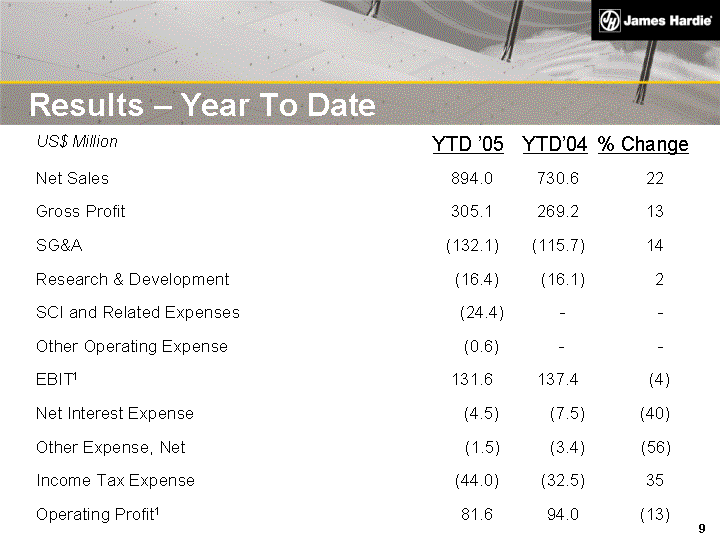
|
Results - Year To Date
US$ Million
YTD '05
YTD'04
% Change
Net Sales 894.0 730.6 22
Gross Profit 305.1 269.2 13
SG&A (132.1) (115.7) 14
Research & Development (16.4) (16.1) 2
SCI and Related Expenses (24.4) - -
Other Operating Expense (0.6) - -
EBIT1 131.6 137.4 (4)
Net Interest Expense (4.5) (7.5) (40)
Other Expense, Net (1.5) (3.4) (56)
Income Tax Expense (44.0) (32.5) 35
Operating Profit1 81.6 94.0 (13)
|
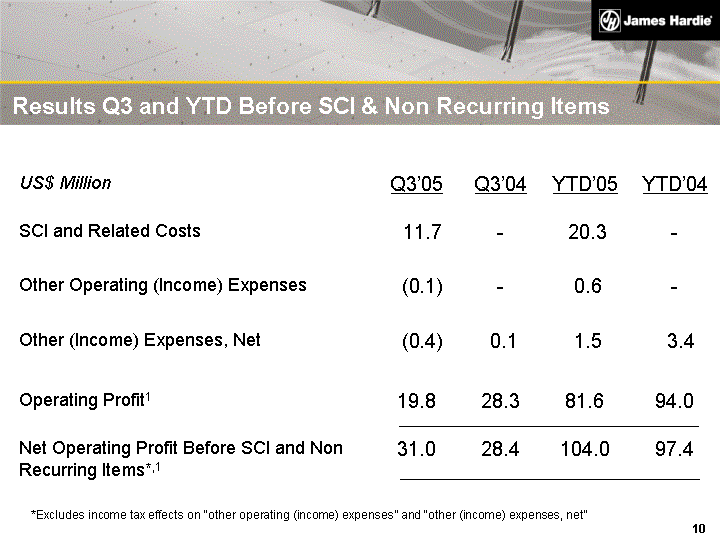
|
Results Q3 and YTD Before SCI & Non Recurring Items
US$ Million Q3'05 Q3'04 YTD'05 YTD'04
SCI and Related Costs 11.7 - 20.3 -
Other Operating (Income) Expenses (0.1)
- 0.6 -
Other (Income) Expenses, Net (0.4) 0.1 1.5 3.4
Operating Profit1 19.8 28.3 81.6 94.0
Net Operating Profit Before SCI and Non Recurring Items*,1 31.0 28.4 104.0 97.4
*Excludes income tax effects on "other operating (income) expenses" and "other (income) expenses, net"
|
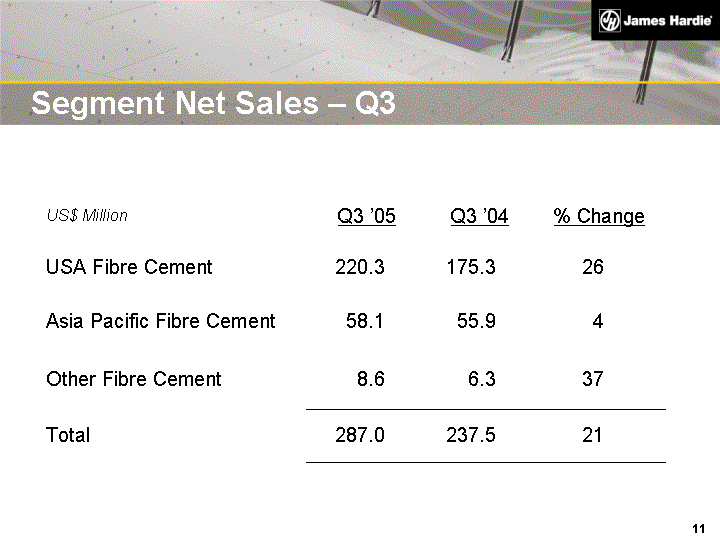
|
Segment Net Sales - Q3
US$ Million Q3 '05 Q3 '04 % Change
USA Fibre Cement 220.3 175.3 26
Asia Pacific Fibre Cement 58.1 55.9 4
Other Fibre Cement 8.6 6.3 37
Total 287.0 237.5 21
|
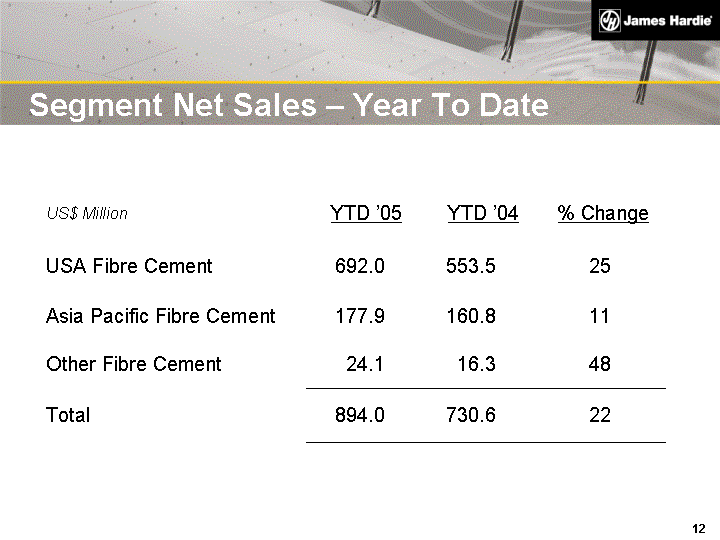
|
Segment Net Sales - Year To Date
US$ Million YTD '05 YTD '04 % Change
USA Fibre Cement 692.0 553.5 25
Asia Pacific Fibre Cement 177.9 160.8 11
Other Fibre Cement 24.1 16.3 48
Total 894.0 730.6 22
|
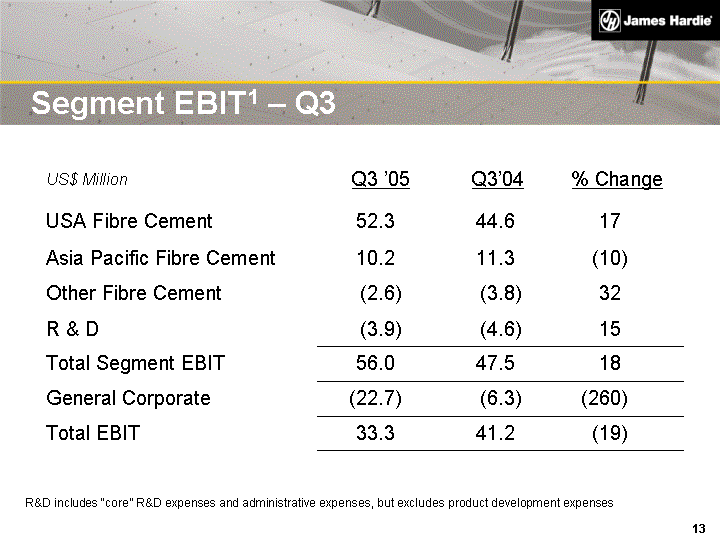
|
Segment EBIT1 - Q3
US$ Million Q3 '05 Q3'04 % Change
USA Fibre Cement 52.3 44.6 17
Asia Pacific Fibre Cement 10.2 11.3 (10)
Other Fibre Cement (2.6) (3.8) 32
R & D (3.9) (4.6) 15
Total Segment EBIT 56.0 47.5 18
General Corporate (22.7) (6.3) (260)
Total EBIT 33.3 41.2 (19)
R&D includes "core" R&D expenses and administrative expenses, but excludes product development expenses
|
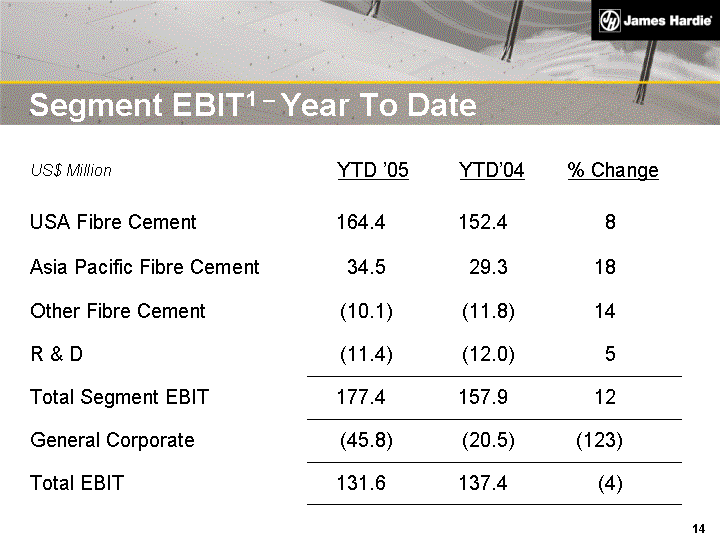
|
Segment EBIT1 - Year To Date
US$ Million YTD '05 YTD'04 % Change
USA Fibre Cement 164.4 152.4 8
Asia Pacific Fibre Cement 34.5 29.3 18
Other Fibre Cement (10.1) (11.8) 14
R & D (11.4) (12.0) 5
Total Segment EBIT 177.4 157.9 12
General Corporate (45.8) (20.5) (123)
Total EBIT 131.6 137.4 (4)
|
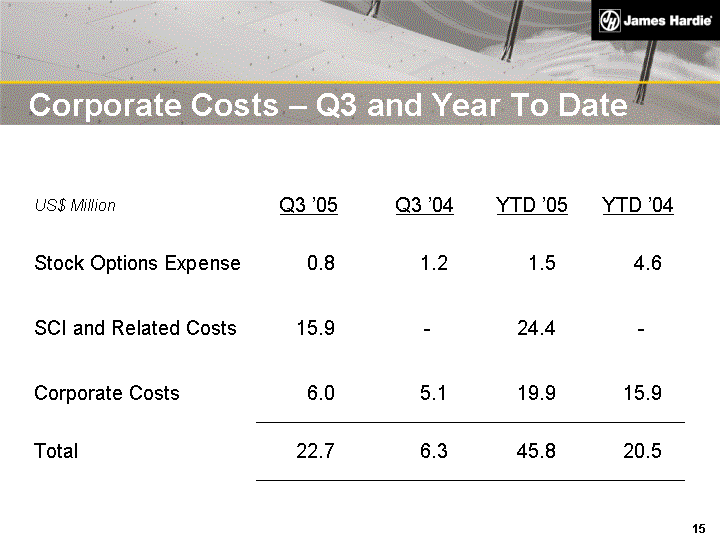
|
Corporate Costs - Q3 and Year To Date
US$ Million Q3 '05 Q3 '04 YTD '05 YTD '04
Stock Options Expense 0.8 1.2 1.5 4.6
SCI and Related Costs 15.9 - 24.4 -
Corporate Costs 6.0 5.1 19.9 15.9
Total 22.7 6.3 45.8 20.5
|
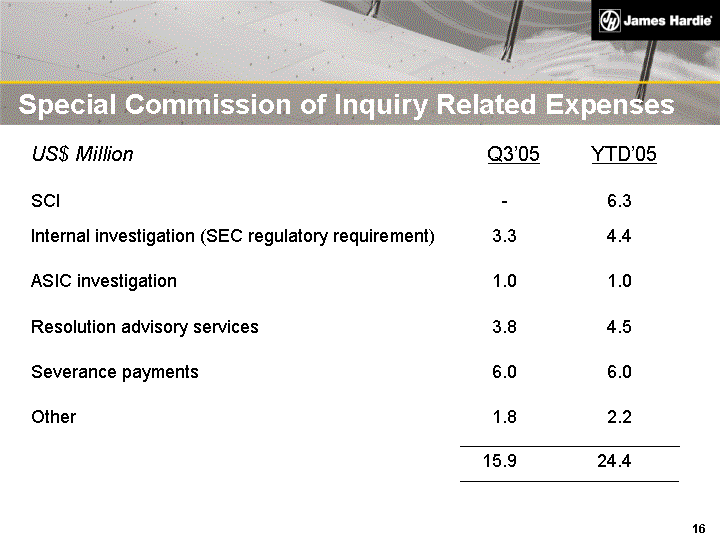
|
Special Commission of Inquiry Related Expenses
US$ Million Q3'05 YTD'05
SCI - 6.3
Internal investigation (SEC regulatory requirement) 3.3 4.4
ASIC investigation 1.0 1.0
Resolution advisory services 3.8 4.5
Severance payments 6.0 6.0
Other 1.8 2.2
15.9 24.4
|
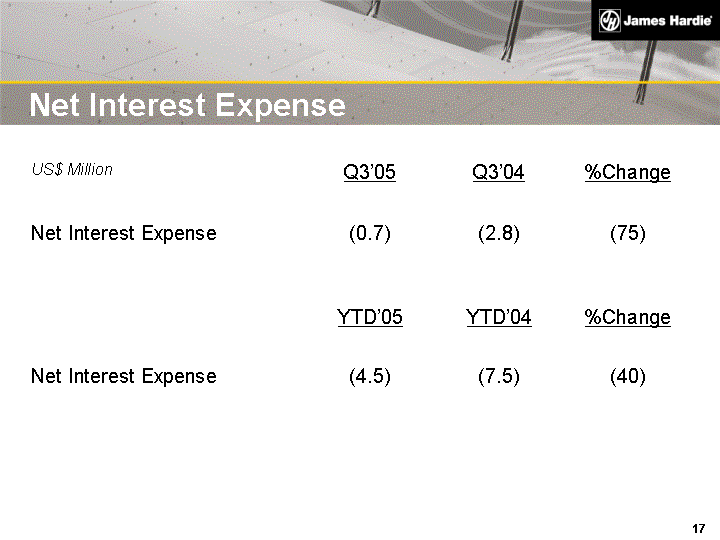
|
Net Interest Expense
US$ Million Q3'05 Q3'04 %Change
Net Interest Expense (0.7) (2.8) (75)
YTD'05 YTD'04 %Change
Net Interest Expense (4.5) (7.5) (40)
|
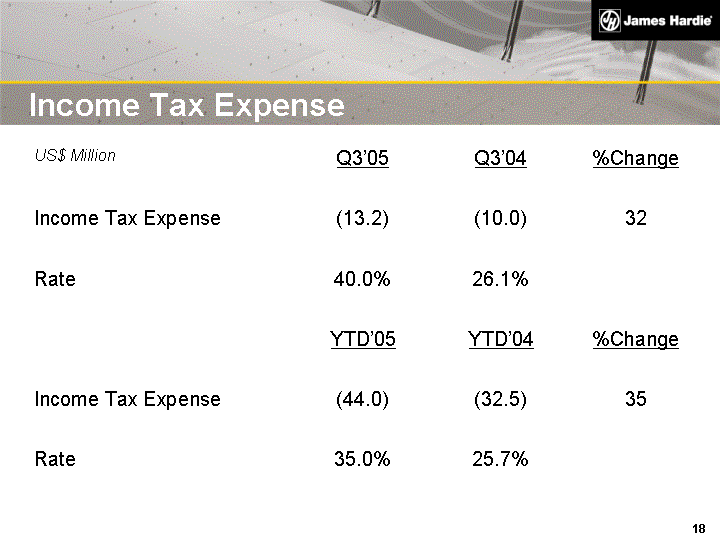
|
Income Tax Expense
US$ Million Q3'05 Q3'04 %Change
Income Tax Expense (13.2) (10.0) 32
Rate 40.0% 26.1%
YTD'05 YTD'04 %Change
Income Tax Expense (44.0) (32.5) 35
Rate 35.0% 25.7%
|
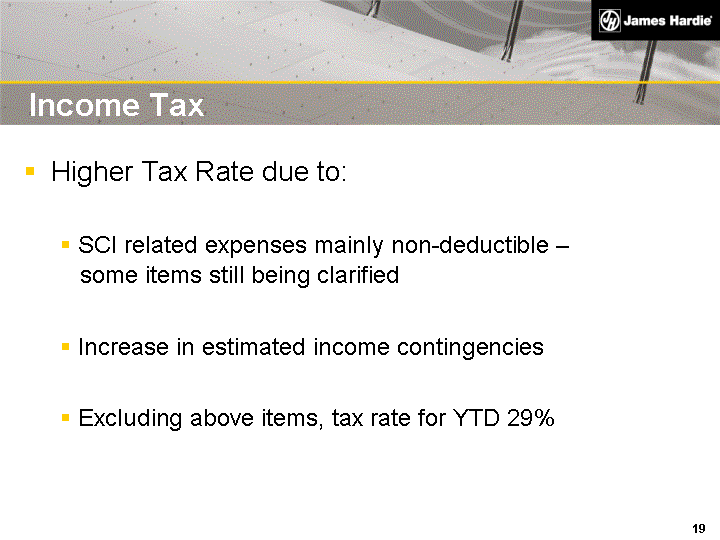
|
Income Tax
Higher Tax Rate due to:
SCI related expenses mainly non-deductible -
some items still being clarified
Increase in estimated income contingencies
Excluding above items, tax rate for YTD 29%
|
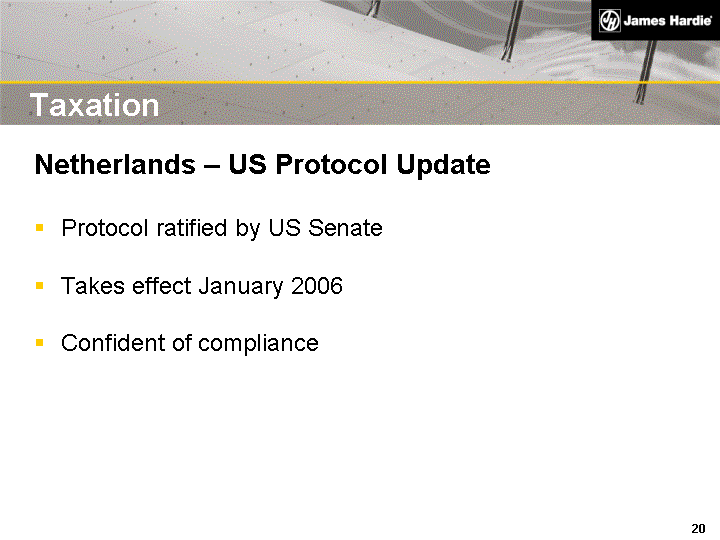
|
Taxation
Netherlands - US Protocol Update
Protocol ratified by US Senate
Takes effect January 2006
Confident of compliance
|
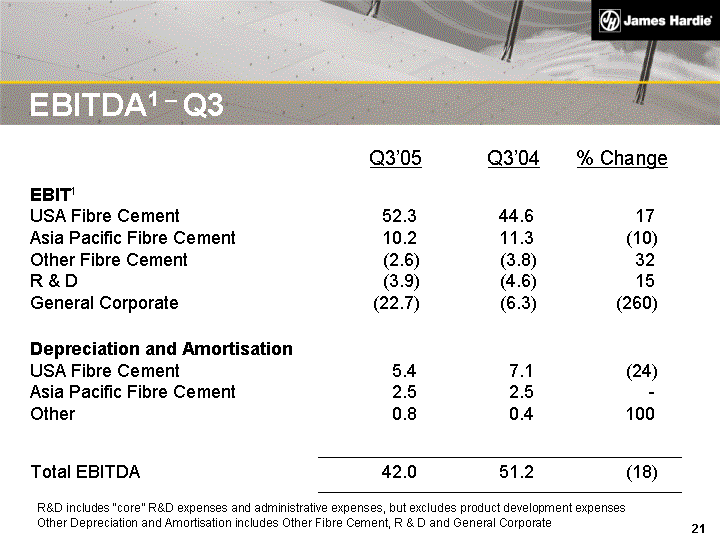
|
EBITDA1 - Q3
Q3'05 Q3'04 % Change
EBIT1
USA Fibre Cement
Asia Pacific Fibre Cement
Other Fibre Cement
R & D
General Corporate
52.3
10.2
(2.6) (3.9)
(22.7)
44.6
11.3
(3.8)
(4.6)
(6.3)
17
(10)
32
15
(260)
Depreciation and Amortisation
USA Fibre Cement
Asia Pacific Fibre Cement
Other
5.4
2.5
0.8
7.1
2.5
0.4
(24)
-
100
Total EBITDA 42.0 51.2 (18)
R&D includes "core" R&D expenses and administrative expenses, but excludes product development expenses
Other Depreciation and Amortisation includes Other Fibre Cement, R & D and General Corporate
|
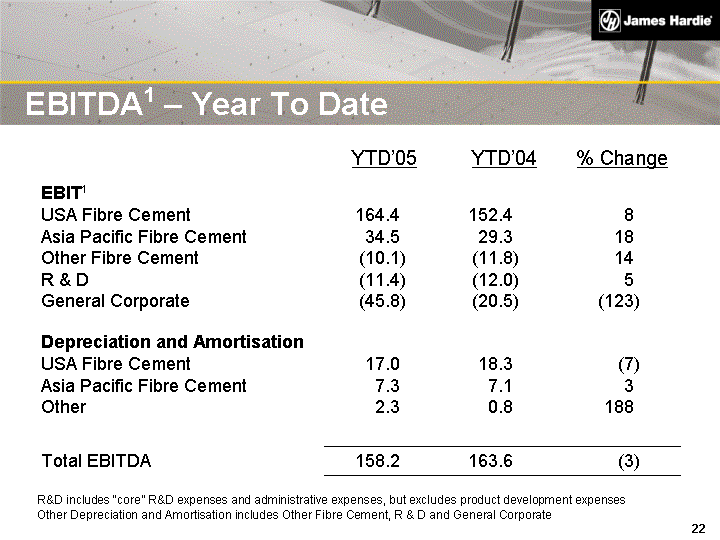
|
EBITDA1 - Year To Date
YTD'05 YTD'04 % Change
EBIT1
USA Fibre Cement
Asia Pacific Fibre Cement
Other Fibre Cement
R & D
General Corporate
164.4
34.5
(10.1) (11.4)
(45.8)
152.4
29.3
(11.8)
(12.0)
(20.5)
8
18
14
5
(123)
Depreciation and Amortisation
USA Fibre Cement
Asia Pacific Fibre Cement
Other
17.0
7.3
2.3
18.3
7.1
0.8
(7)
3
188
Total EBITDA 158.2 163.6 (3)
R&D includes "core" R&D expenses and administrative expenses, but excludes product development expenses
Other Depreciation and Amortisation includes Other Fibre Cement, R & D and General Corporate
|
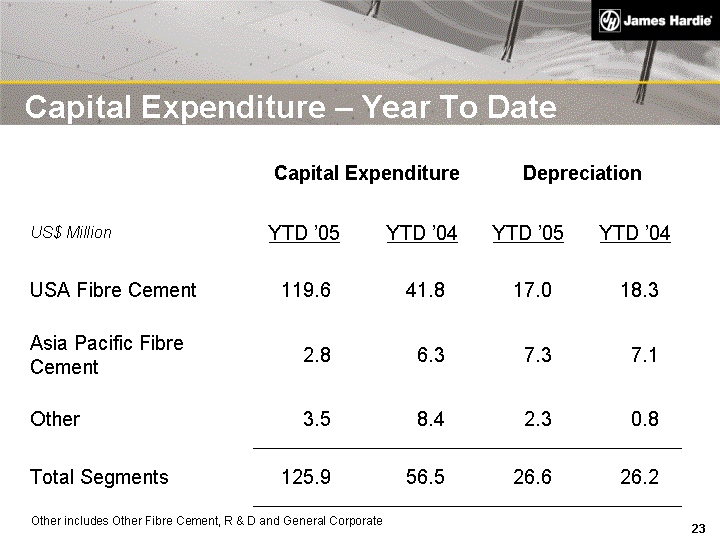
|
Capital Expenditure - Year To Date
Capital Expenditure Capital Expenditure Depreciation Depreciation
US$ Million YTD '05 YTD '04 YTD '05 YTD '04
USA Fibre Cement 119.6 41.8 17.0 18.3
Asia Pacific Fibre Cement 2.8 6.3 7.3 7.1
Other 3.5 8.4 2.3 0.8
Total Segments 125.9 56.5 26.6 26.2
Other includes Other Fibre Cement, R & D and General Corporate
|
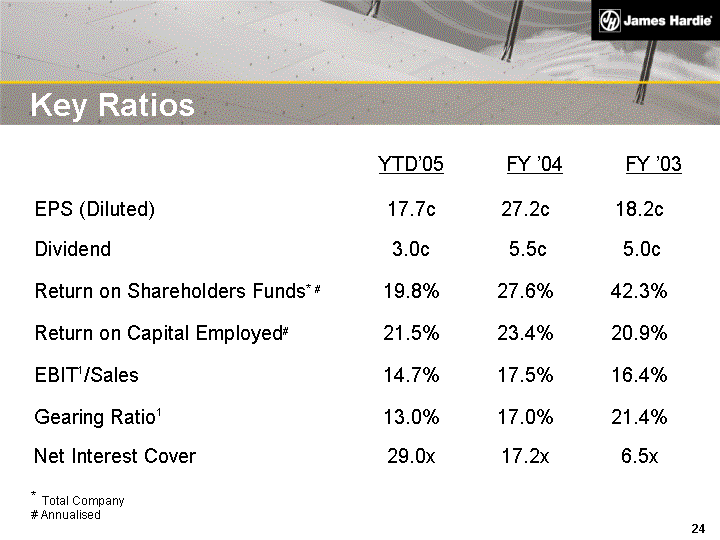
|
Key Ratios
YTD'05 FY '04 FY '03
EPS (Diluted) 17.7c 27.2c 18.2c
Dividend 3.0c 5.5c 5.0c
Return on Shareholders Funds* # 19.8% 27.6% 42.3%
Return on Capital Employed# 21.5% 23.4% 20.9%
EBIT1/Sales 14.7% 17.5% 16.4%
Gearing Ratio1 13.0% 17.0% 21.4%
Net Interest Cover 29.0x 17.2x 6.5x
* Total Company
# Annualised
|

|
Operating Review
Louis Gries, CEO
|
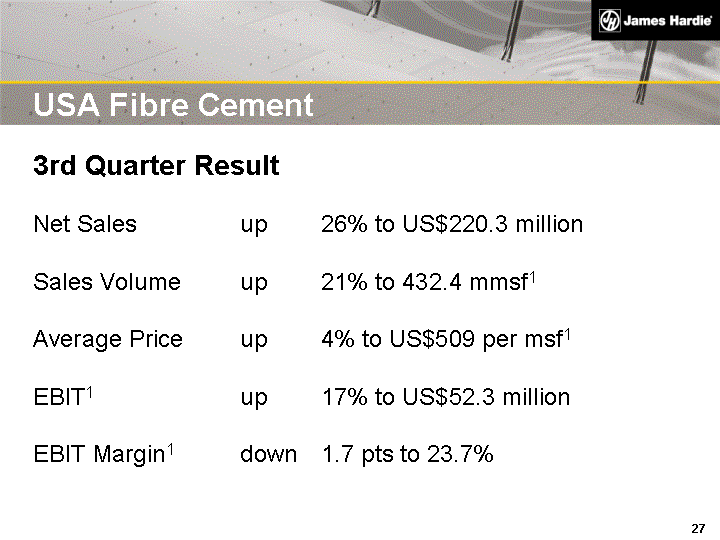
|
3rd Quarter Result
Net Sales up 26% to US$220.3 million
Sales Volume up 21% to 432.4 mmsf1
Average Price up 4% to US$509 per msf1
EBIT1 up 17% to US$52.3 million
EBIT Margin1 down 1.7 pts to 23.7%
USA Fibre Cement
|
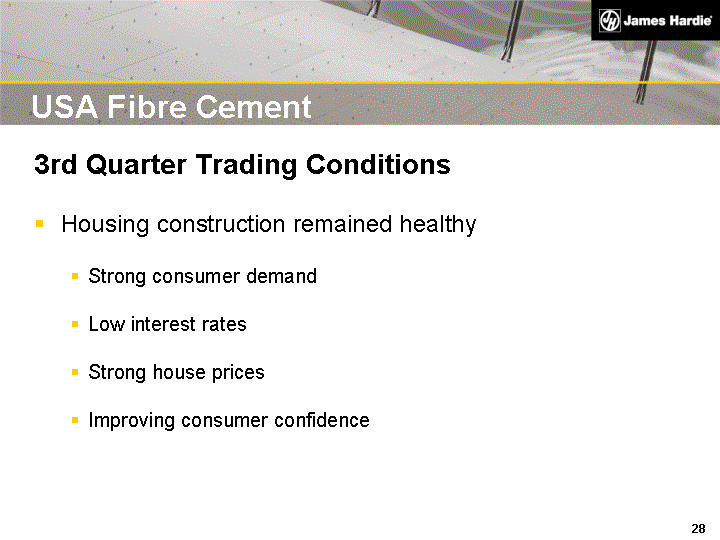
|
USA Fibre Cement
3rd Quarter Trading Conditions
Housing construction remained healthy
Strong consumer demand
Low interest rates
Strong house prices
Improving consumer confidence
|
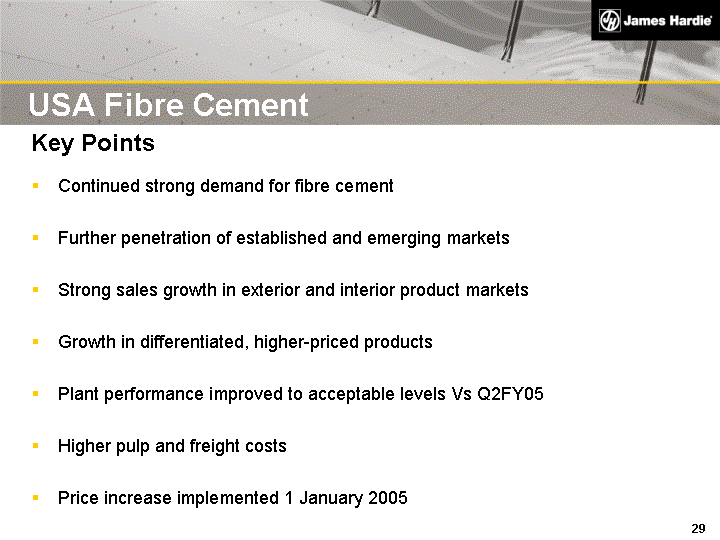
|
USA Fibre Cement
Key Points
Continued strong demand for fibre cement
Further penetration of established and emerging markets
Strong sales growth in exterior and interior product markets
Growth in differentiated, higher-priced products
Plant performance improved to acceptable levels Vs Q2FY05
Higher pulp and freight costs
Price increase implemented 1 January 2005
|
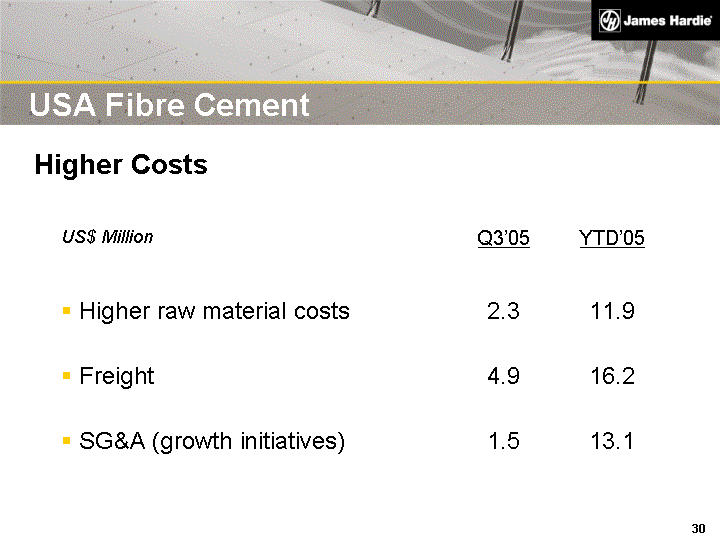
|
USA Fibre Cement
Higher Costs
US$ Million
Q3'05
YTD'05
Higher raw material costs 2.3 11.9
Freight 4.9 16.2
SG&A (growth initiatives) 1.5 13.1
|
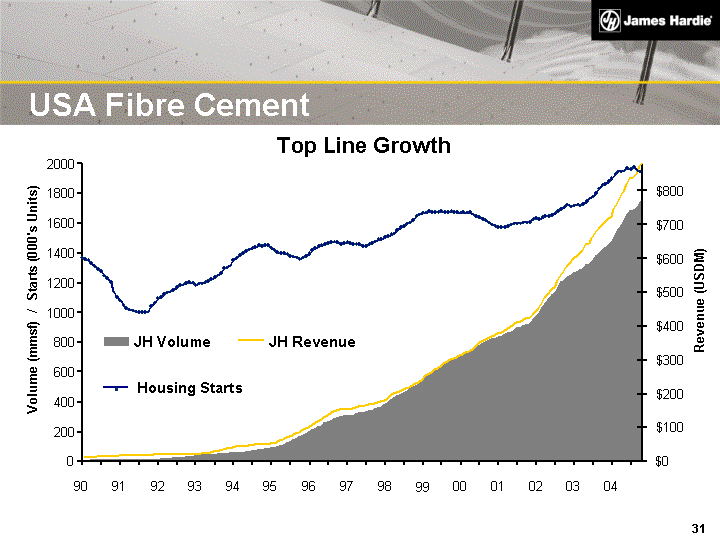
|
USA Fibre Cement
Top Line Growth
0
200
400
600
800
1000
1200
1400
1600
1800
2000
90
91
92
93
94
95
96
97
98
99
00
01
02
03
04
Volume (mmsf) / Starts (000's Units)
$0
$100
$200
$300
$400
$500
$600
$700
$800
Revenue (USDM)
JH Volume
JH Revenue
Housing Starts
|
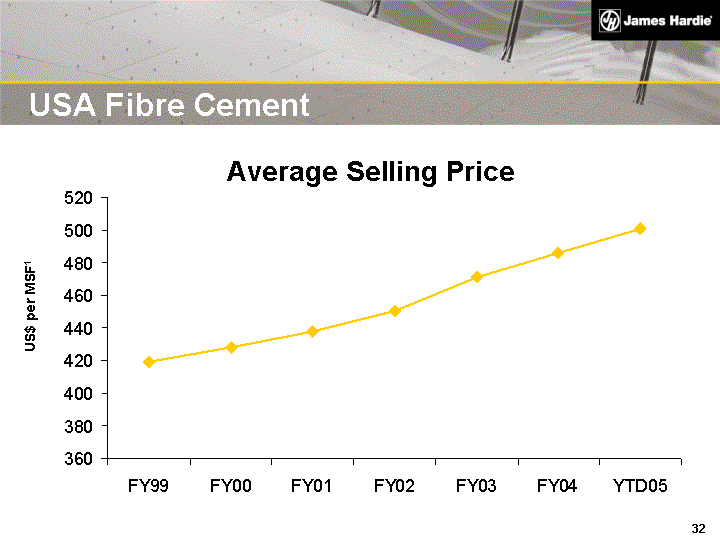
|
USA Fibre Cement
Average Selling Price
US$ per MSF1
|
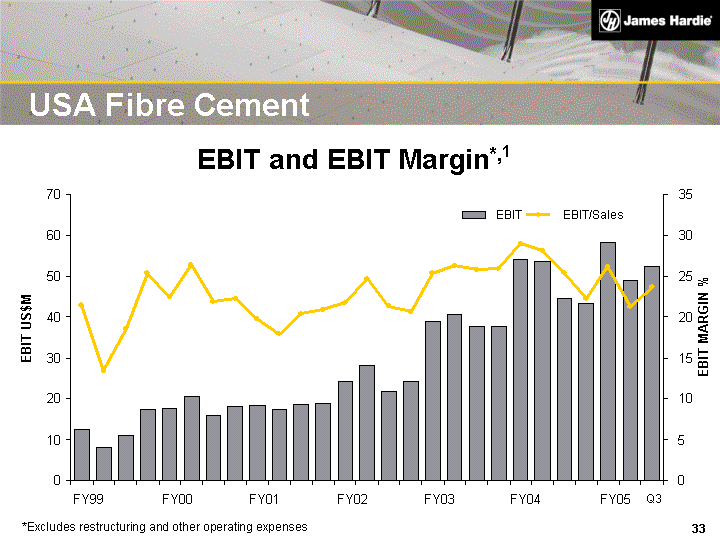
|
USA Fibre Cement
*Excludes restructuring and other operating expenses
EBIT and EBIT Margin*,1
0
10
20
30
40
50
60
70
FY99
FY00
FY01
FY02
FY03
FY04
FY05
EBIT US$M
0
5
10
15
20
25
30
35
EBIT MARGIN %
EBIT
EBIT/Sales
Q3
|
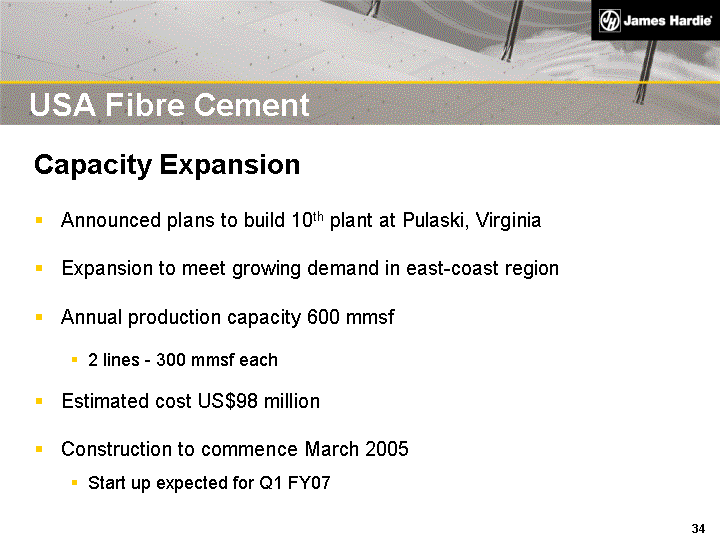
|
USA Fibre Cement
Capacity Expansion
Announced plans to build 10th plant at Pulaski, Virginia
Expansion to meet growing demand in east-coast region
Annual production capacity 600 mmsf
2 lines - 300 mmsf each
Estimated cost US$98 million
Construction to commence March 2005
Start up expected for Q1 FY07
|

|
USA Fibre Cement
Strategy
Aggressively grow market for fibre cement
Grow our overall market position while defending our
share in existing market segments
Offer products with superior value to that of our
competitors, introducing differentiated products to reduce
direct price competition
|
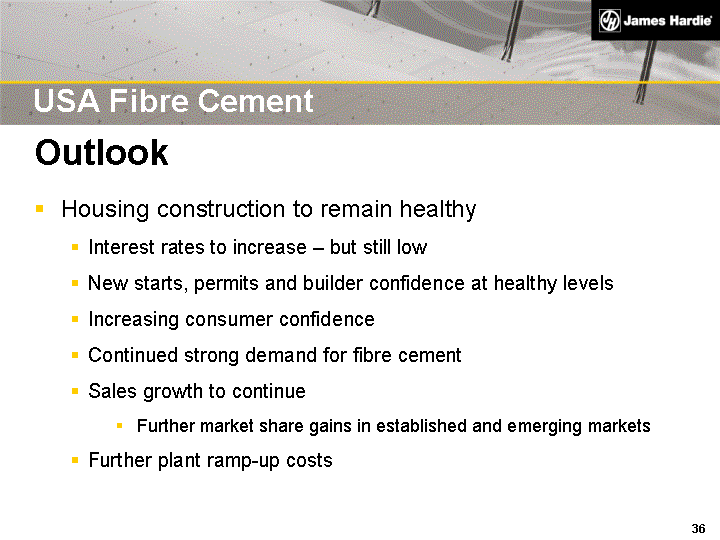
|
USA Fibre Cement
Outlook
Housing construction to remain healthy
Interest rates to increase - but still low
New starts, permits and builder confidence at healthy levels
Increasing consumer confidence
Continued strong demand for fibre cement
Sales growth to continue
Further market share gains in established and emerging markets
Further plant ramp-up costs
|
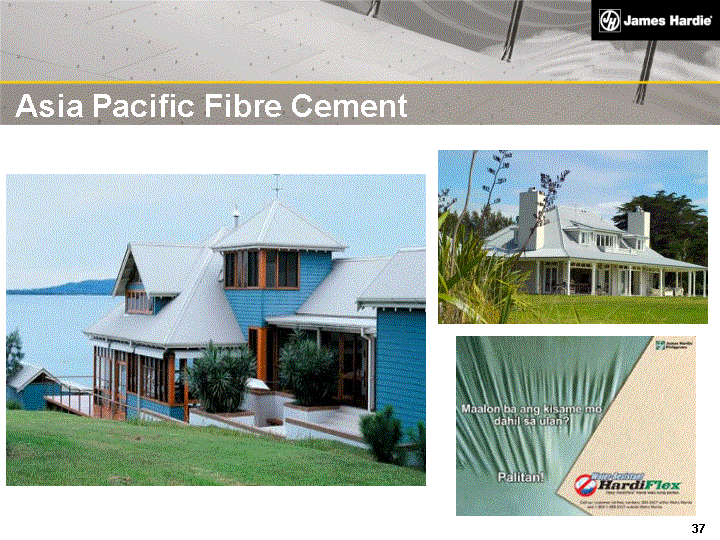
|
Asia Pacific Fibre Cement
|
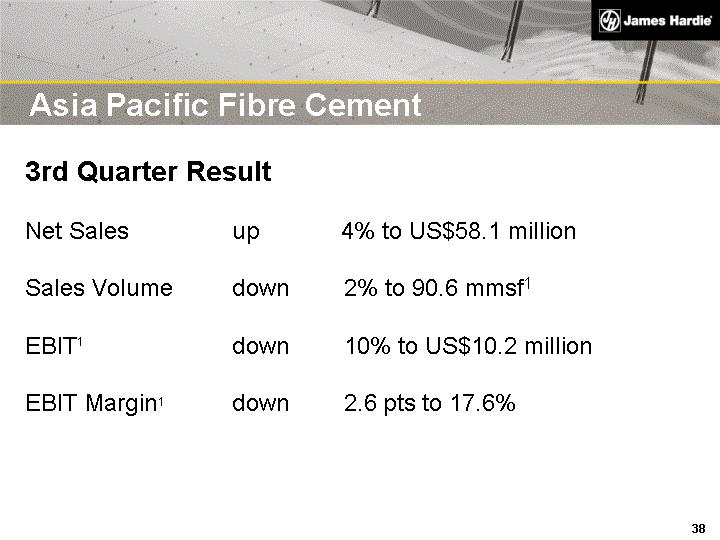
|
Asia Pacific Fibre Cement
3rd Quarter Result
Net Sales up 4% to US$58.1 million
Sales Volume down 2% to 90.6 mmsf1
EBIT1 down 10% to US$10.2 million
EBIT Margin1 down 2.6 pts to 17.6%
|
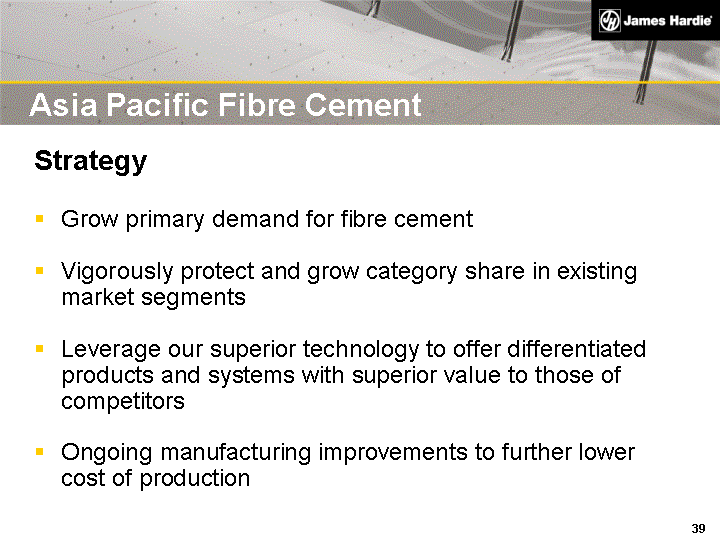
|
Strategy
Grow primary demand for fibre cement
Vigorously protect and grow category share in existing
market segments
Leverage our superior technology to offer differentiated
products and systems with superior value to those of
competitors
Ongoing manufacturing improvements to further lower
cost of production
Asia Pacific Fibre Cement
|
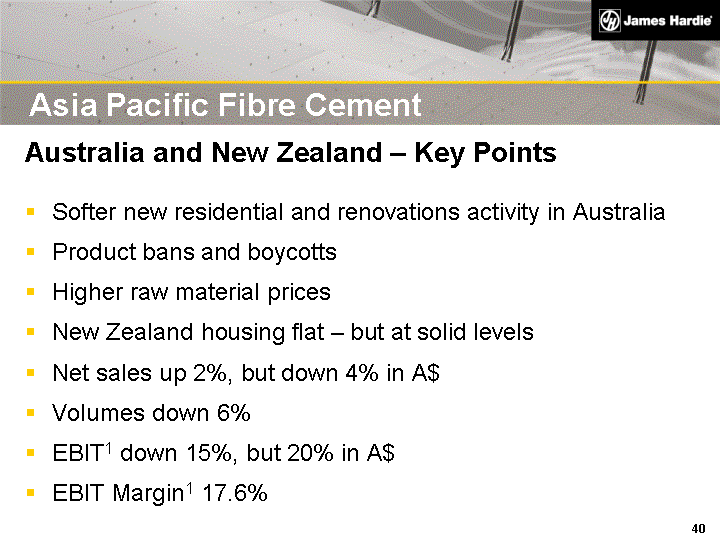
|
Australia and New Zealand - Key Points
Softer new residential and renovations activity in Australia
Product bans and boycotts
Higher raw material prices
New Zealand housing flat - but at solid levels
Net sales up 2%, but down 4% in A$
Volumes down 6%
EBIT1 down 15%, but 20% in A$
EBIT Margin1 17.6%
Asia Pacific Fibre Cement
|
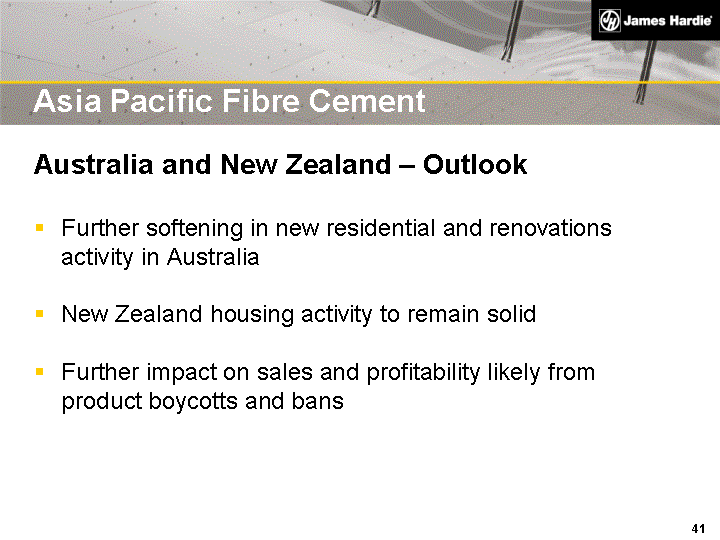
|
Asia Pacific Fibre Cement
Australia and New Zealand - Outlook
Further softening in new residential and renovations
activity in Australia
New Zealand housing activity to remain solid
Further impact on sales and profitability likely from
product boycotts and bans
|
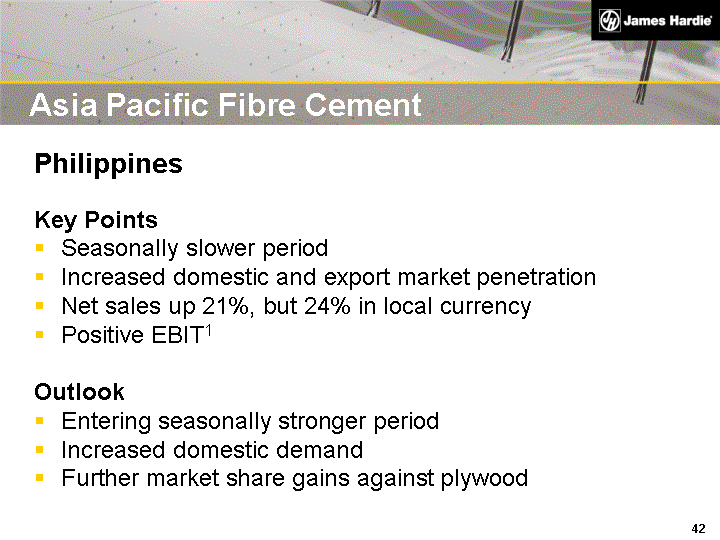
|
Asia Pacific Fibre Cement
Philippines
Key Points
Seasonally slower period
Increased domestic and export market penetration
Net sales up 21%, but 24% in local currency
Positive EBIT1
Outlook
Entering seasonally stronger period
Increased domestic demand
Further market share gains against plywood
|
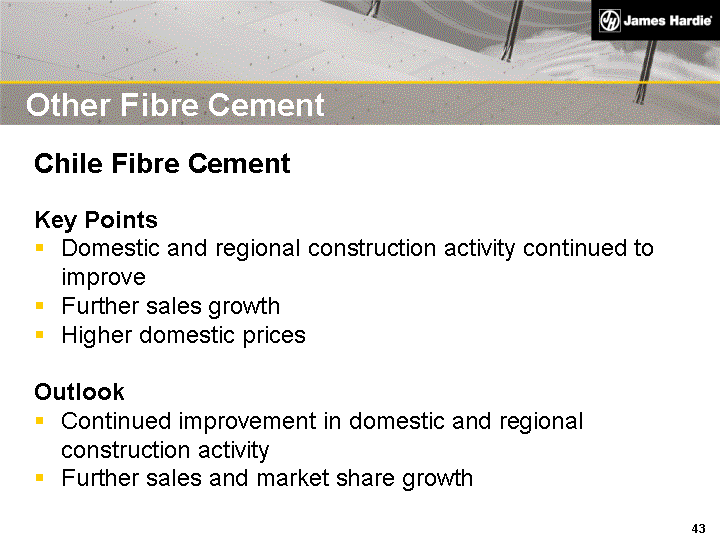
|
Other Fibre Cement
Chile Fibre Cement
Key Points
Domestic and regional construction activity continued to
improve
Further sales growth
Higher domestic prices
Outlook
Continued improvement in domestic and regional
construction activity
Further sales and market share growth
|
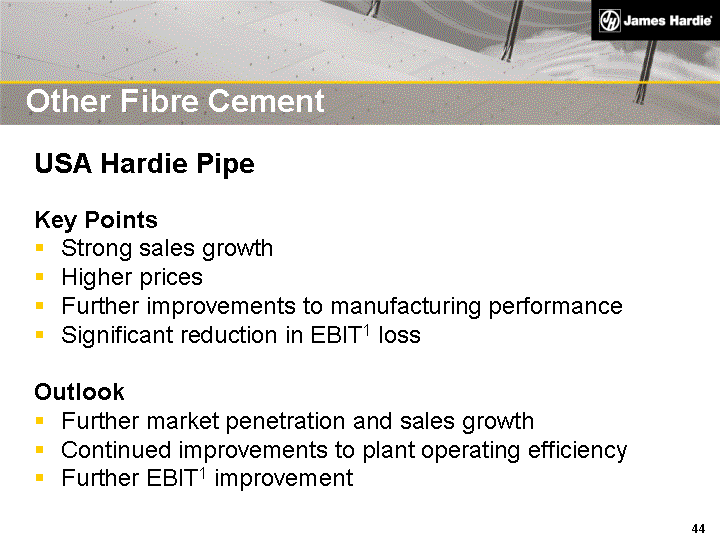
|
Other Fibre Cement
USA Hardie Pipe
Key Points
Strong sales growth
Higher prices
Further improvements to manufacturing performance
Significant reduction in EBIT1 loss
Outlook
Further market penetration and sales growth
Continued improvements to plant operating efficiency
Further EBIT1 improvement
|
|
Other Fibre Cement
Europe Fibre Cement
Awareness growing among distributors, builders and
contractors
Sales continuing to build steadily
Artisan(tm) roofing
Commercial sales during the quarter
Continuing to prove business model
|
|
Research and Development
Key driver of growth
Core projects
engineered raw materials
product formulations
engineering and process technologies
lightweight and durable products for all climates
Sustainable competitive advantage continuing to be built
|
|
Outlook
Overall, strong top line growth continuing into 4th quarter
Good prospect for satisfactory full year operating results
Further SCI related costs to affect bottom line
|
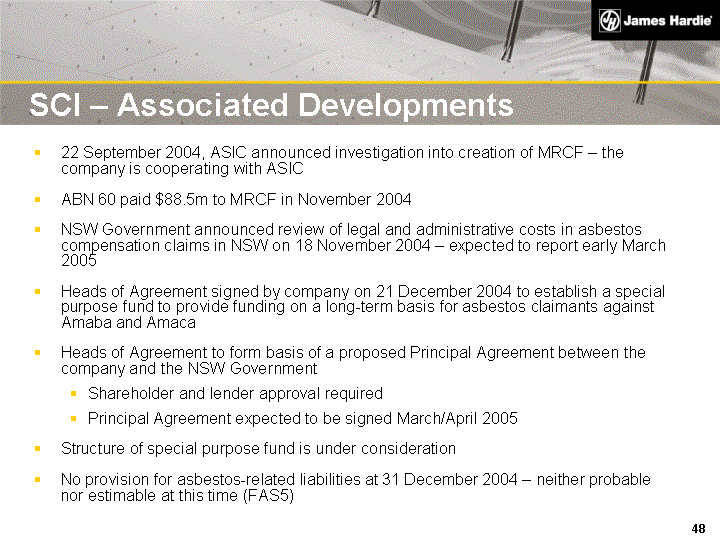
|
SCI - Associated Developments
22 September 2004, ASIC announced investigation into creation of MRCF - the
company is cooperating with ASIC
ABN 60 paid $88.5m to MRCF in November 2004
NSW Government announced review of legal and administrative costs in asbestos
compensation claims in NSW on 18 November 2004 - expected to report early March
2005
Heads of Agreement signed by company on 21 December 2004 to establish a special
purpose fund to provide funding on a long-term basis for asbestos claimants against
Amaba and Amaca
Heads of Agreement to form basis of a proposed Principal Agreement between the
company and the NSW Government
Shareholder and lender approval required
Principal Agreement expected to be signed March/April 2005
Structure of special purpose fund is under consideration
No provision for asbestos-related liabilities at 31 December 2004 - neither probable
nor estimable at this time (FAS5)
|
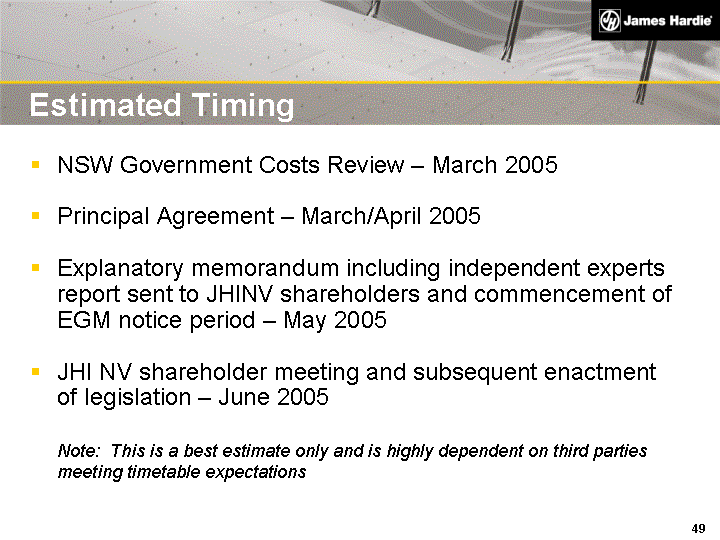
|
Estimated Timing
NSW Government Costs Review - March 2005
Principal Agreement - March/April 2005
Explanatory memorandum including independent experts
report sent to JHINV shareholders and commencement of
EGM notice period - May 2005
JHI NV shareholder meeting and subsequent enactment
of legislation - June 2005
Note: This is a best estimate only and is highly dependent on third parties
meeting timetable expectations
|
|
Disclaimer
This Presentation contains forward-looking statements. We may from time to time make forward-looking statements in our
periodic reports filed with the Securities and Exchange Commission on Forms 20-F and 6-K, in our annual reports to
shareholders, in offering circulars and prospectuses, in media releases and other written materials and in oral statements
made by our officers, directors or employees to analysts, institutional investors, representatives of the media and others.
Examples of such forward-looking statements include:
projections of our operating results or financial condition;
statements of our plans, objectives or goals, including those relating to competition, acquisitions,
dispositions and our products;
statements about our future economic performance or that of the United States, Australia or other
countries in which we operate; and
statements about product or environmental liabilities.
Words such as "believe," "anticipate," "plan," "expect," "intend," "target," "estimate," "project," "predict," "forecast,"
"guideline," "should," "aim" and similar expressions are intended to identify forward-looking statements but are not the
exclusive means of identifying such statements.
Forward-looking statements involve inherent risks and uncertainties. We caution you that a number of important factors
could cause actual results to differ materially from the plans, objectives, expectations, estimates and intentions expressed
in such forward-looking statements. These factors include but are not limited to: all matters relating to or arising out of the
prior manufacture of asbestos by ABN 60 and certain former subsidiaries; competition and product pricing in the markets
in which we operate; general economic and market conditions; compliance with and possible changes in environmental
and health and safety laws; the successful transition of new senior management; the success of our research and
development efforts; the supply and cost of raw materials; our reliance on a small number of product distributors; the
consequences of product failures or defects; exposure to environmental, asbestos or other legal proceedings; risks of
conducting business internationally; compliance with and changes in tax laws and treatments; and foreign exchange risks.
We caution you that the foregoing list of factors is not exclusive and that other risks and uncertainties may cause actual
results to differ materially from those in forward-looking statements. Forward-looking statements speak only as of the date
they are made.
|
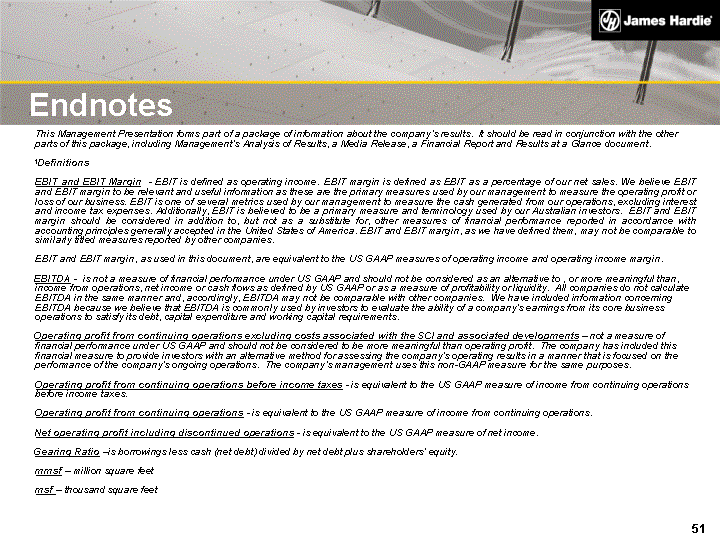
|
Endnotes
This Management Presentation forms part of a package of information about the company's results. It should be read in conjunction with the other
parts of this package, including Management's Analysis of Results, a Media Release, a Financial Report and Results at a Glance document.
1Definitions
EBIT and EBIT Margin - EBIT is defined as operating income. EBIT margin is defined as EBIT as a percentage of our net sales. We believe EBIT
and EBIT margin to be relevant and useful information as these are the primary measures used by our management to measure the operating profit or
loss of our business. EBIT is one of several metrics used by our management to measure the cash generated from our operations, excluding interest
and income tax expenses. Additionally, EBIT is believed to be a primary measure and terminology used by our Australian investors. EBIT and EBIT
margin should be considered in addition to, but not as a substitute for, other measures of financial performance reported in accordance with
accounting principles generally accepted in the United States of America. EBIT and EBIT margin, as we have defined them, may not be comparable to
similarly titled measures reported by other companies.
EBIT and EBIT margin, as used in this document, are equivalent to the US GAAP measures of operating income and operating income margin.
EBITDA - is not a measure of financial performance under US GAAP and should not be considered as an alternative to , or more meaningful than,
income from operations, net income or cash flows as defined by US GAAP or as a measure of profitability or liquidity. All companies do not calculate
EBITDA in the same manner and, accordingly, EBITDA may not be comparable with other companies. We have included information concerning
EBITDA because we believe that EBITDA is commonly used by investors to evaluate the ability of a company's earnings from its core business
operations to satisfy its debt, capital expenditure and working capital requirements.
Operating profit from continuing operations excluding costs associated with the SCI and associated developments - not a measure of
financial performance under US GAAP and should not be considered to be more meaningful than operating profit. The company has included this
financial measure to provide investors with an alternative method for assessing the company's operating results in a manner that is focused on the
performance of the company's ongoing operations. The company's management uses this non-GAAP measure for the same purposes.
Operating profit from continuing operations before income taxes - is equivalent to the US GAAP measure of income from continuing operations
before income taxes.
Operating profit from continuing operations - is equivalent to the US GAAP measure of income from continuing operations.
Net operating profit including discontinued operations - is equivalent to the US GAAP measure of net income.
Gearing Ratio -is borrowings less cash (net debt) divided by net debt plus shareholders' equity.
mmsf - million square feet
msf - thousand square feet
|
|
FY05 3rd Quarter and Year To Date Results
14 February 2005
Unless otherwise stated, results are for continuing operations only and comparisons are of the 3rd quarter
of the current fiscal year versus the 3rd quarter of the prior fiscal year.
|


