| Building On Proven Performance UK Roadshow May/June 2005 |
| Building On Proven Performance UK Roadshow May/June 2005 |
| James Hardie Annual net sales US$1,210m Total assets US$1,089m Operations in North America, South America, Asia Pacific and Europe 3000 employees Market cap US$2.2 billion ASX S&P 50 company Note: Net sales and total assets are at 31 March 2005 A Growth Focussed Company PHOTO |
| Focussed on Fibre Cement High growth Unique proprietary technology Sustainable competitive advantage Strong cashflows and balance sheet Growth not reliant on strong housing market Investment Attributes PHOTO |

| First to Develop Fibre Cement James Hardie pioneered development of fibre cement technology in the 1980s Fibre Cement Sand Cellulose Fibre Water Portland Cement PHOTO |

| Business Overview |
| Many Product Applications External siding/soffit lining Internal wall/floor wet area lining Trim and fascia Ceiling lining and flooring External/internal wall systems Commercial facades Drainage pipes Roofing PHOTOS |
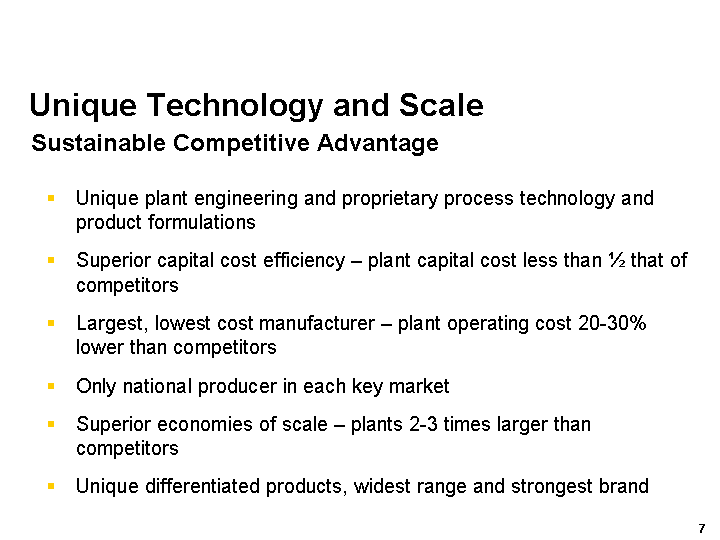
| Unique Technology and Scale Sustainable Competitive Advantage Unique plant engineering and proprietary process technology and product formulations Superior capital cost efficiency - plant capital cost less than 1/2 that of competitors Largest, lowest cost manufacturer - plant operating cost 20-30% lower than competitors Only national producer in each key market Superior economies of scale - plants 2-3 times larger than competitors Unique differentiated products, widest range and strongest brand |
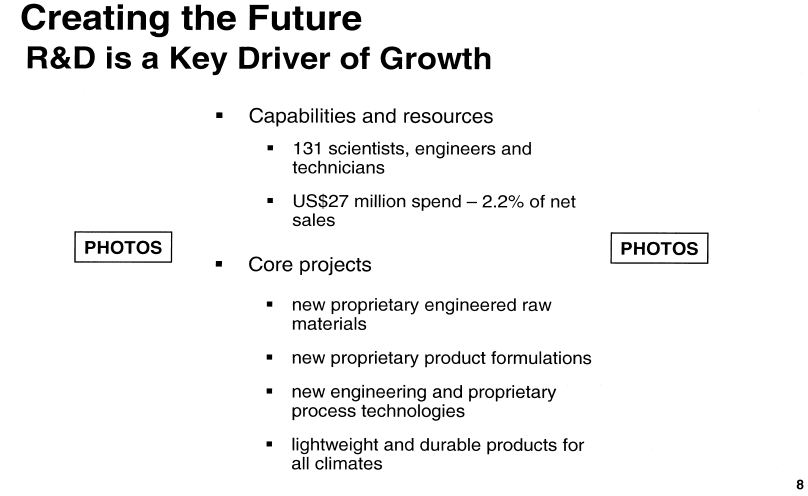
| Capabilities and resources 131 scientists, engineers and technicians US$27 million spend - 2.2% of net sales Core projects new proprietary engineered raw materials new proprietary product formulations new engineering and proprietary process technologies lightweight and durable products for all climates Creating the Future R&D is a Key Driver of Growth PHOTOS PHOTOS |
| Strategy Industry Leadership and Profitable Growth Aggressively grow the market Secure differentiated position Generate strong top line growth Win high shares of large segments Sustain attractive margins PHOTOS |
| Operations Overview |
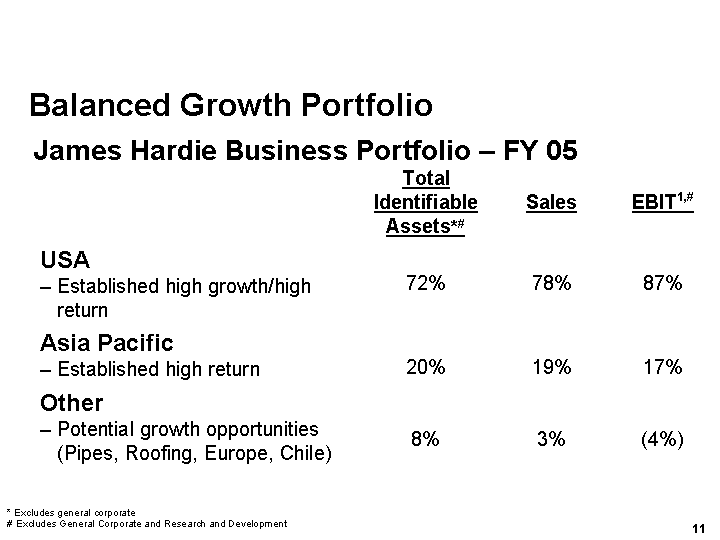
| Balanced Growth Portfolio James Hardie Business Portfolio - FY 05 Total Identifiable Assets*# Sales EBIT1,# USA - - Established high growth/high return 72% 78% 87% Asia Pacific - - Established high return 20% 19% 17% Other - - Potential growth opportunities (Pipes, Roofing, Europe, Chile) 8% 3% (4%) * Excludes general corporate # Excludes General Corporate and Research and Development |
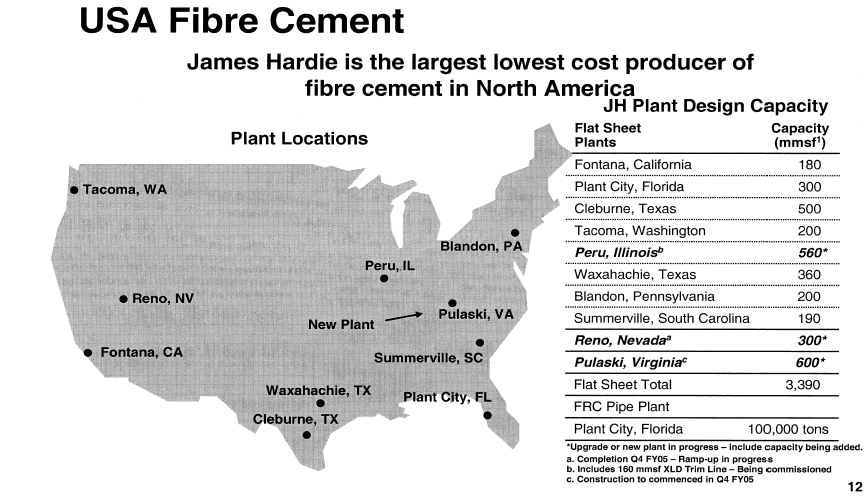
| USA Fibre Cement James Hardie is the largest lowest cost producer of fibre cement in North America Plant Locations Flat Sheet Plants Flat Sheet Plants Capacity (mmsf1) Fontana, California Fontana, California 180 Plant City, Florida Plant City, Florida 300 Cleburne, Texas Cleburne, Texas 500 Tacoma, Washington Tacoma, Washington 200 Peru, Illinoisb Peru, Illinoisb 560* Waxahachie, Texas Waxahachie, Texas 360 Blandon, Pennsylvania Blandon, Pennsylvania 200 Summerville, South Carolina Summerville, South Carolina 190 Reno, Nevadaa Reno, Nevadaa 300* Pulaski, Virginiac Pulaski, Virginiac 600* Flat Sheet Total Flat Sheet Total 3,390 FRC Pipe Plant FRC Pipe Plant Plant City, Florida 100,000 tons 100,000 tons JH Plant Design Capacity *Upgrade or new plant in progress - include capacity being added. a. Completion Q4 FY05 - Ramp-up in progress b. Includes 160 mmsf XLD Trim Line - Being commissioned c. Construction to commenced in Q4 FY05 Tacoma, WA Fontana, CA Plant City, FL Waxahachie, TX Cleburne, TX Peru,, IL Blandon, PA Summerville, SC Pulaski, VA Reno, NV New Plant |
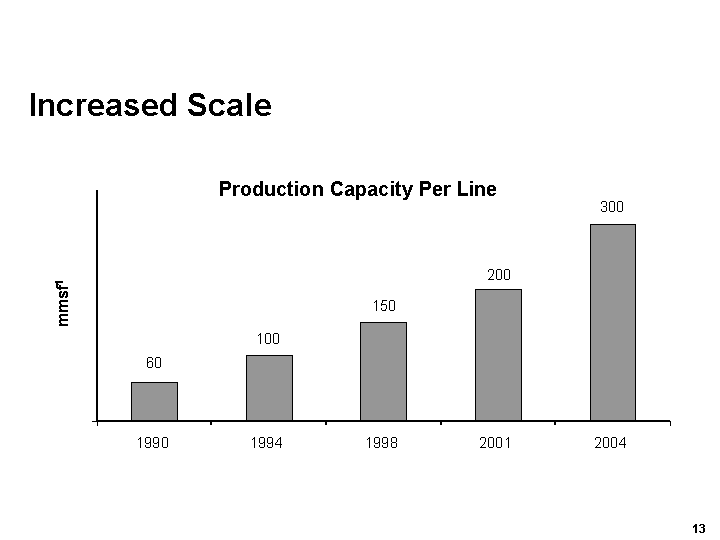
| Increased Scale 1990 1994 1998 2001 2004 mmsf1 60 100 150 200 300 Production Capacity Per Line |
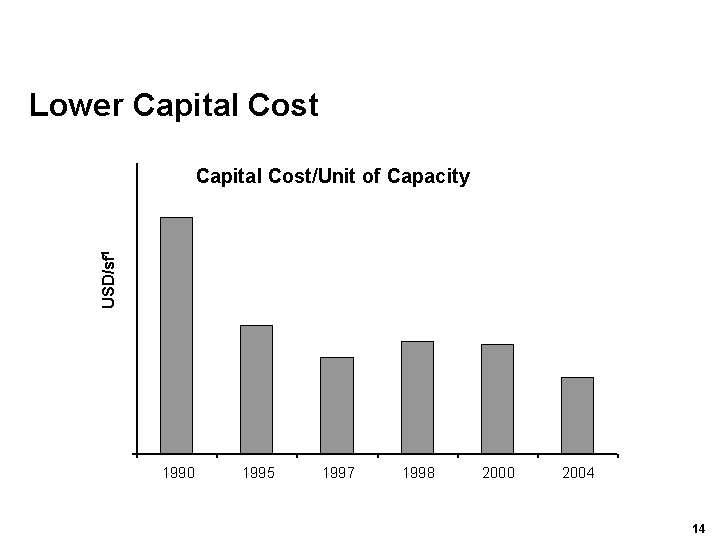
| Lower Capital Cost 1990 1995 1997 1998 2000 2004 USD/sf1 Capital Cost/Unit of Capacity |
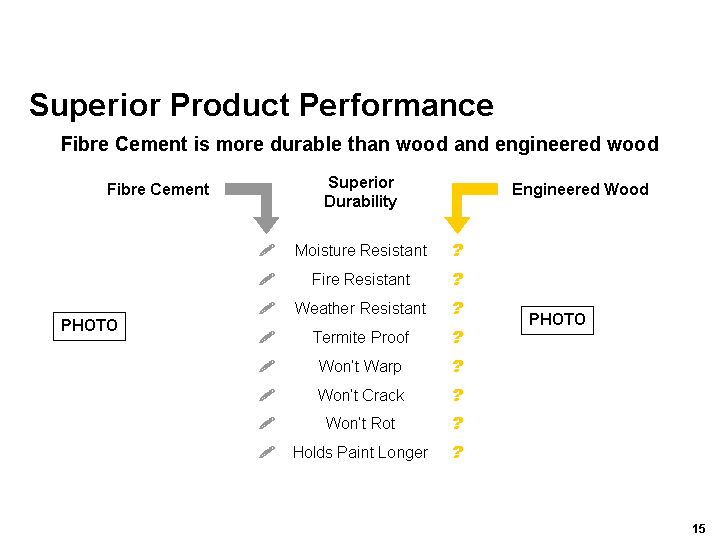
| Superior Product Performance Fibre Cement is more durable than wood and engineered wood Fibre Cement Superior Durability Moisture Resistant Fire Resistant Weather Resistant Termite Proof Won't Warp Won't Crack Won't Rot Holds Paint Longer ? ? ? ? ? ? ? ? ? ? ? ? ? ? ? ? Engineered Wood PHOTO PHOTO |
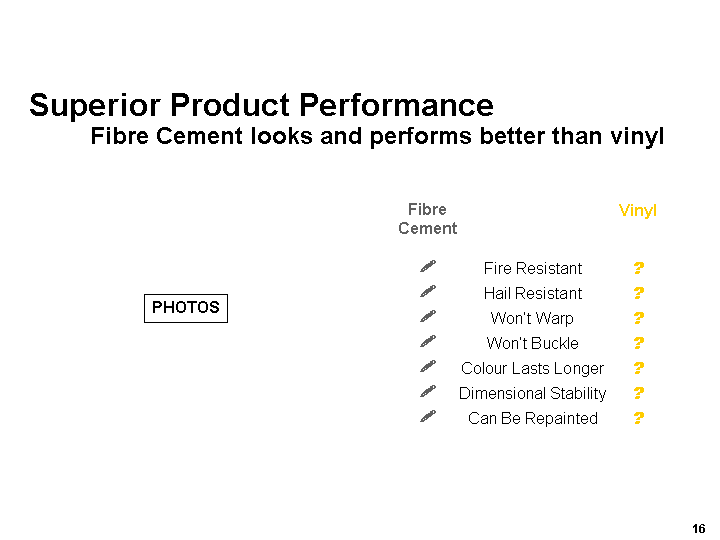
| Superior Product Performance Fibre Cement looks and performs better than vinyl Vinyl Fire Resistant Hail Resistant Won't Warp Won't Buckle Colour Lasts Longer Dimensional Stability Can Be Repainted ? ? ? ? ? ? ? ? ? ? ? ? ? ? Fibre Cement PHOTOS |
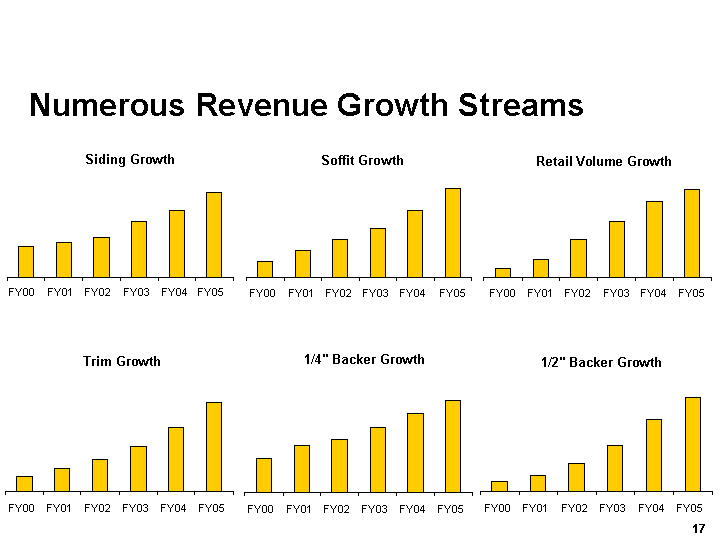
| Numerous Revenue Growth Streams Soffit Growth FY00 FY01 FY02 FY03 FY04 FY05 Retail Volume Growth FY00 FY01 FY02 FY03 FY04 FY05 Trim Growth FY00 FY01 FY02 FY03 FY04 FY05 1/4" Backer Growth FY00 FY01 FY02 FY03 FY04 FY05 1/2" Backer Growth FY00 FY01 FY02 FY03 FY04 FY05 |
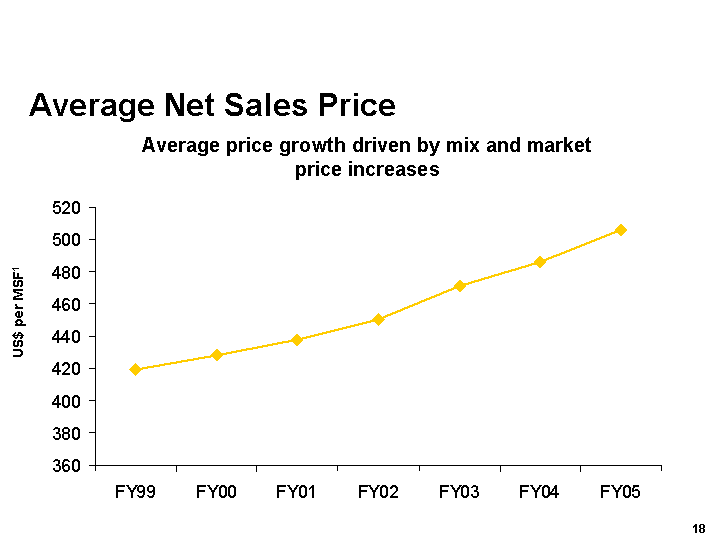
| Average price growth driven by mix and market price increases Average Net Sales Price US$ per MSF1 |
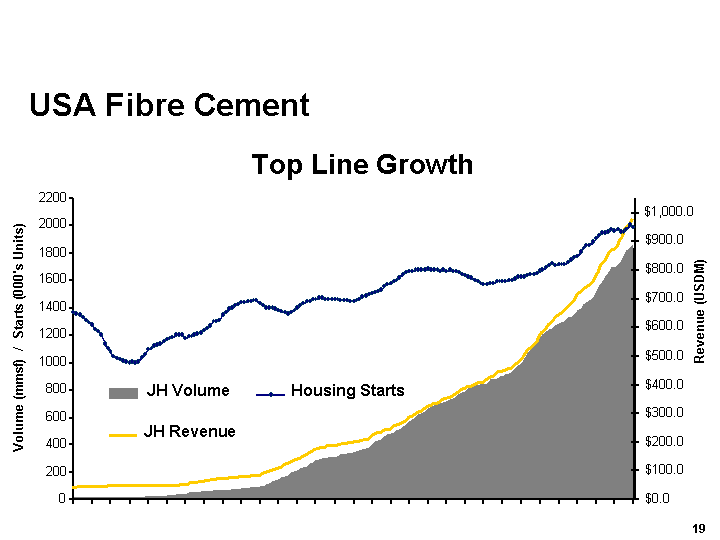
| USA Fibre Cement Revenue (USDM) Top Line Growth 0 200 400 600 800 1000 1200 1400 1600 1800 2000 2200 Volume (mmsf) / Starts (000's Units) $0.0 $100.0 $200.0 $300.0 $400.0 $500.0 $600.0 $700.0 $800.0 $900.0 $1,000.0 JH Volume JH Revenue Housing Starts |
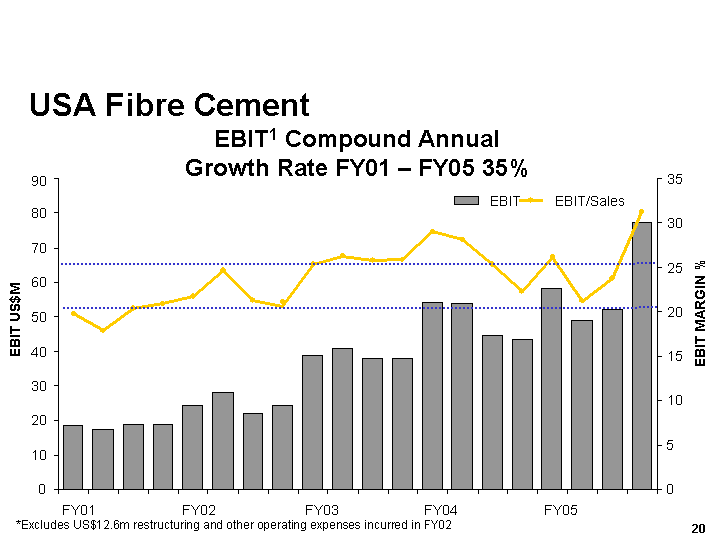
| USA Fibre Cement *Excludes restructuring and other operating expenses EBIT1 Compound Annual Growth Rate FY01 - FY05 35% *Excludes US$12.6m restructuring and other operating expenses incurred in FY02 EBIT US$M EBIT MARGIN % FY01 FY02 FY03 FY04 FY05 0 10 20 30 40 50 60 70 80 90 0 5 10 15 20 25 30 35 EBIT EBIT/Sales |
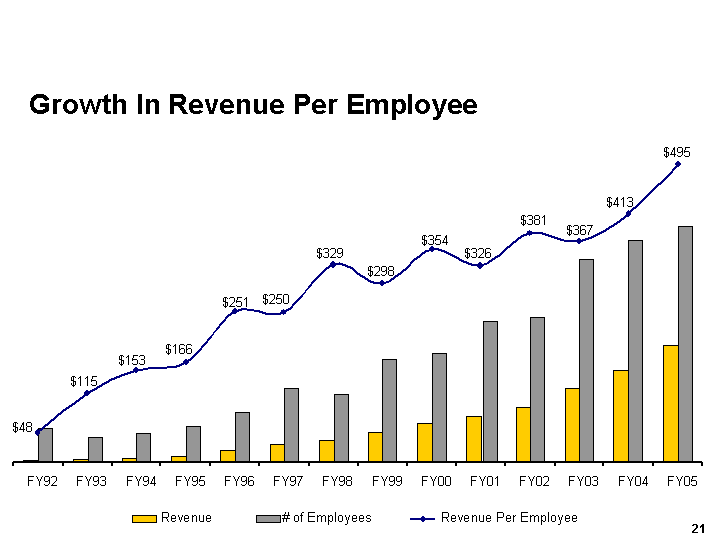
| Growth In Revenue Per Employee $495 $48 $115 $153 $166 $251 $250 $329 $298 $354 $326 $381 $367 $413 FY92 FY93 FY94 FY95 FY96 FY97 FY98 FY99 FY00 FY01 FY02 FY03 FY04 FY05 Revenue # of Employees Revenue Per Employee |
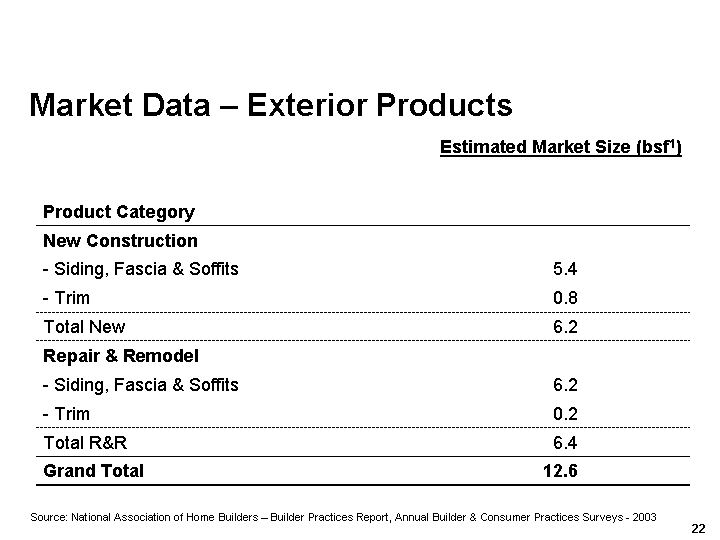
| Market Data - Exterior Products Product Category Estimated Market Size (bsf1) New Construction - Siding, Fascia & Soffits 5.4 - Trim 0.8 Total New 6.2 Repair & Remodel - Siding, Fascia & Soffits 6.2 - Trim 0.2 Total R&R 6.4 Grand Total 12.6 Source: National Association of Home Builders - Builder Practices Report, Annual Builder & Consumer Practices Surveys - 2003 |
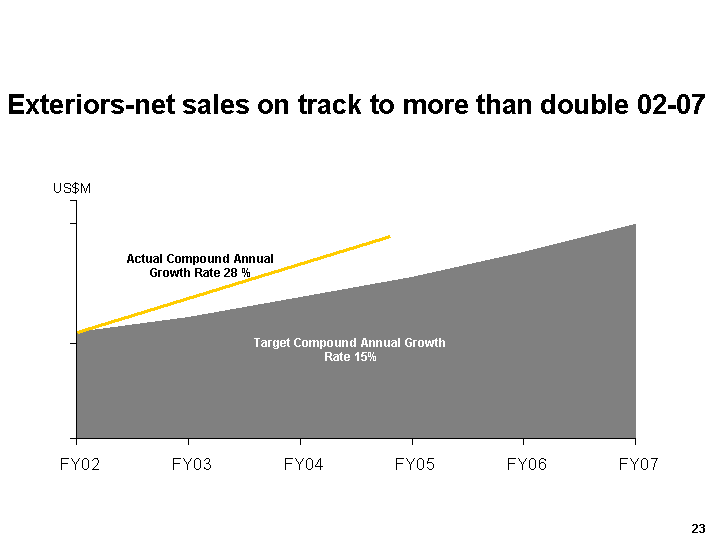
| Exteriors-net sales on track to more than double 02-07 FY02 FY03 FY04 FY05 FY06 FY07 Target Compound Annual Growth Rate 15% Actual Compound Annual Growth Rate 28 % US$M |
| US Housing Market Remains Stable Positive demographic factors Immigration Internal migration Household formation Low mortgage rates Strong house prices Growing economy PHOTOS |
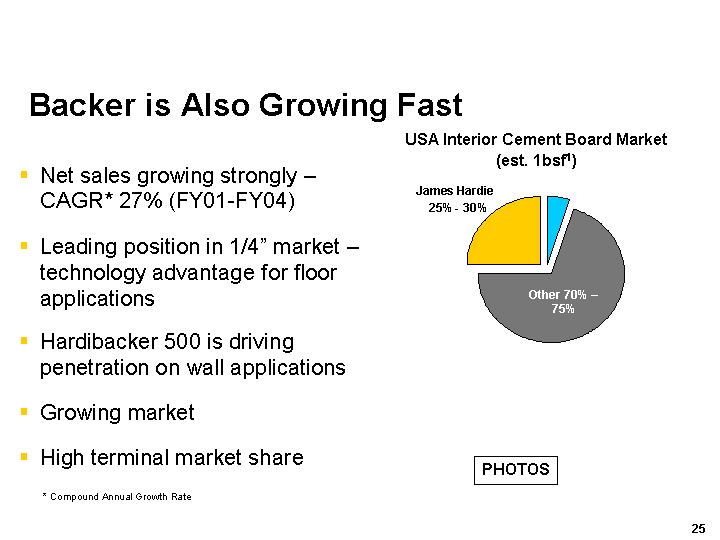
| Backer is Also Growing Fast USA Interior Cement Board Market (est. 1bsf1) James Hardie 25% - 30% Other 70% - 75% Net sales growing strongly - CAGR* 27% (FY01-FY04) Leading position in 1/4" market - technology advantage for floor applications Hardibacker 500 is driving penetration on wall applications Growing market High terminal market share * Compound Annual Growth Rate PHOTOS |
| Australia and New Zealand FY05 net sales US$210m - - up 8% FY05 EBIT1 up 20% to US$42m Higher value differentiated products Lower delivered cost Shift to growth model PHOTOS |
| Philippines and Asia Manufacturing plant commissioned 1999 FY05 net sales US$26 million up 25% EBIT1 positive Fibre cement as substitute for plywood Established low cost regional manufacturing hub Low GDP per capita is an obstacle for generating unique financial returns PHOTO |
| Other Fibre Cement Chile Manufacturing plant commissioned 2001 Low cost manufacturing, rapid market penetration, strong growth Positive EBIT1 Differentiated products introduced Limited scale opportunity PHOTOS |
| Pipes USA manufacturing plant commissioned 2001 Market recognises product has advantages over reinforced steel concrete pipes in mid- diameters - light, long, strong Lower cost to make and install Manufacturing targets not met but progress being made Cash breakeven - nearing EBIT breakeven Other Fibre Cement PHOTOS |
| Other Fibre Cement Artisan Roofing US$15M USA pilot plant commissioned FY04 Proving scalability of roofing technology Product design Product performance Manufacturing capability Market positioning PHOTOS |
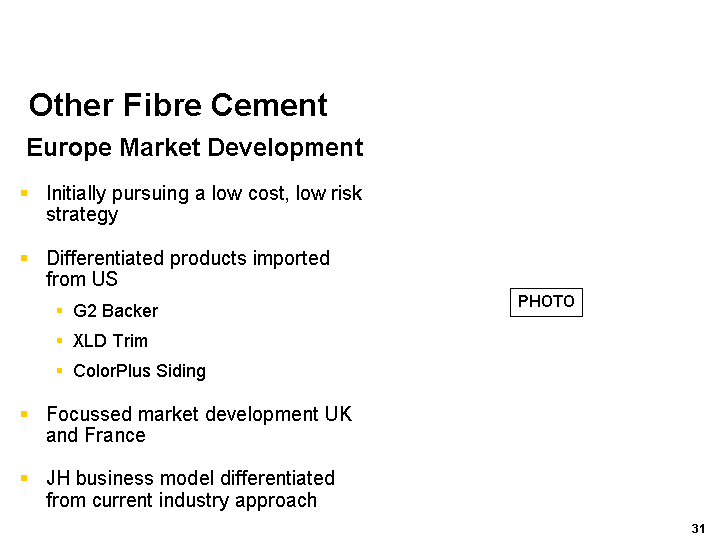
| Other Fibre Cement Europe Market Development Initially pursuing a low cost, low risk strategy Differentiated products imported from US G2 Backer XLD Trim ColorPlus Siding Focussed market development UK and France JH business model differentiated from current industry approach PHOTO |
| Financials |
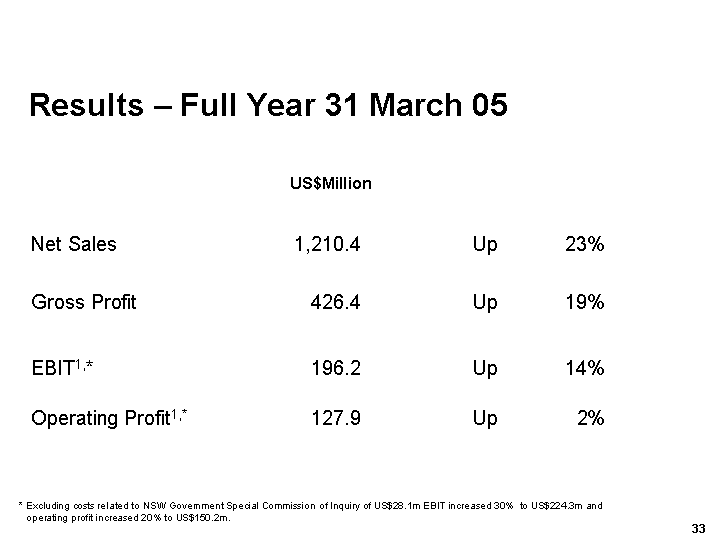
| Results - Full Year 31 March 05 US$Million Net Sales 1,210.4 Up 23% Gross Profit 426.4 Up 19% EBIT1,* 196.2 Up 14% Operating Profit1,* 127.9 Up 2% * Excluding costs related to NSW Government Special Commission of Inquiry of US$28.1m EBIT increased 30% to US$224.3m and operating profit increased 20% to US$150.2m. |
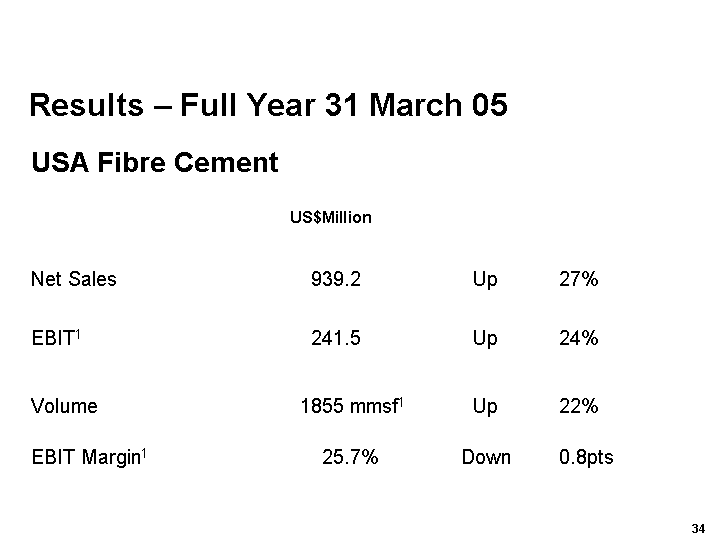
| Results - Full Year 31 March 05 US$Million Net Sales 939.2 Up 27% EBIT1 241.5 Up 24% Volume 1855 mmsf1 Up 22% EBIT Margin1 25.7% Down 0.8pts USA Fibre Cement |
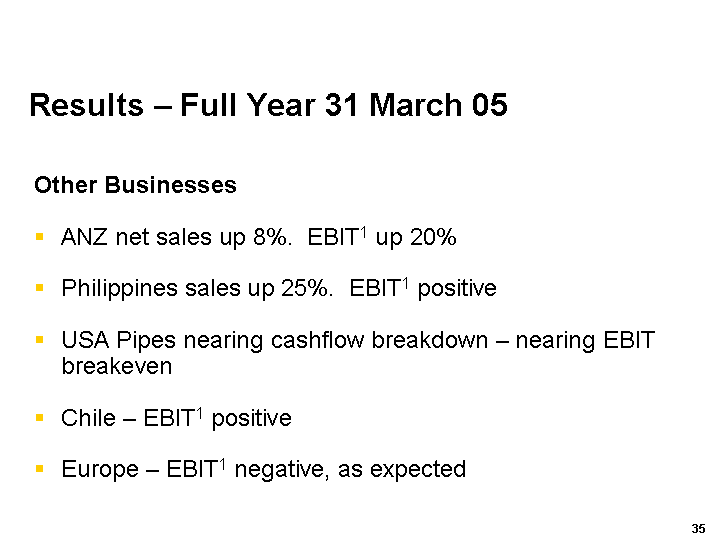
| Results - Full Year 31 March 05 Other Businesses ANZ net sales up 8%. EBIT1 up 20% Philippines sales up 25%. EBIT1 positive USA Pipes nearing cashflow breakdown - nearing EBIT breakeven Chile - EBIT1 positive Europe - EBIT1 negative, as expected |
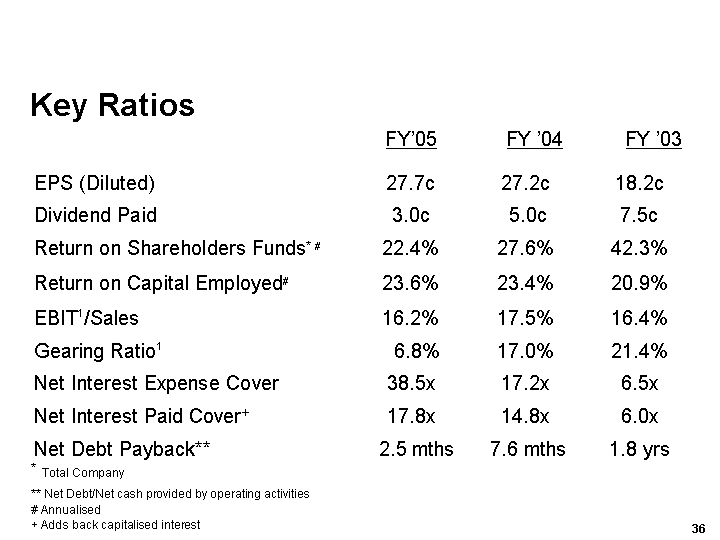
| Key Ratios FY'05 FY '04 FY '03 EPS (Diluted) 27.7c 27.2c 18.2c Dividend Paid 3.0c 5.0c 7.5c Return on Shareholders Funds* # 22.4% 27.6% 42.3% Return on Capital Employed# 23.6% 23.4% 20.9% EBIT1/Sales 16.2% 17.5% 16.4% Gearing Ratio1 6.8% 17.0% 21.4% Net Interest Expense Cover 38.5x 17.2x 6.5x Net Interest Paid Cover+ 17.8x 14.8x 6.0x Net Debt Payback** 2.5 mths 7.6 mths 1.8 yrs * Total Company ** Net Debt/Net cash provided by operating activities # Annualised + Adds back capitalised interest |
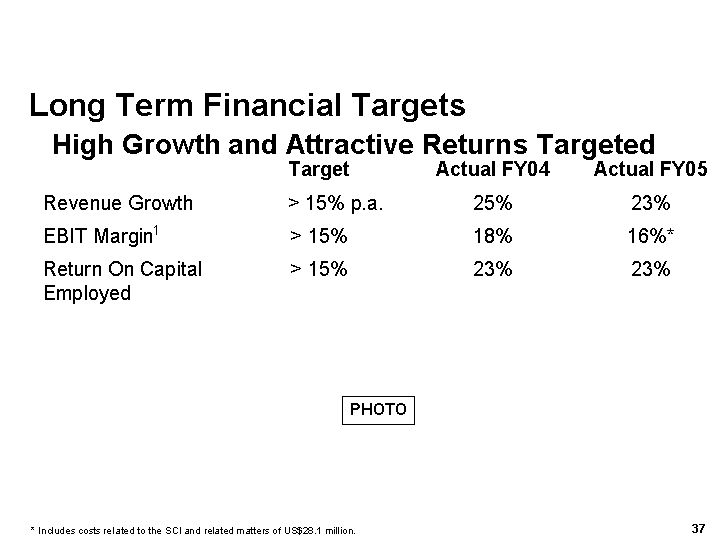
| High Growth and Attractive Returns Targeted Long Term Financial Targets Target Actual FY04 Actual FY05 Revenue Growth > 15% p.a. 25% 23% EBIT Margin1 > 15% 18% 16%* Return On Capital Employed > 15% 23% 23% * Includes costs related to the SCI and related matters of US$28.1 million. PHOTO |
| Asbestos Related Progress |
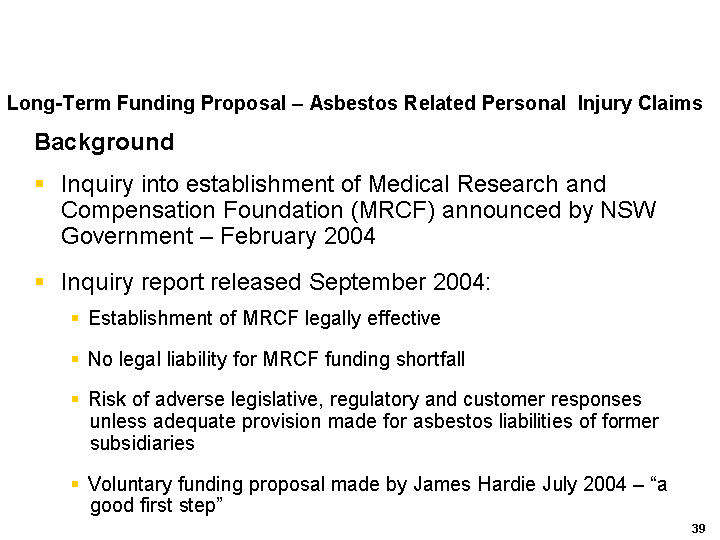
| Long-Term Funding Proposal - Asbestos Related Personal Injury Claims Background Inquiry into establishment of Medical Research and Compensation Foundation (MRCF) announced by NSW Government - February 2004 Inquiry report released September 2004: Establishment of MRCF legally effective No legal liability for MRCF funding shortfall Risk of adverse legislative, regulatory and customer responses unless adequate provision made for asbestos liabilities of former subsidiaries Voluntary funding proposal made by James Hardie July 2004 - "a good first step" |
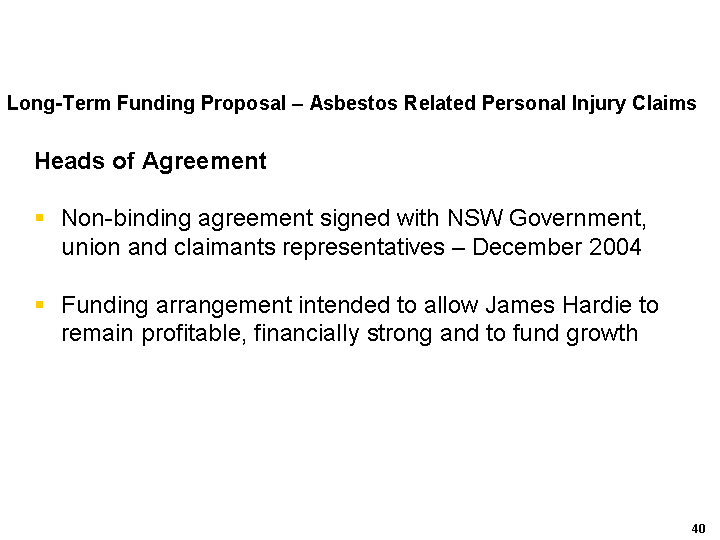
| Long-Term Funding Proposal - Asbestos Related Personal Injury Claims Heads of Agreement Non-binding agreement signed with NSW Government, union and claimants representatives - December 2004 Funding arrangement intended to allow James Hardie to remain profitable, financially strong and to fund growth |
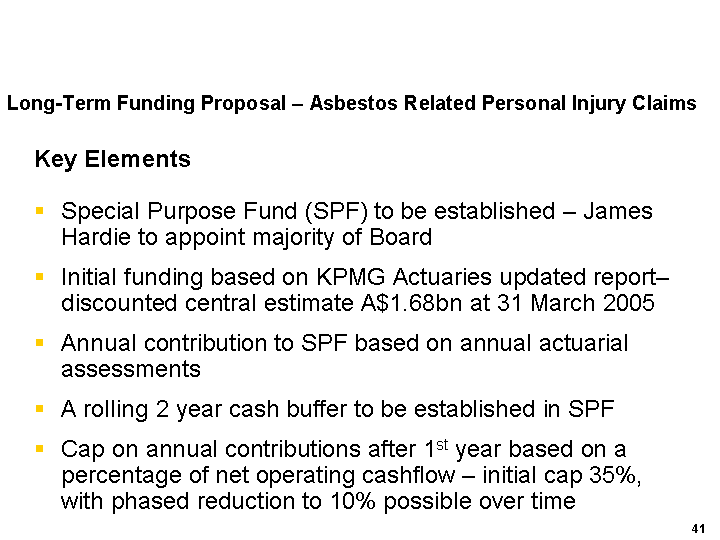
| Long-Term Funding Proposal - Asbestos Related Personal Injury Claims Key Elements Special Purpose Fund (SPF) to be established - James Hardie to appoint majority of Board Initial funding based on KPMG Actuaries updated report- discounted central estimate A$1.68bn at 31 March 2005 Annual contribution to SPF based on annual actuarial assessments A rolling 2 year cash buffer to be established in SPF Cap on annual contributions after 1st year based on a percentage of net operating cashflow - initial cap 35%, with phased reduction to 10% possible over time |
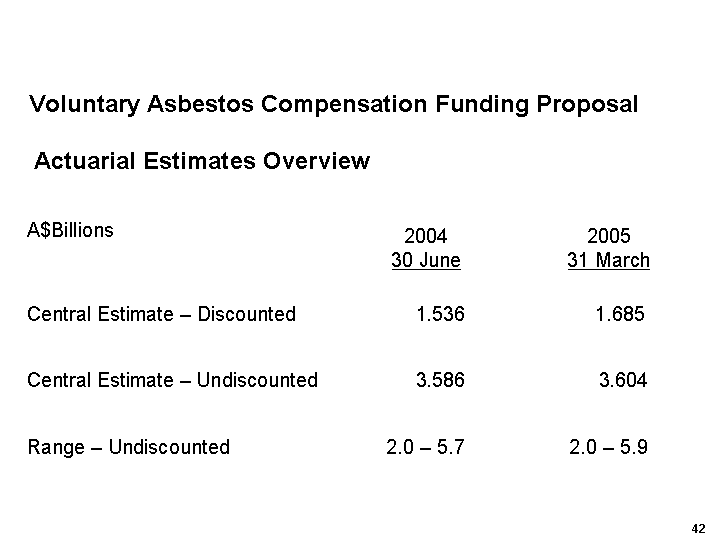
| Actuarial Estimates Overview A$Billions 2004 30 June 2005 31 March Central Estimate - Discounted 1.536 1.685 Central Estimate - Undiscounted 3.586 3.604 Range - Undiscounted 2.0 - 5.7 2.0 - 5.9 Voluntary Asbestos Compensation Funding Proposal |
| Likely Accounting for Asbestos Liability No provision for proposed liability at 31 March 2005 - not probable and estimable at this time (SFAS5) Subject to completion, accounting treatment for take-up of provision likely to be: Based on undiscounted Central Estimate as calculated by KPMG Actuaries Calculated for entire term (through 2071) Exclude impacts of inflation and superimposed inflation (A$1.67bn1) All components to be gross Future Income Tax Benefit created - subject to confirmation Annual payment to SPF charged against provision Provision adjusted annually to align with 31 March annual actuarial assessment (excluding impact of inflation and superimposed inflation) Asbestos expense in Income Statement to reflect movement in provision Voluntary Asbestos Compensation Funding Proposal 1. Excludes estimated legal and administrative cost savings - being finalised |
| Voluntary Asbestos Compensation Funding Proposal Timing Update Satisfactory progress on Principal Agreement no significant departures from Heads of Agreement Estimated completion date of Principal Agreement June - legal complexities Timetable for late July EGM appearing ambitious |
| Long-Term Funding Proposal - Asbestos Related Personal Injury Claims Australian Media Has suggested claims outside Australia (New Zealand, Asia and USA) could jeopardise SPF SPF only available to Australian-based personal injury claims against former Australia James Hardie subsidiaries In New Zealand - compensation paid by Accident Compensation Commission (government body) In Indonesia and Malaysia - any liabilities or obligations passed when interests divested in 1980's In USA - No material claims |
| Summary We have a strong, well established, high growth and return business We have sustainable competitive advantage Our model for continued strong growth is based on: Large market opportunity Superior value proposition Proprietary and/or protected technology Large upsides due to current R&D investments Significant organisational advantages Focussed strategy and organisational effort Scale and market position The Company is in a sound financial position |
| Disclaimer This Presentation contains forward-looking statements. We may from time to time make forward-looking statements in our periodic reports filed with the Securities and Exchange Commission on Forms 20-F and 6-K, in our annual reports to shareholders, in offering circulars and prospectuses, in media releases and other written materials and in oral statements made by our officers, directors or employees to analysts, institutional investors, representatives of the media and others. Examples of such forward-looking statements include: projections of our operating results or financial condition; statements of our plans, objectives or goals, including those relating to competition, acquisitions, dispositions and our products; statements about our future economic performance or that of the United States, Australia or other countries in which we operate; and statements about product or environmental liabilities. Words such as "believe," "anticipate," "plan," "expect," "intend," "target," "estimate," "project," "predict," "forecast," "guideline," "should," "aim" and similar expressions are intended to identify forward-looking statements but are not the exclusive means of identifying such statements. Forward-looking statements involve inherent risks and uncertainties. We caution you that a number of important factors could cause actual results to differ materially from the plans, objectives, expectations, estimates and intentions expressed in such forward-looking statements. These factors include but are not limited to: all matters relating to or arising out of the prior manufacture of asbestos by ABN 60 and certain former subsidiaries; competition and product pricing in the markets in which we operate; general economic and market conditions; compliance with and possible changes in environmental and health and safety laws; the successful transition of new senior management; the success of our research and development efforts; the supply and cost of raw materials; our reliance on a small number of product distributors; the consequences of product failures or defects; exposure to environmental, asbestos or other legal proceedings; risks of conducting business internationally; compliance with and changes in tax laws and treatments; and foreign exchange risks. We caution you that the foregoing list of factors is not exclusive and that other risks and uncertainties may cause actual results to differ materially from those in forward-looking statements. Forward-looking statements speak only as of the date they are made. |
| Notes EBIT and EBIT Margin - EBIT is defined as operating income. EBIT margin is defined as EBIT as a percentage of our net sales. We believe EBIT and EBIT margin to be relevant and useful information as these are the primary measures used by our management to measure the operating profit or loss of our business. EBIT is one of several metrics used by our management to measure the cash generated from our operations, excluding interest and income tax expenses. Additionally, EBIT is believed to be a primary measure and terminology used by our Australian investors. EBIT and EBIT margin should be considered in addition to, but not as a substitute for, other measures of financial performance reported in accordance with accounting principles generally accepted in the United States of America. EBIT and EBIT margin, as we have defined them, may not be comparable to similarly titled measures reported by other companies. EBIT and EBIT margin, as used in this document, are equivalent to the US GAAP measures of operating income and operating income margin. Operating profit from continuing operations before income taxes - is equivalent to the US GAAP measure of income from continuing operations before income taxes. Operating profit from continuing operations - is equivalent to the US GAAP measure of income from continuing operations. Gearing Ratio -is borrowings less cash (net debt) divided by net debt plus shareholders' equity. mmsf - million standard feet msf - thousand standard feet |