| Nine Months Ended 31 December 2005 | ||||||||||||
| 31 December | 31 December | |||||||||||
| 2005 | 2004 | |||||||||||
| Key Information | US$M | US$M | Movement | |||||||||
Net Sales from ordinary activities |
1,098.7 | 894.0 | Up 23% | |||||||||
Operating Profit From Continuing
Operations |
144.2 | 81.6 | Up 77% | |||||||||
Net Operating Profit Including
Discontinued Operations |
144.2 | 80.6 | Up 79% | |||||||||
| 1. | Media Release | ||
| 2. | Results at a Glance | ||
| 3. | Management’s Analysis of Results | ||
| 4. | Consolidated Financial Statements | ||
| 5. | Management Presentation |
| Analyst and Media enquiries about results, | ||
27 February 2006
|
please contact Peter Baker on | |
| Tel: 61 2 8274 5318; Mob: 61 417 443 482 |
| 9 Mth | 9 Mth | ||||||||||||||||||||||||
| US$ Million | Q3 FY06 | Q3 FY05 | %+\(-) | FY06 | FY05 | %+\(-) | |||||||||||||||||||
Net sales |
$ | 362.7 | $ | 287.0 | 26 | $ | 1,098.7 | $ | 894.0 | 23 | |||||||||||||||
Gross profit |
128.7 | 96.7 | 33 | 411.3 | 305.1 | 35 | |||||||||||||||||||
SCI and other related expenses |
(4.8 | ) | (15.9 | ) | (70 | ) | (14.7 | ) | (24.4 | ) | (40 | ) | |||||||||||||
EBIT |
64.4 | 33.3 | 93 | 227.7 | 131.6 | 73 | |||||||||||||||||||
Net interest income (expense) |
0.8 | (0.7 | ) | — | (0.9 | ) | (4.5 | ) | — | ||||||||||||||||
Income tax expense |
(24.5 | ) | (13.2 | ) | 86 | (82.6 | ) | (44.0 | ) | 88 | |||||||||||||||
Operating profit from continuing
operations |
40.7 | 19.8 | 106 | 144.2 | 81.6 | 77 | |||||||||||||||||||
Net operating profit including
discontinued operations |
40.7 | 19.5 | 109 | 144.2 | 80.6 | 79 | |||||||||||||||||||
2
3
Telephone:
|
61 2 8274 5318 | |
Mobile:
|
61 417 443 482 | |
Facsimile:
|
61 2 8274 5218 | |
Email:
|
[email protected] |
4
| Q3 | Q3 | 9 Mth | 9 Mth | ||||||||||||||
| US$ Million | FY06 | FY05 | FY06 | FY05 | |||||||||||||
EBIT |
$ | 64.4 | $ | 33.3 | $ | 227.7 | $ | 131.6 | |||||||||
SCI and other related expenses |
4.8 | 15.9 | 14.7 | 24.4 | |||||||||||||
EBIT excluding SCI and other related expenses |
69.2 | 49.2 | 242.4 | 156.0 | |||||||||||||
Net Sales |
$ | 362.7 | $ | 287.0 | $ | 1,098.7 | $ | 894.0 | |||||||||
EBIT margin excluding SCI and other related expenses |
19.1 | % | 17.1 | % | 22.1 | % | 17.4 | % | |||||||||
5
| Q3 | Q3 | 9 Mth | 9 Mth | ||||||||||||||
| US$ Million | FY06 | FY05 | FY06 | FY05 | |||||||||||||
Operating (loss) profit from continuing operations |
$ | 40.7 | $ | 19.8 | $ | 144.2 | $ | 81.6 | |||||||||
SCI and other related expenses, net of tax |
4.4 | 11.7 | 14.1 | 20.2 | |||||||||||||
Operating profit from continuing operations
excluding SCI and other related expenses |
45.1 | 31.5 | 158.3 | 101.8 | |||||||||||||
6
| • | expectations that the conditions precedent to the Final Funding Agreement will be satisfied; | ||
| • | expectations about payments to a special purpose fund for the compensation of proven asbestos-related personal injury and death claims; | ||
| • | projections of our operating results or financial condition; | ||
| • | statements regarding our plans, objectives or goals, including those relating to competition, acquisitions, dispositions and our products; | ||
| • | statements about our future performance; and | ||
| • | statements about product or environmental liabilities. |
7
| US$ Millions | 3rd QTR FY06 | 9 Months FY06 | ||||||||||||||||||||||||||||||
James Hardie |
||||||||||||||||||||||||||||||||
Net Sales |
Up | 26 | % | to | US$ | 362.7 | Up | 23 | % | to | US$ | 1,098.7 | ||||||||||||||||||||
EBIT |
Up | 93 | % | to | US$ | 64.4 | Up | 73 | % | to | US$ | 227.7 | ||||||||||||||||||||
Operating
Profit from Continuing Operations |
Up | 106 | % | to | US$ | 40.7 | Up | 77 | % | to | US$ | 144.2 | ||||||||||||||||||||
Net
Operating Profit Including Discontinued Operations |
Up | 109 | % | to | US$ | 40.7 | Up | 79 | % | to | US$ | 144.2 | ||||||||||||||||||||
EBIT Margin |
Up | 6.2 | pts | to | 17.8 | % | Up | 6.0 | pts | to | 20.7 | % | ||||||||||||||||||||
USA Fibre Cement |
||||||||||||||||||||||||||||||||
Net Sales |
Up | 35 | % | to | US$ | 297.9 | Up | 29 | % | to | US$ | 892.8 | ||||||||||||||||||||
EBIT |
Up | 52 | % | to | US$ | 79.7 | Up | 58 | % | to | US$ | 259.9 | ||||||||||||||||||||
EBIT Margin |
Up | 3.1 | pts | to | 26.8 | % | Up | 5.3 | pts | to | 29.1 | % | ||||||||||||||||||||
Volume |
Up | 22 | % | to | 527.5mmsf | Up | 16 | % | to | 1,607.7mmsf | ||||||||||||||||||||||
Asia Pacific Fibre Cement |
||||||||||||||||||||||||||||||||
Net Sales |
Up | 2 | % | to | US$ | 59.4 | Up | 4 | % | to | US$ | 184.6 | ||||||||||||||||||||
EBIT |
Down | 22 | % | to | US$ | 8.0 | Down | 6 | % | to | US$ | 32.4 | ||||||||||||||||||||
EBIT Margin |
Down | 4.1 | pts | to | 13.5 | % | Down | 1.8 | pts | to | 17.6 | % | ||||||||||||||||||||
Volume |
Up | 2 | % | to | 92.3mmsf | Down | 3 | % | to | 278.0mmsf | ||||||||||||||||||||||
| Key Ratios | ||||
Diluted earnings per share from continuing operations |
31.0 | cents | ||
EBIT Margin |
20.7 | % | ||
Return on
Shareholders’ Funds (Annualised — including discontinued operations) |
28.2 | % | ||
Return on Capital Employed (Annualised) |
32.6 | % | ||
Gearing Ratio |
(3.8 | )% | ||
Net Interest Expense Cover |
253.0 | x | ||
Net Interest Paid Cover |
56.9 | x | ||
Net Debt Payback |
(0.1) | years | ||
1
| Q3 | Q3 | 9 Mth | 9 Mth | ||||||||||||||
| US$ Million | FY06 | FY05 | FY06 | FY05 | |||||||||||||
EBIT |
$ | 64.4 | $ | 33.3 | $ | 227.7 | $ | 131.6 | |||||||||
SCI and other related expenses |
4.8 | 15.9 | 14.7 | 24.4 | |||||||||||||
EBIT excluding SCI and other related expenses |
69.2 | 49.2 | 242.4 | 156.0 | |||||||||||||
Net Sales |
$ | 362.7 | $ | 287.0 | $ | 1,098.7 | $ | 894.0 | |||||||||
EBIT margin excluding SCI and other related expenses |
19.1 | % | 17.1 | % | 22.1 | % | 17.4 | % | |||||||||
2
| Q3 | Q3 | 9 Mth | 9 Mth | ||||||||||||||
| US$ Million | FY06 | FY05 | FY06 | FY05 | |||||||||||||
Operating (loss) profit from continuing operations |
$ | 40.7 | $ | 19.8 | $ | 144.2 | $ | 81.6 | |||||||||
SCI and other related expenses, net of tax |
4.4 | 11.7 | 14.1 | 20.2 | |||||||||||||
Operating profit from continuing operations
excluding SCI and other related expenses |
45.1 | 31.5 | 158.3 | 101.8 | |||||||||||||
3
| US GAAP - US$ Million | Three Months and Nine Months Ended 31 December | ||||||||||||||||||||||||
| % | 9 Mths | 9 Mths | % | ||||||||||||||||||||||
| Q3 FY06 | Q3 FY05 | Change | FY06 | FY05 | Change | ||||||||||||||||||||
Net Sales |
|||||||||||||||||||||||||
USA Fibre Cement |
$ | 297.9 | $ | 220.3 | 35 | $ | 892.8 | $ | 692.0 | 29 | |||||||||||||||
Asia Pacific Fibre Cement |
59.4 | 58.1 | 2 | 184.6 | 177.9 | 4 | |||||||||||||||||||
Other |
5.4 | 8.6 | (37 | ) | 21.3 | 24.1 | (12 | ) | |||||||||||||||||
Total Net Sales |
$ | 362.7 | $ | 287.0 | 26 | $ | 1,098.7 | $ | 894.0 | 23 | |||||||||||||||
Cost of goods sold |
(234.0 | ) | (190.3 | ) | 23 | (687.4 | ) | (588.9 | ) | 17 | |||||||||||||||
Gross profit |
128.7 | 96.7 | 33 | 411.3 | 305.1 | 35 | |||||||||||||||||||
Selling, general & administrative expenses |
(51.2 | ) | (41.5 | ) | 23 | (146.4 | ) | (132.1 | ) | 11 | |||||||||||||||
Research & development expenses |
(8.3 | ) | (6.1 | ) | 36 | (21.7 | ) | (16.4 | ) | 32 | |||||||||||||||
Special Commission of Inquiry (SCI) &
other related expenses |
(4.8 | ) | (15.9 | ) | (70 | ) | (14.7 | ) | (24.4 | ) | (40 | ) | |||||||||||||
Other operating income (expense) |
— | 0.1 | — | (0.8 | ) | (0.6 | ) | 33 | |||||||||||||||||
EBIT |
64.4 | 33.3 | 93 | 227.7 | 131.6 | 73 | |||||||||||||||||||
Net interest income (expense) |
0.8 | (0.7 | ) | — | (0.9 | ) | (4.5 | ) | — | ||||||||||||||||
Other income (expense), net |
— | 0.4 | — | — | (1.5 | ) | — | ||||||||||||||||||
Operating profit from continuing
operations before income taxes |
65.2 | 33.0 | 98 | 226.8 | 125.6 | 81 | |||||||||||||||||||
Income tax expense |
(24.5 | ) | (13.2 | ) | 86 | (82.6 | ) | (44.0 | ) | 88 | |||||||||||||||
Operating Profit From Continuing
Operations |
$ | 40.7 | $ | 19.8 | 106 | $ | 144.2 | $ | 81.6 | 77 | |||||||||||||||
Net Operating Profit Including
Discontinued Operations |
$ | 40.7 | $ | 19.5 | 109 | $ | 144.2 | $ | 80.6 | 79 | |||||||||||||||
Tax rate |
37.6 | % | 40.0 | % | 36.4 | % | 35.0 | % | |||||||||||||||||
Volume (mmsf) |
|||||||||||||||||||||||||
USA Fibre Cement |
527.5 | 432.4 | 22 | 1,607.7 | 1,382.5 | 16 | |||||||||||||||||||
Asia Pacific Fibre Cement |
92.3 | 90.6 | 2 | 278.0 | 287.4 | (3 | ) | ||||||||||||||||||
Average net sales price per unit (per msf) |
|||||||||||||||||||||||||
USA Fibre Cement |
US$565 | US$509 | 11 | US$555 | US$501 | 11 | |||||||||||||||||||
Asia Pacific Fibre Cement |
A$865 | A$851 | 2 | A$877 | A$850 | 3 | |||||||||||||||||||
2
3
4
5
6
7
8
| Effective Interest | Principal | ||||||||||||
| Rate at | Total Facility at | Outstanding at | |||||||||||
| Description | 31 Dec 2005 | 31 Dec 2005 | 31 Dec 2005 | ||||||||||
| (US$ millions) | |||||||||||||
US$ notes, fixed interest,
repayable annually in varying
tranches from November 2006 through
November 2013 |
7.16 | % | $ | 121.7 | $ | 121.7 | |||||||
US$ 364-day facilities, can be drawn
in US$, variable interest rates
based on LIBOR plus margin, can be
repaid and redrawn until maturity
in June 2006
(US$245.0 million) and December 2006 (US$110.0 million) |
N/A | 355.0 | — | ||||||||||
Total |
$ | 476.7 | $ | 121.7 | |||||||||
9
| • | the establishment of the SPF to compensate asbestos sufferers with claims against the former James Hardie Group subsidiaries, Amaca Pty Ltd, Amaba Pty Ltd or ABN 60 Pty Ltd; | ||
| • | initial funding of the SPF by James Hardie of approximately A$154 million; | ||
| • | a two-year rolling cash ‘buffer’ in the SPF and an annual contribution in advance, based on actuarial assessments of expected claims for the following three years, revised annually and subject to certain limitations; | ||
| • | a cap on the annual James Hardie payments to the SPF in all years, except the first year, initially set at 35% of annual net operating cash flow of the JHI NV Group for the immediately preceding financial year, with provision for the percentage to decline over time, depending on James Hardie’s financial performance and the claims outlook; | ||
| • | no cap on individual payments to proven claimants; and | ||
| • | special compensation arrangements for members of the Baryulgil community for asbestos-related claims arising from the activities of Marlew Mining Pty Ltd. |
10
11
| US$ Million | Q3 | Q3 | 9 Mth | 9 Mth | |||||||||||||
| FY06 | FY05 | FY06 | FY05 | ||||||||||||||
EBIT |
$ | 64.4 | $ | 33.3 | $ | 227.7 | $ | 131.6 | |||||||||
SCI and other related expenses |
4.8 | 15.9 | 14.7 | 24.4 | |||||||||||||
EBIT excluding SCI and other related expenses |
69.2 | 49.2 | 242.4 | 156.0 | |||||||||||||
Net Sales |
$ | 362.7 | $ | 287.0 | $ | 1,098.7 | $ | 894.0 | |||||||||
EBIT margin excluding SCI and other related expenses |
19.1 | % | 17.1 | % | 22.1 | % | 17.4 | % | |||||||||
12
| US$ Million | Q3 | Q3 | 9 Mth | 9 Mth | |||||||||||||
| FY06 | FY05 | FY06 | FY05 | ||||||||||||||
Operating (loss) profit from continuing operations |
$ | 40.7 | $ | 19.8 | $ | 144.2 | $ | 81.6 | |||||||||
SCI and other related expenses, net of tax |
4.4 | 11.7 | 14.1 | 20.2 | |||||||||||||
Operating profit from continuing operations
excluding SCI and other related expenses |
45.1 | 31.5 | 158.3 | 101.8 | |||||||||||||
13
| • | expectations that the conditions precedent to the Final Funding Agreement will be satisfied; | ||
| • | expectations about payments to a special purpose fund for the compensation of proven asbestos-related personal injury and death claims; | ||
| • | projections of our operating results or financial condition; | ||
| • | statements regarding our plans, objectives or goals, including those relating to competition, acquisitions, dispositions and our products; | ||
| • | statements about our future performance; and | ||
| • | statements about product or environmental liabilities. |
14
| Page | ||
Item 1. Financial Statements (Unaudited) |
||
Condensed Consolidated Balance Sheets as of 31 December 2005 and
31 March 2005 |
F-1 | |
Condensed Consolidated Statements of Income for the Three and Nine Months Ended
31 December 2005 and 2004 |
F-2 | |
Condensed Consolidated Statements of Cash Flows for the Nine Months Ended
31 December 2005 and 2004 |
F-4 | |
Condensed Consolidated Statement of Changes in Shareholders’ Equity for the
Nine Months Ended 31 December 2005 |
F-6 | |
Notes to Condensed Consolidated Financial Statements |
F-7 | |
Item 2. Quantitative and Qualitative Disclosures About Market Risk |
F-32 |
| Millions of | Millions of | |||||||||||||||
| US Dollars | Australian Dollars | |||||||||||||||
| 31 December | 31 March | 31 December | 31 March | |||||||||||||
| 2005 | 2005 | 2005 | 2005 | |||||||||||||
Assets |
||||||||||||||||
Current assets: |
||||||||||||||||
Cash and cash equivalents |
$ | 149.0 | $ | 113.5 | A$ | 203.1 | A$ | 146.9 | ||||||||
Accounts and notes receivable, net of allowance for
doubtful accounts of $1.7 million (A$2.3 million) and
$1.5 million (A$1.8 million) as of 31 December 2005
and 31 March 2005, respectively |
125.1 | 122.8 | 170.5 | 159.0 | ||||||||||||
Inventories |
114.3 | 98.6 | 155.8 | 127.6 | ||||||||||||
Prepaid expenses and other current assets |
16.3 | 12.0 | 22.2 | 15.5 | ||||||||||||
Deferred income taxes |
24.7 | 25.8 | 33.7 | 33.4 | ||||||||||||
Assets of business held for sale |
— | 17.9 | — | 23.2 | ||||||||||||
Total current assets |
429.4 | 390.6 | 585.3 | 505.6 | ||||||||||||
Property, plant and equipment, net |
764.3 | 677.6 | 1,042.0 | 877.2 | ||||||||||||
Deferred income taxes |
9.5 | 10.6 | 13.0 | 13.7 | ||||||||||||
Other assets |
9.5 | 10.1 | 13.0 | 13.1 | ||||||||||||
Total assets |
$ | 1,212.7 | $ | 1,088.9 | A$ | 1,653.3 | A$ | 1,409.6 | ||||||||
Liabilities and Shareholders’ Equity |
||||||||||||||||
Current liabilities: |
||||||||||||||||
Accounts payable and accrued liabilities |
$ | 107.8 | $ | 92.1 | A$ | 147.0 | A$ | 119.2 | ||||||||
Current portion of long-term debt |
27.1 | 25.7 | 36.9 | 33.3 | ||||||||||||
Accrued payroll and employee benefits |
43.2 | 35.4 | 58.9 | 45.8 | ||||||||||||
Accrued product warranties |
8.5 | 8.0 | 11.6 | 10.4 | ||||||||||||
Income taxes payable |
38.2 | 21.4 | 52.1 | 27.7 | ||||||||||||
Other liabilities |
1.2 | 1.5 | 1.6 | 1.9 | ||||||||||||
Liabilities of business held for sale |
— | 14.3 | — | 18.5 | ||||||||||||
Total current liabilities |
226.0 | 198.4 | 308.1 | 256.8 | ||||||||||||
Long-term debt |
94.6 | 121.7 | 129.0 | 157.6 | ||||||||||||
Deferred income taxes |
84.4 | 77.5 | 115.1 | 100.3 | ||||||||||||
Accrued product warranties |
4.2 | 4.9 | 5.7 | 6.3 | ||||||||||||
Other liabilities |
63.5 | 61.7 | 86.6 | 79.9 | ||||||||||||
Total liabilities |
472.7 | 464.2 | 644.5 | 600.9 | ||||||||||||
Commitments and contingencies (Note 8) |
||||||||||||||||
Shareholders’ equity: |
||||||||||||||||
Common stock, Euro 0.59 par value, 2.0 billion
shares authorised; 462,202,343 shares issued
and outstanding at 31 December 2005 and
459,373,176 shares issued and outstanding
at 31 March 2005 |
248.0 | 245.8 | ||||||||||||||
Additional paid-in capital |
152.0 | 139.4 | ||||||||||||||
Retained earnings |
362.7 | 264.3 | ||||||||||||||
Employee loans |
(0.5 | ) | (0.7 | ) | ||||||||||||
Accumulated other comprehensive loss |
(22.2 | ) | (24.1 | ) | ||||||||||||
Total shareholders’ equity |
740.0 | 624.7 | ||||||||||||||
Total liabilities and shareholders’ equity |
$ | 1,212.7 | $ | 1,088.9 | ||||||||||||
F-1
| Three Months | Nine Months | |||||||||||||||
| Ended 31 December | Ended 31 December | |||||||||||||||
| (Millions of US dollars, except per share data) | 2005 | 2004 | 2005 | 2004 | ||||||||||||
Net sales |
$ | 362.7 | $ | 287.0 | $ | 1,098.7 | $ | 894.0 | ||||||||
Cost of goods sold |
(234.0 | ) | (190.3 | ) | (687.4 | ) | (588.9 | ) | ||||||||
Gross profit |
128.7 | 96.7 | 411.3 | 305.1 | ||||||||||||
Selling, general and administrative expenses |
(51.2 | ) | (41.5 | ) | (146.4 | ) | (132.1 | ) | ||||||||
Research and development expenses |
(8.3 | ) | (6.1 | ) | (21.7 | ) | (16.4 | ) | ||||||||
SCI and other related expenses |
(4.8 | ) | (15.9 | ) | (14.7 | ) | (24.4 | ) | ||||||||
Other operating income (expense) |
— | 0.1 | (0.8 | ) | (0.6 | ) | ||||||||||
Operating income |
64.4 | 33.3 | 227.7 | 131.6 | ||||||||||||
Interest expense |
(1.1 | ) | (1.3 | ) | (5.1 | ) | (6.0 | ) | ||||||||
Interest income |
1.9 | 0.6 | 4.2 | 1.5 | ||||||||||||
Other income (expense) |
— | 0.4 | — | (1.5 | ) | |||||||||||
Income from continuing operations |
||||||||||||||||
before income taxes |
65.2 | 33.0 | 226.8 | 125.6 | ||||||||||||
Income tax expense |
(24.5 | ) | (13.2 | ) | (82.6 | ) | (44.0 | ) | ||||||||
Income from continuing operations |
40.7 | 19.8 | 144.2 | 81.6 | ||||||||||||
Discontinued operations: |
||||||||||||||||
Loss from discontinued operations, net
of income tax benefit of $0.2 million for the three
and nine months ended 31 December 2004 |
— | (0.3 | ) | — | (0.3 | ) | ||||||||||
Loss on disposal of discontinued operations
net of income tax of nil |
— | — | — | (0.7 | ) | |||||||||||
Loss from discontinued operations |
— | (0.3 | ) | — | (1.0 | ) | ||||||||||
Net income |
$ | 40.7 | $ | 19.5 | $ | 144.2 | $ | 80.6 | ||||||||
Income per share — basic: |
||||||||||||||||
Income from continuing operations |
$ | 0.09 | $ | 0.04 | $ | 0.31 | $ | 0.18 | ||||||||
Loss from discontinued operations |
— | — | — | — | ||||||||||||
Net income per share — basic |
$ | 0.09 | $ | 0.04 | $ | 0.31 | $ | 0.18 | ||||||||
Income per share — diluted: |
||||||||||||||||
Income from continuing operations |
$ | 0.09 | $ | 0.04 | $ | 0.31 | $ | 0.18 | ||||||||
Loss from discontinued operations |
— | — | — | — | ||||||||||||
Net income per share — diluted |
$ | 0.09 | $ | 0.04 | $ | 0.31 | $ | 0.18 | ||||||||
Weighted average common shares outstanding
(Millions): |
||||||||||||||||
Basic |
462.1 | 458.9 | 461.4 | 458.7 | ||||||||||||
Diluted |
466.8 | 461.1 | 465.6 | 460.7 | ||||||||||||
F-2
| Three Months | Nine Months | |||||||||||||||
| Ended 31 December | Ended 31 December | |||||||||||||||
| (Millions of Australian dollars, except per share data) | 2005 | 2004 | 2005 | 2004 | ||||||||||||
Net sales |
A$ | 478.9 | A$ | 394.6 | A$ | 1,450.8 | A$ | 1,229.1 | ||||||||
Cost of goods sold |
(309.0 | ) | (261.6 | ) | (907.7 | ) | (809.6 | ) | ||||||||
Gross profit |
169.9 | 133.0 | 543.1 | 419.5 | ||||||||||||
Selling, general and administrative expenses |
(67.6 | ) | (57.1 | ) | (193.3 | ) | (181.6 | ) | ||||||||
Research and development expenses |
(11.0 | ) | (8.4 | ) | (28.7 | ) | (22.5 | ) | ||||||||
SCI and other related expenses |
(6.3 | ) | (21.9 | ) | (19.4 | ) | (33.5 | ) | ||||||||
Other operating income (expense) |
— | 0.1 | (1.1 | ) | (0.8 | ) | ||||||||||
Operating income |
85.0 | 45.7 | 300.6 | 181.1 | ||||||||||||
Interest expense |
(1.5 | ) | (1.8 | ) | (6.7 | ) | (8.2 | ) | ||||||||
Interest income |
2.5 | 0.8 | 5.5 | 2.1 | ||||||||||||
Other income (expense) |
— | 0.5 | — | (2.1 | ) | |||||||||||
Income from
continuing operations before income taxes |
86.0 | 45.2 | 299.4 | 172.9 | ||||||||||||
Income tax expense |
(32.4 | ) | (18.1 | ) | (109.1 | ) | (60.5 | ) | ||||||||
Income from continuing operations |
53.6 | 27.1 | 190.3 | 112.4 | ||||||||||||
Discontinued operations: |
||||||||||||||||
Loss from discontinued operations, net
of income tax benefit of A$0.3 million for the three
and nine months ended 31 December 2004 |
— | (0.4 | ) | — | (0.4 | ) | ||||||||||
Loss on disposal of discontinued operations
net of income tax of nil |
— | — | — | (1.0 | ) | |||||||||||
Loss from discontinued operations |
— | (0.4 | ) | — | (1.4 | ) | ||||||||||
Net income |
A$ | 53.6 | A$ | 26.7 | A$ | 190.3 | A$ | 111.0 | ||||||||
Income per share — basic: |
||||||||||||||||
Income from continuing operations |
A$ | 0.12 | A$ | 0.06 | A$ | 0.41 | A$ | 0.25 | ||||||||
Loss from discontinued operations |
— | — | — | — | ||||||||||||
Net income per share — basic |
A$ | 0.12 | A$ | 0.06 | A$ | 0.41 | A$ | 0.25 | ||||||||
Income per share — diluted: |
||||||||||||||||
Income from continuing operations |
A$ | 0.11 | A$ | 0.06 | A$ | 0.41 | 0.24 | |||||||||
Loss from discontinued operations |
— | — | — | — | ||||||||||||
Net income per share — diluted |
A$ | 0.11 | A$ | 0.06 | A$ | 0.41 | A$ | 0.24 | ||||||||
Weighted
average common shares outstanding (Millions): |
||||||||||||||||
Basic |
462.1 | 458.9 | 461.4 | 458.7 | ||||||||||||
Diluted |
466.8 | 461.1 | 465.6 | 460.7 | ||||||||||||
F-3
| Nine Months | ||||||||
| Ended 31 December | ||||||||
| (Millions of US dollars) | 2005 | 2004 | ||||||
Cash Flows From Operating Activities |
||||||||
Net income |
$ | 144.2 | $ | 80.6 | ||||
Adjustments to reconcile net income to net cash
provided by operating activities: |
||||||||
Loss on disposal of subsidiaries and businesses |
0.8 | — | ||||||
Depreciation and amortisation |
33.8 | 26.6 | ||||||
Deferred income taxes |
8.3 | 13.3 | ||||||
Prepaid pension cost |
1.3 | 2.1 | ||||||
Tax benefit from stock options exercised |
1.3 | 0.3 | ||||||
Stock compensation |
3.7 | 1.7 | ||||||
Other |
0.7 | 2.8 | ||||||
Changes in operating assets and liabilities: |
||||||||
Accounts receivable |
(2.2 | ) | 15.5 | |||||
Inventories |
(17.4 | ) | 11.6 | |||||
Prepaid expenses and other current assets |
(5.2 | ) | 12.2 | |||||
Accounts payable and accrued liabilities |
16.2 | 4.9 | ||||||
Other accrued liabilities and other liabilities |
31.6 | (19.7 | ) | |||||
Net cash provided by operating activities |
217.1 | 151.9 | ||||||
Cash Flows From Investing Activities |
||||||||
Purchases of property, plant and equipment |
(123.8 | ) | (125.9 | ) | ||||
Proceeds from sale of property, plant and equipment |
— | 3.4 | ||||||
Proceeds from disposal of subsidiaries and businesses,
net of cash divested |
2.9 | 0.4 | ||||||
Net cash used in investing activities |
(120.9 | ) | (122.1 | ) | ||||
Cash Flows From Financing Activities |
||||||||
Net proceeds from line of credit |
— | 0.5 | ||||||
Repayments of borrowings |
(25.7 | ) | (17.6 | ) | ||||
Proceeds from issuance of shares |
9.8 | 1.4 | ||||||
Dividends paid |
(45.8 | ) | (13.7 | ) | ||||
Collections on loans receivable |
0.2 | — | ||||||
Net cash used in financing activities |
(61.5 | ) | (29.4 | ) | ||||
Effects of exchange rate changes on cash |
0.8 | 0.8 | ||||||
Net increase in cash and cash equivalents |
35.5 | 1.2 | ||||||
Cash and cash equivalents at beginning of period |
113.5 | 72.3 | ||||||
Cash and cash equivalents at end of period |
$ | 149.0 | $ | 73.5 | ||||
Components of Cash and Cash Equivalents |
||||||||
Cash at bank and on hand |
$ | 29.7 | $ | 24.5 | ||||
Short-term deposits |
119.3 | 49.0 | ||||||
Cash and cash equivalents at end of period |
$ | 149.0 | $ | 73.5 | ||||
F-4
| Nine Months | ||||||||
| Ended 31 December | ||||||||
| (Millions of Australian dollars) | 2005 | 2004 | ||||||
Cash Flows From Operating Activities |
||||||||
Net income |
A$ | 190.3 | A$ | 111.0 | ||||
Adjustments to reconcile net income to net cash
provided by operating activities: |
||||||||
Loss on disposal of subsidiaries and businesses |
1.1 | — | ||||||
Depreciation and amortisation |
44.6 | 36.6 | ||||||
Deferred income taxes |
11.0 | 18.3 | ||||||
Prepaid pension cost |
1.7 | 2.9 | ||||||
Tax benefit from stock options exercised |
1.7 | 0.4 | ||||||
Stock compensation |
4.9 | 2.3 | ||||||
Other |
0.9 | 3.8 | ||||||
Changes in operating assets and liabilities: |
||||||||
Accounts receivable |
(2.9 | ) | 21.3 | |||||
Inventories |
(23.0 | ) | 15.9 | |||||
Prepaid expenses and other current assets |
(6.9 | ) | 16.8 | |||||
Accounts payable and accrued liabilities |
21.4 | 6.7 | ||||||
Other accrued liabilities and other liabilities |
41.7 | (27.1 | ) | |||||
Net cash provided by operating activities |
286.5 | 208.9 | ||||||
Cash Flows From Investing Activities |
||||||||
Purchases of property, plant and equipment |
(163.5 | ) | (173.1 | ) | ||||
Proceeds from sale of property, plant and equipment |
— | 4.7 | ||||||
Proceeds from disposal of subsidiaries and businesses,
net of cash divested |
3.8 | 0.5 | ||||||
Net cash used in investing activities |
(159.7 | ) | (167.9 | ) | ||||
Cash Flows From Financing Activities |
||||||||
Net proceeds from line of credit |
— | 0.7 | ||||||
Repayments of borrowings |
(33.9 | ) | (24.2 | ) | ||||
Proceeds from issuance of shares |
12.9 | 1.9 | ||||||
Dividends paid |
(60.5 | ) | (18.8 | ) | ||||
Collections on loans receivable |
0.3 | — | ||||||
Net cash used in financing activities |
(81.2 | ) | (40.4 | ) | ||||
Effects of exchange rate changes on cash |
10.6 | (2.6 | ) | |||||
Net increase in cash and cash equivalents |
56.2 | (2.0 | ) | |||||
Cash and cash equivalents at beginning of period |
146.9 | 95.1 | ||||||
Cash and cash equivalents at end of period |
A$ | 203.1 | A$ | 93.1 | ||||
Components of Cash and Cash Equivalents |
||||||||
Cash at bank and on hand |
A$ | 40.5 | A$ | 31.0 | ||||
Short-term deposits |
162.6 | 62.1 | ||||||
Cash and cash equivalents at end of period |
A$ | 203.1 | A$ | 93.1 | ||||
F-5
| Accumulated | ||||||||||||||||||||||||
| Additional | Other | |||||||||||||||||||||||
| Common | Paid-in | Retained | Employee | Comprehensive | ||||||||||||||||||||
| (Millions of US dollars) | Stock | Capital | Earnings | Loans | Loss | Total | ||||||||||||||||||
Balances as of 31 March 2005 |
$ | 245.8 | $ | 139.4 | $ | 264.3 | $ | (0.7 | ) | $ | (24.1 | ) | $ | 624.7 | ||||||||||
Comprehensive income: |
||||||||||||||||||||||||
Net income |
— | — | 144.2 | — | — | 144.2 | ||||||||||||||||||
Other comprehensive income: |
||||||||||||||||||||||||
Amortisation of unrealised transition
loss on derivative instruments |
— | — | — | — | 0.5 | 0.5 | ||||||||||||||||||
Foreign currency translation gain |
— | — | — | — | 1.4 | 1.4 | ||||||||||||||||||
Other comprehensive income |
— | — | — | — | 1.9 | 1.9 | ||||||||||||||||||
Total comprehensive income |
146.1 | |||||||||||||||||||||||
Dividends paid |
— | — | (45.8 | ) | — | — | (45.8 | ) | ||||||||||||||||
Stock compensation |
— | 3.7 | — | — | — | 3.7 | ||||||||||||||||||
Tax benefit from stock options exercised |
— | 1.3 | — | — | — | 1.3 | ||||||||||||||||||
Employee loans movement |
— | — | — | 0.2 | — | 0.2 | ||||||||||||||||||
Stock options exercised |
2.2 | 7.6 | — | — | — | 9.8 | ||||||||||||||||||
Balances as of 31 December 2005 |
$ | 248.0 | $ | 152.0 | $ | 362.7 | $ | (0.5 | ) | $ | (22.2 | ) | $ | 740.0 | ||||||||||
F-6
| 1. | Basis of Presentation | |
| The condensed consolidated financial statements represent the financial position, results of operations and cash flows of James Hardie Industries N.V. (“JHI NV”) and its wholly owned subsidiaries, collectively referred to as either the “Company” or “James Hardie” and JHI NV together with its subsidiaries as of the time relevant to the applicable reference, the James Hardie Group, unless the context indicates otherwise. | ||
| In the opinion of management, the accompanying condensed consolidated financial statements reflect all adjustments, which are of a normal recurring nature, necessary for a fair statement of financial position as of 31 December and 31 March 2005 and the results of operations for the three and nine months ended 31 December 2005 and 2004 and cash flows for the nine months ended 31 December 2005 and 2004. These condensed consolidated financial statements and notes are to be read in conjunction with the audited consolidated financial statements of James Hardie Industries N.V. and Subsidiaries for the three years ended 31 March 2005. The results of operations for the nine months ended 31 December 2005 are not necessarily indicative of the results to be expected for the full fiscal year ending 31 March 2006. | ||
| Convenience Translation As the majority of the Company’s shareholder base is Australian, the assets, liabilities, income statement and cash flows of the Company have been presented with accompanying Australian dollar (A$) convenience translations. These A$ convenience translations are not prepared in accordance with accounting principles generally accepted in the United States of America. The exchange rates used to calculate the convenience translations are as follows: |
| 31 March | 31 December | |||||||||||
| (US $1 = A$) | 2005 | 2005 | 2004 | |||||||||
Assets and liabilities |
1.2946 | 1.3633 | 1.2662 | |||||||||
Income statement |
n/a | 1.3205 | 1.3748 | |||||||||
Cash flows — beginning cash |
n/a | 1.2946 | 1.3156 | |||||||||
Cash flows — ending cash |
n/a | 1.3633 | 1.2662 | |||||||||
Cash flows — current period movements |
n/a | 1.3205 | 1.3748 | |||||||||
F-7
| 2. | Summary of Significant Accounting Policies | |
| Reclassifications Certain prior year balances have been reclassified to conform with current year presentation. |
||
| Earnings Per Share The Company is required to disclose basic and diluted earnings per share (“EPS”). Basic EPS is calculated using income divided by the weighted average number of common shares outstanding during the period. Diluted EPS is similar to basic EPS except that the weighted average number of common shares outstanding is increased to include the number of additional common shares calculated using the treasury method that would have been outstanding if dilutive potential common shares, such as options, had been exercised. Accordingly, basic and dilutive common shares outstanding used in determining net income per share are as follows: |
| Three Months | Nine Months | |||||||||||||||
| Ended 31 December | Ended 31 December | |||||||||||||||
| (Millions of shares) | 2005 | 2004 | 2005 | 2004 | ||||||||||||
Basic common shares outstanding |
462.1 | 458.9 | 461.4 | 458.7 | ||||||||||||
Dilutive effect of stock options |
4.7 | 2.2 | 4.2 | 2.0 | ||||||||||||
Diluted common shares outstanding |
466.8 | 461.1 | 465.6 | 460.7 | ||||||||||||
(Continuing operations — US dollar) |
2005 | 2004 | 2005 | 2004 | ||||||||||||
Net income per share — basic |
$ | 0.09 | $ | 0.04 | $ | 0.31 | $ | 0.18 | ||||||||
Net income per share — diluted |
$ | 0.09 | $ | 0.04 | $ | 0.31 | $ | 0.18 | ||||||||
| Potential common shares of 6.5 million and 7.7 million for the three months ended 31 December 2005 and 2004, respectively, and 6.5 million and 8.8 million for the nine months ended 31 December 2005 and 2004, respectively, have been excluded from the calculation of diluted common shares outstanding because the effect of their inclusion would be anti-dilutive. | ||
| Advertising The Company expenses the production costs of advertising the first time the advertising takes place. Advertising expense was US$4.4 million and US$3.8 million for the three months ended 31 December 2005 and 2004, respectively, and US$13.7 million and US$12.9 million for the nine months ended 31 December 2005 and 2004, respectively. |
||
| Stock-Based Compensation The Company estimates the fair value of its stock option grants on the date of grant using the Black-Scholes option-pricing model and recognises this value as compensation expense over the periods in which the options vest. Accordingly, the Company recognised stock-based compensation expense (included in selling, general and administrative expenses) of US$1.8 million and US$0.5 million for the three months ended 31 December 2005 and 2004, respectively, and US$3.7 million and US$1.7 million for the nine months ended 31 December 2005 and 2004, respectively. |
F-8
| Recent Accounting Pronouncements | ||
| Inventory Costs In November 2004, the Financial Accounting Standards Board (“FASB”) issued Statement of Financial Accounting Standards (“SFAS”) No. 151, “Inventory Costs — an amendment of Accounting Research Bulletin (“ARB”) No. 43, Chapter 4.” SFAS No. 151 requires abnormal amounts of inventory costs related to idle facility, freight handling and wasted material expenses to be recognised as current period charges. Additionally, SFAS No. 151 requires that allocation of fixed production overhead to the costs of conversion be based on the normal capacity of the production facilities. SFAS No. 151 is effective for fiscal years beginning after 15 June 2005. The Company does not expect the adoption of this standard to have a material impact on the Company’s consolidated financial statements. |
||
| American Jobs Creation Act In October 2004, the President of the United States signed into law the American Jobs Creation Act (the “Act”). The Act allows for a US federal income tax deduction for a percentage of income earned from certain US production activities. Based on the effective date of the Act, the Company will be eligible for this deduction in the first quarter of fiscal year 2006. Additionally, in December 2004, the FASB issued FASB Staff Position (“FSP”) No. 109-1, “Application of FASB Statement No. 109, “Accounting for Income Taxes” (“SFAS No. 109”), to the Tax Deduction on Qualified Production Activities Provided by the American Jobs Creation Act of 2004.” FSP No. 109-1, which was effective upon issuance, states the deduction under this provision of the Act should be accounted for as a special deduction in accordance with SFAS No. 109. The Company applied the guidance in FSP No. 109-1 upon recognition of this tax deduction beginning 1 April 2005. The application of FSP No. 109-1 did not have a material impact on the Company’s consolidated financial statements. |
||
| The Act also allows for an 85% dividends received deduction on the repatriation of certain earnings of foreign subsidiaries. In December 2004, the FASB issued FSP No. 109-2, “Accounting and Disclosure Guidance for the Foreign Earnings Repatriation Provision within the American Jobs Creation Act of 2004.” FSP No. 109-2, which was effective upon issuance, allows companies time beyond the financial reporting period of enactment to evaluate the effect of the Act on its plan for reinvestment or repatriation of foreign earnings for purposes of applying SFAS No. 109. Additionally, FSP No. 109-2 provides guidance regarding the required disclosures surrounding a company’s reinvestment or repatriation of foreign earnings. The Company continues to evaluate this provision of the Act and as such, has not yet quantified the impact this provision will have on the Company’s consolidated financial statements. | ||
| Exchanges of Non-Monetary Assets In December 2004, the FASB issued SFAS No. 153, “Exchange of Non-Monetary Assets — An Amendment of ARB Opinion No. 29,” which requires non-monetary asset exchanges to be accounted for at fair value. The Company is required to adopt the provisions of SFAS No. 153 for non-monetary exchanges occurring in fiscal periods beginning after 15 June 2005. The Company is in the process of evaluating the effect the adoption of this pronouncement will have on its consolidated financial statements; however, the Company does not expect it to have a material impact. |
||
| Share-Based Payment In December 2004, the FASB issued SFAS No. 123 (revised 2004), “Share-Based Payment” (“SFAS No. 123R”). SFAS No. 123R replaces SFAS No. 123, “Accounting for Stock-Based Compensation,” and supersedes Accounting Principles Board (“APB”) Opinion No. 25, “Accounting for Stock Issued to Employees.” Generally, SFAS No. 123R is similar in approach to SFAS No. 123 and requires that compensation cost relating to share-based payments be recognised in the financial statements based on the fair value of the equity or liability instruments issued. In April 2005, the United States Securities and Exchange Commission delayed the effective date of SFAS No. 123R |
F-9
| until fiscal years beginning after 15 June 2005. The Company adopted SFAS No. 123 in fiscal year 2003. The Company is in the process of evaluating the effect the adoption of SFAS No. 123R will have on its consolidated financial statements; however, the Company does not expect it to have a material impact. | ||
| Conditional Asset Retirement Obligations In March 2005, the FASB issued FASB Interpretation No. (“FIN”) 47, “Accounting for Conditional Asset Retirement Obligations.” FIN 47 clarifies the term “conditional asset retirement obligation” used in SFAS No. 143, “Accounting for Asset Retirement Obligations.” FIN 47 is effective no later than the end of the fiscal year ending after 15 December 2005. The adoption of this interpretation beginning 1 April 2005 did not have a material impact on its consolidated financial statements. |
||
| Accounting Changes and Error Corrections In May 2005, the FASB issued SFAS No. 154, “Accounting Changes and Error Corrections — a replacement of APB Opinion No. 20 and FASB Statement No. 3.” SFAS No. 154 requires retrospective application to prior periods’ financial statements of a voluntary change in accounting principle unless it is impracticable. APB Opinion No. 20, “Accounting Changes,” previously required that most voluntary changes in accounting principle be recognised by including in net income of the period of the change the cumulative effect of changing to the new accounting principle. This statement is effective for accounting changes and corrections of errors made in fiscal years beginning after 15 December 2005. The Company does not expect the adoption of this standard to have a material impact on its consolidated financial statements. |
||
| Uncertain Tax Positions In July 2005, the FASB issued an exposure draft of a proposed interpretation “Accounting for Uncertain Tax Positions.” The proposed interpretation clarifies the accounting for uncertain tax positions in accordance with SFAS No. 109. The proposed interpretation requires that a tax position meet a “probable recognition threshold” for the benefit of the uncertain tax position to be recognised in the financial statements. A tax position that fails to meet the probable recognition threshold will result in either reduction of current or deferred tax asset or receivable, or recording a current or deferred tax liability. The proposed interpretation also provides guidance on measurement, derecognition of tax benefits, classification, interim reporting disclosure and transition requirements in accounting for uncertain tax positions. The exposure draft has not yet been finalized. If and when finalized, the Company will determine the impact, if any, on its consolidated financial statements. |
||
| 3. | Inventories | |
| Inventories consist of the following components: |
| 31 December | 31 March | |||||||
| (Millions of US dollars) | 2005 | 2005 | ||||||
Finished goods |
$ | 78.7 | $ | 70.1 | ||||
Work-in-process |
8.6 | 8.4 | ||||||
Raw materials and supplies |
29.6 | 22.1 | ||||||
Provision for obsolete finished goods and raw materials |
(2.6 | ) | (2.0 | ) | ||||
Total inventories |
$ | 114.3 | $ | 98.6 | ||||
F-10
| 4. | Retirement Plans | |
| The Company sponsors a retirement plan for its Australian employees that is accounted for as a defined benefit plan. Pension expense for this plan is determined using the projected unit credit method to estimate the total benefits ultimately payable to participants and allocates this cost to service periods. The actuarial assumptions used to calculate pension costs are reviewed annually. The Company made contributions of US$0.3 million and US$1.1 million for the three and nine months ended 31 December 2005. The Company expects to make a contribution to the pension plan of approximately US$0.3 million for the remainder of fiscal year 2006. | ||
| The following are the components of net periodic pension cost for this plan: |
| Three Months | Nine Months | |||||||||||||||
| Ended 31 December | Ended 31 December | |||||||||||||||
| (Millions of US dollars) | 2005 | 2004 | 2005 | 2004 | ||||||||||||
Service cost |
$ | 0.5 | $ | 0.8 | $ | 1.5 | $ | 2.3 | ||||||||
Interest cost |
0.5 | 0.6 | 1.7 | 1.8 | ||||||||||||
Expected return on plan assets |
(0.6 | ) | (0.8 | ) | (1.9 | ) | (2.3 | ) | ||||||||
Recognised net actuarial loss |
0.2 | 0.1 | 0.3 | 0.3 | ||||||||||||
Net periodic pension cost |
0.6 | 0.7 | 1.6 | 2.1 | ||||||||||||
Settlement loss |
0.4 | — | 0.7 | — | ||||||||||||
Net pension cost |
$ | 1.0 | $ | 0.7 | $ | 2.3 | $ | 2.1 | ||||||||
| 5. | Disposal of Chile Business | |
| In June 2005, the Company approved a plan to dispose of its Chile Fibre Cement business to Compania Industrial El Volcan S.A. (Volcan). The sale closed on 8 July 2005. The Company received net proceeds of US$3.9 million and recorded a loss on disposal of US$0.8 million. This loss on disposal is included in other operating income (expense) in the Company’s consolidated financial statements. |
F-11
| As part of the terms of the sale of the Chile Fibre Cement business to Volcan, the Company entered into a two year take or pay purchase contract for fibre cement product manufactured by Volcan. The first year of the contract amounts to a purchase commitment of approximately US$2.8 million and the second year amounts to a purchase commitment of approximately US$2.1 million. As this contract qualifies as continuing involvement per SFAS No. 144, “Accounting for the Impairment or Disposal of Long Lived Assets,” the operating results and loss on disposal of the Chile Fibre Cement business are included in the Company’s income from continuing operations and are comprised of the following components: |
| Three Months | Nine Months | |||||||||||||||
| Ended 31 December | Ended 31 December | |||||||||||||||
| 2005 | 2004 | 2005 | 2004 | |||||||||||||
Chile Fibre Cement |
||||||||||||||||
Net sales |
$ | — | $ | 3.6 | $ | 5.1 | $ | 8.5 | ||||||||
Cost of goods sold |
— | (2.8 | ) | (3.5 | ) | (6.5 | ) | |||||||||
Gross profit |
— | 0.8 | 1.6 | 2.0 | ||||||||||||
Selling, general and administrative expenses |
— | (0.7 | ) | (1.2 | ) | (1.7 | ) | |||||||||
Gain on disposal of business |
— | — | (0.8 | ) | — | |||||||||||
Operating income (loss) |
— | 0.1 | (0.4 | ) | 0.3 | |||||||||||
Interest expense |
— | (0.1 | ) | (0.2 | ) | (0.3 | ) | |||||||||
Net loss |
$ | — | $ | — | $ | (0.6 | ) | $ | — | |||||||
| Assets and liabilities of business held for sale in the condensed consolidated balance sheet include the following: |
| 31 March | ||||
| (Millions of US dollars) | 2005 | |||
Assets of business held for sale |
||||
Accounts receivable, net |
$ | 4.4 | ||
Inventories |
1.3 | |||
Property, plant and equipment, net |
8.1 | |||
Intangible assets, net |
2.2 | |||
Deferred tax assets |
1.9 | |||
| $ | 17.9 | |||
Liabilities of business held for sale |
||||
Accounts payable and accrued liabilities |
$ | 1.9 | ||
Short-term debt |
11.9 | |||
Other |
0.5 | |||
| $ | 14.3 | |||
F-12
| 6. | Operating Segment Information and Concentrations of Risk | |
| The Company has reported its operating segment information in the format that the operating segment information is available to, and evaluated by, the Board of Directors. USA Fibre Cement manufactures and sells fibre cement interior linings, exterior siding and related accessories products in the United States. Asia Pacific Fibre Cement includes all fibre cement manufactured in Australia, New Zealand and the Philippines and sold in Australia, New Zealand and Asia. Research and Development represents the cost incurred by the research and development centres. Other includes the manufacture and sale of fibre cement products in Chile, the manufacture and sale of fibre cement reinforced pipes in the United States, fibre cement operations in Europe and roofing operations in the United States. The Company’s operating segments are strategic operating units that are managed separately due to their different products and/or geographical location. | ||
| Operating Segments | ||
| The following are the Company’s operating segments and geographical information: |
| Net Sales to Customers | Net Sales to Customers | |||||||||||||||
| Three Months | Nine Months | |||||||||||||||
| Ended 31 December | Ended 31 December | |||||||||||||||
| (Millions of US dollars) | 2005 | 2004 | 2005 | 2004 | ||||||||||||
USA Fibre Cement |
$ | 297.9 | $ | 220.3 | $ | 892.8 | $ | 692.0 | ||||||||
Asia Pacific Fibre Cement |
59.4 | 58.1 | 184.6 | 177.9 | ||||||||||||
Other |
5.4 | 8.6 | 21.3 | 24.1 | ||||||||||||
Worldwide total from continuing operations |
$ | 362.7 | $ | 287.0 | $ | 1,098.7 | $ | 894.0 | ||||||||
| Income From | Income From | |||||||||||||||
| Continuing Operations | Continuing Operations | |||||||||||||||
| Before Income Taxes | Before Income Taxes | |||||||||||||||
| Three Months | Nine Months | |||||||||||||||
| Ended 31 December | Ended 31 December | |||||||||||||||
| (Millions of US dollars) | 2005 | 2004 | 2005 | 2004 | ||||||||||||
USA Fibre Cement |
$ | 79.7 | $ | 52.3 | $ | 259.9 | $ | 164.4 | ||||||||
Asia Pacific Fibre Cement |
8.0 | 10.2 | 32.4 | 34.5 | ||||||||||||
Research and Development |
(4.6 | ) | (3.9 | ) | (11.8 | ) | (11.4 | ) | ||||||||
Other |
(3.2 | ) | (2.6 | ) | (9.3 | ) | (10.1 | ) | ||||||||
Segments total |
79.9 | 56.0 | 271.2 | 177.4 | ||||||||||||
General Corporate |
(15.5 | ) | (22.7 | ) | (43.5 | ) | (45.8 | ) | ||||||||
Total operating income |
64.4 | 33.3 | 227.7 | 131.6 | ||||||||||||
Net interest income (expense) |
0.8 | (0.7 | ) | (0.9 | ) | (4.5 | ) | |||||||||
Other income (expense) |
— | 0.4 | — | (1.5 | ) | |||||||||||
Worldwide total from continuing operations |
$ | 65.2 | $ | 33.0 | $ | 226.8 | $ | 125.6 | ||||||||
F-13
| Total Identifiable Assets | ||||||||
| 31 December | 31 March | |||||||
| (Millions of US dollars) | 2005 | 2005 | ||||||
USA Fibre Cement |
$ | 761.7 | $ | 670.1 | ||||
Asia Pacific Fibre Cement |
177.9 | 181.4 | ||||||
Other |
65.8 | 63.7 | ||||||
Segments total |
1,005.4 | 915.2 | ||||||
General Corporate |
207.3 | 155.8 | ||||||
Assets of business held for sale |
— | 15.7 | ||||||
Worldwide total |
$ | 1,212.7 | $ | 1,086.7 | ||||
| Geographic Areas | ||||||||||||||||
| Net Sales to Customers | Net Sales to Customers | |||||||||||||||
| Three Months | Nine Months | |||||||||||||||
| Ended 31 December | Ended 31 December | |||||||||||||||
| (Millions of US dollars) | 2005 | 2004 | 2005 | 2004 | ||||||||||||
USA |
$ | 301.5 | $ | 223.8 | $ | 903.6 | $ | 703.9 | ||||||||
Australia |
39.7 | 38.4 | 125.8 | 122.6 | ||||||||||||
New Zealand |
13.5 | 13.4 | 41.3 | 36.6 | ||||||||||||
Other Countries |
8.0 | 11.4 | 28.0 | 30.9 | ||||||||||||
Worldwide total from continuing operations |
$ | 362.7 | $ | 287.0 | $ | 1,098.7 | $ | 894.0 | ||||||||
| Total Identifiable Assets | ||||||||
| 31 December | 31 March | |||||||
| (Millions of US dollars) | 2005 | 2005 | ||||||
USA |
$ | 819. 7 | $ | 729.2 | ||||
Australia |
111. 8 | 118.8 | ||||||
New Zealand |
21. 1 | 21.4 | ||||||
Other Countries |
52. 8 | 45.8 | ||||||
Segment Total |
1,005. 4 | 915.2 | ||||||
General Corporate |
207. 3 | 155.8 | ||||||
Assets of business held for sale |
— | 15.7 | ||||||
Worldwide total |
$ | 1,212. 7 | $ | 1,086.7 | ||||
F-14
| 7. | Accumulated Other Comprehensive Loss | |
| The following are the components of total accumulated other comprehensive loss, net of related tax, which is displayed in the condensed consolidated balance sheets: |
| 31 December | 31 March | |||||||
| (Millions of US dollars) | 2005 | 2005 | ||||||
Unrealised transition loss on derivative instruments
classified as cash flow hedges |
$ | (4.9 | ) | $ | (4.9 | ) | ||
Accumulated amortisation of unrealised transition
loss on derivative instruments |
4.9 | 4.4 | ||||||
Foreign currency translation adjustments |
(22.2 | ) | (23.6 | ) | ||||
Total accumulated other comprehensive loss |
$ | (22.2 | ) | $ | (24.1 | ) | ||
| The following are the components of total comprehensive income: |
| Nine Months | ||||||||
| Ended 31 December | ||||||||
| (Millions of US dollars) | 2005 | 2004 | ||||||
Net income |
$ | 144.2 | $ | 80.6 | ||||
Other comprehensive income: |
||||||||
Amortisation of unrealised transition
loss on derivative instruments |
0.5 | 0.9 | ||||||
Foreign currency translation adjustments |
1.4 | 6.7 | ||||||
Other comprehensive income |
1.9 | 7.6 | ||||||
Total comprehensive income |
$ | 146.1 | $ | 61.8 | ||||
| 8. | Commitments and Contingencies | |
| Commitment To Provide Funding On A Long-Term Basis In Respect Of Asbestos-Related Liabilities Of Former Subsidiaries | ||
| On 1 December 2005, the Company announced that it, the NSW Government and a wholly owned Australian subsidiary of the Company (LGTDD Pty Ltd, described below as the “Performing Subsidiary”) had entered into a conditional agreement (the “Final Funding Agreement”) to provide long-term funding to a special purpose fund (“SPF”) that will provide compensation for Australian asbestos-related personal injury claims against certain former James Hardie companies (being Amaca Pty Ltd (“Amaca”), Amaba Pty Ltd (“Amaba”) and ABN 60 Pty Ltd (“ABN 60”)) (the “Former James Hardie Companies”). | ||
| Key events occurring since 2001 that led to the signing of the Final Funding Agreement are summarised further below. |
F-15
| The Final Funding Agreement remains subject to a number of conditions precedent, including the, receipt of an independent expert’s report confirming that the funding proposal is in the best interests of the Company and its enterprise as a whole, approval of the Company’s shareholders and lenders and confirmation satisfactory to the Company’s Board of Directors, in their discretion, that the contributions to be made by JHI NV and the Performing Subsidiary under the Final Funding Agreement will be tax deductible and the SPF will be exempt from Australian federal income tax on its income. | ||
| In summary, the Final Funding Agreement provides for the following key steps to occur if the conditions precedent to that agreement are satisfied or waived in writing by the parties: |
| • | the establishment of the SPF to provide compensation to Australian asbestos-related personal injury claimants with proven claims against the Former James Hardie Companies; | ||
| • | initial funding of A$154.0 million provided by the Performing Subsidiary to the SPF, calculated on the basis of an actuarial report prepared by KPMG Actuaries Ltd (“KPMG Actuaries”) as of 30 June 2005. That report provided a discounted central estimate of the net present value of all present and future Australian asbestos-related personal injury claims against the Former James Hardie Companies of A$1.57 billion (US$1.15 billion). The undiscounted/uninflated value of the central estimate of the asbestos liabilities of Amaca and Amaba as determined by KPMG Actuaries was approximately A$1.51 billion (US$1.10 billion); | ||
| • | a two-year rolling cash buffer in the SPF and, subject to the cap described below, an annual contribution in advance to top up those funds to equal the actuarially calculated estimate of expected Australian asbestos-related personal injury claims against the Former James Hardie Companies for the following three years, to be revised annually; | ||
| • | a cap on the annual payments made by the Performing Subsidiary to the SPF, initially set at 35% of the Company’s free cash flow (defined as cash from operations in accordance with US GAAP) for the immediately preceding financial year, with provisions for the percentage to decline over time depending upon the Company’s financial performance (and therefore the contributions already made to the SPF) and the claims outlook; | ||
| • | an initial term of 40 years, after which the parties may agree upon a final payment to be made by the Company in satisfaction of any further funding obligations, or failing which the term will be automatically extended for further periods of 10 years until such agreement is reached or the asbestos related liabilities cease to arise; | ||
| • | the entry by the parties and/or others into agreements to or connected with the Final Funding Agreements (the “Related Agreements”); | ||
| • | no cap on individual payments to asbestos claimants; | ||
| • | the Performing Subsidiary’s payment obligations are guaranteed by the Company; | ||
| • | the SPF’s claims to the funding payments required under the Final Funding Agreement will be subordinated to the claims of the Company’s lenders; and | ||
| • | special compensation for members of the Baryulgil community for asbestos-related claims arising from the activities of a former subsidiary of the Company. |
| The Company considers that the principal outstanding conditions are those relating to the taxation treatment in Australia of payments made by the Performing Subsidiary to the SPF and approval of the Final Funding Agreement by the Company’s shareholders. The Company is in discussions relating to the former issue with the relevant Australian taxation authorities and the Australian Federal Treasury. As regards the latter condition, the Company has undertaken significant work towards preparing the |
F-16
| necessary documentation to be sent to shareholders, but at present is unable to specify a date for holding the relevant meeting. |
| Key events since 2001 leading to the signing of the Final Funding Agreement | ||
| Separation of Amaca Pty Ltd and Amaba Pty Ltd and ABN 60 In February 2001, ABN 60, formerly known as James Hardie Industries Limited (“JHIL”), established the Medical Research and Compensation Foundation (the “Foundation”) by gifting A$3.0 million (US$1.7 million) in cash and transferring ownership of Amaca and Amaba to the Foundation. The Foundation is a special purpose charitable foundation established to fund medical and scientific research into asbestos-related diseases. Amaca and Amaba were Australian companies which had manufactured and marketed asbestos-related products prior to 1987. |
||
| The Foundation is managed by independent trustees and operates entirely independently of the Company and its current subsidiaries. The Company does not control (directly or indirectly) the activities of the Foundation in any way and, effective from 16 February 2001, has not owned or controlled (directly or indirectly) the activities of Amaca or Amaba. In particular, the trustees of the Foundation are responsible for the effective management of claims against Amaca and Amaba, and for the investment of Amaca’s and Amaba’s assets. Other than the offers to provide interim funding to the Foundation and the indemnity to the directors of ABN 60 as described below, the Company has no direct legally binding commitment to or interest in the Foundation, Amaca or Amaba, and it has no right to dividends or capital distributions made by the Foundation. None of the Foundation, Amaca | ||
| Amaba or ABN 60 are parties to the Final Funding Agreement described above, and none of those entities have obtained any directly enforceable rights under that agreement or the related agreements contemplated under that agreement. | ||
| On 31 March 2003, the Company transferred control of ABN 60 to a newly established company named ABN 60 Foundation Pty Ltd (“ABN 60 Foundation”). ABN 60 Foundation was established to be the sole shareholder of ABN 60 and to ensure that ABN 60 meets the payment obligations owed to the Foundation under the terms of a deed of covenant and indemnity described below. Following the establishment of the ABN 60 Foundation, the Company no longer owned any shares in ABN 60. ABN 60 Foundation is managed by independent directors and operates entirely independently of the Company. Since that date, the Company has not and currently does not control the activities of ABN 60 or ABN 60 Foundation in any way, it has no economic interest in ABN 60 or ABN 60 Foundation, and it has no right to dividends or capital distributions made by the ABN 60 Foundation. However, under the Final Funding Agreement and under legislation associated with that agreement described below, it is contemplated that following the establishment of the SPF and the satisfaction of the conditions precedent to the Final Funding Agreement, the Company will (except where it has committed certain material defaults which remain unremedied as provided for in the Final Funding Agreement) be entitled to appoint a majority of directors on the board of directors of the SPF, which will in turn be empowered under that legislation to issue directions to the boards of directors of the Former James Hardie Companies. That legislation also imposes statutory obligations upon the Former James Hardie Companies to comply with such directions, and the directors of the trustees of the Foundation and of the ABN 60 Foundation may be required to resign by the NSW Government under the James Hardie Former Subsidiaries (Special Provisions) Act 2005. | ||
| Potential for claims against the Former James Hardie Companies to be made against the Company Up to the date of the establishment of the Foundation, Amaca and Amaba incurred costs of asbestos-related litigation and settlements. From time to time, ABN 60 was joined as a party to asbestos suits which were primarily directed at Amaca and Amaba. Because Amaca, Amaba and ABN 60 were not or have not been a part of the Company since the time of establishment of the Foundation and the ABN 60 Foundation, no provision for asbestos-related claims was established in the Company’s |
F-17
| condensed consolidated financial statements prior to 31 December 2005, at which point the Company had incurred obligations under the Final Funding Agreement, subject to the conditions precedent. | ||
| The Final Funding Agreement does not confer upon the Former James Hardie Companies any directly enforceable rights against the Company in respect of the funding obligations. Similarly, the Final Funding Agreement does not create any directly enforceable rights in favour of any persons who may have personal injury claims against the Former James Hardie Companies and that agreement does not seek to make the Company or any current member of the James Hardie Group directly liable for damages for personal injury or death in connection with the former manufacture or sale of asbestos products by Amaca, Amaba or ABN 60. The funding obligations of the Performing Subsidiary and the Company to the SPF will be enforceable by the SPF and, in certain circumstances, directly by the NSW Government. | ||
| Apart from the funding obligations arising under the Final Funding Agreement, it is possible that the Company could become subject to suits for damages for personal injury or death in connection with the former manufacture or sale of asbestos products that have been or may be filed against Amaca, Amaba or ABN 60. However, as described further below, the ability of any claimants to initiate or pursue such suits is restricted by the legislation enacted by the NSW Government under the terms of the Final Funding Agreement. Although it is difficult to predict the incidence or outcome of future litigation, and thus no assurances as to such incidence or outcome can be given, the Company believes that, in the absence of new legislation or a change in jurisprudence as adopted in prior case law before the NSW Supreme Court and Federal High Court, as more fully described below, the Company’s liability if such suits could be successfully asserted against the Company is not probable and estimable at this time. This belief is based on the following factors: following the transfers of Amaca and Amaba to the Foundation and of ABN 60 to the ABN 60 Foundation, none of those companies have been part of the Company; the separateness of corporate entities under Australian law; the limited circumstances in which “piercing the corporate veil” might occur under Australian and Dutch law; the absence of an equivalent under Australian common law of the US legal doctrine of “successor liability”; the effect of the James Hardie (Civil Liability) Act 2005 and the James Hardie (Civil Penalty Compensation Release) Act 2005 as described further below; and the belief of that the principle applicable under Dutch law, to the effect that transferees of assets may be held liable for the transferor’s liabilities when they acquire assets at a price that leaves the transferor with insufficient assets to meet claims, is not triggered by the transfers of Amaca, Amaba and ABN 60, the restructure of the Company in 2001, or previous group transactions. The courts in Australia have generally refused to hold parent entities responsible for the liabilities of their subsidiaries absent any finding of fraud, agency, direct operational responsibility or the like. However, if suits are made possible and/or successfully brought, they could have a material adverse effect on the Company’s business, results of operations or financial condition. | ||
| In New Zealand, where RCI Holdings Pty Ltd owns a subsidiary that formerly manufactured asbestos-containing products, claims have been made against the statutory fund established under New Zealand’s accident compensation regime (rather than against the subsidiary). The relevant legislation at present is the Injury Prevention, Rehabilitation and Compensation Act 2001 (NZ). Where there is cover under this legislation, claims for compensatory damages are barred. Although claims not barred by the legislation could still be brought in some circumstances, any such claims are not currently estimable. | ||
| During the period ended 31 December 2005, the Company has not been a party to any material asbestos litigation and has not made any settlement payments in relation to any such litigation. | ||
| Under US laws, the doctrine of “successor liability” provides that an acquirer of the assets of a business can, in certain jurisdictions and under certain circumstances, be held responsible for liabilities arising from the conduct of that business prior to the acquisition, notwithstanding the |
F-18
| absence of a contractual arrangement between the acquirer and the seller pursuant to which the acquirer agreed to assume such liabilities. | ||
| The general principle under Australian law is that, in the absence of a contractual agreement to transfer specified liabilities of a business, and where there is no fraudulent conduct, the liabilities remain with the corporation that previously carried on the business and are not passed on to the acquirer of assets. Prior to March 2004, the Company leased manufacturing sites from Amaca, a former subsidiary that is now owned and controlled by the Foundation. In addition, the Company purchased certain plant and equipment and inventory from Amaca at fair value in connection with the first phase of the Company’s restructuring. Each of these transactions involved only Australian companies and, accordingly, the Company believes the transactions are governed by Australian laws and not the laws of any other jurisdiction. The Company does not believe these transactions should give rise to the assumption by the Company of any asbestos-related liabilities (tortious or otherwise) under Australian law that may have been incurred during the period prior to the transfer of the assets. | ||
| Under Dutch law, a Dutch transferee of assets may be held responsible for the liabilities of the transferor following a transfer of assets if the transfer results in the transferor having insufficient assets to meet the claims of its creditors or if the transfer otherwise jeopardizes the position of the creditors of the transferor. The Company believes the transfer by ABN 60 of all of the shares of James Hardie N.V. (“JH NV”) to JHI NV in the 2001 Restructuring will not result in the Company being held responsible as transferee under this rule because, upon the transfer and the implementation of the other aspects of the 2001 Restructuring, ABN 60 had the same financial resources to meet the claims of its creditors as it had prior to the transfer. | ||
| Special Commission of Inquiry On 29 October 2003, the Foundation issued a press release stating that its “most recent actuarial analysis estimates that the compensation bill for the organisation could reach one billion Australian dollars in addition to those funds already paid out to claimants since the Foundation was formed and that existing funding could be exhausted within five years.” In February 2004, the NSW Government established a Special Commission of Inquiry (“SCI”) to investigate, among other matters described below, the circumstances in which the Foundation was established. The SCI was instructed to determine the current financial position of the Foundation and whether it would be likely to meet its future asbestos-related claims in the medium to long-term. It was also instructed to report on the circumstances in which the Foundation was separated from ABN 60 and whether this may have resulted in or contributed to a possible insufficiency of assets to meet future asbestos-related liabilities, and the circumstances in which any corporate restructure or asset transfers occurred within or in relation to the James Hardie Group prior to the funding of the Foundation to the extent that this may have affected the Foundation’s ability to meet its current and future liabilities. The SCI was also instructed to report on the adequacy of current arrangements available to the Foundation under the Corporations Act of Australia to assist the Foundation in managing its liabilities and whether reform was desirable in order to assist the Foundation in managing its obligations to current and future claimants. |
||
| On 14 July 2004, following the receipt of a new actuarial estimate of asbestos liabilities of the Foundation by KPMG Actuaries, the Company lodged a submission with the SCI stating that the Company would recommend to its shareholders that they approve the provision of an unspecified amount of additional funding to enable an effective statute-based scheme to compensate all future claimants for asbestos-related injuries for which Amaca and Amaba may become liable. The Company proposed that the statutory scheme include the following elements: |
F-19
| • | speedy, fair and equitable compensation for all existing and future claimants, including objective criteria to reduce superimposed inflation. Superimposed inflation is inflation in claim awards above the underlying rate of inflation and is sometimes called judicial inflation; | ||
| • | contributions to be made in a manner which provide certainty to claimants as to their entitlement, the scheme administrator as to the amount available for distribution, and the proposed contributors (including the Company) as to the ultimate amount of their contributions; | ||
| • | significant reductions in legal costs through reduced and more abbreviated litigation; and | ||
| • | limitation of legal avenues outside of the scheme. |
| The submission stated that the proposal was made without any admission of liability or prejudice to the Company’s rights or defences. | ||
| The SCI issued its report on 21 September 2004. The following is a summary of the principal findings of the SCI relating to the Company based on the SCI’s report and other information available to the Company. This summary does not contain all of the findings contained or observations made in the SCI report. It should be noted that the SCI is not a court and, therefore, its findings have no legal force. | ||
| Principal findings in favour of the Company The principal findings in favour of the Company were that: |
| • | the establishment of the Foundation was legally effective and causes of action which the Foundation, Amaba or Amaca might have against the James Hardie Group, its officers and advisers would be unlikely to result in any significant increase in the funds of Amaba, Amaca or the Foundation (putting this finding conversely, the Company is unlikely to face any significant liability to the Foundation, Amaba or Amaba as a result of the then current causes of action of such entities against the current members of the James Hardie Group); | ||
| • | there was no finding that JHI NV had committed any material breach of any law as a result of the separation and reorganisation transactions which took place in 2001; | ||
| • | many of the allegations and causes of action put forward by lawyers for the Foundation, Amaba and Amaca were “speculative;” and | ||
| • | the SCI rejected the suggestion that JHI NV had breached any law or was part of a conspiracy in relation to the fact that the reorganisation scheme documents prepared in 2001 did not refer to the possibility of the partly-paid shares being cancelled (the shares were cancelled in 2003). |
| Other principal findings relevant to the Company The other principal findings relevant to the Company were that: |
| • | as a practical (but not legal) matter, if the “right” amount (and not merely the minimum amount) of funding was not provided to the Foundation, the Company would face potential legislative, customer, union and public action to apply legislative and boycott measures and public pressure to ensure that the Company met any significant funding shortfall; and | ||
| • | the directors of ABN 60 at the time of the cancellation of the partly-paid shares (Messrs Morley and Salter) effectively followed the instructions of JHI NV in relation to the cancellation. As a result, it might be concluded that JHI NV was a shadow director of ABN 60 at that time. However, while expressing some reservations about what occurred, the SCI did not find that the ABN 60 directors (including JHI NV as a shadow director) breached their duties in undertaking the cancellation. |
F-20
| Principal findings against ABN 60 (formerly called JHIL) A number of further findings (positive and adverse) were also made in relation to ABN 60, which is not a current member of the James Hardie Group. Such findings were not directed against the Company. For the reasons provided above, the Company does not believe that it will have any liability under current Australian law if future liabilities of ABN 60 or ABN 60 Foundation exceed the funds available to those entities. This includes liabilities that may attach to ABN 60 or ABN 60 Foundation as a result of claims made, if successful, in connection with the transactions involved in the establishment of the ABN 60 Foundation and the separation of ABN 60 from the Company. |
||
| The SCI found that, given ABN 60’s limited financial resources, ABN 60 would need to be able to succeed in making a claim against JHI NV in respect of the cancellation of the partly-paid shares before claims by Amaba or Amaca against ABN 60 had any practical value. Although expressing reservations about what occurred, the SCI did not find that the directors of ABN 60 had breached their duty in cancelling the partly-paid shares. | ||
| The SCI did not make any finding that any cause of action by ABN 60 with respect to the partly-paid shares was likely to succeed. | ||
| Principal findings against Mr Macdonald and Mr Shafron The principal (but non-determinative) findings against Messrs Macdonald and Shafron pertained to their conduct while officers of ABN 60 in relation to: |
| • | alleged false and misleading conduct associated with a 16 February 2001 press release, particularly regarding a statement that the Foundation was “fully funded” in contravention of New South Wales and Commonwealth legislation prohibiting false or misleading conduct; | ||
| • | allegedly breaching their duties as officers of ABN 60 by encouraging the board of directors of ABN 60 to act on the Trowbridge report, dated 13 February 2001 (the “Trowbridge Report”), in forming a view that the Foundation would be “fully funded;” and | ||
| • | criticisms, falling short of findings of contraventions of law, based on their respective roles in the separation and reorganization transactions. These included criticisms relating to their development, control over, reliance on and use of the Trowbridge Report, despite (in the SCI’s view) their knowledge of its limitations. |
| The Commissioner noted that he had not carried out an exhaustive investigation and concluded that it was a matter for Commonwealth authorities (notably the Australian Securities and Investments Commission) to determine whether any further action should be taken in relation to matters which the Commissioner considered comprised, or might be likely to have comprised, contraventions of Australian corporations law. The Commissioner acknowledged that in relation to various of his findings, there was an issue as to whether Amaba or Amaca suffered any loss or damage from the actions reviewed by him but in this regard he did not find it necessary to reach any definitive conclusion. | ||
| In relation to the question of the funding of the Foundation, the SCI found that there was a significant shortfall in funds available to satisfy potential asbestos-related liabilities of Amaca, Amaba and ABN 60. In part, this was based on actuarial work commissioned by the Company indicating that the discounted value of the central estimate of the asbestos liabilities of Amaca and Amaba was approximately A$1.573 billion as of 30 June 2003. The central estimate was calculated in accordance with Australian Actuarial Standards, which differ from generally accepted accounting principles in the United States. As of 30 June 2003, the undiscounted value of the central estimate of the asbestos liabilities of Amaca and Amaba, as determined by KPMG Actuaries, was approximately A$3.403 billion (US$2.272 billion). The SCI found that the net assets of the Foundation and the ABN 60 Foundation were not sufficient to meet these prospective liabilities and were likely to be exhausted in the first half of 2007. |
F-21
| In relation to the Company’s statutory scheme proposal, the SCI reported that there were several issues that needed to be refined quite significantly but that it would be an appropriate starting point for devising a compensation scheme. | ||
| The SCI’s findings are not binding and if the same issues were presented to a court, the court might come to different conclusions on one or more of the issues. | ||
| Events Following the SCI Findings The NSW Government stated that it would not consider assisting the implementation of any proposal advanced by the Company unless it was the result of an agreement reached with the unions acting through the Australian Council of Trade Unions (“ACTU”), UnionsNSW (formerly known as the Labour Council of New South Wales), and a representative of the asbestos claimants (together, the “Representatives”). The statutory scheme that the Company proposed on 14 July 2004 was not accepted by the Representatives. |
||
| The Company continues to believe that, apart from the obligations it voluntarily assumed under the Final Funding Agreement described herein and as discussed below under the subheading “Interim Funding and ABN 60 Indemnity,” under current Australian law, it is not legally liable for any shortfall in the assets of Amaca, Amaba, the Foundation, the ABN 60 Foundation or ABN 60. | ||
| Following the release of the SCI report, the Representatives and others indicated that they would encourage or continue to encourage consumers and union members in Australia and elsewhere to ban or boycott the Company’s products, to demonstrate or otherwise create negative publicity toward the Company in order to influence the Company’s approach to the discussions with the NSW Government or to encourage governmental action if the discussions are unsuccessful. The Company’s financial position, results of operations and cash flows were affected by such bans and boycotts, although the impact was not material. The Representatives and others also indicated that they might take actions in an effort to influence the Company’s shareholders, a significant number of which are located in Australia, to approve any proposed arrangement. Pursuant to the Final Funding Agreement, the Representatives agreed to use their best endeavours to achieve forthwith the lifting of all bans or boycotts on any products manufactured, produced or sold by the Company, and the Company and the Representatives signed a deed of release in December 2005 under which the Company agreed to release the Representatives and the members of the ACTU and UnionsNSW from civil liability arising in relation to bans or boycotts instituted as a result of the events described above. Such releases did not extend to any new bans or boycotts, if applicable, implemented after the date of signing of the Final Funding Agreement, or to any bans or boycotts which persisted beyond 1 January 2006. The Company is aware of a number of bans or boycotts having been lifted, and is monitoring the progress towards the lifting of a number of remaining bans or boycotts. However, if the conditions precedent to the Final Funding Agreement are not satisfied or if for any other reason that agreement is not implemented, it remains the case that fresh bans or boycotts could be implemented against the Company’s products. Any such measures, and the influences resulting from them, could have a material adverse impact on the Company’s financial position, results of operations and cash flows. | ||
| On 28 October 2004, the NSW Premier announced that the NSW Government would seek the agreement of the Ministerial Council, comprising Ministers of the Commonwealth and the Australian States and Territories, to allow the NSW Government to pass legislation which he announced would “wind back James Hardie’s corporate restructure and rescind the cancellation of A$1.9 billion in partly-paid shares.” The announcement said that “the laws will effectively enforce the liability (for asbestos-related claims) against the Dutch parent company.” On 5 November 2004, the Australian Attorney-General and the Parliamentary Secretary to the Treasurer (the two relevant ministers of the Australian Federal Government) issued a news release stating that the Ministerial Council for Corporations (the relevant body of Federal, State and Territory Ministers) (“MINCO”) had unanimously agreed “to support a negotiated settlement that will ensure that victims of asbestos- |
F-22
| related diseases receive full and timely compensation from James Hardie” and if “the current negotiations between James Hardie, the ACTU and asbestos victims do not reach an acceptable conclusion, MINCO also agreed in principle to consider options for legislative reform.” The news release of 5 November 2004 indicated that treaties to enforce Australian judgments in Dutch and US courts are not required, but that the Australian Government has been involved in communications with Dutch and US authorities regarding arrangements to ensure that Australian judgments are able to be enforced where necessary. If the conditions precedent to the full implementation of the Final Funding Agreement are not satisfied or if otherwise the Final Funding Agreement is terminated by James Hardie, the Company is aware that legislative intervention may ensue but has no detailed information as to the content of any such legislation. | ||
| Heads of Agreement On 21 December 2004, the Company announced that it had entered into a non-binding Heads of Agreement with the NSW Government and the Representatives which was expected to form the basis of a proposed binding agreement under which a subsidiary of the Company would agree to provide, and the Company would guarantee, funding payments to a special purpose fund established to provide funding on a long-term basis to be applied towards meeting proven asbestos-related personal injury and death claims (“Claims”) against the Former James Hardie Companies. The Heads of Agreement set out the key principles in a more detailed legally binding agreement. |
||
| Negotiations between the NSW Government and the Company as to the terms of such legally binding agreement continued throughout 2005 and resulted in the execution of the Final Funding Agreement as described herein. | ||
| Extension of Heads of Agreement to cover Baryulgil claims On 15 April 2005, the Company announced that it had extended the coverage of the funding arrangements agreed under the Heads of Agreement to enable the SPF to settle or meet proven Claims by members of the Baryugil community in Australia against Asbestos Mines Pty Ltd (“Asbestos Mines”), a former ABN 60 subsidiary which conducted asbestos-related mining activities in or around Baryugil. The Company has no current right to access any Claims information in relation to Claims against Asbestos Mines, and has no current involvement in the management or settlement of such Claims. Asbestos Mines, which had subsequently been renamed to Marlew Mining Pty Ltd, has not been part of the James Hardie Group since 1976, when it was sold to Woodsreef Mines Ltd, which was subsequently renamed Mineral Commodities Ltd., which continues to our Marlew mining. From 1954 until 1976, Marlew Mining was a wholly owned subsidiary of James Hardie Industries Limited (now ABN 60). Except as described below, the Company has not had access to any information regarding claims or the decisions taken by the Foundation in relation to them. |
||
| Interim Funding and ABN 60 Indemnity The Company has previously announced a number of measures in relation to the funding position of the Foundation prior to the Company’s entry into the Final Funding Agreement. On 3 December 2004, and in part as a result of initiatives undertaken by the Company, the Foundation received a payment of A$88.5 million from ABN 60 for use in processing and meeting asbestos-related claims pursuant to the terms of a deed of covenant and indemnity which ABN 60, Amaca and Amaba had entered into in February 2001. |
||
| The Company facilitated the payment of such funds by granting an indemnity (under a separate deed of indemnity) to the directors of ABN 60, which it announced on 16 November 2004. Under the terms of that indemnity, the Company agreed to meet any liability incurred by the ABN 60 directors resulting from the release of the A$88.5 million by ABN 60 to the Foundation. The Company believes that the release of funding by ABN 60 is in accordance with law and effective contracts and therefore the Company should not incur liability under this indemnity. The Company has not received any claim/nor made any payments in relation to this indemnity. |
F-23
| Additionally, on 16 November 2004, the Company offered to provide funding to the Foundation on an interim basis for a period of up to six months from that date. Such funding would only be provided once existing Foundation funds have been exhausted. | ||
| On 31 March 2005, the Company announced that it would extend the timing of its commitment to assist the Foundation to obtain interim funding, if necessary, prior to the Final Funding Agreement being finalised in accordance with the updated timetable announced on that date. | ||
| The Company has not recorded a provision for either the proposed indemnity or the potential payments under the interim funding proposal. The Company has not been required to make any payments pursuant to this commitment. | ||
| With regard to the ABN 60 indemnity, there is no maximum value or limit on the amount of payments that may be required. As such, the Company is unable to disclose a maximum amount that could be required to be paid. The Company believes, however, that the expected value of any potential future payments resulting from the ABN 60 indemnity is zero and that the likelihood of any payment being required under this indemnity is remote. | ||
| Releases From Civil Liability The Final Funding Agreement was supplemented by legislation passed by the NSW Government to provide releases to the James Hardie Group and to current and former directors, officers, employees, agents and advisers of James Hardie group members from all civil liabilities in connection with (among other matters) the establishment and funding (or underfunding) of the Foundation as described above, the corporate reorganisations of the James Hardie Group in 2001 and other matters examined by the SCI. |
||
| The full form of the statutory releases is set out in legislation passed by the NSW Parliament and contained in the James Hardie (Civil Liability) Act 2005 and the James Hardie (Civil Penalty Compensation Release) Act 2005. The term “civil liabilities” is not defined in that legislation and therefore bears its ordinary meaning under Australian law. When introducing that legislation into the NSW Parliament, the Attorney General of New South Wales stated that the legislation was intended to extinguish liabilities for civil penalties for which a compensation order may be imposed under the Corporations Act 2001 (Cth), but it was not intended to release the released persons from any other kind of civil penalty orders that may be imposed (including any liabilities for fines, orders banning individuals from being directors, or court declaration that a contravention of a civil penalty provision has occurred). Australian courts may have regard to those statements in determining the scope of civil liabilities released under this legislation, where they consider that the natural and ordinary meaning of “civil liabilities” is ambiguous or obscure. | ||
| That legislation also released certain persons in relation to the entry by JHI NV and the Performing Subsidiary into the Heads of Agreement, the Final Funding Agreement and the Related Agreements and their implementation by the James Hardie Group, and the circumstances giving rise to the same. However, such releases did not affect the obligations of JHI NV and the Performing Subsidiary of their obligation set out in the Final Funding Agreement or Related Agreements. | ||
| The NSW Government has also undertaken to refrain from taking any action inconsistent with such releases and extinguishments. The releases and extinguishments contained in the legislation described above are permanent in relation to all released persons who are natural persons. In relation to companies and other non-natural persons who were released under that legislation, the releases and extinguishments may be suspended by the NSW Government if the Performing Subsidiary is and remains in breach of any obligation to make a funding payment under the Final Funding Agreement or of its obligations not to undertake certain prejudicial specified dealings, and the Performing Subsidiary or the Company has not remedied the breach within three months of the Company having received a notice under the Final Funding Agreement. |
F-24
| Provision for Asbestos-Related Liability If negotiations in relation to the Final Funding Agreement are completed and the Final Funding Agreement is subsequently executed and becomes effective, the Company will be required to make a substantial provision in its consolidated financial statements and, depending on the terms of the Final Funding Agreement when settled, it is possible that the Company may need to seek additional borrowing facilities. If the terms of the Final Funding Agreement result in the Company making payments, either on an annual or other basis, the Company’s financial position, results of operations and cash flows could be materially adversely affected and its ability to pay dividends could be impaired. The Final Funding Agreement is subject to certain conditions precedent, including our ability to obtain full tax deductibility for the contributions under this agreement and approval by the Company’s lenders and shareholders. |
||
| The Company has not established a provision for asbestos-related liabilities as of 31 December 2001 or 31 March 2005 because, at this time, no such liability is probable and estimable in accordance with SFAS No. 5, “Accounting for Contingencies.” | ||
| Actuarial Study; Claims Estimate The Company commissioned updated actuarial studies of potential asbestos-related liabilities as of 30 June 2005. Based on the results of these studies, it is estimated that the discounted value of the central estimate for claims against the Former James Hardie companies was approximately A$1.57 billion (US$1.15 billion). The undiscounted value of the central estimate of the asbestos-related liabilities of Amaca and Amaba as determined by KPMG Actuaries was approximately A$3.13 billion (US$2.3 billion). Actual liabilities of those companies for such claims could vary, perhaps materially, from the central estimate described above. This central estimate is calculated in accordance with Australian Actuarial Standards, which differ from accounting principles generally accepted in the United States. |
||
| In estimating the potential financial exposure, the actuaries made assumptions related to the total number of claims which were reasonably estimated to be asserted through 2071, the typical cost of settlement (which is sensitive to, among other factors, the industry in which the plaintiff claims exposure, the alleged disease type and the jurisdiction in which the action is being brought), the legal costs incurred in the litigation of such claims, the rate of receipt of claims, the settlement strategy in dealing with outstanding claims and the timing of settlements. | ||
| Further, the actuaries have relied on the data and information provided by the Foundation and Amaca Claim Services, Amaca Pty Ltd (Under NSW External Administration) (“ACS”) and assumed that it is accurate and complete in all material respects. The actuaries have not verified the information independently nor established the accuracy or completeness of the data and information provided or used for the preparation of the report. | ||
| Due to inherent uncertainties in the legal and medical environment, the number and timing of future claim notifications and settlements, the recoverability of claims against insurance contracts, and estimates of future trends in average claim awards, as well as the extent to which the above-named entities will contribute to the overall settlements, the actual amount of liability could differ materially from that which is currently projected. | ||
| A sensitivity analysis has been performed to determine how the actuarial estimates would change if certain assumptions (i.e., the rate of inflation and superimposed inflation, the average costs of claims and legal fees, and the projected numbers of claims) were different from the assumptions used to determine the central estimates. This analysis shows that the discounted central estimates could be in a range of A$1.0 billion (US$0.7 billion) to A$2.5 billion (US$1.8 billion) (undiscounted estimates of A$1.5 billion (US$1.1 billion) to A$5.5 billion (US$4.0 billion) as of 30 June 2005. It should be noted that the actual cost of the liabilities could be outside of that range depending on the results of actual experience relative to the assumptions made. |
F-25
| The potential range of costs as estimated by KPMG Actuaries is affected by a number of variables such as nil settlement rates (where no settlement is payable by the Former James Hardie Companies because the claim settlement is borne by other asbestos defendants (other than the Former James Hardie subsidiaries) which are held liable), peak year of claims, past history of claims numbers, average settlement rates, past history of Australian asbestos-related medical injuries, current number of claims, average defence and plaintiff legal costs, base wage inflation and superimposed inflation. The potential range of losses disclosed includes both asserted and unasserted claims. While no assurances can be provided, if the Final Funding Agreement is approved by all of the necessary parties, including our Board of Directors, shareholders and lenders, the Company expects to be able to partially recover losses from various insurance carriers. As of 30 June 2005, KPMG Actuaries’ undiscounted central estimate of asbestos-related liabilities was A$3.1 billion (US$2.2 billion). This undiscounted central estimate is net of expected insurance recoveries of A$427.9 million (US$313.9 million) after making a general credit risk allowance for bad debt insurance carriers and an allowance for A$44.9 million (US$32.9 million) of “by claim” or subrogation recoveries from other third parties. | ||
| Currently, the timing of any potential payments is uncertain because the conditions precedent to the Final Funding Agreement have not been satisfied. In addition, the Company has not yet incurred any settlement costs pursuant to its offer to provide the Foundation with interim funding, which is described above under the heading “Interim Funding and ABN 60 Indemnity” because the Foundation continues to meet all claims of Amaca and Amaba. | ||
| Claims Data The following table, provided by KPMG Actuaries, shows the number of claims pending as of 31 December 2005 and 31 March 2005: |
| 31 December | 31 March | |||||||
| 2005 | 2005 | |||||||
Australia |
545 | 712 | ||||||
New Zealand |
— | — | ||||||
Unknown — Court Not Identified(1) |
24 | 36 | ||||||
USA |
1 | 1 | ||||||
| (1) | The “Unknown — Court Not Identified” designation reflects that the information for such claims had not been, as of the date of publication, entered into the database which the Foundation maintains. Over time, as the details of “unknown” claims are provided to the Foundation, the Company believes the database is updated to reflect where such claims originate. Accordingly, the Company understands the number of unknown claims pending fluctuates due to the resolution of claims as well as the reclassification of such claims. |
F-26
| For the nine months ended 31 December 2005 and the twelve months ended 31 March 2005, the following tables, provided by KPMG Actuaries, show the claims filed, the number of claims dismissed, settled or otherwise resolved for each period, and the average settlement amount per claim. |
| Nine Months | Twelve Months | |||||||
| Ended | Ended | |||||||
| 31 December | 31 March | |||||||
| 2005 | 2005 | |||||||
Australia: |
||||||||
Number of new claims filed |
286 | 489 | ||||||
Number of claims dismissed |
79 | 62 | ||||||
Number of claims settled or otherwise resolved |
374 | 402 | ||||||
Average settlement amount per claim |
A$ | 148,892 | A$ | 157,594 | ||||
| US$ | 112,754 | US$ | 116,572 | |||||
Unknown — Court Not Identified: |
||||||||
Number of new claims filed |
7 | 7 | ||||||
Number of claims dismissed |
11 | 20 | ||||||
Number of claims settled or otherwise resolved |
8 | 2 | ||||||
Average settlement amount per claim |
A$ | 153,400 | A$ | 47,000 | ||||
| US$ | 116,168 | US$ | 34,766 | |||||
USA: |
||||||||
Number of new claims filed |
— | — | ||||||
Number of claims dismissed |
— | 3 | ||||||
Number of claims settled or otherwise resolved |
— | 1 | ||||||
Average settlement amount per claim |
A$ | — | A$ | 228,293 | ||||
| US$ | — | US$ | 168,868 | |||||
| The following table, provided by KPMG Actuaries, shows the activity related to the numbers of open claims, new claims, and closed claims during each of the past five years and the average settlement per settled claim and case closed. |
| As of or for | ||||||||||||||||||||
| the Period | ||||||||||||||||||||
| Ended 31 | ||||||||||||||||||||
| December | As of or for the Period Ended 31 March | |||||||||||||||||||
| 2005 | 2005 | 2004 | 2003 | 2002 | ||||||||||||||||
Number of open claims at
beginning of year |
749 | 743 | 814 | 671 | 569 | |||||||||||||||
Number of new claims |
293 | 496 | 380 | 409 | 375 | |||||||||||||||
Number of closed claims |
472 | 490 | 451 | 266 | 273 | |||||||||||||||
Number of open claims at year-end |
570 | 749 | 743 | 814 | 671 | |||||||||||||||
Average settlement amount per
settled claim |
A$ | 148,987 | A$ | 157,223 | A$ | 167,450 | A$ | 201,200 | A$ | 197,941 | ||||||||||
| US$ | 112,813 | US$ | 116,298 | US$ | 116,127 | US$ | 112,974 | US$ | 101,603 | |||||||||||
Average settlement amount per
case closed |
A$ | 120,578 | A$ | 129,949 | A$ | 117,327 | A$ | 177,752 | A$ | 125,435 | ||||||||||
| US$ | 91,302 | US$ | 96,123 | US$ | 81,366 | US$ | 99,808 | US$ | 64,386 | |||||||||||
F-27
| The Company has not had any responsibility or involvement in the management of claims against ABN 60 since the time ABN 60 left the James Hardie Group in 2003. Since February 2001, when Amaca and Amaba were separated from the James Hardie Group, neither the Company nor any current subsidiary of the Company has had any responsibility or involvement in the management of claims against those entities. Prior to that date, the principal entity potentially involved in relation to such claims was ABN 60, which has not been a member of the James Hardie Group since March 2003. However, the Final Funding Agreement and associated New South Wales legislation contemplates that the SPF will have both the responsibility for and arrangement of claims against the Former James Hardie Companies, and that the Company will have the right to appoint a majority of the directors of the SPF unless a special default or insolvency event arises, as explained further above. | ||
| On 26 October 2004, the Company, the Foundation and KPMG Actuaries entered into an agreement under which the Company would be entitled to obtain a copy of the actuarial report prepared by KPMG Actuaries in relation to the claims liabilities of the Foundation and Amaba and Amaca, and would be entitled to publicly release the final version of such reports. The Company is seeking to obtain similar rights of access to actuarial information produced for the SPF by the actuary to be appointed by the SPF (the “Approved Actuary”). The terms of such access are not yet settled. The Company’s future disclosures with respect to claims statistics is subject to it obtaining such information from the Approved Actuary. The Company has had no general right (and will not obtain any right under the Final Funding Agreement) to audit or otherwise itself independently verify such information or the methodologies to be adopted by the Approved Actuary. As a result, the Company cannot make any representations or warranties as to the accuracy or completeness of the actuarial information disclosed herein or that may be disclosed in the future. | ||
| SCI and Other Related Expenses The Company has incurred substantial costs associated with the SCI and may incur material costs in the future related to the SCI or subsequent legal proceedings. The following are the components of SCI and other related expenses: |
| Three Months | Nine Months | |||||||||||||||
| Ended 31 December | Ended 31 December | |||||||||||||||
| (Millions of US dollars) | 2005 | 2004 | 2005 | 2004 | ||||||||||||
SCI |
$ | — | $ | — | $ | — | $ | 6.3 | ||||||||
Internal investigation |
— | 3.3 | — | 4.4 | ||||||||||||
ASIC investigation |
0.1 | 1.0 | 0.3 | 1.0 | ||||||||||||
Severance and consulting |
— | 6.0 | 0.1 | 6.0 | ||||||||||||
Resolution advisory fees |
2.8 | 3.8 | 8.5 | 4.5 | ||||||||||||
Funding advice |
0.1 | 0.6 | 4.0 | 0.6 | ||||||||||||
Other |
1.8 | 1.2 | 1.8 | 1.6 | ||||||||||||
Total SCI and other related expenses |
$ | 4.8 | $ | 15.9 | $ | 14.7 | $ | 24.4 | ||||||||
| Internal investigation costs reflect costs incurred by the Company in connection with an internal investigation conducted by independent legal advisors to investigate allegations raised during the SCI and the preparation and filing of the Company’s annual financial statements in the United States. |
F-28
| Australian Securities and Investments Commission Investigation The Australian Securities and Investments Commission (“ASIC”) has announced that it is conducting an investigation into the events examined by the SCI, without limiting itself to the evidence compiled by the SCI. ASIC has served notices to produce relevant documents upon the Company and various directors and officers of the Company and upon certain of the Company’s advisers and auditors at the time of the separation and restructure transactions described above. ASIC has also served notices requiring the Company and ABN 60 to produce certain computerized information and requiring certain current and former directors and officers of ABN 60 or the Company to present themselves for examination by ASIC delegates. The individuals who have been required to attend such examinations have done so. To date, ASIC has announced that it is investigating various matters, but it has not specified the particulars of alleged contraventions under investigation, nor has it announced that it has reached any conclusion that any person or entity has contravened any relevant law. |
||
| To assist ASIC’s investigation, the Australian Federal Government enacted legislation to abrogate the legal professional privilege which would otherwise have attached to certain documents relevant to matters under investigation or to any future proceedings to be taken. The legislation is set out in the James Hardie (Investigations and Proceedings) Act 2004. | ||
| The Company may incur liability to meet the costs of current or former directors, officers or employees of the James Hardie Group to the extent that those costs are covered by indemnity arrangements granted by the Company to those persons. To date, no claims have been received from any current or former officers in relation to the ASIC investigation, except in relation to the examination by a former director of ABN 60 by ASIC delegates, the amount of which cannot be assessed at present. In relation to this claim and any others that may arise, the Company may be reimbursed in whole or in part under directors’ and officers’ insurance policies maintained by the Company. | ||
| Financial Position of the Foundation On the basis of the current cash and financial position of the Foundation’s subsidiaries (Amaca and Amaba) and following the Company’s entry into the Heads of Agreement, the applications previously made to the Supreme Court of NSW by the Foundation for the appointment of a provisional liquidator to the Foundation’s subsidiaries were dismissed with the Foundations consent. Such applications have now been rendered unnecessary by the passage of the civil liability release legislation described above. |
||
| The potential for Amaba, Amaca or ABN 60 to be placed into insolvency has been further reduced by legislation passed in NSW (the James Hardie Former Subsidiaries (Winding Up and Administration) Act 2005), which came into force on 2 December 2005 and in effect replaced the James Hardie Former Subsidiaries (Special Provisions) Act 2005. Parts 3 and 4 of the legislation maintain the status quo of Amaca, Amaba and ABN 60, including by providing for a statutory form of administration for those entities so as to prevent them being placed into administration or liquidation under the provisions of the Australian Corporations Act which would usually apply to an insolvent Australian company. The legislation also sought to ensure that the directors of those entities would not seek to remove the assets or the register of shares in those entities outside New South Wales. |
F-29
| Environmental and Legal | ||
| The operations of the Company, like those of other companies engaged in similar businesses, are subject to a number of federal, state and local laws and regulations on air and water quality, waste handling and disposal. The Company’s policy is to accrue for environmental costs when it is determined that it is probable that an obligation exists and the amount can be reasonably estimated. In the opinion of management, based on information presently known except as set forth above, the ultimate liability for such matters should not have a material adverse effect on either the Company’s consolidated financial position, results of operations or cash flows. | ||
| The Company is involved from time to time in various legal proceedings and administrative actions incidental or related to the normal conduct of its business. Although it is impossible to predict the outcome of any pending legal proceeding, management believes that such proceedings and actions should not, except as it relates to asbestos as described above, individually or in the aggregate, have a material adverse effect on either its consolidated financial position, results of operations or cash flows. | ||
| The Company believes that future costs related to the Company’s implementation of the Final Funding Agreement are likely to be material over the short term. The Company does not expect any material additional costs to be incurred in connection with the SCI. | ||
| Tax Contingencies | ||
| Due to the size of the Company and the nature of its business, the Company is subject to ongoing reviews by the Internal Revenue Service (“IRS”), the Australian Taxation Office (“ATO”) and other taxing jurisdictions on various tax matters, including challenges to various positions the Company asserts on its income tax returns. The Company accrues for tax contingencies based upon its best estimate of the taxes ultimately expected to be paid, which it updates over time as more information becomes available. Such amounts are included in taxes payable or other non-current liabilities, as appropriate. If the Company ultimately determines that payment of these amounts is unnecessary, the Company reverses the liability and recognises a tax benefit during the period in which the Company determines that the liability is no longer necessary. The Company records an additional charge in the period in which it determines that the recorded tax liability is less than it expects the ultimate assessment to be. | ||
| Relevant tax authorities from various jurisdictions in which the Company operates are in the process of auditing the Company’s respective jurisdictional income tax returns for various ranges of years. None of the audits have progressed sufficiently to predict their ultimate outcome. The Company has accrued income tax liabilities for these audits based upon knowledge of all relevant facts and circumstances, taking into account existing tax laws, its experience with previous audits and settlements, the status of current tax examinations, and how the tax authorities view certain issues. | ||
| The Company has been advised that an assessment arising from the tax audits may be made against the Company related to certain tax positions. The Company is currently in discussions related to facts and circumstances of the Company’s tax position. At this time, the Company is unable to estimate the size or range of any potential assessment. If an assessment is asserted, the Company may be required to pay all or a portion of the assessment while it continues to resolve the matter. However, the Company believes that its tax position will ultimately prevail. |
F-30
| The Company currently derives significant tax benefits under the US-Netherlands tax treaty. During fiscal year 2005, this treaty was amended to provide, among other things, new requirements that the Company must meet for the Company to continue to qualify for treaty benefits. During fiscal year 2006, the Company made changes to its organisational and operational structure to satisfy the requirements of the amended treaty and believes that it is now in compliance and should continue qualifying for treaty benefits. However, if during a subsequent tax audit or related process the IRS determines that these changes do not meet the new requirements, the Company may not qualify for treaty benefits its effective income tax rate could significantly increase beginning in the fiscal year that such determination is made and it could be liable for taxes owed from the effective date of the amended treaty provisions. | ||
| 9. | New Debt Facilities | |
| In June 2005, the Company entered into new uncollateralised debt facilities totalling US$355.0 million. These new debt facilities are revolving US dollar cash advance facilities involving bilateral agreements with six banks and replaced the Company’s previous revolving and stand-by credit facilities at 31 March 2005 of approximately US$286.0 million. These new facilities are available for general corporate purposes. | ||
| Each of these new facilities is for an initial term of 364 days, although the maturity of US$110.0 million of these facilities has been extended to December 2006. The interest rate for each facility is the London Inter-Bank Offered Rate (“LIBOR”) for the US dollar plus a margin. These facilities also require the Company to maintain certain financial ratios of debt to equity and net worth and levels of earnings before interest and taxes, as well as to comply with certain other undertakings. | ||
| Upon bank and shareholder approval of the Final Funding Agreement and the Final Funding Agreement becoming effective, US$245.0 million of these facilities will be extended to a term of five years from their signing date. With the exception of margins and commitment fees, terms of these extended facilities would not change. | ||
| At 31 December 2005, there were no amounts outstanding under any of these facilities and management believes that the Company was in compliance with all restrictive covenants related to these borrowing facilities. |
F-31
| Item 2. Quantitative and Qualitative Disclosures About Market Risk | ||
| In this report, James Hardie Industries N.V. and its subsidiaries are collectively referred to as “we,” “us,” or “our,” and the terms “US$”, “A$”, “NZ$”, “PHP”, refer to United States dollars, Australian dollars, New Zealand dollars and Philippine pesos, respectively. | ||
| We have operations in foreign countries and, as a result, are exposed to foreign currency exchange rate risk inherent in purchases, sales, assets and liabilities denominated in currencies other than the U.S. dollar. We also are exposed to interest rate risk associated with our long-term debt and to changes in prices of commodities we use in production. | ||
| Our policy is to enter into derivative instruments solely to mitigate risks in our business and not for trading or speculative purposes. | ||
| Foreign Currency Exchange Rate Risk | ||
| We have significant operations outside of the United States and, as a result, are exposed to changes in exchange rates which affect our financial position, results of operations and cash flows. For the nine months ended 31 December 2005, the following currencies comprised the following percentages of our net sales, cost of goods sold, expenses and liabilities: |
| US$ | A$ | NZ$ | Other (1) | |||||||||||||
Net sales |
82.3 | % | 11.4 | % | 3.7 | % | 2.6 | % | ||||||||
Cost of goods sold |
83.9 | % | 11.1 | % | 2.9 | % | 2.1 | % | ||||||||
Expenses |
68.1 | % | 24.1 | % | 2.3 | % | 5.5 | % | ||||||||
Liabilities (excluding borrowings) |
83.9 | % | 8.3 | % | 5.3 | % | 2.5 | % | ||||||||
| (1) | Comprised of Philippine pesos, Euros and Chilean pesos. |
| We purchase raw materials and fixed assets and sell some finished product for amounts denominated in currencies other than the functional currency of the business in which the related transaction is generated. In order to protect against foreign exchange rate movements, we may enter into forward exchange contracts timed to mature when settlement of the underlying transaction is due to occur. At 31 December 2005, outstanding foreign exchange contracts were not material. | ||
| Interest Rate Risk | ||
| We have market risk from changes in interest rates, primarily related to our borrowings. At 31 December 2005, 100% of our borrowings were fixed-rate. The fixed-rate debt reduces the earnings volatility that would result from changes in interest rates. From time to time, we may enter into interest rate swap contracts in an effort to mitigate interest rate risk. During the nine months ended 31 December 2005, no interest rate swap contracts were entered into and no contracts were outstanding at 31 December 2005. |
F-32
| The following table presents our long-term borrowings at 31 December 2005, the expected maturity date of future principal repayments and related weighted average interest rates. The fair value of our outstanding debt is what we likely would have to pay over the term of the loan if we were to enter into debt on substantially the same terms today. At 31 December 2005, all of our outstanding fixed-rate borrowings were denominated in U.S. dollars. |
| For the Years Ending 31 March | ||||||||||||||||||||||||||||||||
| 2007 | 2008 | 2009 | 2010 | 2011 | Thereafter | Total | Fair Value | |||||||||||||||||||||||||
Fixed rate debt |
$ | 27.1 | $ | 8.1 | $ | 46.2 | — | $ | 14.7 | $ | 25.6 | $ | 121.7 | $ | 134.5 | |||||||||||||||||
Weighted-average
interest rate |
6.99 | % | 7.05 | % | 7.12 | % | — | 7.24 | % | 7.42 | % | 7.16 | % | |||||||||||||||||||
| Commodity Price Risk | ||
| Pulp is a raw material we use to produce fibre cement, and it has historically demonstrated more price sensitivity than other raw materials we use in our manufacturing process. Although we have entered into contracts to hedge pulp prices in the past, we do not anticipate entering in such transactions in the near future. |
F-33
| • | expectations that the conditions precedent to the Final Funding Agreement will be satisfied; | ||
| • | expectations about payments to a special purpose fund for the compensation of proven asbestos-related personal injury and death claims; | ||
| • | projections of our operating results or financial condition; | ||
| • | statements regarding our plans, objectives or goals, including those relating to competition, acquisitions, dispositions and our products; | ||
| • | statements about our future performance; and | ||
| • | statements about product or environmental liabilities. |
F-34

| FY06 3rd Quarter and Nine Months Results 27 February 2006 In this Management Presentation, James Hardie may present the financial measures, sales volume terms, financial ratios, and Non-US GAAP financial measures included in the Definitions section of this document starting on page 48. The company presents financial measures that it believes are customarily used by its Australian investors. Specifically, these financial measures include "EBIT", "EBIT margin", "Operating profit from continuing operations", and "Net operating profit including discontinued operations". James Hardie also presents other terms for measuring its sales volumes ("million square feet (mmsf)" and "thousand square feet (msf)"); financial ratios ("Gearing ratio" , "Net interest expense cover", Net interest paid cover", "Net debt payback", "Net debt/cash"); and Non-US GAAP financial measures ("EBIT and EBIT margin excluding SCI and other related expenses", and "Operating profit from continuing operations excluding SCI and other related expenses"). Unless otherwise stated, results are for continuing operations only and comparisons are of the 3rd quarter and first nine months of the current fiscal year versus the 3rd quarter and first nine months of the prior fiscal year. |
| Overview and Operating Review - Louis Gries, CEO Financial Review - Russell Chenu, CFO Asbestos-related compensation funding proposal - Russell Chenu, CFO Questions and Answers Agenda |
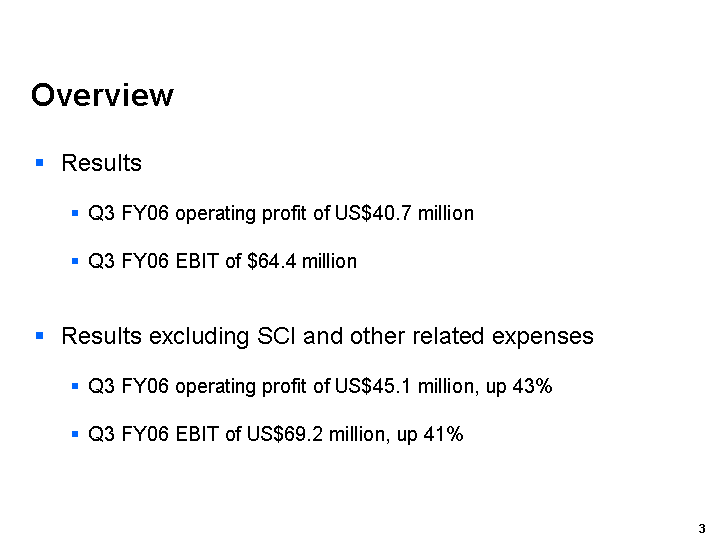
| Overview Results Q3 FY06 operating profit of US$40.7 million Q3 FY06 EBIT of $64.4 million Results excluding SCI and other related expenses Q3 FY06 operating profit of US$45.1 million, up 43% Q3 FY06 EBIT of US$69.2 million, up 41% |
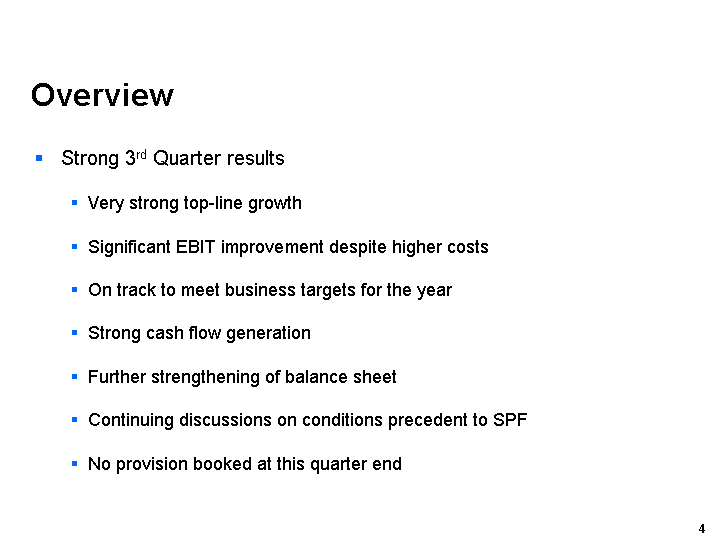
| Overview Strong 3rd Quarter results Very strong top-line growth Significant EBIT improvement despite higher costs On track to meet business targets for the year Strong cash flow generation Further strengthening of balance sheet Continuing discussions on conditions precedent to SPF No provision booked at this quarter end |

| Overview 3rd Quarter and Nine Months FY06 Q3 FY06 % 9 Mths FY06 % Net Sales up 26 up 23 Gross Profit up 33 up 35 EBIT up 93 up 73 EBIT excluding SCI and other related expenses up 41 up 55 Operating Profit from Continuing Operations excluding SCI and other related expenses up 43 up 56 |
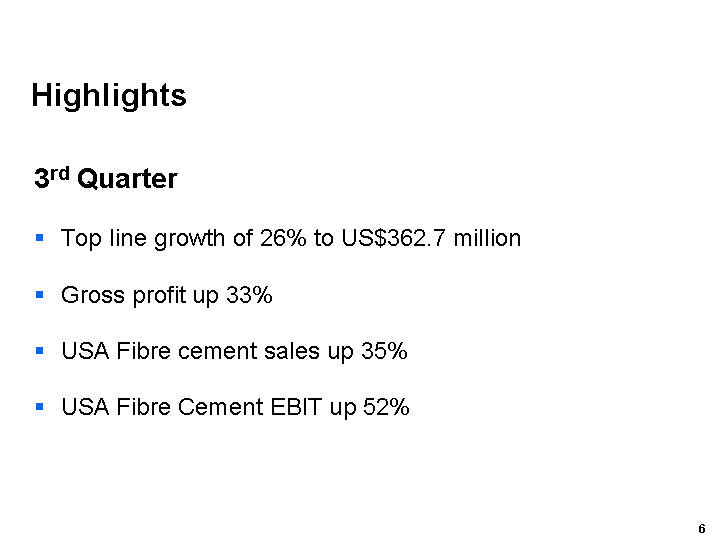
| Highlights 3rd Quarter Top line growth of 26% to US$362.7 million Gross profit up 33% USA Fibre cement sales up 35% USA Fibre Cement EBIT up 52% |
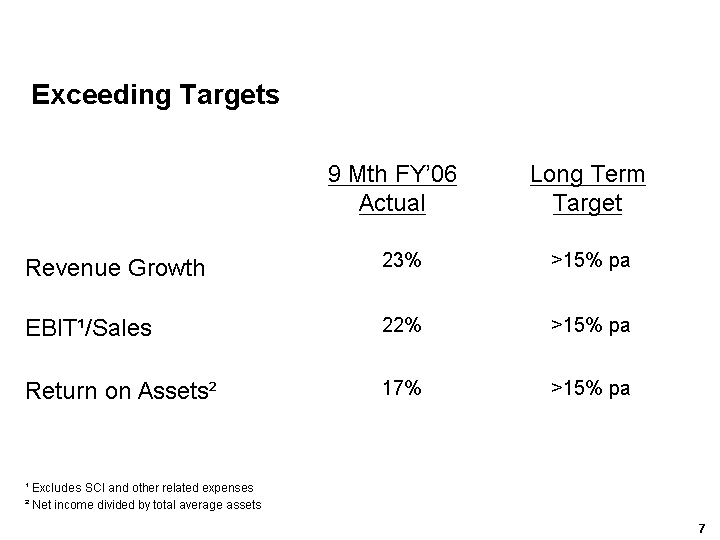
| Exceeding Targets 9 Mth FY'06 Actual Long Term Target Revenue Growth 23% >15% pa EBIT1/Sales 22% >15% pa Return on Assets2 17% >15% pa 1 Excludes SCI and other related expenses 2 Net income divided by total average assets 1 Excludes SCI and other related expenses 2 Net income divided by total average assets |
| Operating Review Louis Gries, CEO |
| USA Fibre Cement PHOTO |
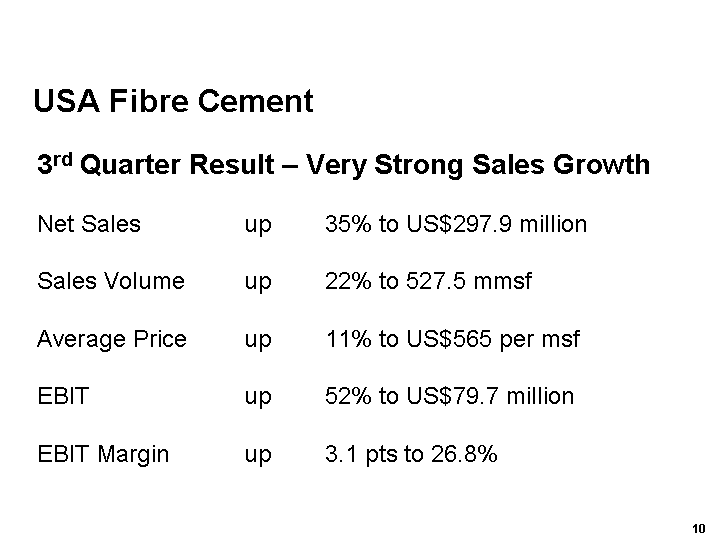
| 3rd Quarter Result - Very Strong Sales Growth Net Sales up 35% to US$297.9 million Sales Volume up 22% to 527.5 mmsf Average Price up 11% to US$565 per msf EBIT up 52% to US$79.7 million EBIT Margin up 3.1 pts to 26.8% USA Fibre Cement |
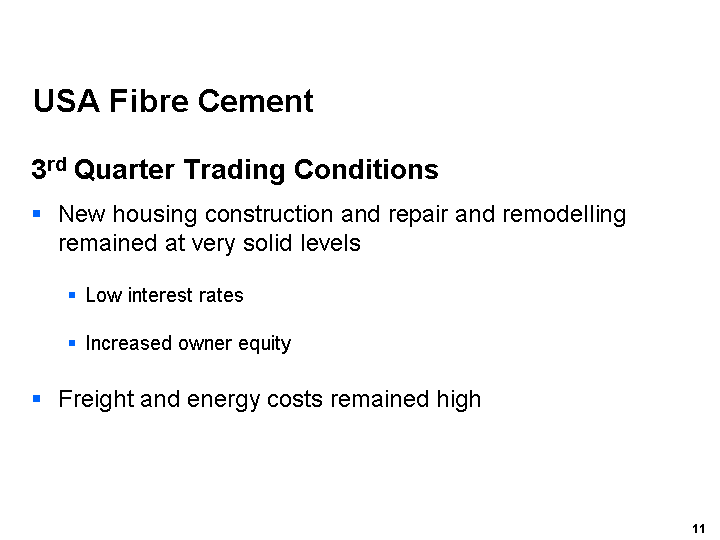
| USA Fibre Cement 3rd Quarter Trading Conditions New housing construction and repair and remodelling remained at very solid levels Low interest rates Increased owner equity Freight and energy costs remained high |

| USA Fibre Cement Key Points Growth in both emerging and established markets Both interior and exterior products growing strongly Continued market penetration against alternative materials Strong sales growth in higher-priced differentiated products ColorPlusTM strategy continuing to progress well More paint lines being built High cement, energy and freight costs continue |
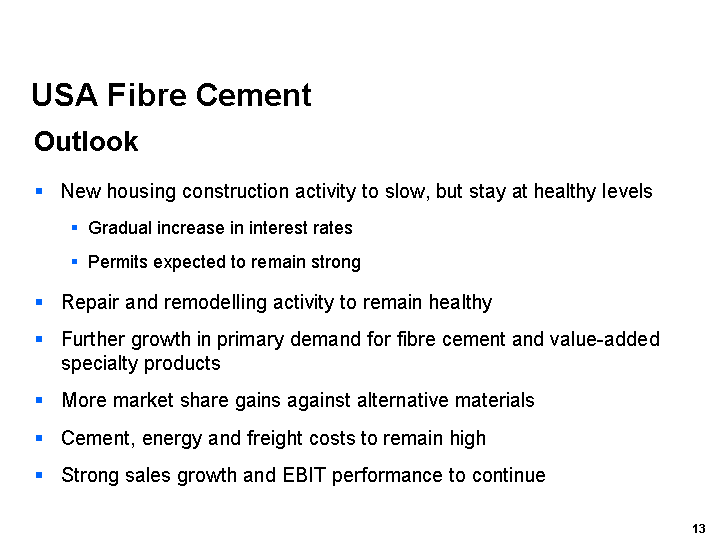
| USA Fibre Cement Outlook New housing construction activity to slow, but stay at healthy levels Gradual increase in interest rates Permits expected to remain strong Repair and remodelling activity to remain healthy Further growth in primary demand for fibre cement and value-added specialty products More market share gains against alternative materials Cement, energy and freight costs to remain high Strong sales growth and EBIT performance to continue |
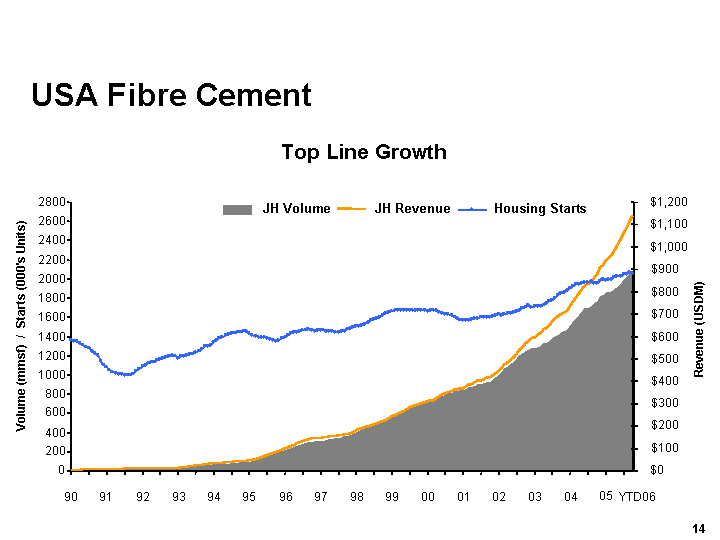
| USA Fibre Cement Volume (mmsf) / Starts (000's Units) Top Line Growth 0 200 400 600 800 1000 1200 1400 1600 1800 2000 2200 2400 2600 2800 90 91 92 93 94 95 96 97 98 99 00 01 02 03 04 05 $0 $100 $200 $300 $400 $500 $600 $700 $800 $900 $1,000 $1,100 $1,200 Revenue (USDM) JH Volume JH Revenue Housing Starts YTD06 |
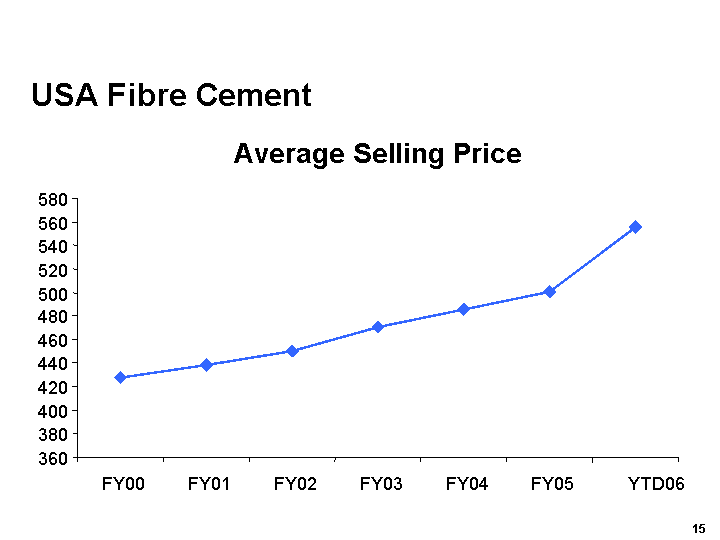
| USA Fibre Cement Average Selling Price 360 380 400 420 440 460 480 500 520 540 560 580 FY00 FY01 FY02 FY03 FY04 FY05 YTD06 |
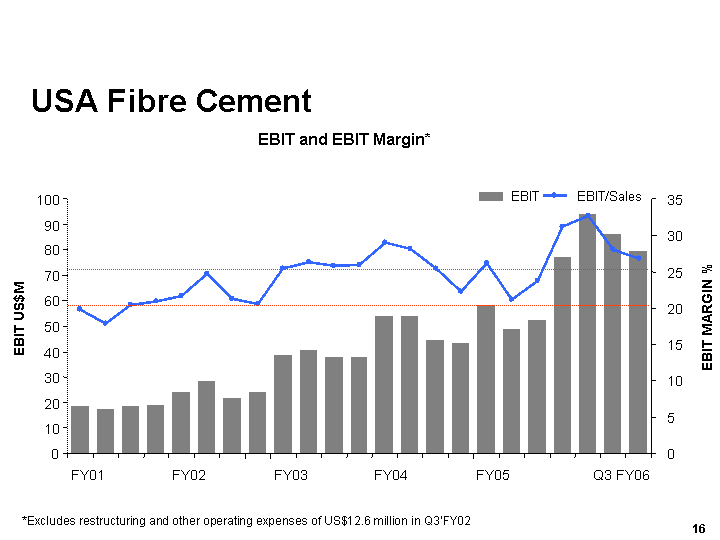
| USA Fibre Cement *Excludes restructuring and other operating expenses of US$12.6 million in Q3'FY02 EBIT US$M EBIT and EBIT Margin* 0 10 20 30 40 50 60 70 80 90 100 FY01 FY02 FY03 FY04 FY05 Q3 FY06 0 5 10 15 20 25 30 35 EBIT MARGIN % EBIT EBIT/Sales |
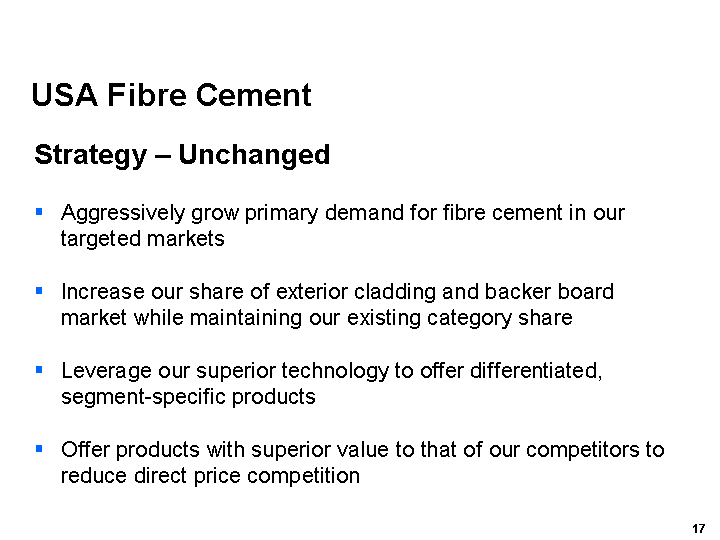
| USA Fibre Cement Strategy - Unchanged Aggressively grow primary demand for fibre cement in our targeted markets Increase our share of exterior cladding and backer board market while maintaining our existing category share Leverage our superior technology to offer differentiated, segment-specific products Offer products with superior value to that of our competitors to reduce direct price competition |
| Asia Pacific Fibre Cement PHOTO |
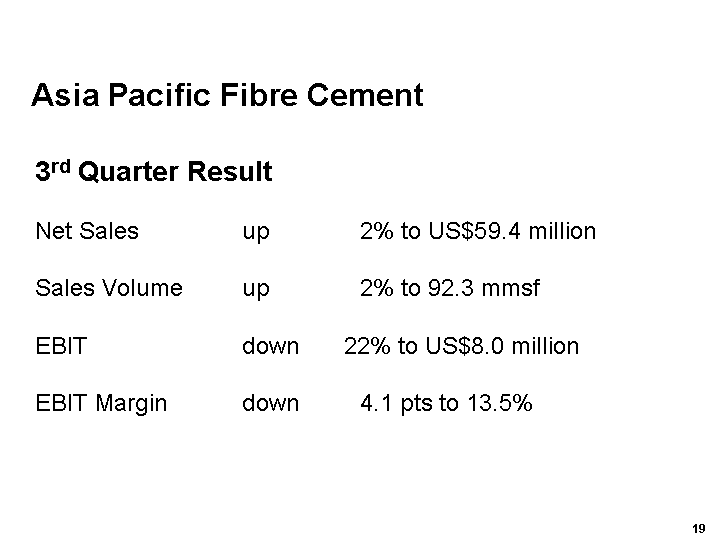
| Asia Pacific Fibre Cement 3rd Quarter Result Net Sales up 2% to US$59.4 million Sales Volume up 2% to 92.3 mmsf EBIT down 22% to US$8.0 million EBIT Margin down 4.1 pts to 13.5% |
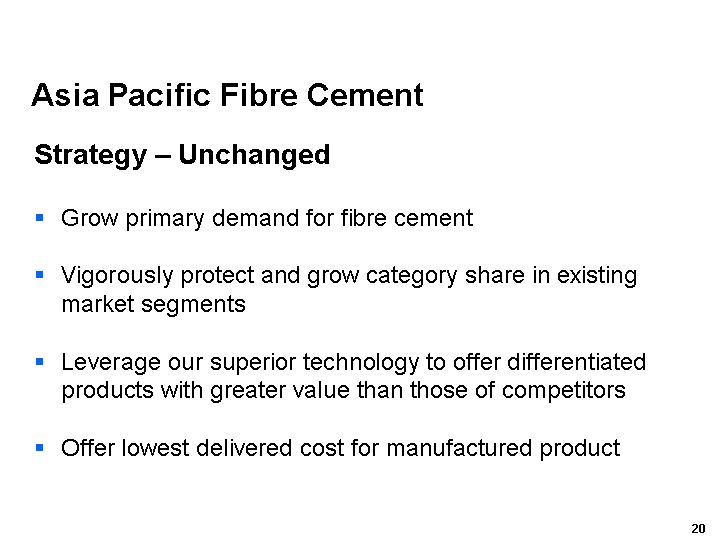
| Strategy - Unchanged Grow primary demand for fibre cement Vigorously protect and grow category share in existing market segments Leverage our superior technology to offer differentiated products with greater value than those of competitors Offer lowest delivered cost for manufactured product Asia Pacific Fibre Cement |
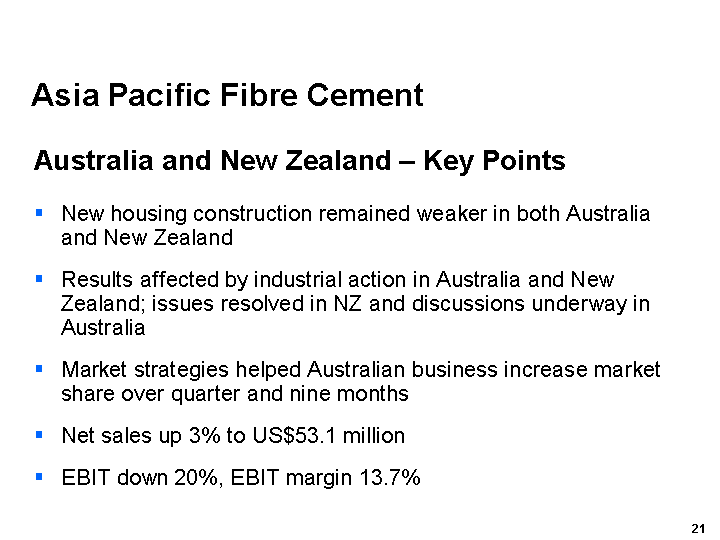
| Asia Pacific Fibre Cement Australia and New Zealand - Key Points New housing construction remained weaker in both Australia and New Zealand Results affected by industrial action in Australia and New Zealand; issues resolved in NZ and discussions underway in Australia Market strategies helped Australian business increase market share over quarter and nine months Net sales up 3% to US$53.1 million EBIT down 20%, EBIT margin 13.7% |
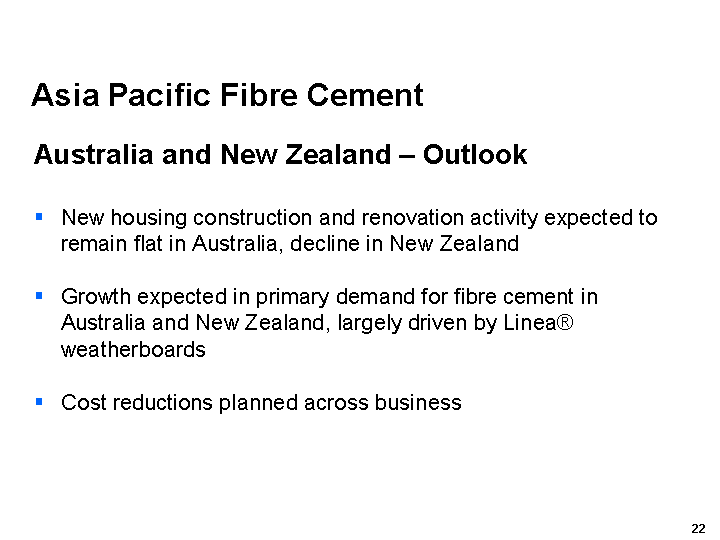
| Asia Pacific Fibre Cement Australia and New Zealand - Outlook New housing construction and renovation activity expected to remain flat in Australia, decline in New Zealand Growth expected in primary demand for fibre cement in Australia and New Zealand, largely driven by Linea(r) weatherboards Cost reductions planned across business |
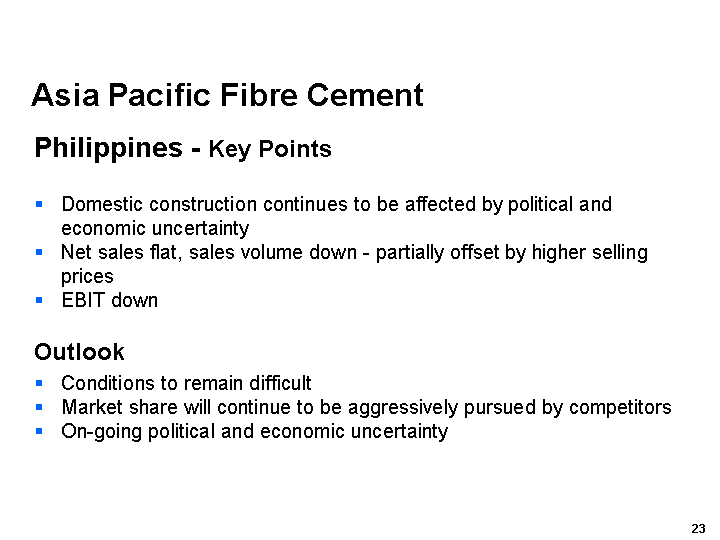
| Asia Pacific Fibre Cement Philippines - Key Points Domestic construction continues to be affected by political and economic uncertainty Net sales flat, sales volume down - partially offset by higher selling prices EBIT down Outlook Conditions to remain difficult Market share will continue to be aggressively pursued by competitors On-going political and economic uncertainty |
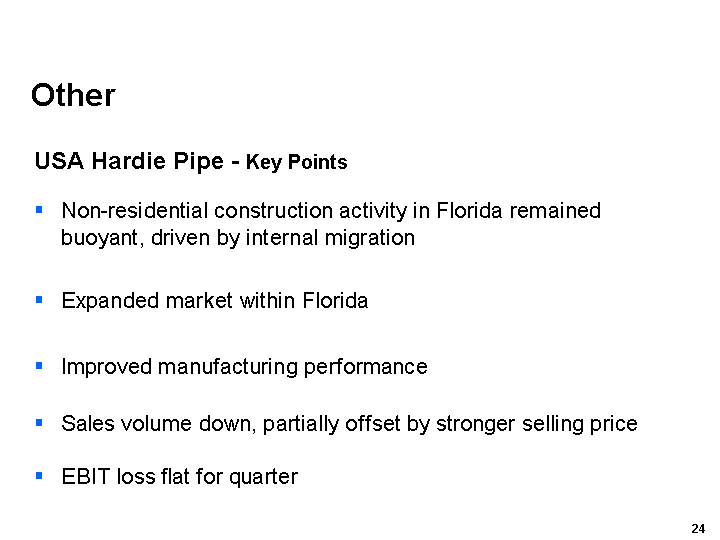
| Other USA Hardie Pipe - Key Points Non-residential construction activity in Florida remained buoyant, driven by internal migration Expanded market within Florida Improved manufacturing performance Sales volume down, partially offset by stronger selling price EBIT loss flat for quarter |
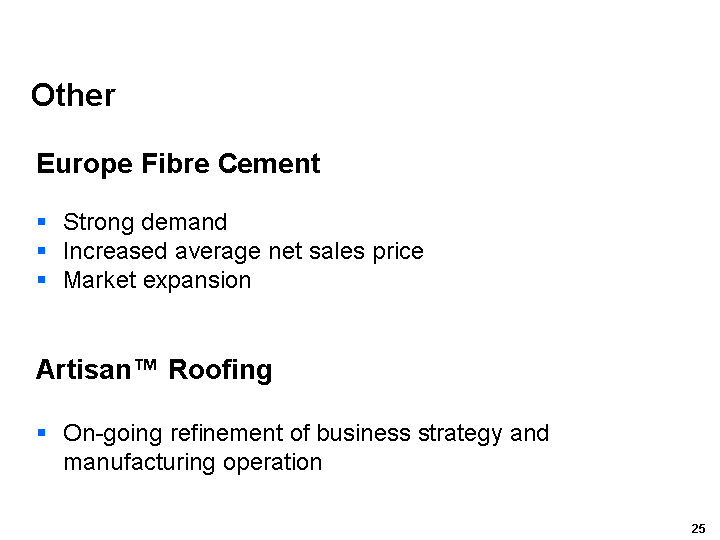
| Other Europe Fibre Cement Strong demand Increased average net sales price Market expansion Artisan(tm) Roofing On-going refinement of business strategy and manufacturing operation |
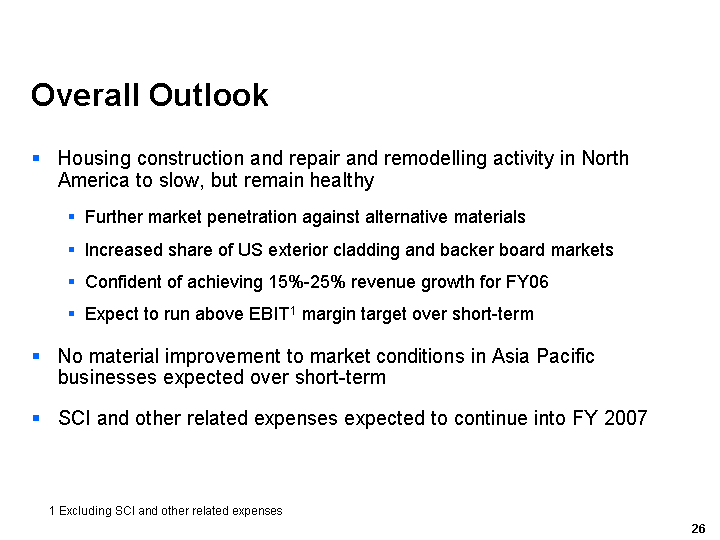
| Overall Outlook Housing construction and repair and remodelling activity in North America to slow, but remain healthy Further market penetration against alternative materials Increased share of US exterior cladding and backer board markets Confident of achieving 15%-25% revenue growth for FY06 Expect to run above EBIT1 margin target over short-term No material improvement to market conditions in Asia Pacific businesses expected over short-term SCI and other related expenses expected to continue into FY 2007 1 Excluding SCI and other related expenses |
| Financial Review Russell Chenu, CFO |
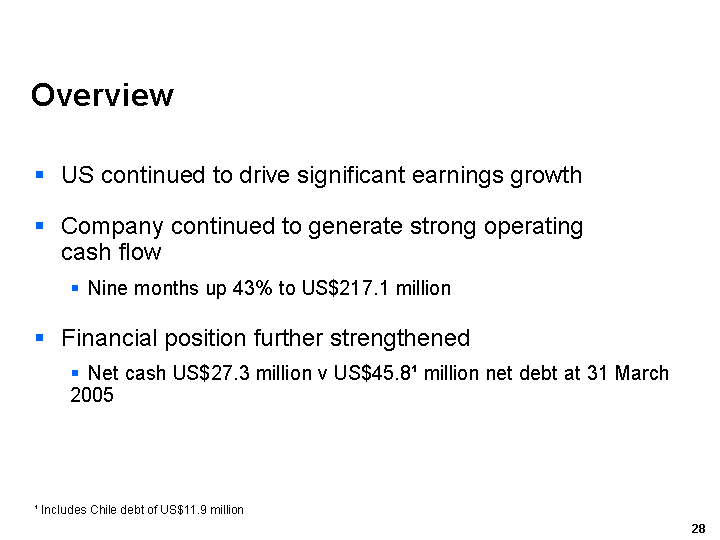
| Overview US continued to drive significant earnings growth Company continued to generate strong operating cash flow Nine months up 43% to US$217.1 million Financial position further strengthened Net cash US$27.3 million v US$45.81 million net debt at 31 March 2005 1 Includes Chile debt of US$11.9 million |
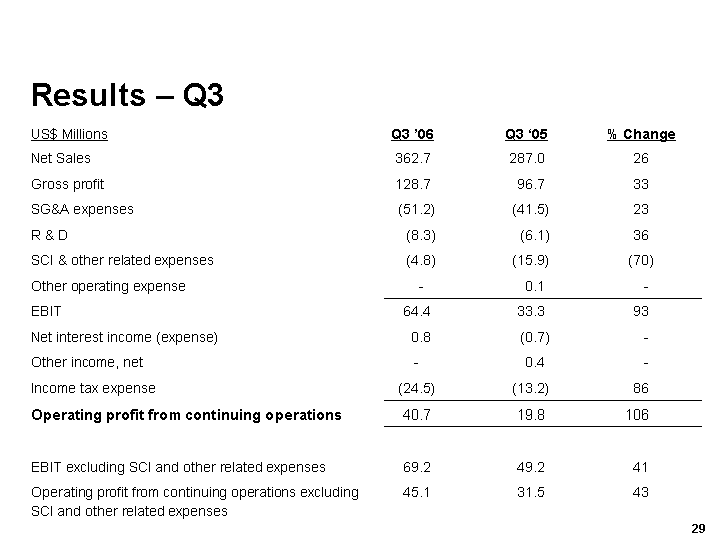
| Results - Q3 US$ Millions Q3 '06 Q3 '05 % Change Net Sales 362.7 287.0 26 Gross profit 128.7 96.7 33 SG&A expenses (51.2) (41.5) 23 R & D (8.3) (6.1) 36 SCI & other related expenses (4.8) (15.9) (70) Other operating expense - 0.1 - EBIT 64.4 33.3 93 Net interest income (expense) 0.8 (0.7) - Other income, net - 0.4 - Income tax expense (24.5) (13.2) 86 Operating profit from continuing operations 40.7 19.8 106 EBIT excluding SCI and other related expenses 69.2 49.2 41 Operating profit from continuing operations excluding SCI and other related expenses 45.1 31.5 43 |
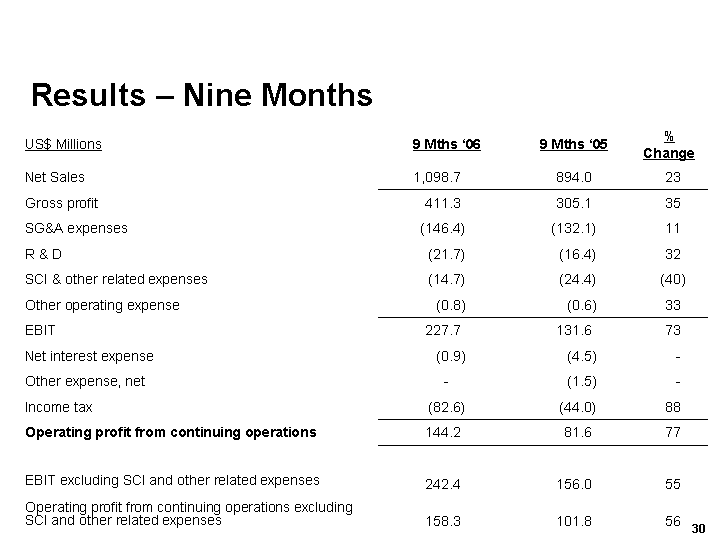
| Results - Nine Months US$ Millions 9 Mths '06 9 Mths '05 % Change Net Sales 1,098.7 894.0 23 Gross profit 411.3 305.1 35 SG&A expenses (146.4) (132.1) 11 R & D (21.7) (16.4) 32 SCI & other related expenses (14.7) (24.4) (40) Other operating expense (0.8) (0.6) 33 EBIT 227.7 131.6 73 Net interest expense (0.9) (4.5) - Other expense, net - (1.5) - Income tax (82.6) (44.0) 88 Operating profit from continuing operations 144.2 81.6 77 EBIT excluding SCI and other related expenses Operating profit from continuing operations excluding SCI and other related expenses 242.4 158.3 156.0 101.8 55 56 |
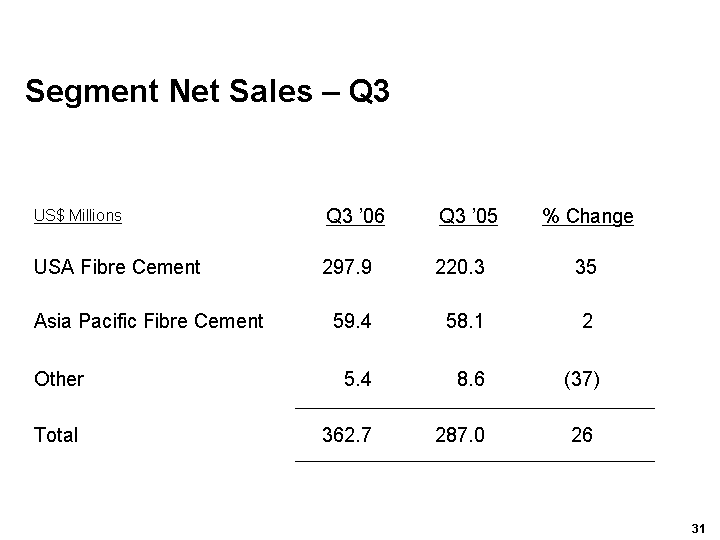
| Segment Net Sales - Q3 US$ Millions Q3 '06 Q3 '05 % Change USA Fibre Cement 297.9 220.3 35 Asia Pacific Fibre Cement 59.4 58.1 2 Other 5.4 8.6 (37) Total 362.7 287.0 26 |
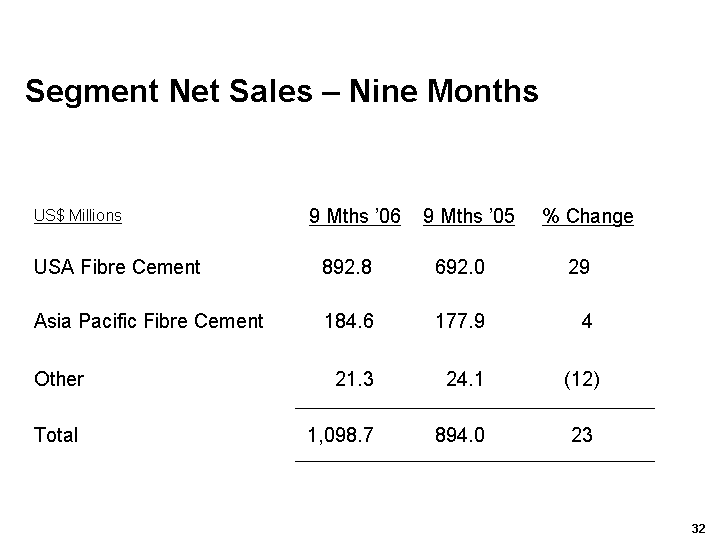
| Segment Net Sales - Nine Months US$ Millions 9 Mths '06 9 Mths '05 % Change USA Fibre Cement 892.8 692.0 29 Asia Pacific Fibre Cement 184.6 177.9 4 Other 21.3 24.1 (12) Total 1,098.7 894.0 23 |

| Segment EBIT - Q3 US$ Millions Q3 '06 Q3 '05 % Change USA Fibre Cement 79.7 52.3 52 Asia Pacific Fibre Cement 8.0 10.2 (22) R & D (4.6) (3.9) (18) Other (3.2) (2.6) (23) General Corporate (15.5) (22.7) 32 EBIT 64.4 33.3 93 Add back: SCI and other related expenses 4.8 15.9 (70) EBIT excluding SCI and other related expenses 69.2 49.2 41 R&D includes "core" R&D expenses and administrative expenses, but excludes product development expenses |
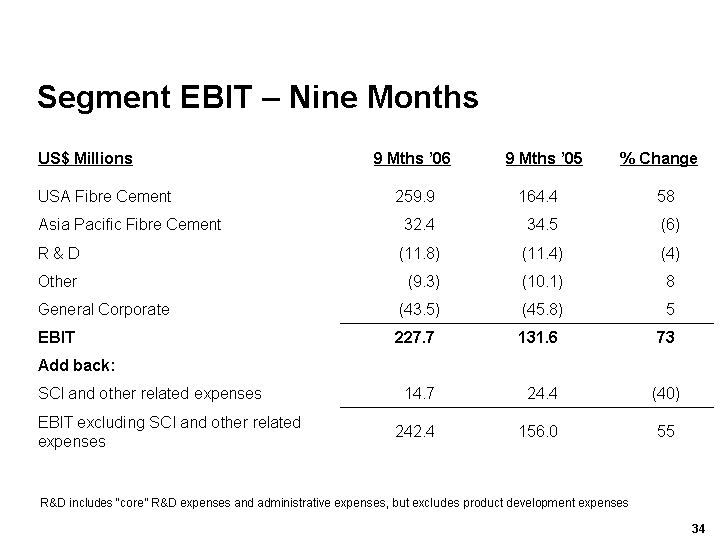
| Segment EBIT - Nine Months R&D includes "core" R&D expenses and administrative expenses, but excludes product development expenses US$ Millions 9 Mths '06 9 Mths '05 % Change USA Fibre Cement 259.9 164.4 58 Asia Pacific Fibre Cement 32.4 34.5 (6) R & D (11.8) (11.4) (4) Other (9.3) (10.1) 8 General Corporate (43.5) (45.8) 5 EBIT 227.7 131.6 73 Add back: SCI and other related expenses 14.7 24.4 (40) EBIT excluding SCI and other related expenses 242.4 156.0 55 |
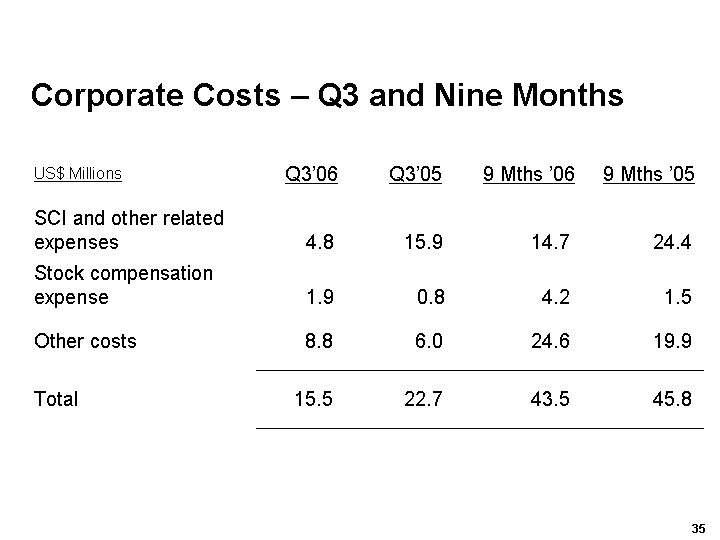
| Corporate Costs - Q3 and Nine Months US$ Millions Q3'06 Q3'05 9 Mths '06 9 Mths '05 SCI and other related expenses 4.8 15.9 14.7 24.4 Stock compensation expense 1.9 0.8 4.2 1.5 Other costs 8.8 6.0 24.6 19.9 Total 15.5 22.7 43.5 45.8 |
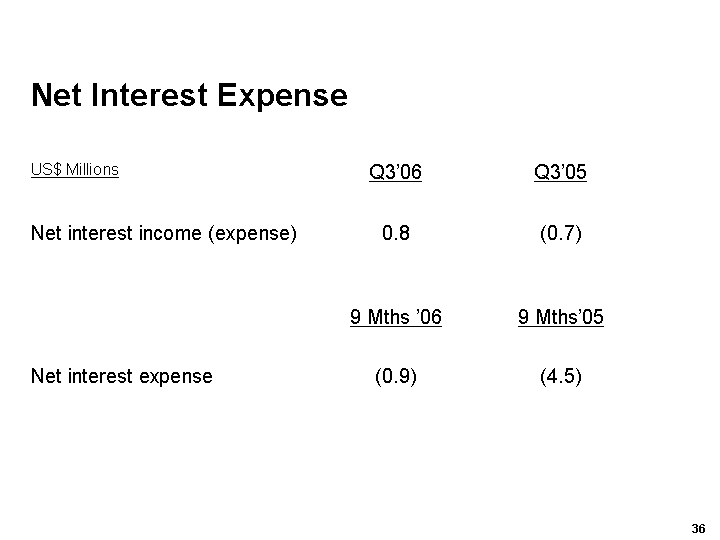
| Net Interest Expense US$ Millions Q3'06 Q3'05 Net interest income (expense) 0.8 (0.7) 9 Mths '06 9 Mths'05 Net interest expense (0.9) (4.5) |
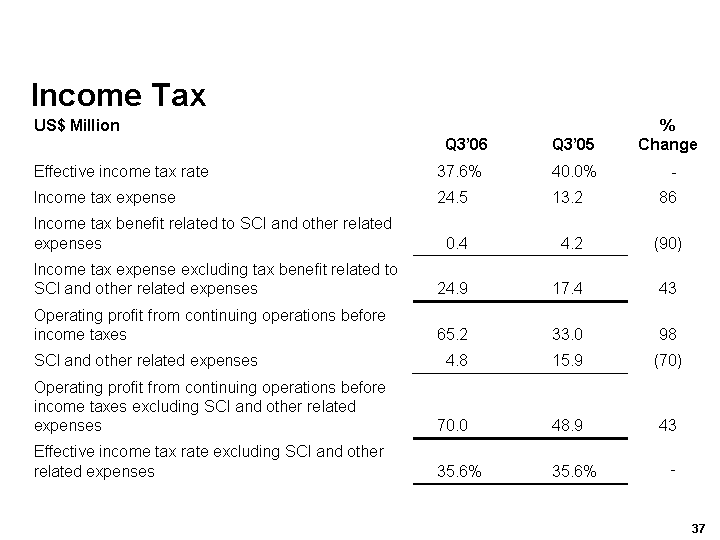
| Income Tax US$ Million Q3'06 Q3'05 % Change Effective income tax rate 37.6% 40.0% - Income tax expense 24.5 13.2 86 Income tax benefit related to SCI and other related expenses 0.4 4.2 (90) Income tax expense excluding tax benefit related to SCI and other related expenses 24.9 17.4 43 Operating profit from continuing operations before income taxes 65.2 33.0 98 SCI and other related expenses 4.8 15.9 (70) Operating profit from continuing operations before income taxes excluding SCI and other related expenses 70.0 48.9 43 Effective income tax rate excluding SCI and other related expenses 35.6% 35.6% - |
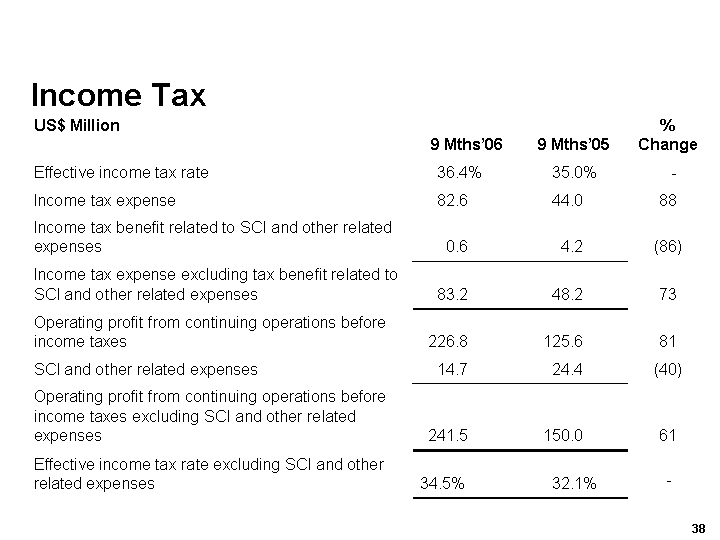
| Income Tax US$ Million 9 Mths'06 9 Mths'05 % Change Effective income tax rate 36.4% 35.0% - Income tax expense 82.6 44.0 88 Income tax benefit related to SCI and other related expenses 0.6 4.2 (86) Income tax expense excluding tax benefit related to SCI and other related expenses 83.2 48.2 73 Operating profit from continuing operations before income taxes 226.8 125.6 81 SCI and other related expenses 14.7 24.4 (40) Operating profit from continuing operations before income taxes excluding SCI and other related expenses 241.5 150.0 61 Effective income tax rate excluding SCI and other related expenses 34.5% 32.1% - |
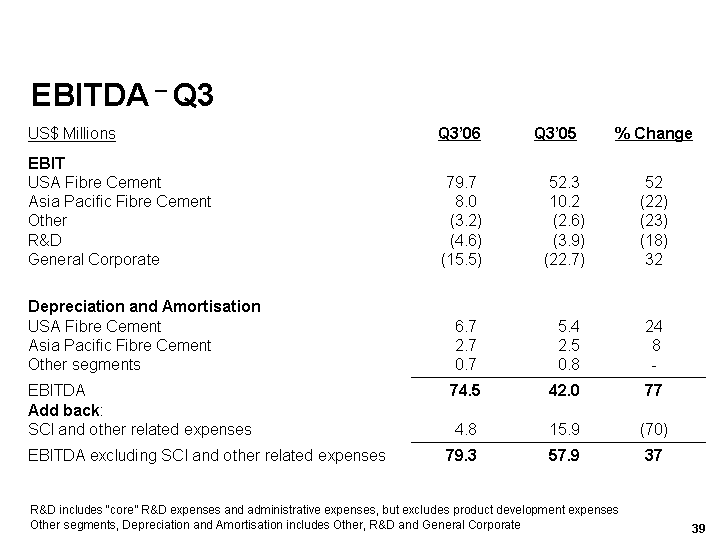
| EBITDA - Q3 US$ Millions Q3'06 Q3'05 % Change EBIT USA Fibre Cement Asia Pacific Fibre Cement Other R&D General Corporate 79.7 8.0 (3.2) (4.6) (15.5) 52.3 10.2 (2.6) (3.9) (22.7) 52 (22) (23) (18) 32 Depreciation and Amortisation USA Fibre Cement Asia Pacific Fibre Cement Other segments 6.7 2.7 0.7 5.4 2.5 0.8 24 8 - - EBITDA Add back: SCI and other related expenses 74.5 4.8 42.0 15.9 77 (70) EBITDA excluding SCI and other related expenses 79.3 57.9 37 R&D includes "core" R&D expenses and administrative expenses, but excludes product development expenses Other segments, Depreciation and Amortisation includes Other, R&D and General Corporate |
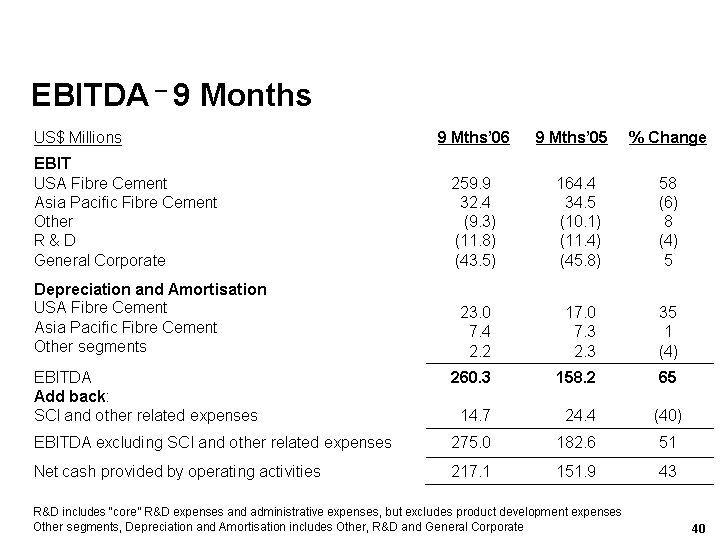
| EBITDA - 9 Months R&D includes "core" R&D expenses and administrative expenses, but excludes product development expenses Other segments, Depreciation and Amortisation includes Other, R&D and General Corporate US$ Millions 9 Mths'06 9 Mths'05 % Change EBIT USA Fibre Cement Asia Pacific Fibre Cement Other R & D General Corporate 259.9 32.4 (9.3) (11.8) (43.5) 164.4 34.5 (10.1) (11.4) (45.8) 58 (6) 8 (4) 5 Depreciation and Amortisation USA Fibre Cement Asia Pacific Fibre Cement Other segments 23.0 7.4 2.2 17.0 7.3 2.3 35 1 (4) EBITDA Add back: SCI and other related expenses 260.3 14.7 158.2 24.4 65 (40) EBITDA excluding SCI and other related expenses 275.0 182.6 51 Net cash provided by operating activities 217.1 151.9 43 |
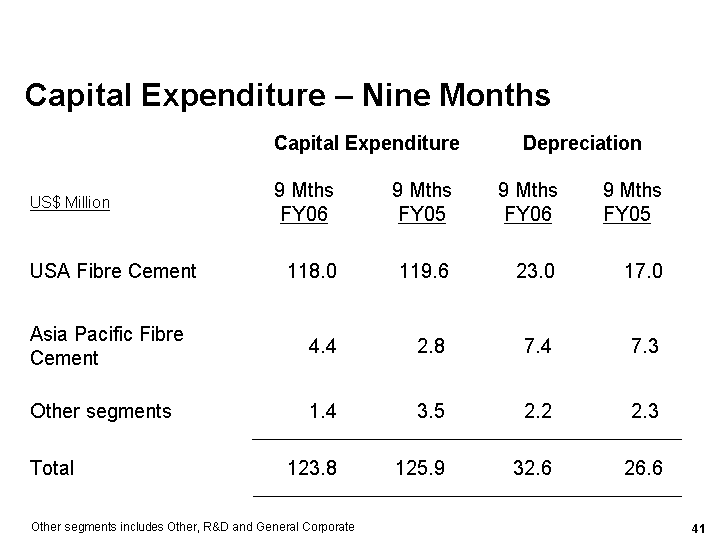
| Capital Expenditure - Nine Months Capital Expenditure Capital Expenditure Depreciation Depreciation US$ Million 9 Mths FY06 9 Mths FY05 9 Mths FY06 9 Mths FY05 USA Fibre Cement 118.0 119.6 23.0 17.0 Asia Pacific Fibre Cement 4.4 2.8 7.4 7.3 Other segments 1.4 3.5 2.2 2.3 Total 123.8 125.9 32.6 26.6 Other segments includes Other, R&D and General Corporate |
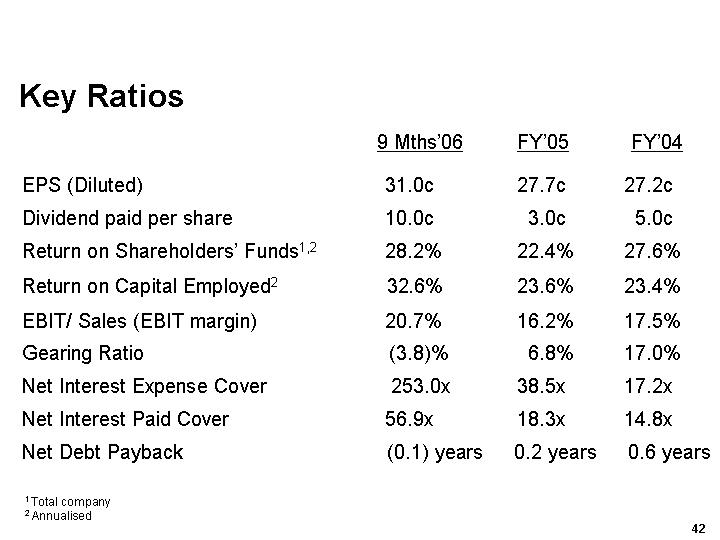
| Key Ratios 9 Mths'06 FY'05 FY'04 EPS (Diluted) 31.0c 27.7c 27.2c Dividend paid per share 10.0c 3.0c 5.0c Return on Shareholders' Funds1,2 28.2% 22.4% 27.6% Return on Capital Employed2 32.6% 23.6% 23.4% EBIT/ Sales (EBIT margin) 20.7% 16.2% 17.5% Gearing Ratio (3.8)% 6.8% 17.0% Net Interest Expense Cover 253.0x 38.5x 17.2x Net Interest Paid Cover 56.9x 18.3x 14.8x Net Debt Payback (0.1) years 0.2 years 0.6 years 1 Total company 2 Annualised |
| Asbestos-related compensation funding Russell Chenu, CFO |
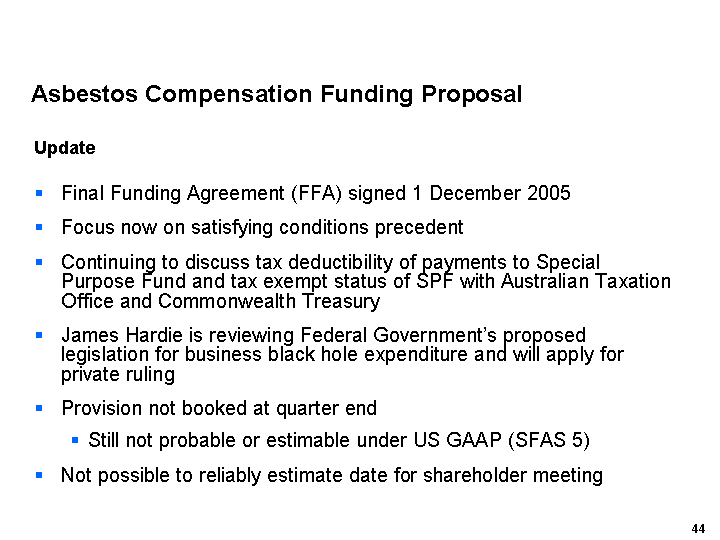
| Asbestos Compensation Funding Proposal Update Final Funding Agreement (FFA) signed 1 December 2005 Focus now on satisfying conditions precedent Continuing to discuss tax deductibility of payments to Special Purpose Fund and tax exempt status of SPF with Australian Taxation Office and Commonwealth Treasury James Hardie is reviewing Federal Government's proposed legislation for business black hole expenditure and will apply for private ruling Provision not booked at quarter end Still not probable or estimable under US GAAP (SFAS 5) Not possible to reliably estimate date for shareholder meeting |
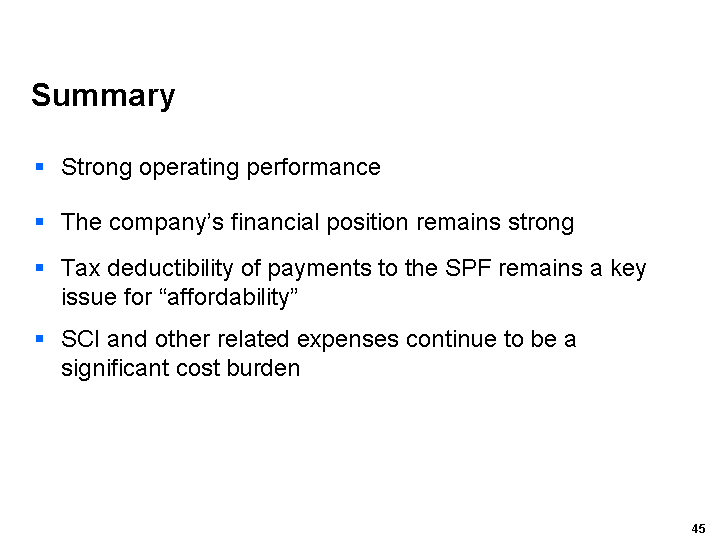
| Summary Strong operating performance The company's financial position remains strong Tax deductibility of payments to the SPF remains a key issue for "affordability" SCI and other related expenses continue to be a significant cost burden |

| Questions & Answers |
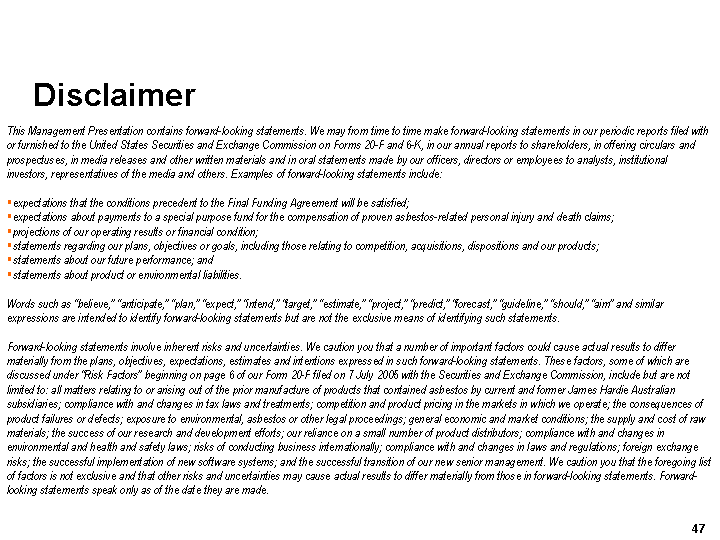
| Disclaimer This Management Presentation contains forward-looking statements. We may from time to time make forward-looking statements in our periodic reports filed with or furnished to the United States Securities and Exchange Commission on Forms 20-F and 6-K, in our annual reports to shareholders, in offering circulars and prospectuses, in media releases and other written materials and in oral statements made by our officers, directors or employees to analysts, institutional investors, representatives of the media and others. Examples of forward-looking statements include: expectations that the conditions precedent to the Final Funding Agreement will be satisfied; expectations about payments to a special purpose fund for the compensation of proven asbestos-related personal injury and death claims; projections of our operating results or financial condition; statements regarding our plans, objectives or goals, including those relating to competition, acquisitions, dispositions and our products; statements about our future performance; and statements about product or environmental liabilities. Words such as "believe," "anticipate," "plan," "expect," "intend," "target," "estimate," "project," "predict," "forecast," "guideline," "should," "aim" and similar expressions are intended to identify forward-looking statements but are not the exclusive means of identifying such statements. Forward-looking statements involve inherent risks and uncertainties. We caution you that a number of important factors could cause actual results to differ materially from the plans, objectives, expectations, estimates and intentions expressed in such forward-looking statements. These factors, some of which are discussed under "Risk Factors" beginning on page 6 of our Form 20-F filed on 7 July 2005 with the Securities and Exchange Commission, include but are not limited to: all matters relating to or arising out of the prior manufacture of products that contained asbestos by current and former James Hardie Australian subsidiaries; compliance with and changes in tax laws and treatments; competition and product pricing in the markets in which we operate; the consequences of product failures or defects; exposure to environmental, asbestos or other legal proceedings; general economic and market conditions; the supply and cost of raw materials; the success of our research and development efforts; our reliance on a small number of product distributors; compliance with and changes in environmental and health and safety laws; risks of conducting business internationally; compliance with and changes in laws and regulations; foreign exchange risks; the successful implementation of new software systems; and the successful transition of our new senior management. We caution you that the foregoing list of factors is not exclusive and that other risks and uncertainties may cause actual results to differ materially from those in forward-looking statements. Forward- looking statements speak only as of the date they are made. |
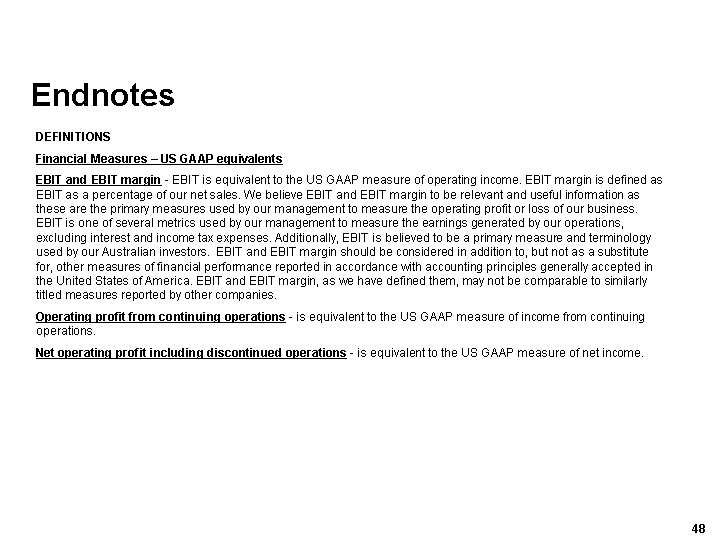
| Endnotes DEFINITIONS Financial Measures - US GAAP equivalents EBIT and EBIT margin - EBIT is equivalent to the US GAAP measure of operating income. EBIT margin is defined as EBIT as a percentage of our net sales. We believe EBIT and EBIT margin to be relevant and useful information as these are the primary measures used by our management to measure the operating profit or loss of our business. EBIT is one of several metrics used by our management to measure the earnings generated by our operations, excluding interest and income tax expenses. Additionally, EBIT is believed to be a primary measure and terminology used by our Australian investors. EBIT and EBIT margin should be considered in addition to, but not as a substitute for, other measures of financial performance reported in accordance with accounting principles generally accepted in the United States of America. EBIT and EBIT margin, as we have defined them, may not be comparable to similarly titled measures reported by other companies. Operating profit from continuing operations - is equivalent to the US GAAP measure of income from continuing operations. Net operating profit including discontinued operations - is equivalent to the US GAAP measure of net income. |
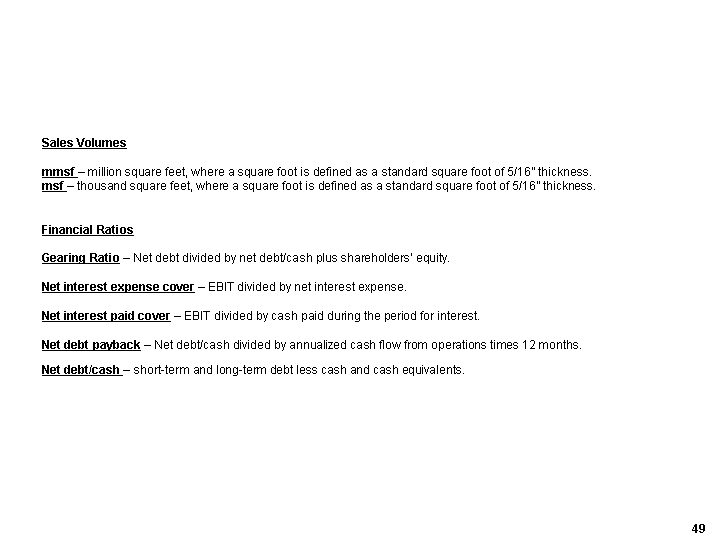
| Sales Volumes mmsf - million square feet, where a square foot is defined as a standard square foot of 5/16" thickness. msf - thousand square feet, where a square foot is defined as a standard square foot of 5/16" thickness. Financial Ratios Gearing Ratio - Net debt divided by net debt/cash plus shareholders' equity. Net interest expense cover - EBIT divided by net interest expense. Net interest paid cover - EBIT divided by cash paid during the period for interest. Net debt payback - Net debt/cash divided by annualized cash flow from operations times 12 months. Net debt/cash - short-term and long-term debt less cash and cash equivalents. |
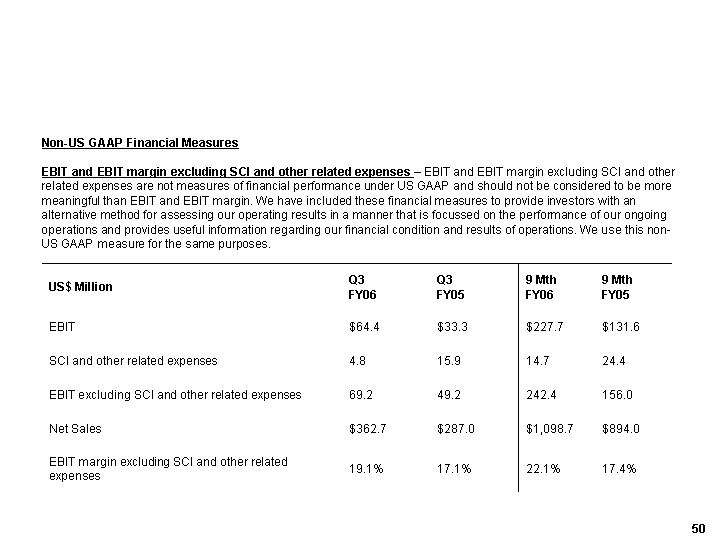
| Non-US GAAP Financial Measures EBIT and EBIT margin excluding SCI and other related expenses - EBIT and EBIT margin excluding SCI and other related expenses are not measures of financial performance under US GAAP and should not be considered to be more meaningful than EBIT and EBIT margin. We have included these financial measures to provide investors with an alternative method for assessing our operating results in a manner that is focussed on the performance of our ongoing operations and provides useful information regarding our financial condition and results of operations. We use this non- US GAAP measure for the same purposes. US$ Million Q3 FY06 Q3 FY05 9 Mth FY06 9 Mth FY05 EBIT $64.4 $33.3 $227.7 $131.6 SCI and other related expenses 4.8 15.9 14.7 24.4 EBIT excluding SCI and other related expenses 69.2 49.2 242.4 156.0 Net Sales $362.7 $287.0 $1,098.7 $894.0 EBIT margin excluding SCI and other related expenses 19.1% 17.1% 22.1% 17.4% |
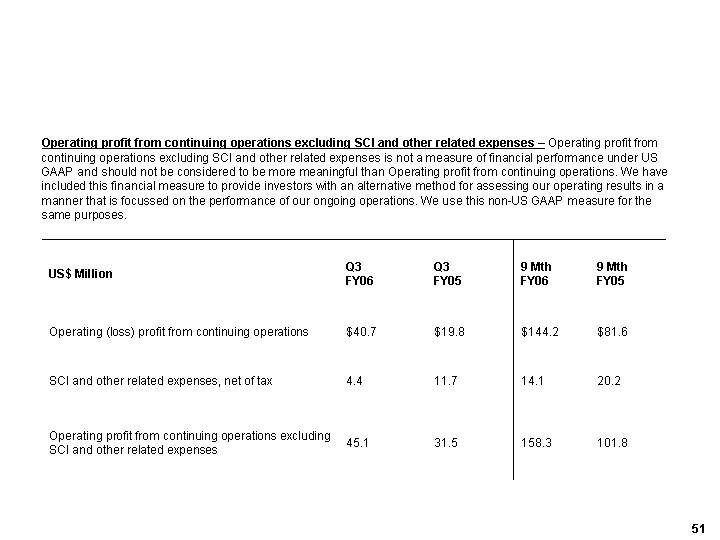
| Operating profit from continuing operations excluding SCI and other related expenses - Operating profit from continuing operations excluding SCI and other related expenses is not a measure of financial performance under US GAAP and should not be considered to be more meaningful than Operating profit from continuing operations. We have included this financial measure to provide investors with an alternative method for assessing our operating results in a manner that is focussed on the performance of our ongoing operations. We use this non-US GAAP measure for the same purposes. US$ Million Q3 FY06 Q3 FY05 9 Mth FY06 9 Mth FY05 Operating (loss) profit from continuing operations $40.7 $19.8 $144.2 $81.6 SCI and other related expenses, net of tax 4.4 11.7 14.1 20.2 Operating profit from continuing operations excluding SCI and other related expenses 45.1 31.5 158.3 101.8 |
| EBITDA - is not a measure of financial performance under US GAAP and should not be considered an alternative to, or more meaningful than, income from operations, net income or cash flows as defined by US GAAP or as a measure of our profitability or liquidity. Not all companies calculate EBITDA in the same manner as we have and, accordingly, EBITDA may not be comparable with other companies. We have included information concerning EBITDA because we believe that this data is commonly used by investors to evaluate the ability of a company's earnings from its core business operations to satisfy its debt, capital expenditure and working capital requirements. |