Exhibit 99.2

| Annual Information Meeting |
| CEO’s Address |
| Louis Gries |

| Results FY06 |
| Unless otherwise stated, results are for continuing operations only, and comparisons are for fiscal year 2006 versus the prior fiscal year . |

| Annual Information Meeting |
| CEO’s Address |
| Louis Gries |

| Results FY06 |
| Unless otherwise stated, results are for continuing operations only, and comparisons are for fiscal year 2006 versus the prior fiscal year . |
| Highlights- FY06 |
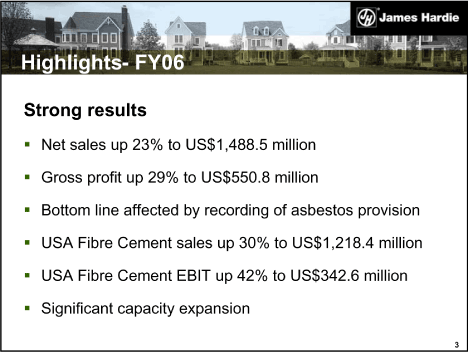
| Strong results |
| Net sales up 23% to US$1,488.5 million |
| Gross profit up 29% to US$550.8 million |
| Bottom line affected by recording of asbestos provision USA Fibre Cement sales up 30% to US$1,218.4 million USA Fibre Cement EBIT up 42% to US$342.6 million Significant capacity expansion |
| 3 |
| Exceeding Targets |
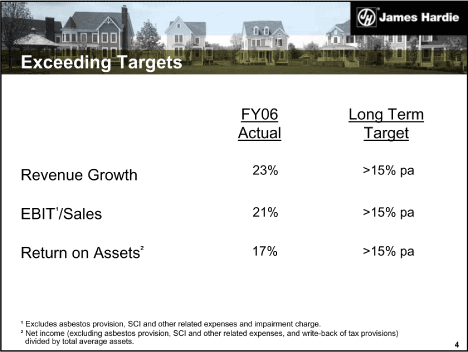
| FY06 Long Term Actual Target |
| Revenue Growth 23% >15% pa EBIT1/Sales 21% >15% pa Return on Assets2 17% >15% pa |
| 1 Excludes asbestos provision, SCI and other related expenses and impairment charge. 2 Net income (excluding asbestos provision, SCI and other related expenses, and write-back of tax provisions) divided by total average assets. 4 |
| USA Fibre Cement – FY06 |
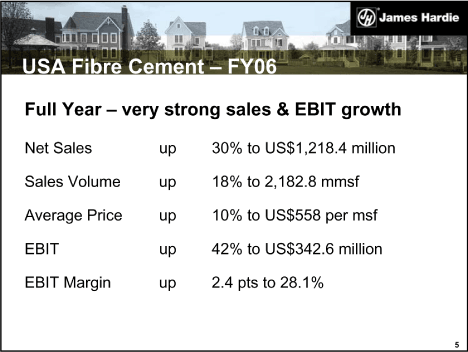
| Full Year – very strong sales & EBIT growth |
| Net Sales up 30% to US$1,218.4 million Sales Volume up 18% to 2,182.8 mmsf Average Price up 10% to US$558 per msf EBIT up 42% to US$342.6 million EBIT Margin up 2.4 pts to 28.1% |
| 5 |
| USA Fibre Cement |
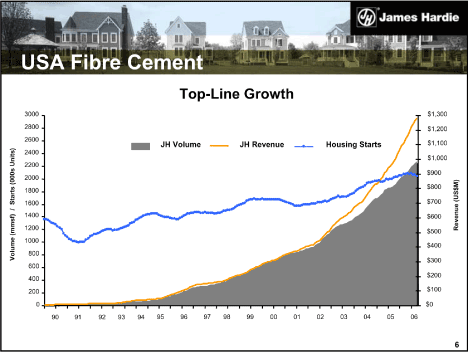
| Top-Line Growth |
| 3000 $1,300 2800 $1,200 2600 |
| JH Volume JH Revenue Housing Starts $1,100 2400 $1,000 2200 $900 2000 $800 1800 (US$M) Starts (000s Units) 1600 $700 |
| / Revenue (mmsf) 1400 $600 1200 $500 Volume 1000 $400 800 $300 600 $200 400 200 $100 0 $0 90 91 92 93 94 95 96 97 98 99 00 01 02 03 04 05 06 |
| 6 |
| USA Fibre Cement |
| Key Points |
| Continuing sales growth in both emerging and established markets Sales of both interior and exterior products growing strongly Continued market penetration against alternative materials Sales growth in higher-priced differentiated products ColorPlusTM strategy continuing to progress well Completed construction of new paint line at Blandon, Pennsylvania Completed construction of line 1 at new plant in Pulaski, Virginia –commercial production in April |
| 7 |
| Asia Pacific Fibre Cement – FY06 |
| Full Year Results |
| Net Sales up 2% to US$241.8 million Sales Volume down 2% to 368.3 mmsf EBIT down 11% to US$41.7 million EBIT Margin down 2.6 pts to 17.2% |
| 8 |

| Asia Pacific Fibre Cement – FY06 |
| Australia and New Zealand – Key Points |
| New housing and renovation activity continued to weaken in both Australia and New Zealand Sales volumes and market share increased Regaining momentum in commercial sector lost through last year’s bans and boycotts Net sales up slightly to US$51.1m, up 6% in A$ EBIT down 18% due to higher costs – mainly manufacturing and freight Sales up 4%, EBIT down 8% due to higher costs |
| 9 |
| Asia Pacific Fibre Cement – FY06 |
| Philippines — Key Points |
| Domestic demand affected by weaker economic conditions and slowdown in building construction activity |
| Net sales down 9% full year |
| EBIT positive for the year |
| 10 |
| Other – FY06 |
| USA Hardie Pipe — Key Points |
| Both residential and non-residential construction activity remained buoyant in Florida |
| Market share gains |
| Manufacturing performance improvements |
| Reduced EBIT loss |
| 11 |
| Other – FY06 |
| Europe Fibre Cement |
| Sales building steadily |
| Continuing to expand distribution channels |
| Artisan™ Roofing |
| Ceased market development initiatives |
| Review of market testing results concluded greater shareholder value created by focusing investment elsewhere Pilot plant closed – asset impairment charge of US$13.4m in fiscal year 2006 |
| 12 |
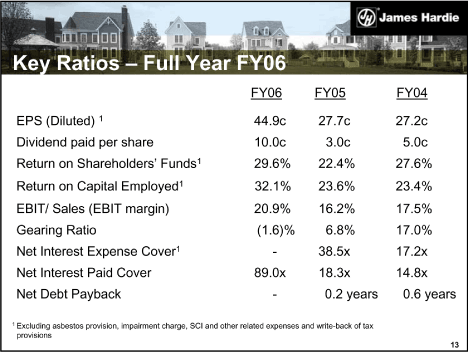
| Key Ratios – Full Year FY06 |
| FY06 FY05 FY04 |
| EPS (Diluted) 1 44.9c 27.7c 27.2c Dividend paid per share 10.0c 3.0c 5.0c Return on Shareholders’ Funds1 29.6% 22.4% 27.6% Return on Capital Employed1 32.1% 23.6% 23.4% EBIT/ Sales (EBIT margin) 20.9% 16.2% 17.5% Gearing Ratio (1.6)% 6.8% 17.0% Net Interest Expense Cover1 — 38.5x 17.2x Net Interest Paid Cover 89.0x 18.3x 14.8x Net Debt Payback — 0.2 years 0.6 years |
| 1 Excluding asbestos provision, impairment charge, SCI and other related expenses and write-back of tax provisions |
| 13 |
| Results Q1 FY07 |
| Unless otherwise stated, results are for continuing operations only, and comparisons are for the fiscal year 2006 versus the prior fiscal year. |
| Overview — Q1 FY07 |
| Operating Results |
| USA Fibre Cement – strong sales and EBIT growth Asia Pacific Fibre Cement |
| Australia and New Zealand – volumes up slightly despite weaker market, but EBIT down Philippines – EBIT positive USA Hardie Pipe – first quarterly positive EBIT result Strong cashflow generation |
| 15 |
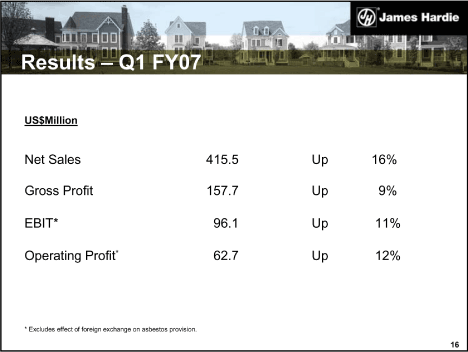
| Results – Q1 FY07 |
| US$Million |
| Net Sales 415.5 Up 16% Gross Profit 157.7 Up 9% EBIT* 96.1 Up 11% Operating Profit* 62.7 Up 12% |
| * Excludes effect of foreign exchange on asbestos provision. |
| 16 |
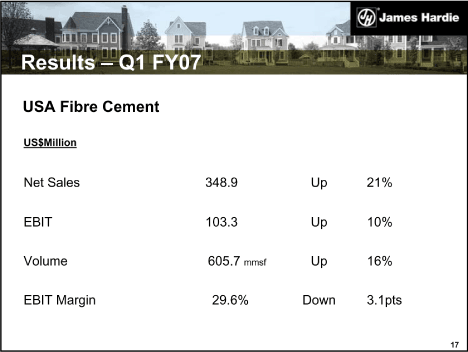
| Results – Q1 FY07 |
| USA Fibre Cement |
| US$Million |
| Net Sales 348.9 Up 21% EBIT 103.3 Up 10% Volume 605.7 mmsf Up 16% EBIT Margin 29.6% Down 3.1pts |
| 17 |
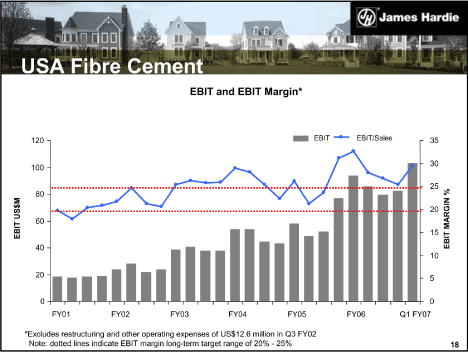
| USA Fibre Cement |
| EBIT and EBIT Margin* |
| 120 EBIT EBIT/Sales 35 |
| 30 100 |
| 25 |
| 80 % MARGIN |
| 20 60 |
| EBIT US$M 15 EBIT |
| 40 |
| 10 |
| 20 5 0 0 FY01 FY02 FY03 FY04 FY05 FY06 Q1 FY07 |
| *Excludes restructuring and other operating expenses of US$12.6 million in Q3 FY02 |
| Note: dotted lines indicate EBIT margin long-term target range of 20% — 25% 18 |
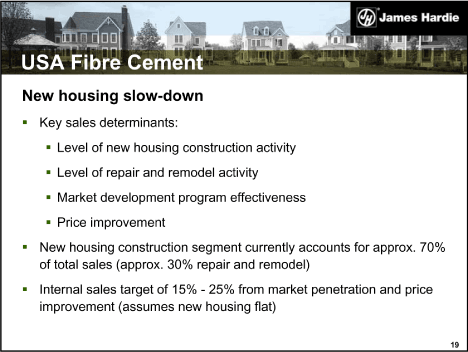
| USA Fibre Cement |
| New housing slow-down |
| Key sales determinants: |
| Level of new housing construction activity Level of repair and remodel activity Market development program effectiveness Price improvement |
| New housing construction segment currently accounts for approx. 70% of total sales (approx. 30% repair and remodel) Internal sales target of 15% — 25% from market penetration and price improvement (assumes new housing flat) |
| 19 |
| USA Fibre Cement |
| New housing slow-down (continued) |
| Largest sales regions: |
| South Central, South East and Pacific North West |
| Business considerations: |
| timing of capacity expansion, cost containment and efficiency improvements |
| 20 |
| Results – Q1 FY07 |
| Other Businesses |
| ANZ volumes slightly up, EBIT margin 16.7% Philippines sales up 2%, EBIT positive USA Hardie Pipe – first EBIT positive quarter Europe – EBIT negative, as expected |
| 21 |
| Outlook |
| USA Fibre Cement |
| New housing construction to continue to slow |
| Q1 revenue and volumes very strong, but housing slow-down expected to impact Q2 volumes – this is happening |
| Expect to continue outperforming housing market |
| Repair and remodelling activity to remain stable |
| No change to earnings guidance at Q1 (current forecast is for NPAT excluding asbestos related costs to fall within analysts’ range at Q1 of US$207m to US$247m) |
| 22 |
| Outlook (continued) |
| Asia Pacific Fibre Cement |
| No material improvement to market conditions in Asia Pacific businesses expected in short-term |
| Company |
| SCI and other related expenses to continue until FFA finalised |
| Future reported earnings subject to volatility related impact of currency exchange fluctuations on asbestos liability |
| 23 |
| Understanding our Sustainable Competitive Advantage |
| Unique Technology and Scale |
| Unique plant engineering and proprietary process technology and product formulations – significant investment in R&D |
| Superior capital cost efficiency Low cost manufacturer |
| Only national producer of fibre cement in each key market Excellent plant economies of scale – plants 2-3 times larger than fibre cement competitors Unique differentiated products, widest range and strong brands |
| 25 |
| Focus |
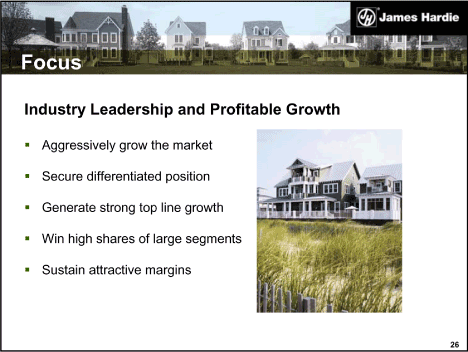
| Industry Leadership and Profitable Growth |
| Aggressively grow the market Secure differentiated position Generate strong top line growth Win high shares of large segments Sustain attractive margins |
| 26 |
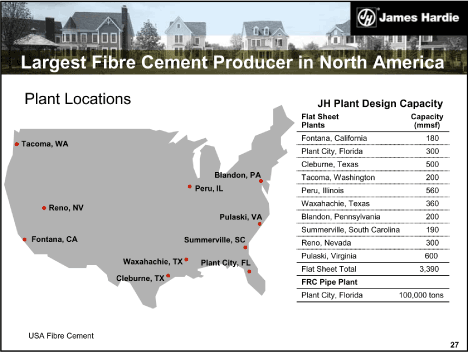
| Largest Fibre Cement Producer in North America |
| Plant Locations JH Plant Design Capacity |
| Flat Sheet Capacity Plants(mmsf) |
| Fontana, California 180 z Tacoma, WA |
| Plant City, Florida 300 Cleburne, Texas 500 Blandon, PA Tacoma, Washington 200 z z Peru, IL |
| Peru, Illinois 560 Waxahachie, Texas 360 z Reno, NV |
| Pulaski, VA Blandon, Pennsylvania 200 z |
| Summerville, South Carolina 190 z Fontana, CA Summerville, SC Reno, Nevada 300 z |
| Pulaski, Virginia 600 Waxahachie, TX z Plant City, FL z Flat Sheet Total 3,390 |
| Cleburne, TX z |
| FRC Pipe Plant |
| Plant City, Florida 100,000 tons |
| USA Fibre Cement |
| 27 |
| Revenue Growth Streams |
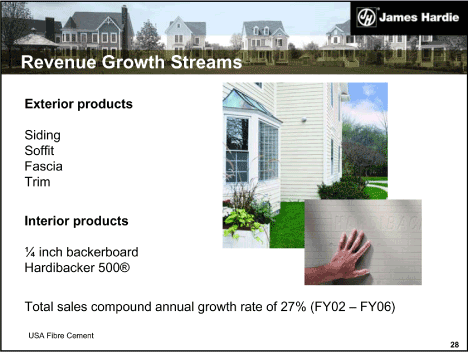
| Exterior products |
| Siding Soffit Fascia Trim |
| Interior products |
| 1/4 inch backerboard Hardibacker 500® |
| Total sales compound annual growth rate of 27% (FY02 – FY06) |
| USA Fibre Cement |
| 28 |
| Growth In Revenue Per Employee |
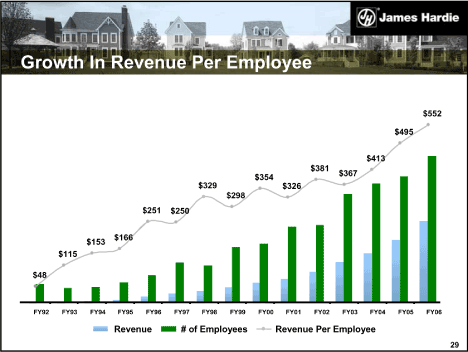
| $552 |
| $495 |
| $413 $381 $367 $354 $329 $326 $298 $251 $250 |
| $166 $153 $115 |
| $48 |
| FY92 FY93 FY94 FY95 FY96 FY97 FY98 FY99 FY00 FY01 FY02 FY03 FY04 FY05 FY06 |
| Revenue # of Employees Revenue Per Employee |
| 29 |
| Long Term Financial Targets |
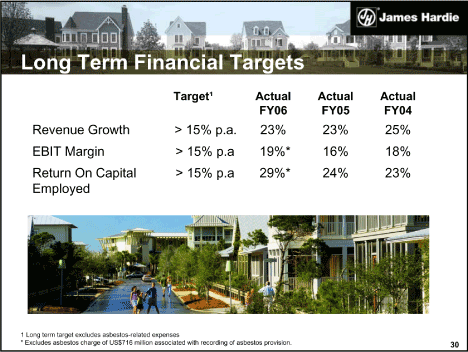
| Target 1 Actual Actual Actual FY06 FY05 FY04 |
| Revenue Growth > 15% p.a. 23% 23% 25% EBIT Margin > 15% p.a 19%* 16% 18% Return On Capital > 15% p.a 29%* 24% 23% Employed |
| 1 Long term target excludes asbestos-related expenses |
| * Excludes asbestos charge of US$716 million associated with recording of asbestos provision. 30 |
| Annual Information Meeting |
| Asbestos-related compensation progress |
| Asbestos Update |
| Progress made but slower than expected |
| All proven claims continue to be paid by MRCF |
| Company recorded a net provision of US$716m (A$1 billion) at 31 March 2006 – “probable and estimable” under US GAAP (provision based on KPMG Actuaries’ estimate) |
| Net provision adjusted to US$742m (A$1 billion) at 30 June 2006 due to foreign exchange (US$27m charge to P&L) |
| 23 June 2006, ATO declined to endorse SPF as tax concession charity (condition precedent to Final Funding Agreement (FFA) |
| 29 June 2006, ATO ruled contributions from James Hardie to SPF deductible over life of fund in accordance with ‘black hole expenditure’ legislation |
| Tax exempt status of SPF remains critical for affordability and long term viability of proposed long-term voluntary funding arrangement |
| 32 |
| Asbestos Update (continued) |
| There have been ongoing discussions with ATO and NSW Government on tax treatment of SPF since adverse ATO decision in June |
| Currently discussing potential and limited amendments to FFA with NSW Government – objective is satisfactory outcome for all stakeholders to FFA |
| Requires fresh binding rulings from ATO |
| Both NSW Government and ATO co-operative – ATO to treat rulings as a priority |
| If satisfactory outcome achieved, shareholder meeting to be held around 10 weeks from agreement being reached |
| Company remains committed to completing as fast as possible – already well advanced on satisfying other remaining conditions precedent: Independent Expert’s Report; Explanatory Memorandum; discussions with lenders; and updated actuarial report Have begun considering options for interim funding to MRCF should it be required |
| 33 |
| Summary |
| We have a strong, well-established, high-growth and high-return business We have sustainable competitive advantage Our model for continued growth is based on: |
| Large market opportunity Superior value proposition |
| Proprietary and/or protected technology Large upsides due to current R&D investments Significant organisational advantages Focussed strategy and organisational effort Scale |
| The company is in a sound financial position |
| Accounting results subject to volatility – foreign exchange impact on A$ asbestos provision |
| 34 |

| Annual Information Meeting |
| Endnotes |
| DEFINITIONS |
| Financial Measures – US GAAP equivalents |
| EBIT and EBIT margin – EBIT is equivalent to the US GAAP measure of operating income. EBIT margin is defined as EBIT as a percentage of net sales. James Hardie believes EBIT and EBIT margin to be relevant and useful information as these are the primary measures used by management to measure the operating profit or loss of its business. EBIT is one of several metrics used by management to measure the earnings generated by the company’s operations, excluding interest and income tax expenses. Additionally, EBIT is believed to be a primary measure and terminology used by its Australian investors. EBIT and EBIT margin should be considered in addition to, but not as a substitute for, other measures of financial performance reported in accordance with accounting principles generally accepted in the United States of America. EBIT and EBIT margin, as the company has defined them, may not be comparable to similarly titled measures reported by other companies. |
| Operating Profit – is equivalent to the US GAAP measure of income. Net Operating Profit – is equivalent to the US GAAP measure of net income. |
| SALES VOLUMES mmsf – million square feet, where a square foot is defined as a standard square foot of 5/16” thickness. msf – thousand square feet, where a square foot is defined as a standard square foot of 5/16” thickness. |
| FINANCIAL RATIOS |
| Net interest expense cover – EBIT divided by net interest expense. |
| Net interest paid cover – EBIT divided by cash paid during the period for interest, net of amounts capitalised. Net debt payback – Net debt/cash divided by cash flow from operations. |
| 36 |
| NON-US GAAP FINANCIAL MEASURES |
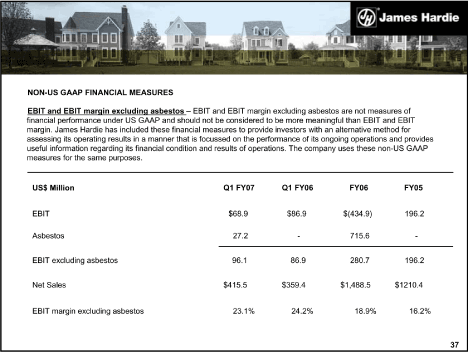
| EBIT and EBIT margin excluding asbestos – EBIT and EBIT margin excluding asbestos are not measures of financial performance under US GAAP and should not be considered to be more meaningful than EBIT and EBIT margin. James Hardie has included these financial measures to provide investors with an alternative method for assessing its operating results in a manner that is focussed on the performance of its ongoing operations and provides useful information regarding its financial condition and results of operations. The company uses these non-US GAAP measures for the same purposes. |
| US$ Million Q1 FY07 Q1 FY06 FY06 FY05 |
| EBIT $68.9 $86.9 $(434.9) 196.2 Asbestos 27.2 — 715.6 -EBIT excluding asbestos 96.1 86.9 280.7 196.2 Net Sales $415.5 $359.4 $1,488.5 $1210.4 EBIT margin excluding asbestos 23.1% 24.2% 18.9% 16.2% |
| 37 |
| Disclaimer |
| This Management Presentation contains forward-looking statements. James Hardie may from time to time make forward-looking statements in its periodic reports filed with or furnished to the United States Securities and Exchange Commission on Forms 20-F and 6-K, in the annual reports to shareholders, in offering circulars and prospectuses, in media releases and other written materials and in oral statements made by the company’s officers, directors or employees to analysts, institutional investors, representatives of the media and others. Examples of forward-looking statements include: |
| expectations that the conditions precedent to the Final Funding Agreement will be satisfied; |
| expectations about payments to a special purpose fund for the compensation of proven asbestos-related personal injury and death claims; expectations concerning the company’s Australian Tax Office amended assessment; expectations that the company’s credit facilities will be extended or renewed; projections of operating results or financial condition; statements regarding plans, objectives or goals, including those relating to competition, acquisitions, dispositions and products; statements about future performance; and statements about product or environmental liabilities. |
| Words such as “believe,” “anticipate,” “plan,” “expect,” “intend,” “target,” “estimate,” “project,” “predict,” “forecast,” “guideline,” “should,” “aim” and similar expressions are intended to identify forward-looking statements but are not the exclusive means of identifying such statements. |
| Forward-looking statements involve inherent risks and uncertainties. The company cautions that a number of important factors could cause actual results to differ materially from the plans, objectives, expectations, estimates and intentions expressed in such forward-looking statements. These factors include, but are not limited to, the risk factors discussed under “Risk Factors” beginning on page 6 of the Form 20-F filed on 7 July 2005, and: all matters relating to or arising out of the prior manufacture of products that contained asbestos by current and former James Hardie subsidiaries; compliance with and changes in tax laws and treatments; competition and product pricing in the markets in which the company operates; the consequences of product failures or defects; exposure to environmental, asbestos or other legal proceedings; general economic and market conditions; the supply and cost of raw materials; the success of research and development efforts; reliance on a small number of product distributors; compliance with and changes in environmental and health and safety laws; risks of conducting business internationally; compliance with and changes in laws and regulations; foreign exchange risks; the successful implementation of new software systems and the successful implementation of the internal control over financial reporting requirements of Section 404 of the Sarbanes-Oxley Act of 2002, as codified by Item 308 of Regulation S-K . The company cautions that the foregoing list of factors is not exclusive and that other risks and uncertainties may cause actual results to differ materially from those in forward-looking statements. Forward-looking statements speak only as of the date they are made. |
| 38 |