Exhibit 99.5
()
()
Australian Information Meeting Louis Gries, CEO 15 August 2007 Text            Agenda            goes here Presentation Outline FY07 Results Overview Q1 FY08 Results Overview — released today Organisational Focus Corporate Issues and Challenges Summary


()
()
FY07 — Results Overview Very solid net operating profit Very solid net operating profit excluding asbestos adjustments, particularly given weaker markets in the US, Australia and New Zealand % US$ Million FY07 FY06 Change Net operating profit (loss) 151.7 (506.7) - Net operating profit excluding asbestos adjustments and tax benefit 222.2 208.9 6 related to asbestos adjustments Net operating profit excluding asbestos adjustments, tax benefit related to asbestos adjustments, impairment charge, SCI and other 230.0 212.7 8 related expenses, make-whole payment and tax provision write-back


()
()
FY07 — Results Overview Operating performance USA Fibre Cement — strong operating performance with both sales and EBIT up in a significantly weaker US housing market, especially in the 2nd half Asia Pacific Fibre Cement — sales up, but EBIT lower due to higher manufacturing costs Strong operating cash flows FY07 — Results Overview USA Fibre Cement — weaker housing market Net Sales up 4% to US$1,262.3 million Sales Volume down 2% to 2,148.0 mmsf Average Price up 5% to US$588 per msf EBIT up 6% to US$362.4 million EBIT Margin up 0.6 pt to 28.7%


()
()
FY07 — Results Overview USA Fibre Cement — Key Points Housing market weakened significantly, particularly in 2nd half Sales of exterior products affected most by weaker market Healthy repair and remodel market helped buoy sales of interior products Market penetration and price growth helped buffer impact of weaker housing market EBIT margin above long-term target range of 20% — 25% FY07 — Results Overview USA Fibre Cement — Business Re-set Re-set late 2006/early 2007 in anticipation of weaker housing market Included: Production re-scheduling to balance supply and demand Sales and marketing activities reviewed and re-allocated based on lower market opportunity Corporate wide review undertaken of cost saving opportunities Assisted in delivery of solid operating performance despite weaker market Able to ‘flex up’ quickly if needed


()
()
Text            Agenda            goes here FY07 — Results Overview USA Fibre Cement — growing revenue per employee FY07 — Results Overview Asia Pacific Fibre Cement — weaker housing markets Net Sales up 4% to US$251.7 million Sales Volume up 6% to 390.8 mmsf EBIT down 6% to US$39.4 million EBIT Margin down 1.5 pts to 15.7% Growing demand for fibre cement through new, value-added, differentiated products


()
()
FY07 — Results Overview USA Hardie Pipe Net sales higher due to increased sales volumes and higher average sales price EBIT positive Europe Fibre Cement Sales continuing to grow steadily FY07 — Results Overview Long-Term Targets FY07 3-year Long-Term Actual Average Target Revenue Growth 4% 17% >15% pa EBIT1/Sales 22% 20% >15% pa Return on Capital Employed2 28% 29% >15% pa Net Debt Payback3 1.9 years <5 years Net Interest Expense Cover1 51.2 times >3 times 1 Excludes asbestos adjustments, impairment charge and SCI and other related expenses
2 EBIT (excluding asbestos adjustments, impairment charge and SCI and other related expenses) divided by gross capital employed (excluding asbestos-related assets and liabilities) 3 Excluding payments under the Amended FFA


()
()
Q1 FY08 — Results Overview Strong operating performance despite further weakness in major markets Net operating profit affected by asbestos (mostly related to stronger A$) Q1 Q1 % US$ Million FY08 FY07 Change Net operating profit 39.1 35.5 10 Net operating profit excluding asbestos 68.6 62.7 9 Diluted earnings per share, excluding asbestos (US cents) 14.6 13.4 9


()
()
Q1 FY08 — Results Overview Strong operating performance USA Fibre Cement — improved market penetration, price growth and cost management helped deliver a very strong EBIT result despite further weakness in US housing Asia Pacific Fibre Cement — both sales and EBIT up despite weak Australian and New Zealand housing and renovation markets Business continued to generate strong operating cash flows Q1 FY08 — Results Overview USA Fibre Cement — Outperforming housing market Net Sales down 1% to US$346.1 million Sales Volume down 5% to 573.4 mmsf Average Price up 5% to US$604 per msf EBIT up 11% to US$114.4 million EBIT Margin up 3.5 pts to 33.1%


()
()
Q1 FY08 — Results Overview USA Fibre Cement — Market Conditions Further weakness in new housing construction activity Starts down 22% and 31% for June and March quarters, respectively Market demand affected by affordability issues: Higher interest rates Tighter lending standards (related to subprime mortgage concerns) Inventory levels of new homes for sale are very high Builder confidence levels very low Some softening in repair and remodelling activity Q1 FY08 — Results Overview USA Fibre Cement — Key Points Impact of weaker housing market on sales largely offset by: Seasonal order build in anticipation of improved housing demand Market penetration Higher average net sales price Sales volumes of exterior products were lower in Southern and Northern Divisions, but higher in Western Division Sales of interior products were flat Higher raw material prices Margin improvement


()
()
Q1 FY08 — Results Overview Q1 FY08 — Results Overview


()
()
Q1 FY08 — Results Overview Q1 FY08 — Results Overview Asia Pacific Fibre Cement Net Sales up 20% to US$71.2 million Sales Volume up 7% to 98.0 mmsf EBIT up 20% to US$12.4 million EBIT Margin flat 17.4%


()
()
Q1 FY08 — Results Overview Asia Pacific Fibre Cement — Key Points Further weakness in new housing and renovations activity in Australia, flat in New Zealand and slightly stronger construction activity in the Philippines Net sales up 8% in A$; volumes up 7% due to market share gains; and average sales price up 1% In Australia, growth in fibre cement segment through sales of Scyon™ range of products. Non-differentiated products remain subject to strong competitive pressures In New Zealand, sales of Linea® weatherboards continued to drive market share growth In the Philippines, increased construction activity and stronger export demand Q1 FY08 — Results Overview Share Buy-back Announced On market buy-back program will be implemented Part of program to improve efficiency of our capital structure Up to 10% of issued capital (up to approximately 46.8 million shares) Shares to be purchased opportunistically, subject to market conditions and operating environment Additional funding facilities will be sought as required No time period for buy-back has been set


()
()
Organisational Focus USA Fibre Cement Aggressively grow demand for our products in our targeted markets Grow our overall market position and share in existing markets while defending share in existing market segments Offer products with superior value to that of our competitors introducing differentiated products Manage and execute strategic initiatives effectively Accelerate primary demand growth


()
()
Organisational Focus USA Fibre Cement — Future Growth Job 1 Deliver terminal share in current USA Fibre Cement business Job 2 Extend the current business model in the US (eg new products, new markets) Job 3 Bolt-on acquisition opportunity in the US? Technology track outside of fibre cement? Geography spread outside the US? Organisational Focus


()
()
Organisational Focus Asia Pacific Fibre Cement Grow primary demand for our products Leverage our superior technology to offer differentiated products and systems with superior value to those of competitors Promote a smarter way to build composite construction houses using our products Vigorously defend our position in existing market segments Organisational Focus Product Leadership Continued investment in new product development and commercialisation Value-added, differentiated products Benefits: Grow the fibre cement category Grow revenue Sustain good margins Defend and strengthen our competitive position


()
()
Organisational Focus Product Leadership — examples USA Fibre Cement: ColorPlus® Collection (pre-painted siding and trim): Driving growth against vinyl in Northern Division Launched in Western and Southern Divisions FY07 Organisational Focus Product Leadership — examples USA Fibre Cement: ArtisanTM Lap (thicker siding, provides distinctive shadow lines) premium product currently being launched in Atlanta wider launch in 2008


()
()
Organisational Focus Product Leadership — examples Asia Pacific Fibre Cement ScyonTM range of value-added, differentiated products launched 2007 Organisational Focus US Product Mix Product mix will evolve significantly in the medium term to continue to drive revenue and leverage market position.


()
()
Corporate Issues and Challenges Corporate Issues and Challenges The company continues to focus on the effective management of a number of corporate matters, including: Ongoing compliance with Amended Final Funding Agreement (received shareholder approval February 2007): Asbestos compensation funding; Medical research and asbestos education funding Unfortunately, company’s financial results are affected by movements in exchange rate between A$ and US$ (asbestos liability in A$ — company reports in US$) Challenging an amended ATO assessment on RCI (subsidiary company) in respect of its 1999 tax return ASIC proceedings associated with the establishment of the Medical Research and Compensation Foundation in 2001


()
()
Summary 
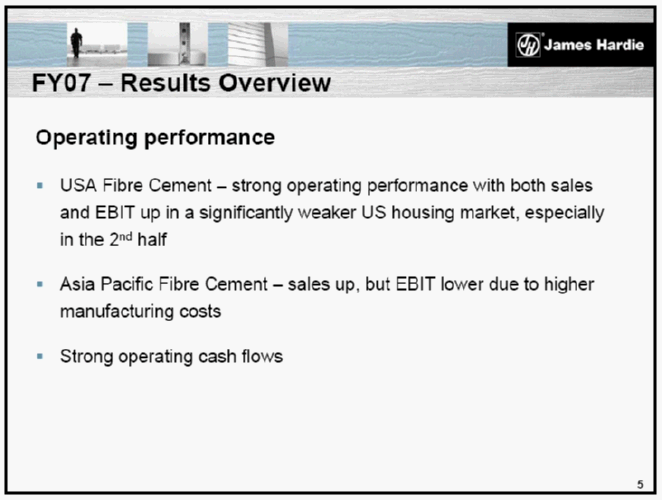
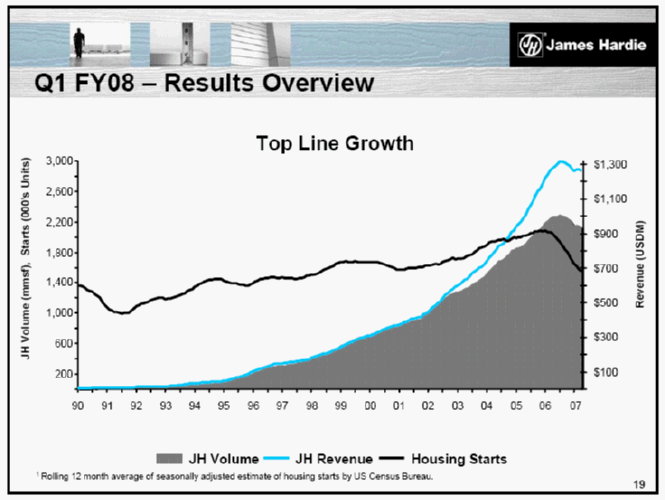
Our operations have performed very well despite weaker housing markets 
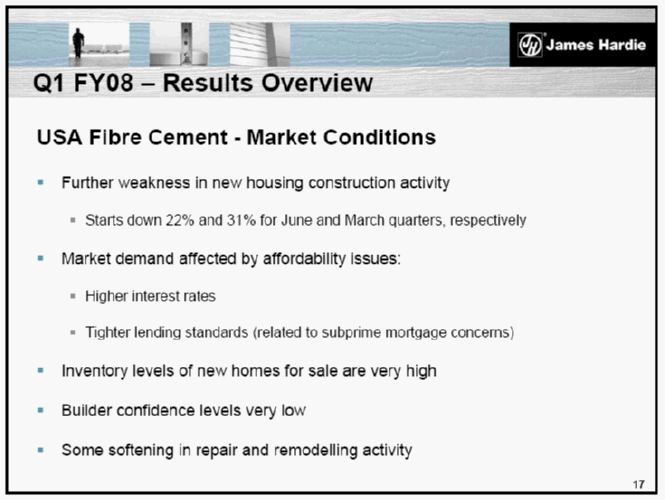
The short-term outlook is for some further housing market weakness in the US and Australia 
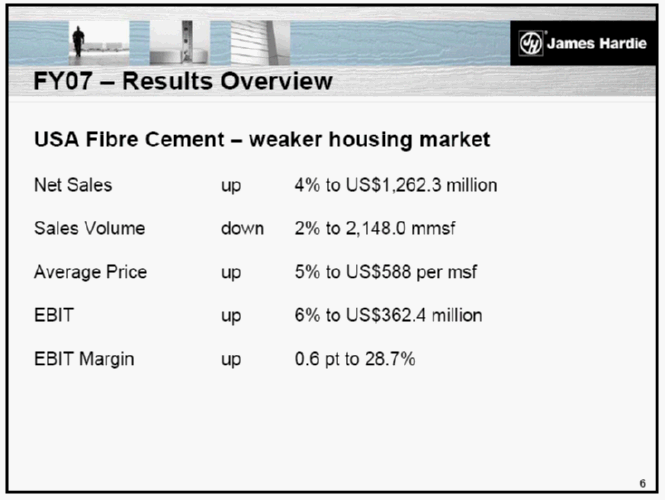
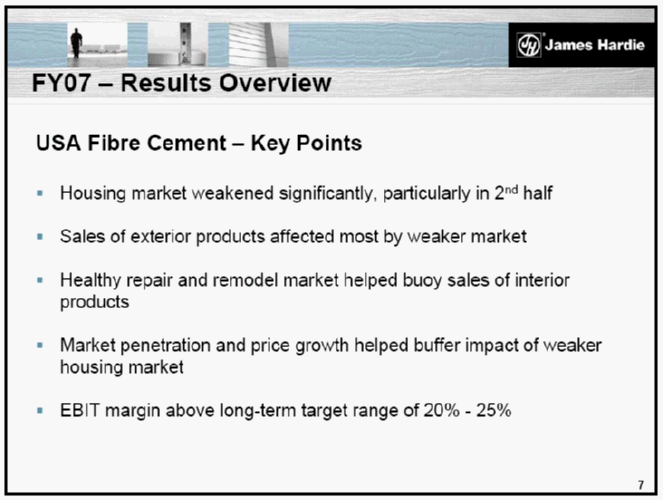
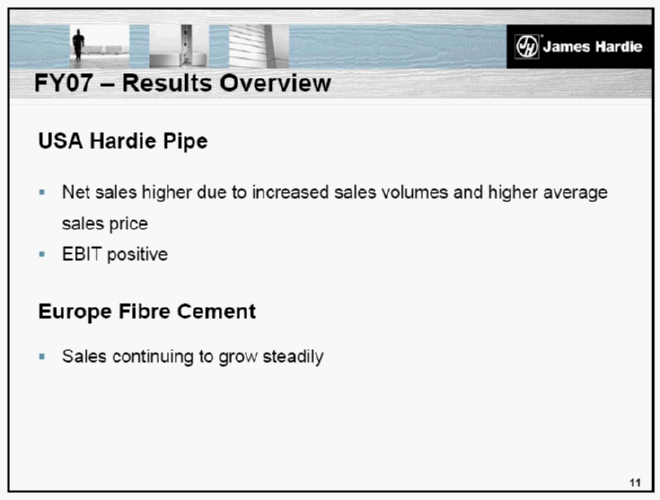
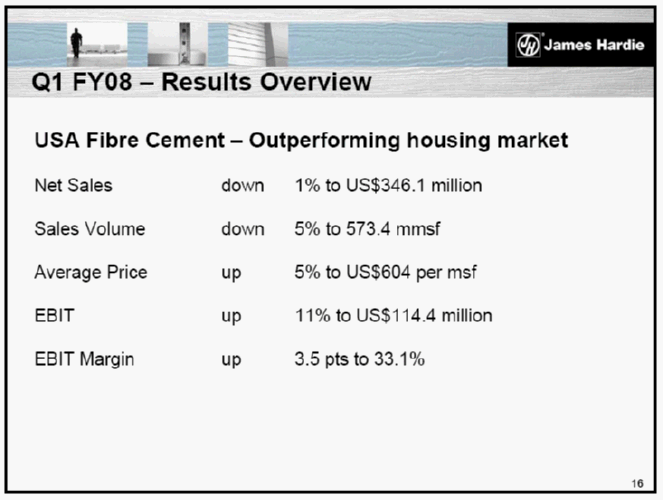
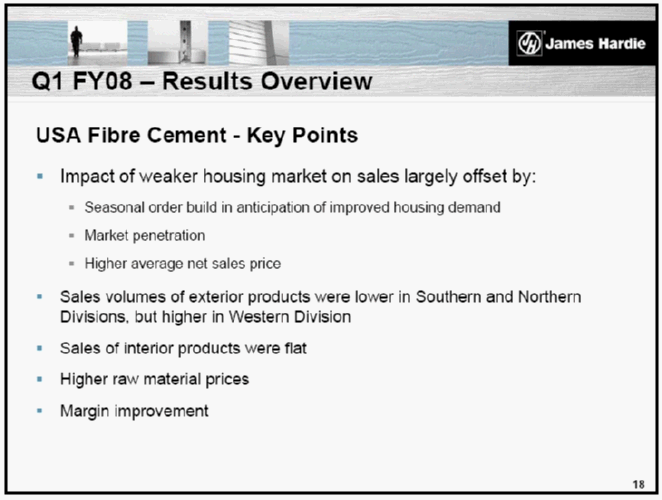
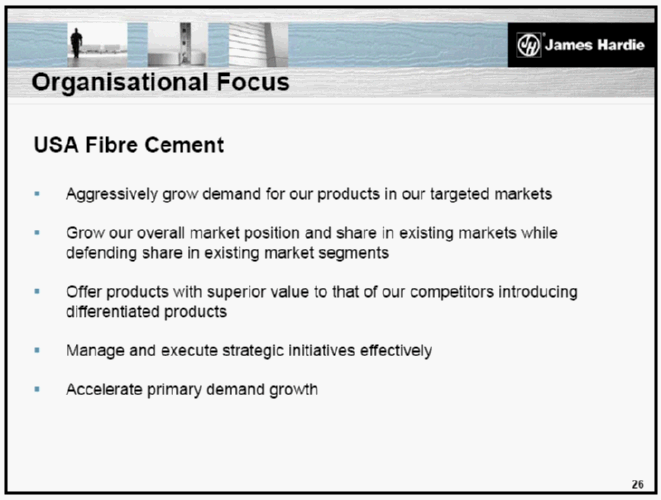
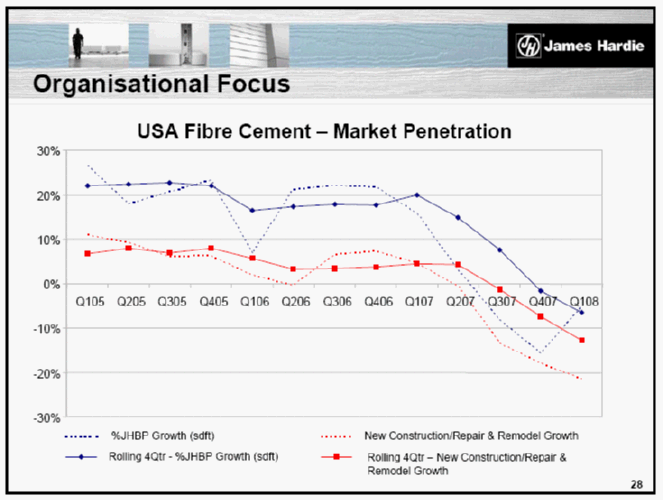
In the US, we remain focussed on continuing to outperform the market overall and are well positioned through our market initiatives to further increase market share 
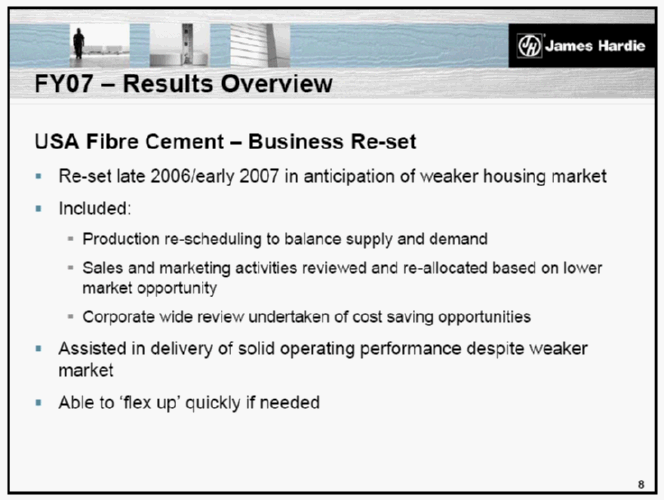
From a cost perspective, we also remain well positioned in the US through the business re-set carried out in FY07 
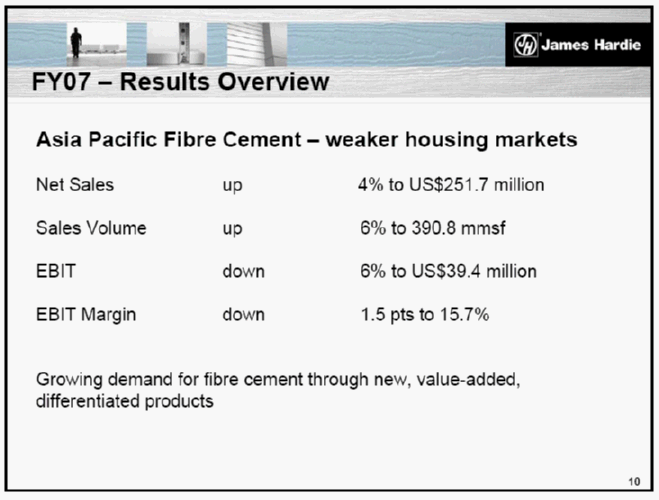
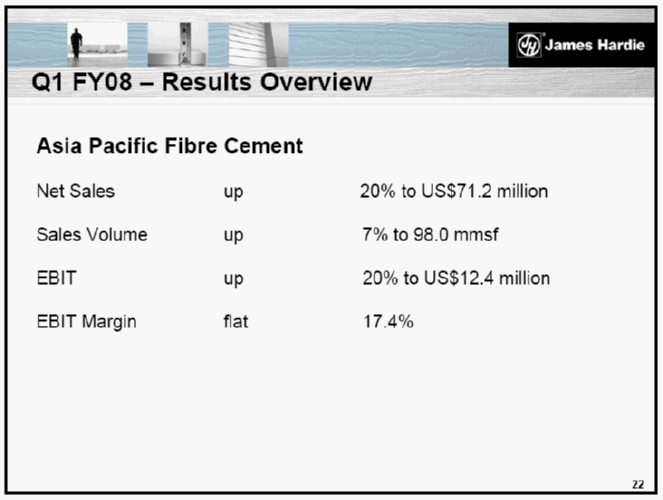
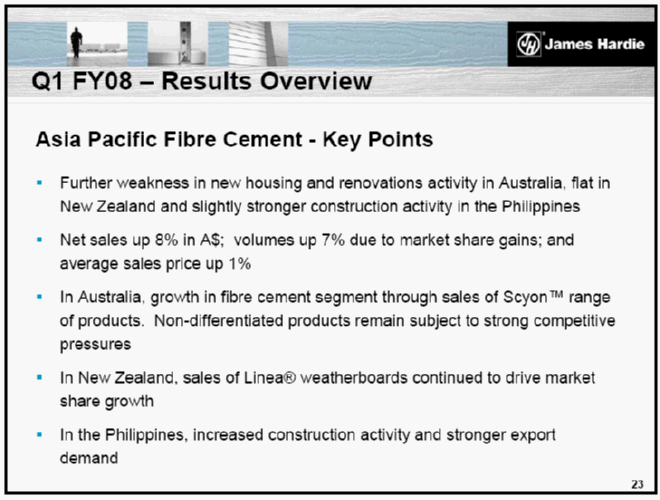
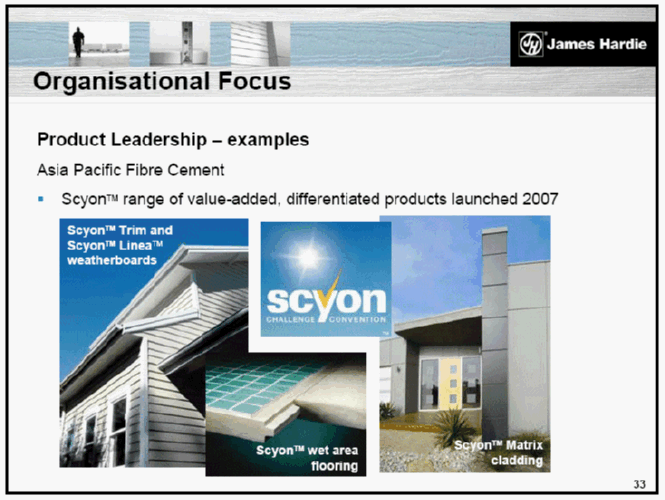
In Australia and New Zealand, our value-added, differentiated products are growing the fibre cement segment 
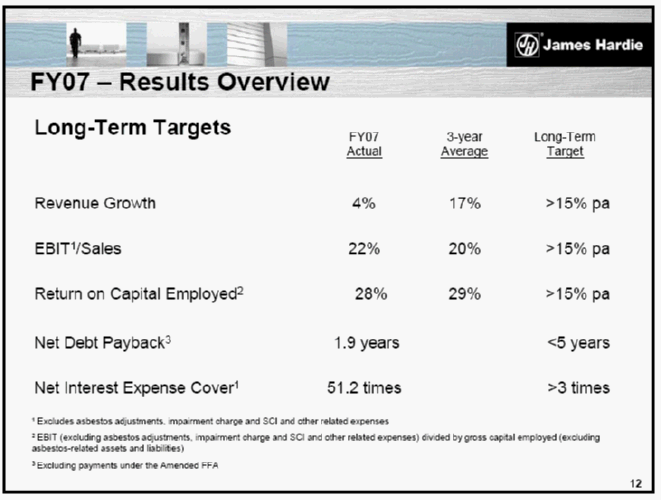
We have generated strong cash flows and our balance sheet remains very strong 
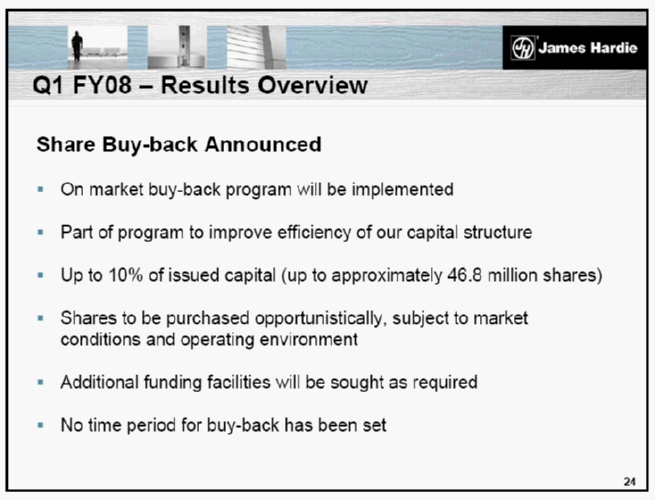
The share buy-back announced today and the higher dividend for FY07 reflect the company’s desire to improve the efficiency of its capital structure Disclaimer This Management Presentation contains forward-looking statements. We may from time to time make forward-looking statements in our periodic reports filed with or furnished to the United States Securities and Exchange Commission on Forms 20-F and 6-K, in our annual reports to shareholders, in offering circulars and prospectuses, in media releases and other written materials and in oral statements made by our officers, directors or employees to analysts, institutional investors, representatives of the media and others. Examples of forward-looking statements include: · expectations about the timing and amount of payments to the Asbestos Injuries Compensation Fund (AICF), a special purpose fund for the compensation of proven asbestos-related personal injury and death claims; · expectations with respect to the effect on our financial statements of those payments; statements as to the possible consequences of proceedings brought against us and certain of our former directors and officers by the Australian Securities and Investments Commission; expectations that our credit facilities will be extended or renewed; projections of our operating results or financial condition; statements regarding our plans, objectives or goals, including those relating to competition, acquisitions, dispositions and our products; statements about our future performance; and statements about product or environmental liabilities. Words such as “believe,” “anticipate,” “plan,” “expect,” “intend,” “target,” “estimate,” “project,” “predict,” “forecast,” “guideline,” “should,” “aim” and similar expressions are intended to identify forward-looking statements but are not the exclusive means of identifying such statements. Forward-looking statements involve inherent risks and uncertainties. We caution you that a number of important factors could cause actual results to differ materially from the plans, objectives, expectations, estimates and intentions expressed in such forward-looking statements. These factors, some of which are discussed under “Risk Factors” beginning on page 6 of our Form 20-F filed on 6 July 2007 with the Securities and Exchange Commission, include but are not limited to: all matters relating to or arising out of the prior manufacture of products that contained asbestos by current and former James Hardie subsidiaries; required contributions to the AICF and the effect of foreign exchange on the amount recorded in our financial statements as an asbestos liability; compliance with and changes in tax laws and treatments; competition and product pricing in the markets in which we operate; the consequences of product failures or defects; exposure to environmental, asbestos or other legal proceedings; general economic and market conditions; the supply and cost of raw materials; the success of our research and development efforts; our reliance on a small number of product distributors; compliance with and changes in environmental and health and safety laws; risks of conducting business internationally; compliance with and changes in laws and regulations; foreign exchange risks; the successful implementation of new software systems; and the effect of natural disasters. We caution you that the foregoing list of factors is not exhaustive and that other risks and uncertainties may cause actual results to differ materially from those in forward-looking statements. Forward-looking statements speak only as of the date they are made.


()
()
Endnotes This Management Presentation forms part of a package of information about the company’s results. It should be read in conjunction with the other parts of this package, including Management’s Analysis of Results, a Media Release and a Financial Report. Definitions Financial Measures — US GAAP equivalents EBIT and EBIT Margin - EBIT, as used in this document, is equivalent to the US GAAP measure of operating income. EBIT margin is defined as EBIT as a percentage of net sales. We believe EBIT and EBIT margin to be relevant and useful information as these are the primary measures used by our management to measure the operating profit or loss of our business. EBIT is one of several metrics used by our management to measure the earnings generated from our operations, excluding interest and income tax expenses. Additionally, EBIT is believed to be a primary measure and terminology used by our Australian investors. EBIT and EBIT margin should be considered in addition to, but not as a substitute for, other measures of financial performance reported in accordance with accounting principles generally accepted in the United States of America. EBIT and EBIT margin, as we have defined them, may not be comparable to similarly titled measures reported by other companies. Operating profit - is equivalent to the US GAAP measure of income. Net operating profit — is equivalent to the US GAAP measure of net income. Sales Volumes mmsf million square feet msf thousand square feet Endnotes Financial Ratios Gearing Ratio — Net debt/cash divided by net debt/cash plus shareholders’ equity. Net interest expense cover — EBIT divided by net interest expense. Net interest paid cover — EBIT divided by cash paid during the period for interest, net of amounts capitalised. Net debt payback — Net debt/cash divided by cash flow from operations. Net debt/cash — Short-term and long-term debt less cash and cash equivalents.


()
()
Non-US GAAP Financial Measures (continued)
EBIT and EBIT margin excluding asbestos —
EBIT and EBIT margin excluding asbestos are not measures of financial performance under US GAAP and should not be considered to be more meaningful than EBIT and EBIT margin. James Hardie has included these financial measures to provide investors with an alternative method for assessing its operating results in a manner that is focussed on the performance of its ongoing operations and provides useful information regarding its financial condition and results of operations. The company uses these non-US GAAP measures for the same purposes. US$ Million            Q1 FY08 Q1 FY07 EBIT $ 65.6 $ 68.9 Asbestos: Asbestos adjustments 39.5 27.2 AICF SG&A expenses 0.6 - EBIT excluding asbestos $ 105.7 $ 96.1 Net Sales $ 424.4 $ 415.5 EBIT margin excluding asbestos 24.9% 23.1% Non-US GAAP Financial Measures (continued)
Net operating profit excluding asbestos—
Net operating profit excluding asbestos is not a measure of financial performance under US GAAP and should not be considered to be more meaningful than net income. The company has included this financial measure to provide investors with an alternative method for assessing its operating results in a manner that is focussed on the performance of its ongoing operations. The company uses this non-US GAAP measure for the same purposes. US$ Million            Q1 FY08 Q1 FY07 Net operating profit $ 29.7 $ 35.5 Asbestos: Asbestos adjustments 39.5 27.2 AICF SG&A expenses 0.6 -AICF interest income (1.6) -Tax expense related to asbestos adjustments 0.4 -Net operating profit excluding asbestos $ 68.6 $ 62.7


()
()
Non-US GAAP Financial Measures (continued)
Diluted earnings per share excluding asbestos —
Diluted earnings per share excluding asbestos is not a measure of financial performance under US GAAP and should not be considered to be more meaningful than diluted earnings per share. The company has included this financial measure to provide investors with an alternative method for assessing its operating results in a manner that is focussed on the performance of its ongoing operations. The company’s management uses this non-US GAAP measure for the same purposes. US$Million            Q1 FY08 Q1 FY07 Net operating profit excluding asbestos $68.6 $62.7 Weighted average common shares outstanding — Diluted (millions) 469.4 466.9 Diluted earnings per share excluding asbestos (US cents) 14.6 13.4 Non-US GAAP Financial Measures (continued)
Net operating profit excluding asbestos adjustments and tax benefit related to asbestos adjustments—
Net operating profit excluding asbestos adjustments and tax benefit related to asbestos adjustments is not a measure of financial performance under US GAAP and should not be considered to be more meaningful than net income. The company has included this financial measure to provide investors with an alternative method for assessing its operating results in a manner that is focussed on the performance of its ongoing operations. The company uses this non-US GAAP measure for the same purposes. US$ Million            FY07 FY06
Net operating profit $ 151.7 $ (506.7) Asbestos adjustments 405.5 715.6 Tax benefit related to asbestos adjustments (335.0) - Net operating profit excluding asbestos adjustments and tax $ 222.2 $ 208.9 benefit related to asbestos adjustments


()
()
Non-US GAAP Financial Measures (continued)
Net operating profit excluding asbestos adjustments, tax benefit related to asbestos adjustments, impairment charge, SCI and other related expenses, make-whole payment and tax provision write-back—
Net operating profit excluding asbestos adjustments, tax benefit related to asbestos adjustments, impairment charge, SCI and other related expenses, make-whole payment and tax provision write-back is not a measure of financial performance under US GAAP and should not be considered to be more meaningful than net income. The company has included this financial measure to provide investors with an alternative method for assessing its operating results in a manner that is focussed on the performance of its ongoing operations. The company uses this non-US GAAP measure for the same purposes. US$ Million            FY07 FY06 Net operating profit $ 151.7 $ (506.7) Asbestos adjustments 405.5 715.6 Tax benefit related to asbestos adjustments (335.0) - -Impairment charge (net of tax) — 8.0 SCI and other related expenses (net of tax) 12.6 16.5 Make-whole payment (net of tax) 5.6 -Tax provision write-back (10.4) (20.7) Net operating profit excluding asbestos adjustments, tax benefit related to asbestos adjustments, impairment charge, SCI and other related $ 230.0 $ 212.7 expenses, make-whole payment and tax provision write-back Australian Information Meeting Louis Gries, CEO 15 August 2007 \