UBSLondon ConferenceSeptember 2007In this Management Presentation, James Hardie may present the financial measures, sales volume terms, financial ratios, and Non-US GAAP financial measures included in the Endnotes section of this document starting on page 45. The company presents financial measures that it believes are customarily used by its Australian investors. Specifically, these financial measures include EBIT and EBIT margin. The company may also present other terms for measuring its sales volumes (million square feet (mmsf)); and Non-US GAAP financial measures (EBIT and EBIT margin excluding adjustments to asbestos adjustments, SCI and other related expense, and impairment of roofing plant). Unless otherwise stated, results are for continuing operations only. |
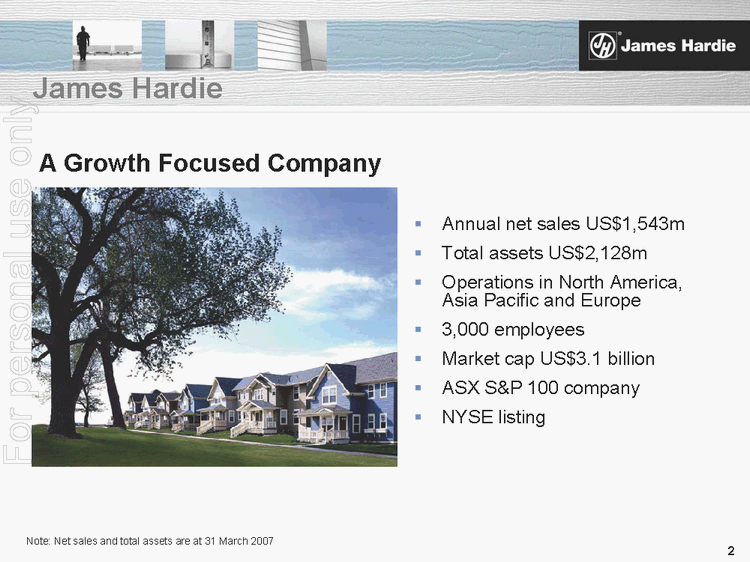
James Hardie..Annual net sales US$1,543m ..Total assets US$2,128m..Operations in North America, Asia Pacific and Europe..3,000 employees..Market cap US$3.1 billion..ASX S&P 100 company..NYSE listingNote: Net sales and total assets are at 31 March 2007A Growth Focused Company |
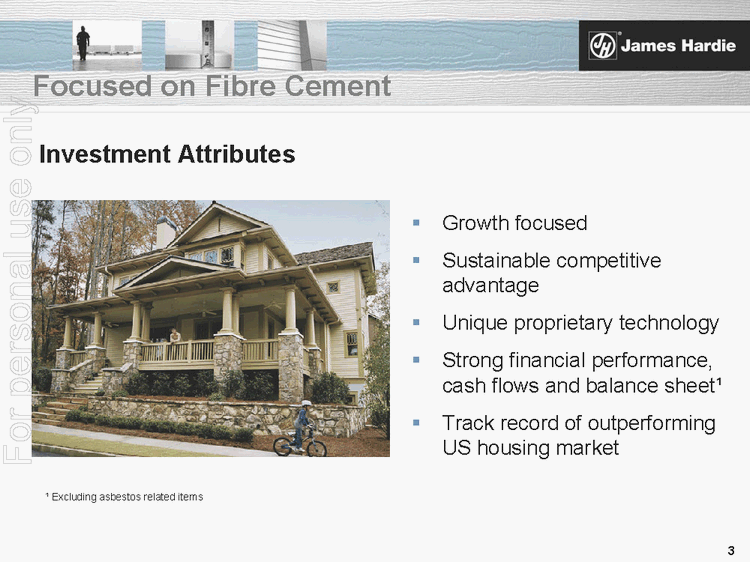
Focused on Fibre Cement..Growth focused..Sustainable competitive advantage..Unique proprietary technology..Strong financial performance, cash flows and balance sheet 1..Track record of outperforming US housing marketInvestment Attributes 1 Excluding asbestos related items |
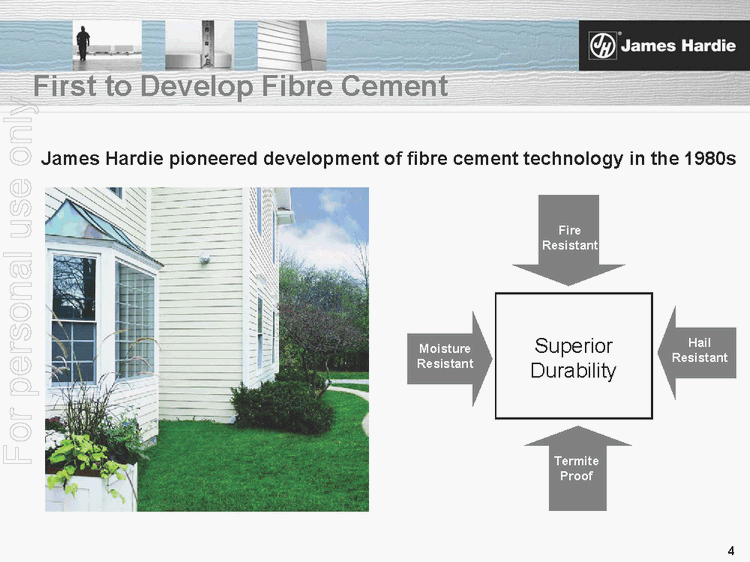
First to Develop Fibre CementJames Hardie pioneered development of fibre cement technology in the 1980sSuperior DurabilityFireResistatTermite ProofFireResistantHail ResistantMoistureResistantTermite Proof |
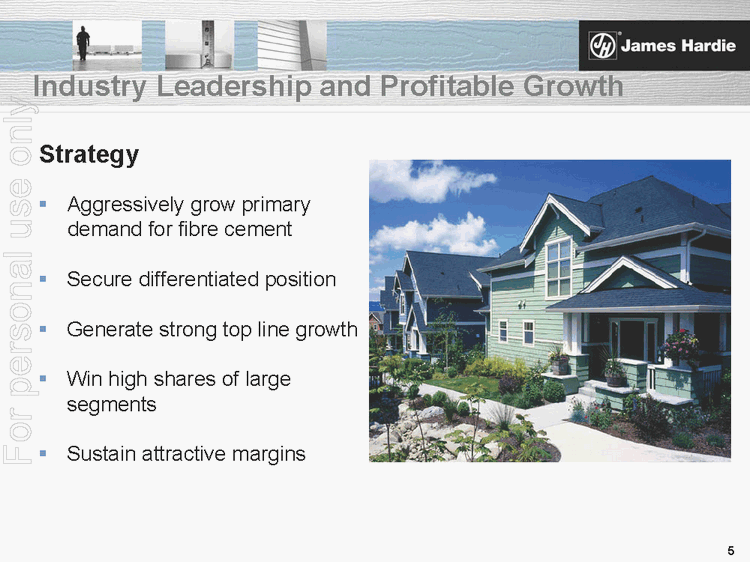
Industry Leadership and Profitable Growth..Aggressively grow primary demand for fibre cement..Secure differentiated position..Generate strong top line growth..Win high shares of largesegments..Sustain attractive marginsStrategy |
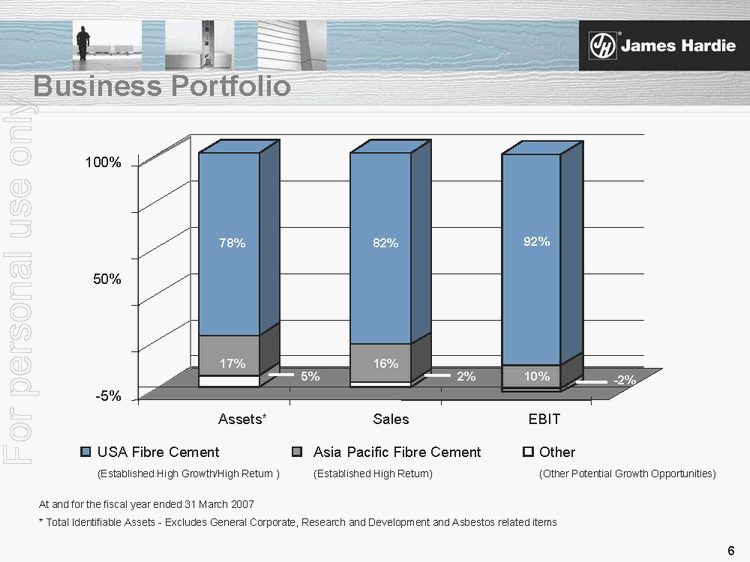
Business Portfolio * Total Identifiable Assets Excludes General Corporate, Research and Development and Asbestos related items -5% 50% 100% Assets* Sales EBIT USA Fibre Cement (Established High Growth/High Return ) Asia Pacific Fibre Cement (Established High Return) Other (Other Potential Growth Opportunities) 78% 82% 92% 17% 16% 10% 5% 2% -2% |
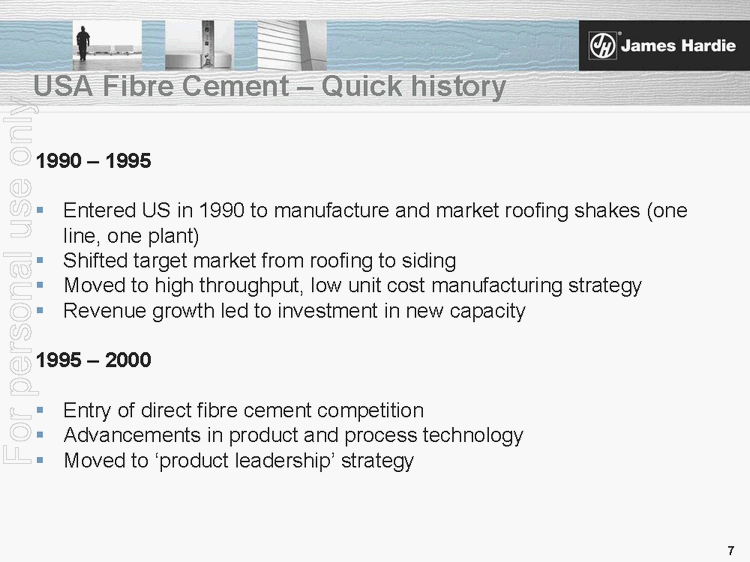
USA Fibre Cement Quick history 1990 1995 ..Entered US in 1990 to manufacture and market roofing shakes (oneline, one plant) ..Shifted target market from roofing to siding ..Moved to high throughput, low unit cost manufacturing strategy ..Revenue growth led to investment in new capacity 1995 2000 ..Entry of direct fibrecement competition ..Advancements in product and process technology ..Moved to product leadershipstrategy |
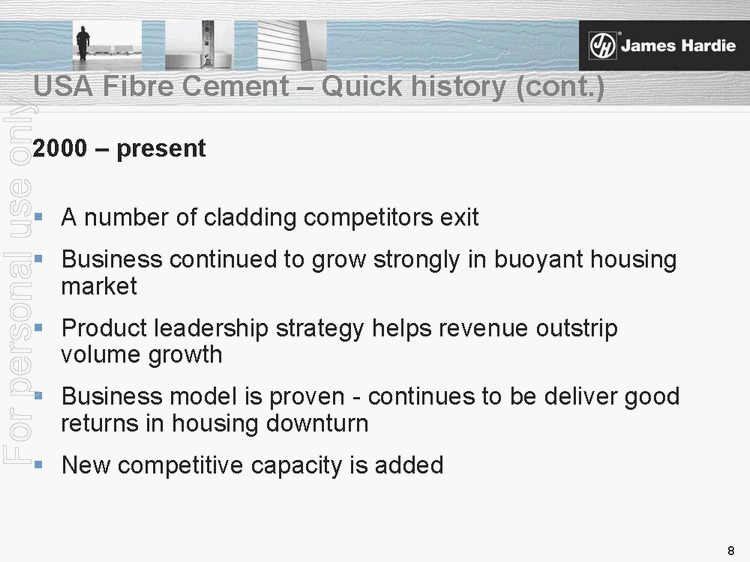
USA Fibre Cement Quick history (cont.) 2000 present ..A number of cladding competitors exit ..Business continued to grow strongly in buoyant housing market ..Product leadership strategy helps revenue outstrip volume growth ..Business model is proven -continues to be deliver good returns in housing downturn ..New competitive capacity is added |
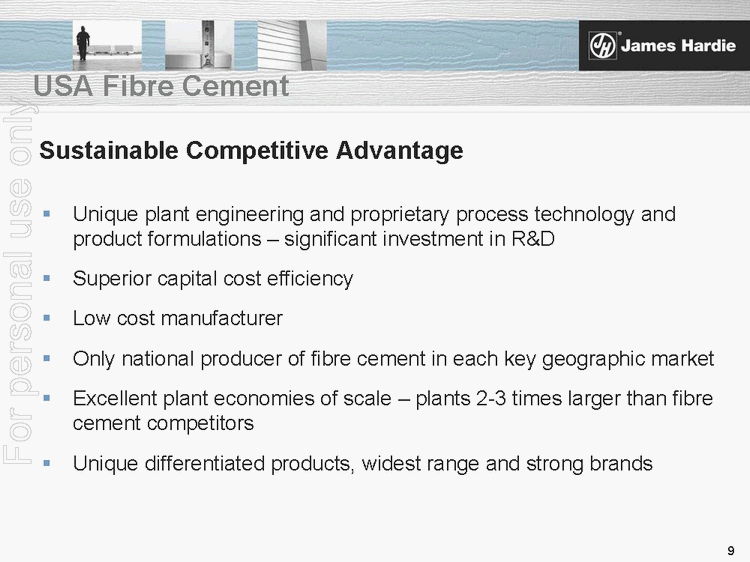
USA Fibre Cement ..Unique plant engineering and proprietary process technology and product formulations -significant investment in R&D ..Superior capital cost efficiency ..Low cost manufacturer ..Only national producer of fibre cement in each key geographic market ..Excellent plant economies of scale -plants 2-3 times larger than fibre cement competitors ..Unique differentiated products, widest range and strong brands Sustainable Competitive Advantage |
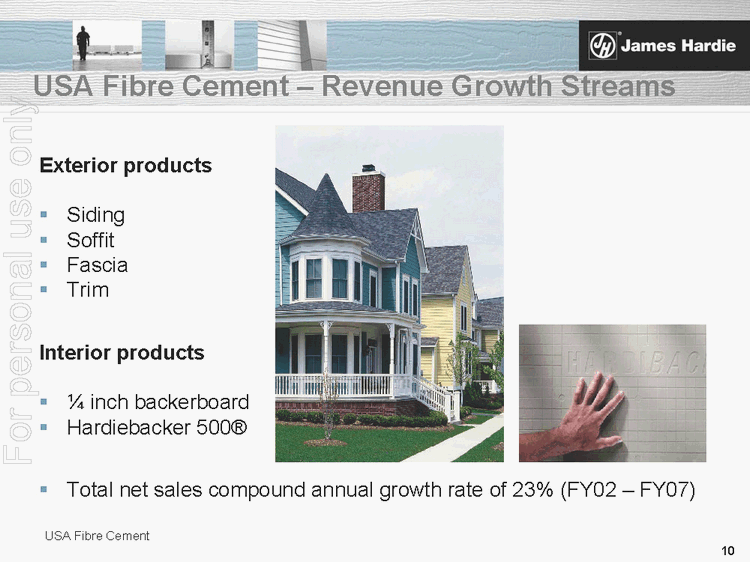
USA Fibre Cement Revenue Growth Streams Exterior products ..Siding ..Soffit ..Fascia ..Trim Interior products ..1/4inch backerboard ..Hardiebacker 500® ..Total net sales compound annual growth rate of 23% (FY02 -FY07) USA Fibre Cement |
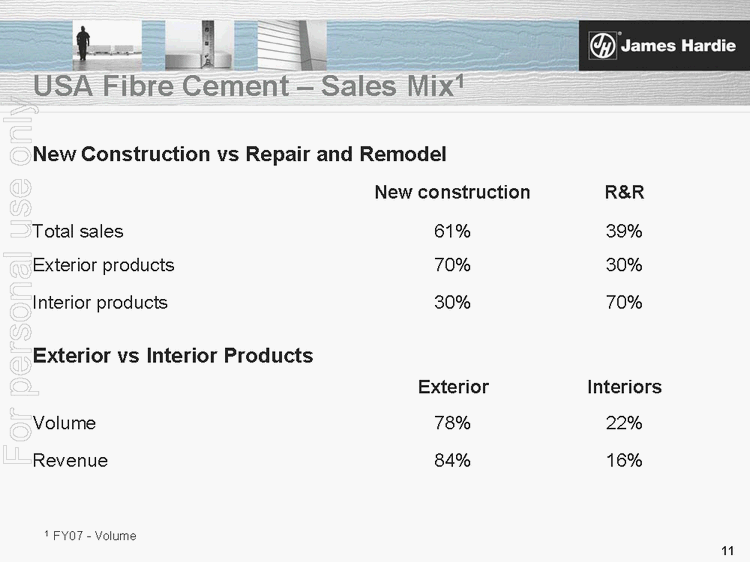
USA Fibre Cement Sales Mix1 New Construction vs Repair and Remodel New construction R&R Total sales 61% 39% Exterior products 70% 30% Interior products 30% 70% Exterior vs Interior Products Exterior Interiors Volume 78% 22% Revenue 84% 16% 1 FY07 Volume |
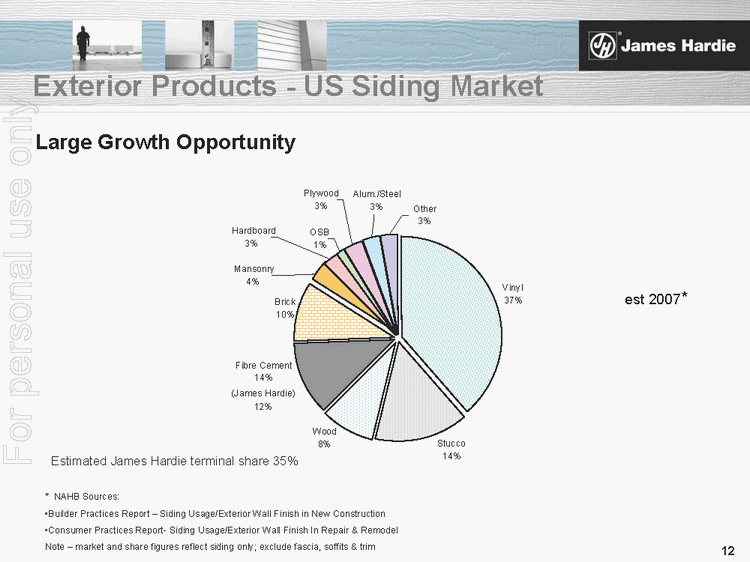
Exterior Products US Siding Market Large Growth Opportunity est 2007* Vinyl 37% Fibre Cement 14% Brick 10% OSB 1% Plywood 3% Hardboard 3% Mansonry 4% Other 3% Alum./Steel 3% Stucco 14% Wood 8% * NAHB Sources: Builder Practices Report Siding Usage/Exterior Wall Finish in New Construction Consumer Practices Report- Siding Usage/Exterior Wall Finish In Repair & Remodel Note market and share figures reflect siding only; exclude fascia, soffits & trim Estimated James Hardie terminal share 35% (James Hardie) 12% |
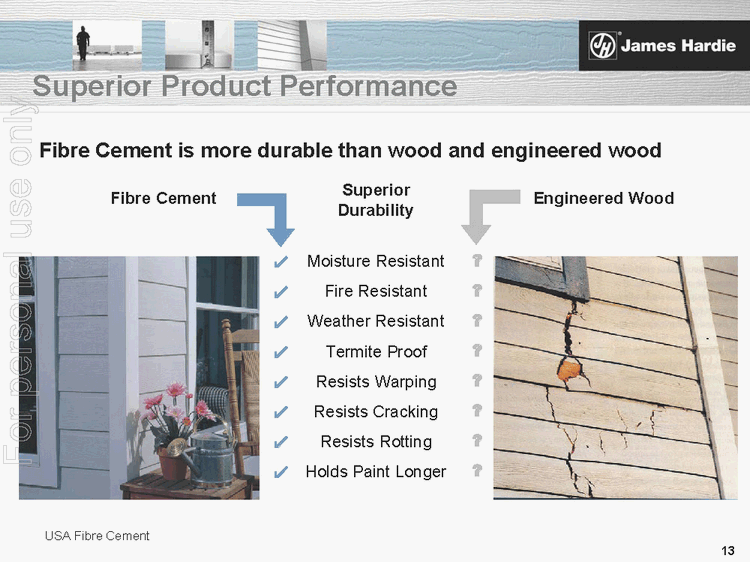
Superior Product Performance Fibre Cement is more durable than wood and engineered wood Fibre Cement Superior Durability Moisture Resistant Fire Resistant Weather Resistant Termite Proof Resists Warping Resists Cracking Resists Rotting Holds Paint Longer ? ? ? ? ? ? ? ? ! ! ! ! ! ! ! ! Engineered Wood USA Fibre Cement |
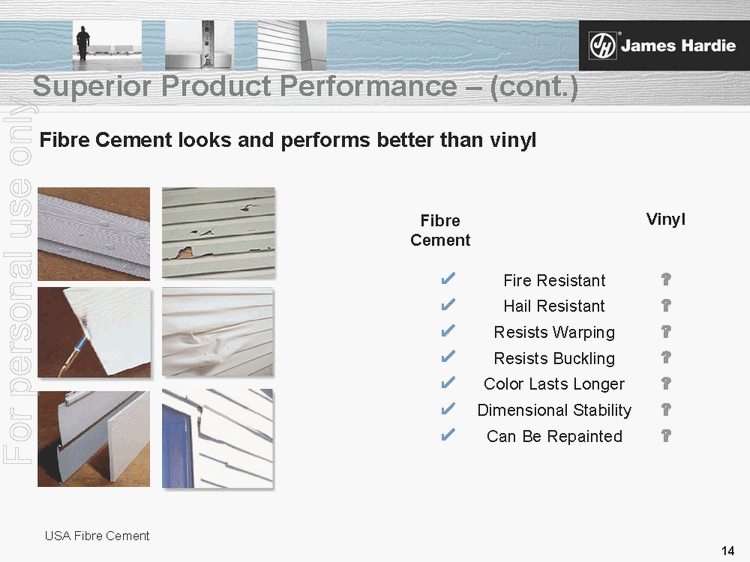
Superior Product Performance (cont.) Fibre Cement looks and performs better than vinyl Vinyl Fire Resistant Hail Resistant Resists Warping Resists Buckling Color Lasts Longer Dimensional Stability Can Be Repainted ? ? ? ? ? ? ? ! ! ! ! ! ! ! Fibre Cement USA Fibre Cement |
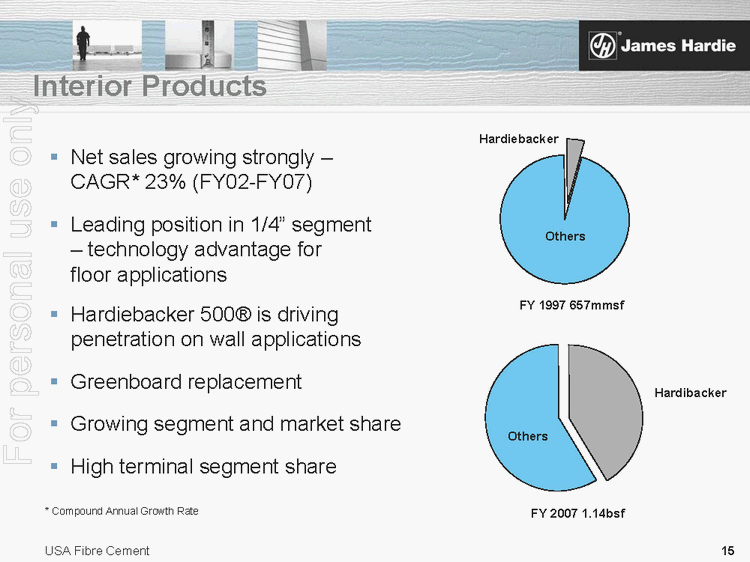
Interior Products ..Net sales growing strongly CAGR* 23% (FY02-FY07) ..Leading position in 1/4segment -technology advantage for floor applications ..Hardiebacker 500®is drivingpenetration on wall applications ..Greenboard replacement ..Growing segment and market share ..High terminal segment share USA Fibre Cement Hardiebacker FY 1997 657mmsf FY 2007 1.14bsf Others Hardibacker Others< /TD> |
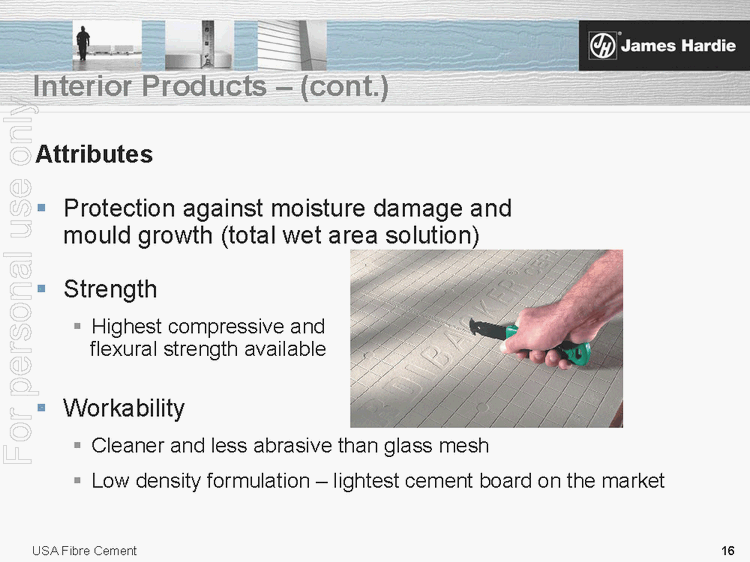
Interior Products (cont.) Attributes ..Protection against moisture damage and mould growth (total wet area solution) ..Strength ..Highest compressive andflexural strength available ..Workability ..Cleaner and less abrasive than glass mesh ..Low density formulation -lightest cement board on the market USA Fibre Cement |
Largest Fibre Cement Producer in North America Flat Sheet Plants Capacity (mmsf) Fontana, California 180 Plant City, Florida 300 Cleburne, Texas 500 Tacoma, Washington 200 Peru, Illinois 560 Waxahachie, Texas 360 Blandon, Pennsylvania 200 Summerville, South Carolina 190 Reno, Nevada 300 Pulaski, Virginia 600 Flat Sheet Total 3,390 FRC Pipe Plant Plant City, Florida 100,000 tons JH Plant Design Capacity Plant Locations USA Fibre Cement ..Tacoma, WA Plant Ci ty, FL Waxahachie, TX Cleburne, TX Peru,IL Blandon, PA Summerville, SC Pulaski, VA ..Reno, NV Text Box: .. Text Box: .. Text Box: .. Text Box: .. Text Box: .. Text Box: .. Text Box: .. ..Fontana, CA |
Low Cost Fibre Cement Producer USA Fibre Cement CAPITAL COST PER UNIT OF CAPACITY (US$/SF) 0.1 0.15 0.2 0.25 0.3 0.35 0.4 FY91 FY96 FY97 FY98 FY99 FY00 FY01 FY02 FY03 FY05 FY06 FY07 $US / SF PRODUCTION CAPACITY PER LINE 60 100 150 200 300 0.1 50.1 100.1 150.1 200.1 250.1 300.1 350.1 1990 1994 1998 2001 2006 MMSF |
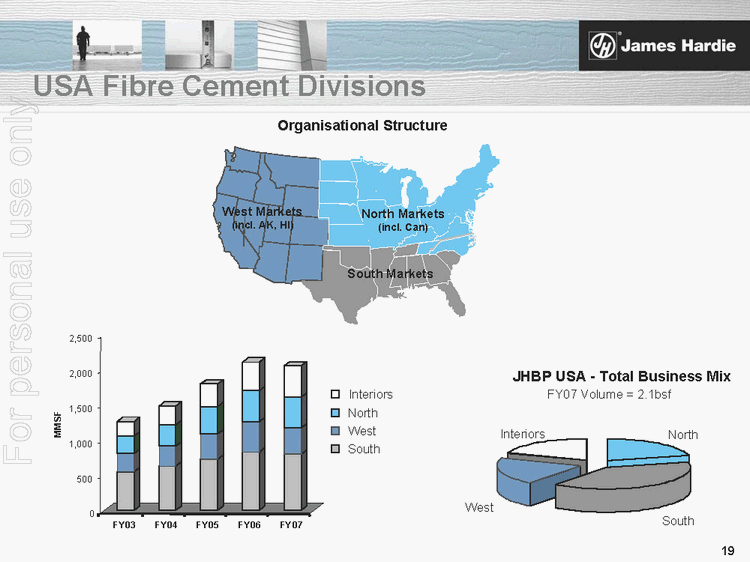
USA Fibre Cement Divisions West JHBP USA Total Business Mix FY07 Volume = 2.1bsf North South Interiors Organisational Structure West Markets (incl. AK, HI) North Markets (incl. Can) South Markets 0 500 1,000 1,500 2,000 2,500 MMSF FY03 FY04 FY05 FY06 FY07 Interiors North West South |
USA Fibre Cement Divisions (cont.) Southern and Western Divisions ..High builder penetration ..High brand awareness ..Primary growth positioned aroundwood, vinyl, brick and stucco conversions ..Expansion into rural markets ..Significant opportunity in R&R segment ..Incremental revenue opportunitywith colour |
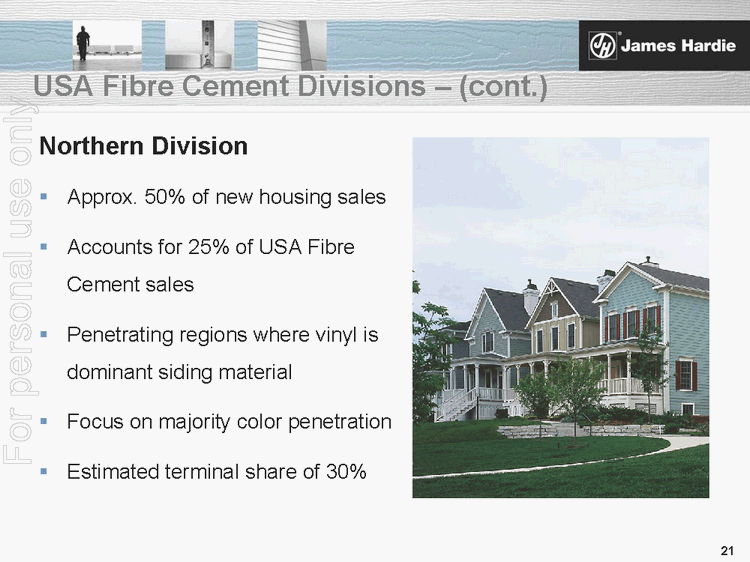
USA Fibre Cement Divisions (cont.) Northern Division ..Approx. 50% of new housing sales ..Accounts for 25% of USA FibreCement sales ..Penetrating regions where vinyl is dominant siding material ..Focus on majority color penetration ..Estimated terminal share of 30% |
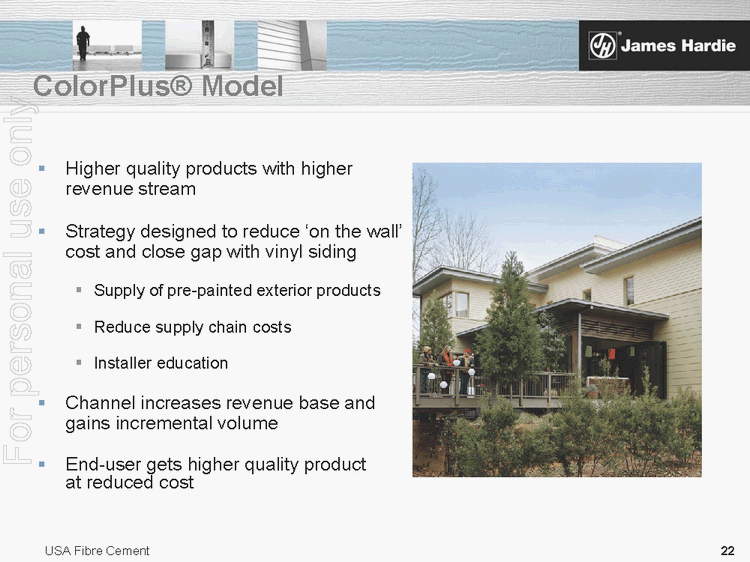
ColorPlus® Model ..Higher quality products with higher revenue stream ..Strategy designed to reduce on the wallcost and close gap with vinyl siding ..Supply of pre-painted exterior products ..Reduce supply chain costs ..Installer education ..Channel increases revenue base and gains incremental volume ..End-user gets higher quality product at reduced cost USA Fibre Cement |
ColorPlus® Model (cont.) ..Mechanics of model in place ..Colour plant network ..20 colours and 20 products by market ..Channel is reset and developing ..Base level logistics capability ..Value priced ColorPlus®in July 2006 USA Fibre Cement |
Average Net Sales Price Average price growth driven by mix and price increases US$ per MSF 360 380 400 420 440 460 480 500 520 540 560 580 600 620 FY02 FY03 FY04 FY05 FY06 FY07 Q1 FY08 USA Fibre Cement |
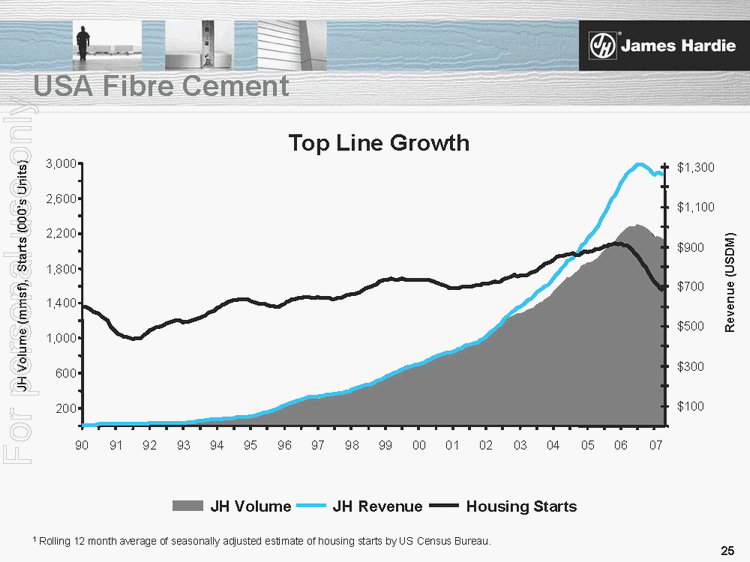
1 Rolling 12 month average of seasonally adjusted estimate of housing starts by US Census Bureau. USA Fibre Cement Top Line Growth 200 600 1,000 1,400 1,800 2,200 2,600 3,000 90 91 92 93 94 95 96 97 98 99 00 01 02 03 04 05 06 JH Volume (mmsf), Starts (000s Units) $100 $300 $500 $700 $900 $1,100 $1,300 Revenue (USDM) JH Volume JH Revenue Housing Starts 07 |
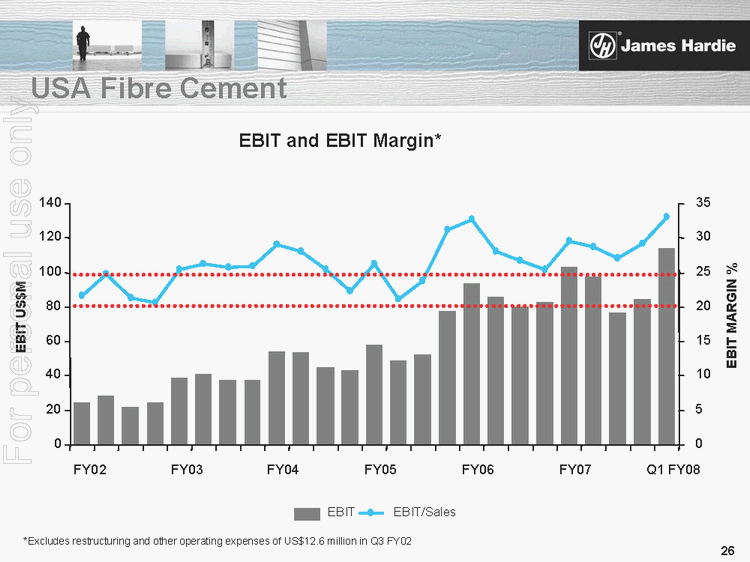
*Excludes restructuring and other operating expenses of US$12.6 million in Q3 FY02 EBIT and EBIT Margin* USA Fibre Cement 0 20 40 60 80 100 120 140 FY02 FY03 FY04 FY05 FY06 FY07 Q1 FY08 EBIT US$M 0 5 10 15 20 25 30 35 EBIT MARGIN % EBIT EBIT/Sales |
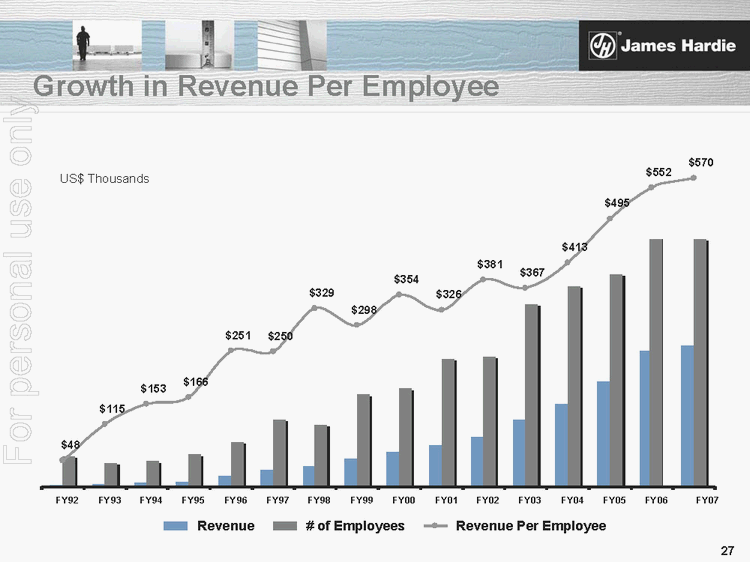
Growth in Revenue Per Employee US$ Thousands $570 $552 $495 $48 $115 $153 $166 $251 $250 $329 $298 $354 $326 $381 $367 $413 FY92 FY93 FY94 FY95 FY96 FY97 FY98 FY99 FY00 FY01 FY02 FY03 FY04 FY05 FY06 FY07 Revenue # of Employees Revenue Per Employee |
US Housing Downturn ..Focus on primary demand growth and cost management ..Business Re-set ..Re-set late 2006/early 2007 in anticipation of weaker housing market ..Included: ..Production re-scheduling to balance supply and demand ..Sales and marketing activities reviewed and re-allocated based on lower market opportunity ..Corporate wide review undertaken of cost saving opportunities ..Assisted in delivery of solid operating performance despite weaker market .. Able to flex upquickly if needed ..Continuing to invest in growth initiatives USA Fibre Cement |
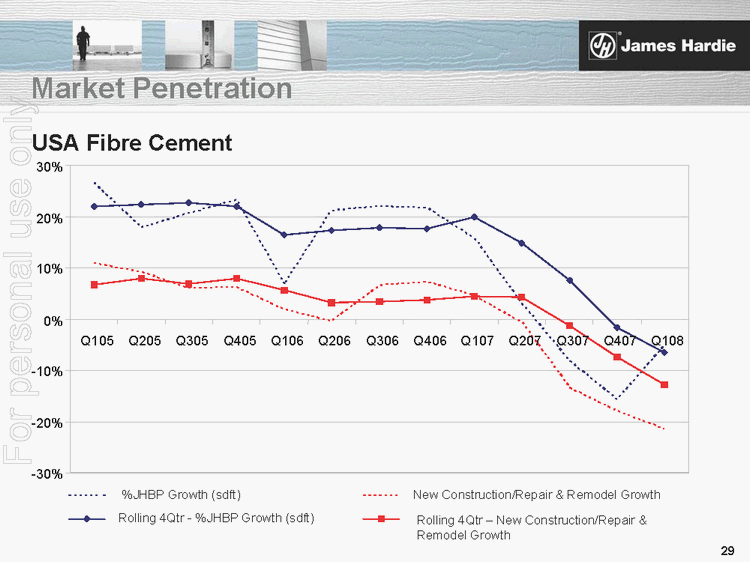
Market Penetration USA Fibre Cement -30% -20% -10% 0% 10% 20% 30% Q105 Q205 Q305 Q405 Q106 Q206 Q306 Q406 Q107 Q207 Q307 Q407 Q108 %JHBP Growth (sdft) New Construction/Repair & Remodel Growth Rolling 4Qtr %JHBP Growth (sdft) Remodel Growth |
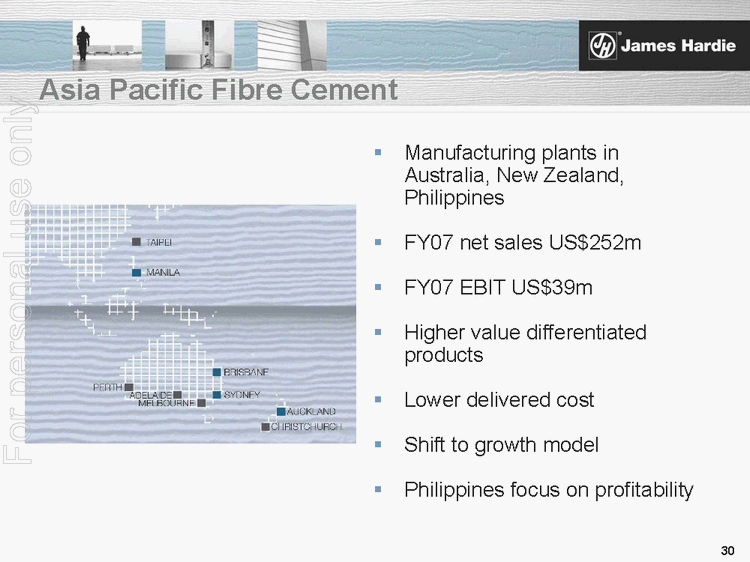
Asia Pacific Fibre Cement ..Manufacturing plants in Australia, New Zealand, Philippines ..FY07 net sales US$252m ..FY07 EBIT US$39m ..Higher value differentiated products ..Lower delivered cost ..Shift to growth model ..Philippines focus on profitability |
Organisational Focus Product Leadership ..Continued investment in new product development and commercialisation ..Value-added, differentiated products ..Benefits: ..Grow the fibrecement category ..Grow revenue ..Sustain good margins ..Defend and strengthen our competitive position |
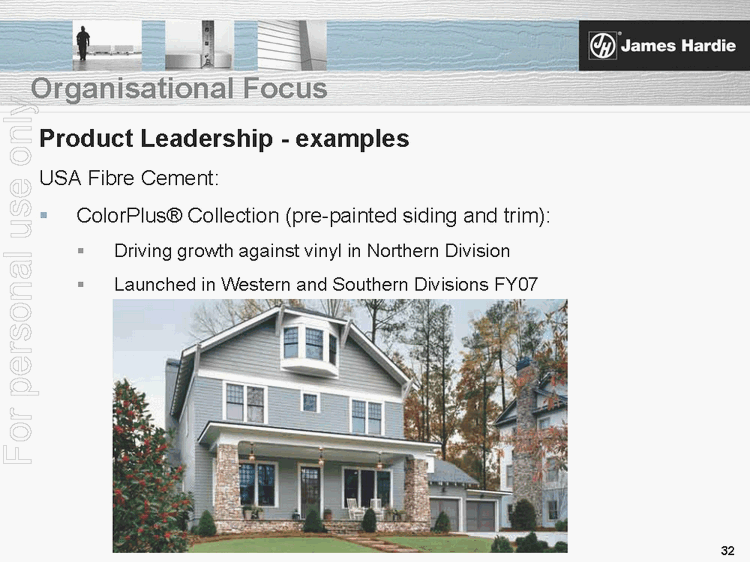
Organisational Focus Product Leadership examples USA Fibre Cement: ..ColorPlus®Collection (pre-painted siding and trim): ..Driving growth against vinyl in Northern Division ..Launched in Western and Southern Divisions FY07 |
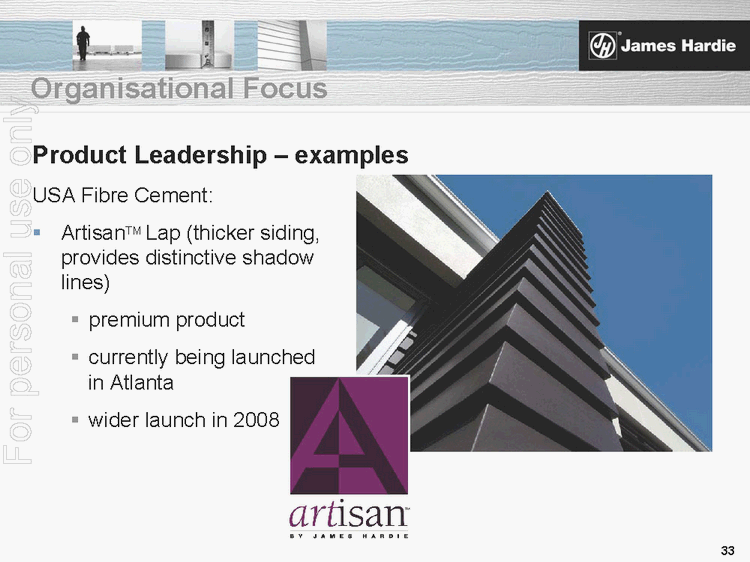
Product Leadership examples USA Fibre Cement: ..ArtisanTMLap (thicker siding, provides distinctive shadow lines) ..premium product ..currently being launchedin Atlanta ..wider launch in 2008 Organisational Focus |
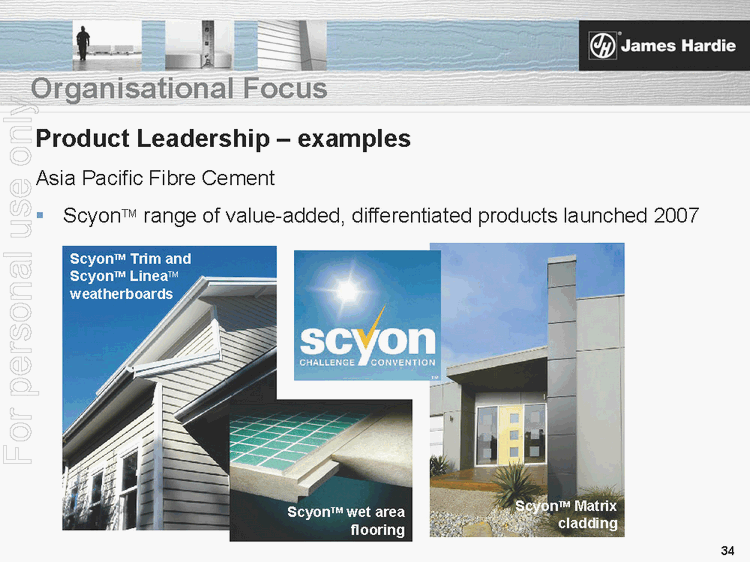
Product Leadership examples Asia Pacific Fibre Cement ..ScyonTMrange of value-added, differentiated products launched 2007 Organisational Focus ScyonTM wet area flooring ScyonTM Trim and ScyonTM LineaTM weatherboards ScyonTM Matrix cladding |
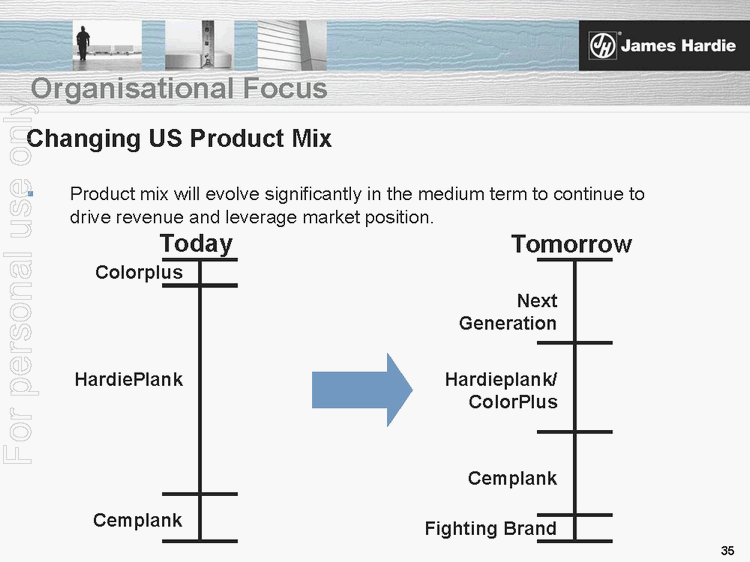
Organisational Focus Today Tomorrow HardiePlank Colorplus Cemplank Next Generation Fighting Brand Cemplank Hardieplank/ ColorPlus Changing US Product Mix ..Product mix will evolve significantly in the medium term to continue to drive revenue and leverage market position. |
Organisational Focus USA Fibre Cement Future Growth ..Job 1 ..Deliver terminal share in current USA FibreCement business ..Job 2 ..Extend the current business model in the US (eg new products, new markets) ..Job 3 ..Bolt-on acquisition opportunity in the US? ..Technology track outside of fibre ..Geography spread outside the US? |
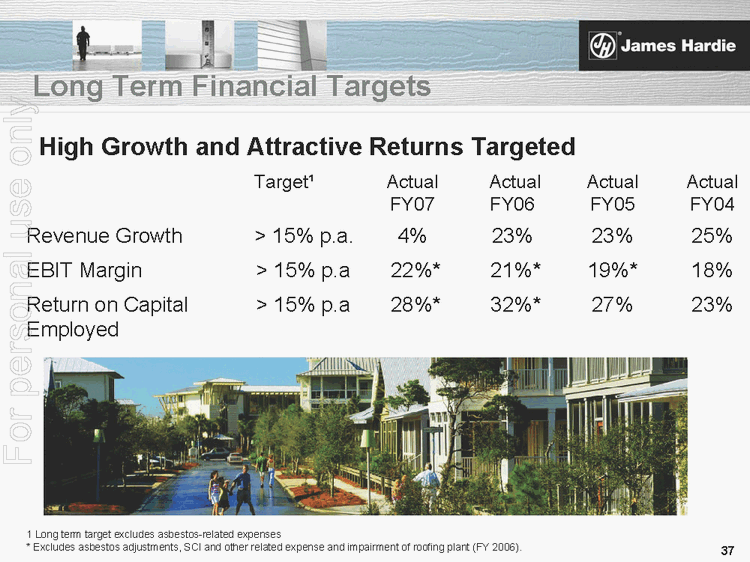
Long Term Financial Targets High Growth and Attractive Returns Targeted Target 1 Actual FY07 Actual FY06 Actual FY05 Actual FY04 Revenue Growth 15% p.a. 4% 23% 23% 25% EBIT Margin 15% p.a 22%* 21%* 19%* 18% Return on Capital Employed 15% p.a 28%* 32%* 27% 23% 1 Long term target excludes asbestos-related expenses * Excludes asbestos adjustments, SCI and other related expense and impairment of roofing pl ant (FY 2006). |
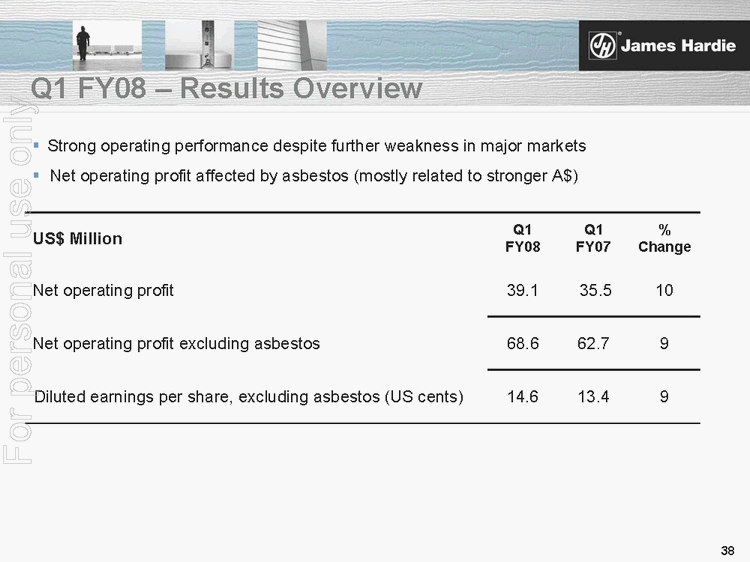
Q1 FY08 Results Overview US$ Million Q1 FY08 Q1 FY07 % Change Net operating profit 39.1 35.5 10 Net operating profit excluding asbestos 68.6 62.7 9 Diluted earnings per share, excluding asbestos (US cents) 14.6 13.4 9 ..Strong operating performance despite further weakness in major markets ..Net operating profit affected by asbestos (mostly related to stronger A$) |
Q1 FY08 Results Overview Strong operating performance ..USA Fibre Cement -improved market penetration, price growth and cost management helped deliver a very strong EBIT result despitefurther weakness in US housing ..Asia Pacific Fibre Cement -both sales and EBIT up despite weak Australian and New Zealand housing and renovation markets ..Business continued to generate strong operating cash flows |
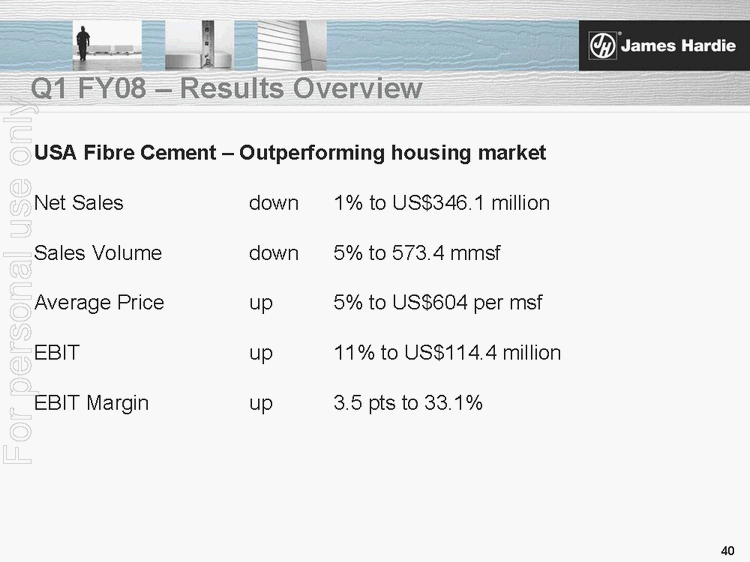
USA Fibre Cement Outperforming housing market Net Sales down 1% to US$346.1 million Sales Volume down 5% to 573.4 mmsf Average Price up 5% to US$604 per msf EBIT up 11% to US$114.4 million EBIT Margin up 3.5 pts to 33.1% Q1 FY08 Results Overview |
Asia Pacific Fibre Cement Net Sales up 20% to US$71.2 million Sales Volume up 7% to 98.0 mmsf Average Price up 1% to A$873 EBIT up 20% to US$12.4 million EBIT Margin flat 17.4% Q1 FY08 Results Overview |
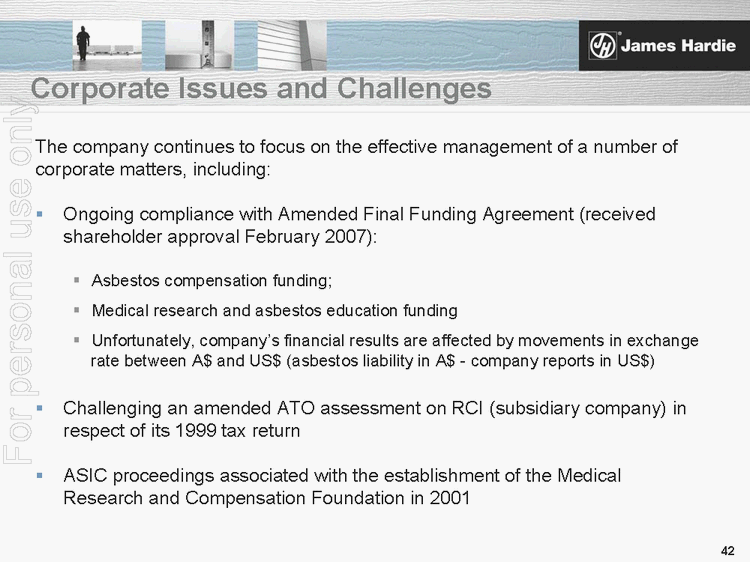
Corporate Issues and Challenges The company continues to focus on the effective management of a number of corporate matters, including: ..Ongoing compliance with Amended Final Funding Agreement (received shareholder approval February 2007): ..Asbestos compensation funding; ..Medical research and asbestos education funding ..Unfortunately, companys financial results are affected by movements in exchange rate between A$ and US$ (asbestos liability in A $ -company reports in US$) ..Challenging an amended ATO assessment on RCI (subsidiary company) in respect of its 1999 tax return ..ASIC proceedings associated with the establishment of the Medical Research and Compensation Foundation in 2001 |
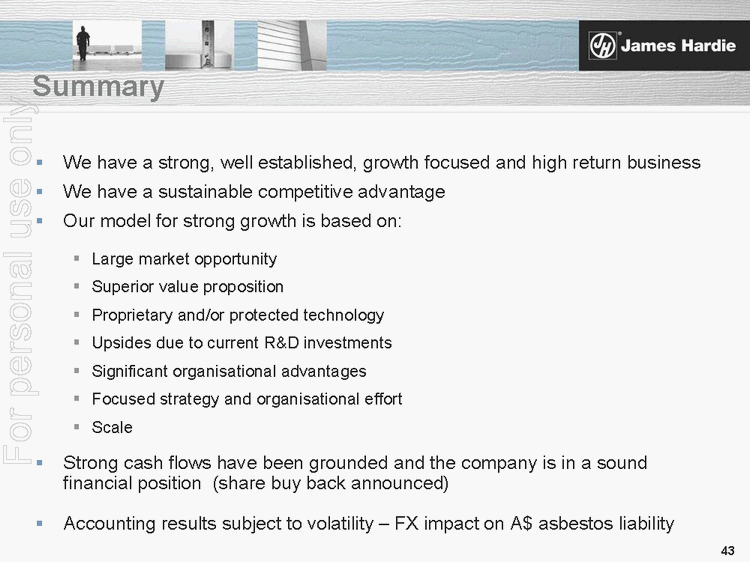
Summary ..We have a strong, well established, growth focused and high return business ..We have a sustainable competitive advantage ..Our model for strong growth is based on: ..Large market opportunity ..Superior value proposition ..Proprietary and/or protected technology ..Upsides due to current R&D investments ..Significant organisational advantages ..Focused strategy and organisational effort ..Scale ..Strong cash flows have been grounded and the compan y is in a sound financial position (share buy back announced) ..Accounting results subject to volatility -FX impact on A$ asbestos liability |
This Management Presentation contains forward-looking statements. We may from time to time make forward-looking statements in our periodic reports filed with or furnished to the United States Securities and Exchange Commission on Forms 20-F and 6-K, in our annual reports to shareholders, in offering circulars and prospectuses, in media releases and other written materials and in oral statements made by our officers, directors or employees to analysts, instituti onal investors, representatives of the media and others. Examples of forward-looking statements include: expectations about the timing and amount of payments to the Asbestos Injuries Compensation Fund (AICF), a special purpose fund for the compensation of proven asbestos-related personal injury and death claims; expectations with respect to the effect on our financial statements of those payments; statements as to the possible consequences of proceedings brought agai nst us and certain of our former directors and officers by the Australian Securities and Investments Commission; expectations that our credit facilities will be extended or renewed; projections of our operating results or financial condition; statements regarding our plans, objectives or goals, including those relating to competition, acquisitions, dispositions and our products; statements about our future performance; and statements about pro duct or environmental liabilities. Words such as believe, anticipate, plan, expect, intend, target, estimate, project, predict, forecast, guideline, should, aim and similar expressions are intended to identify forward-looking statements but are not the exclusive means of identifying such statements. Forward-looking statements involve inherent risks and u ncertainties. We caution you that a number of important factors could cause actual results to differ materially from the plans, objectives, expectations, estimates and intentions expressed in such forward-looking statements. These factors, some of which are discussed under Risk Factors beginning on page 6 of our Form 20-F filed on 6 July 2007 with the Securities and Exchange Commission, include but are not limited to: all matters relating to or arising out of the prior manufacture of produc ts that contained asbestos by current and former James Hardie subsidiaries; required contributions to the AICF and the effect of foreign exchange on the amount recorded in our financial statements as an asbestos liability; compliance with and changes in tax laws and treatments; competition and product pricing in the markets in which we operate; the consequences of product failures or defects; exposure to environmental, asbestos or other legal proceedings; general economic and market conditions; the supply a nd cost of raw materials; the success of our research and development efforts; our reliance on a small number of product distributors; compliance with and changes in environmental and health and safety laws; risks of conducting business internationally; compliance with and changes in laws and regulations; foreign exchange risks; the successful implementation of new software systems; and the effect of natural disasters. We caution you that the foregoing list of factors is not exhaustive and that other risks and uncertainties may cause actual results to differ materially from those in forward-looking statements. Forward-looking statements speak only as of the date they are made. Disclaimer |
This Management Presentation forms part of a package of information about the companys results. It should be read in conjunction with the other parts of this package, including Managements Analysis of Results, a Media Release and a Financial Report. Definitions Financial Measures US GAAP equivalents EBIT and EBIT Margin EBIT, as used in this document, is equivalent to the US GAAP measure of operating income. EBIT margin is defined as E BIT as a percentage of net sales. We believe EBIT and EBIT margin to be relevant and useful information as these are the primary measures used by our management to measure the operating profit or loss of our business. EBIT is one of several metrics used by our management to measure the earnings generated from our operations, excluding interest and income tax expenses. Additionally, EBIT is believed to be a primary measure and terminology used by our Australian investors. EBIT and EBIT margin should be consi dered in addition to, but not as a substitute for, other measures of financial performance reported in accordance with accounting principles generally accepted in the United States of America. EBIT and EBIT margin, as we have defined them, may not be comparable to similarly titled measures reported by other companies. Operating profit is equivalent to the US GAAP measure of income. Net operating profit is equivalent to the US GAAP measure of net income. Sales Volumes mmsf million square feet msf thousand square feet Endnotes |
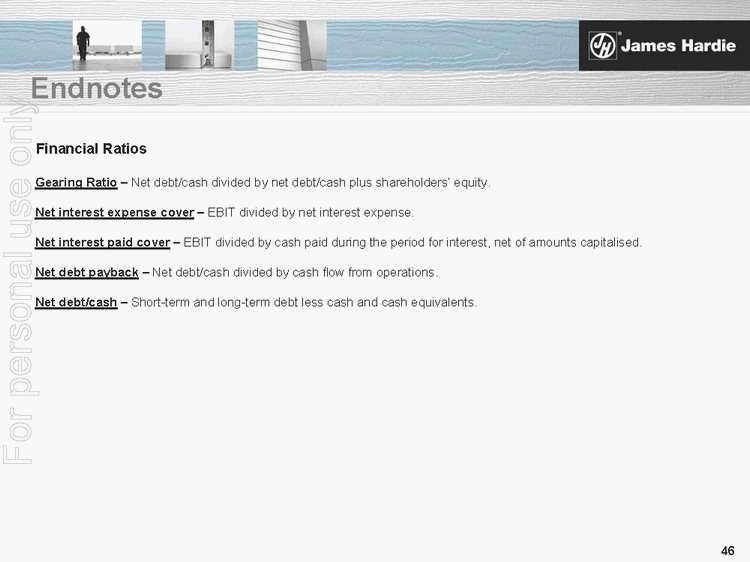
Financial Ratios Gearing Ratio Net debt/cash divided by net debt/cash plus shareholders equity. Net interest expense cover EBIT divided by net interest expense. Net interest paid cover EBIT divided by cash paid during the period for interest, net of amounts capitalised. Net debt payback Net debt/cash divided by cash flow from operations. Net debt/cash Short-term and long-term debt less cash and cash equivalents. Endnotes |
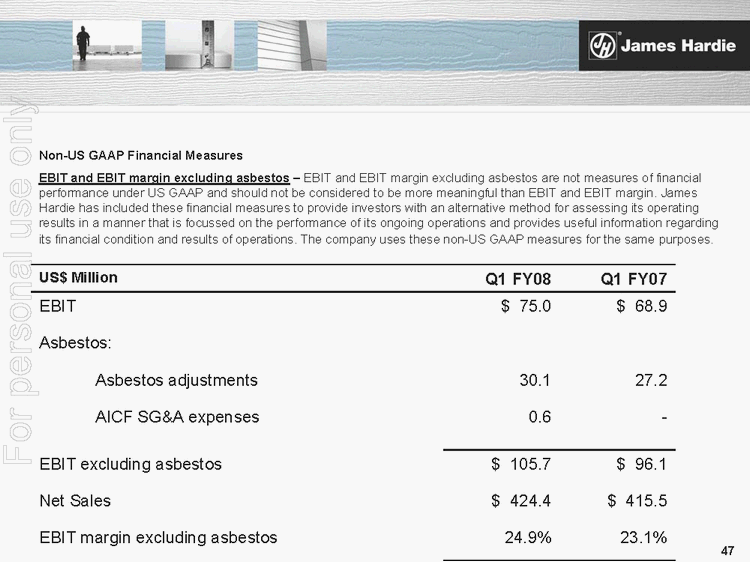
Non-US GAAP Financial Measures EBIT and EBIT margin excluding asbestos EBIT and EBIT margin excluding asbestos are not measures of financial performance under US GAAP and should not be considered to be more meaningful than EBIT and EBIT margin. James Hardie has included these financial measures to provide investors with an alternative method for assessing its operating results in a manner that is focussed on the performance of its ongoing operations and provides useful information regarding its financial condition and results of operations. The company uses these non-US GAAP measures for the same purposes. US$ Million Q1 FY08 Q1 FY07 EBIT $ 75.0 $ 68.9 Asbestos: Asbestos adjustments 30.1 27.2 AICF SG&A expenses 0.6 EBIT excluding asbestos $ 105.7 $ 96.1 Net Sales $ 424.4 $ 415.5 EBIT margin excluding asbestos 24.9% 23.1% |
Non-US GAAP Financial Measures (continued) Net operating profit excluding asbestos- Net operating profit excluding asbestos is not a measure of financial performance under US GAAP and should not be considered to be more meaningful than net income. The company has included this financial measure to provide investors with an alternative method for assessing its operating results in a manner that is focussed on the performance of its ongoing operations. The c ompany uses this non-US GAAP measure for the same purposes. US$ Million Q1 FY08 Q1 FY07 Net operating profit $ 39.1 $ 35.5 Asbestos: Asbestos adjustments 30.1 27.2 AICF SG&A expenses 0.6 AICF interest income (1.6) Tax expense related to asbestos adjustments 0.4 Net operating profit excluding asbestos $ 68.6 $ 62.7 |
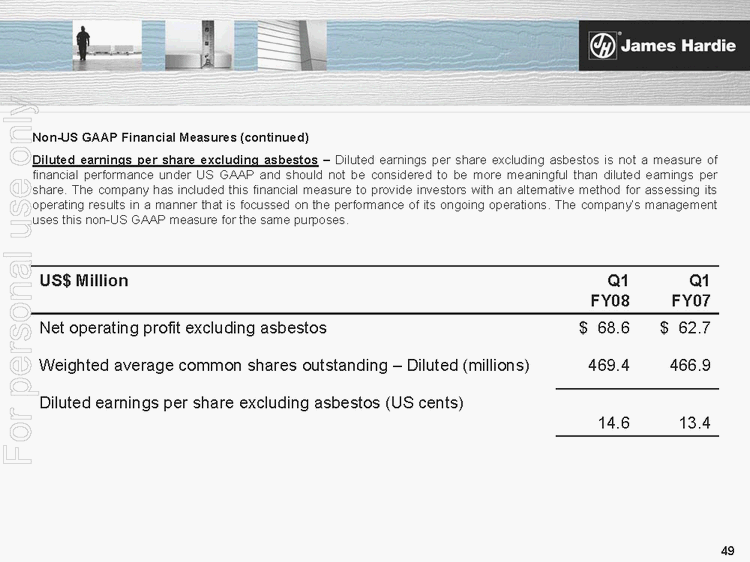
Non-US GAAP Financial Measures (continued) Diluted earnings per share excluding asbestos Diluted earnings per share excluding asbestos is not a measure of financial performance under US GAAP and should not be considered to be more meaningful than diluted earnings per share. The company has included this financial measure to provide investors with an alternative method for assessing its operating results in a manner that is focussed on the performanc e of its ongoing operations. The companys management uses this non-US GAAP measure for the same purposes. US$ Million Q1 FY08 Q1 FY07 Net operating profit excluding asbestos $ 68.6 $ 62.7 Weighted average common shares outstanding Diluted (millions) 469.4 466.9 Diluted earnings per share excluding asbestos (US cents) 14.6 13.4 |
UBS London Conference September 2007 In this Management Presentation, James Hardie may present the financial measures, sales volume terms, financial ratios, and Non-US GAAP financial measures included in the Endnotes section of this document starting on page 45. The company presents financial measures that it believes are customarily used by its Australian investors. Specifically, these financial measures include EBIT and EBIT margin ;. The company may also present other terms for measuring its sales volumes (million square feet (mmsf)); and Non-US GAAP financial measures (EBIT and EBIT margin excluding adjustments to asbestos adjustments, SCI and other related expense, and impairment of roofing plant). Unless otherwise stated, results are for continuing operations only. |