Exhibit 99.1
Results for Announcement to the Market
James Hardie Industries N.V.
ARBN 097 829 895
Appendix 4D — Half Year Ended 30 September 2007
| |
|
|
|
|
|
|
|
|
|
|
|
|
|
|
|
|
| Key Information |
|
Half Year Ended 30 September |
| |
|
2007 |
|
2006 |
|
|
| |
|
US$M |
|
US$M |
|
Movement |
Net Sales From Ordinary Activities |
|
|
814.5 |
|
|
|
826.9 |
|
|
down |
|
|
1 |
% |
Operating Profit After Tax Attributable
to Shareholders |
|
|
58.2 |
|
|
|
56.6 |
|
|
up |
|
|
3 |
% |
Operating Profit Attributable to Shareholders |
|
|
58.2 |
|
|
|
56.6 |
|
|
up |
|
|
3 |
% |
Net Tangible Assets per Ordinary Share |
|
US$ |
0.24 |
|
|
US$ |
0.30 |
|
|
|
|
|
|
|
|
|
Dividend Information
| • |
|
An interim dividend of US12.0 cents per share/CUFS is payable to share/CUFS holders on
18 December 2007. A dividend of US15.0 cents per share/CUFS was paid on 10 July 2007. |
| |
| • |
|
Record Date is 4 December 2007 to determine entitlements to the interim dividend (ie, on
the basis of proper instruments of transfer received by the Company’s registrar, Computershare
Investor Services Pty Ltd, Level 3, 60 Carrington Street, Sydney NSW 2000, Australia, by
5:00pm if securities are not CHESS approved, or security holding balances established by
5:00pm or such later time permitted by ASTC Operating Rules if securities are CHESS approved). |
| |
| • |
|
This dividend and future dividends will be unfranked for Australian taxation purposes. |
| |
| • |
|
This dividend is subject to Dutch withholding tax of 15%. |
| |
| • |
|
The Australian currency equivalent amount of dividend to be paid to CUFS holders will be
announced to the ASX on [5] December
2007. |
| |
| • |
|
No dividend reinvestment plans are available for this dividend. |
Movements in Controlled Entities during the half year ended 30 September
2007
The following entities were liquidated: James Hardie US Holdings, Inc. (9
August 2007) and James Hardie Building Products LLC (9 August 2007).
Review
The results and financial information included within this half year report
have been prepared using USGAAP and have been subject to an independent review by
external auditors.
Results for the 2nd Quarter and half year ended 30 September 2007
Contents
| |
1. |
|
Media Release |
| |
| |
2. |
|
Management’s Analysis of Results |
| |
| |
3. |
|
Consolidated Financial Statements |
| |
| |
4. |
|
Management Presentation |
James Hardie Industries N.V. is incorporated in
The Netherlands with corporate seat in Amsterdam. The liability of members is
limited
The information contained in the above documents comprise the information
required by ASX Listing Rule 4.2A and should be read in conjunction with the
James Hardie 2007 Annual Report which can be found on the company website at
www.jameshardie.com
|
|
|
| 19 November 2007
|
|
For analyst enquiries please call Steve Ashe on:
|
|
|
|
Tel: (02) 8274 5246 Mob: 0408 164 011. |
2nd quarter net operating profit US$46.5m
Half year net operating profit US$115.1m
(both excluding asbestos)
James Hardie today announced a US$46.5 million net operating profit, excluding asbestos,
for the quarter ended 30 September 2007, a decrease of 32% compared to the same period last
year.
For the quarter, net operating profit including asbestos was US$19.1 million compared to a
net operating profit of US$21.1 million for the same quarter last year.
For the half year, net operating profit excluding asbestos decreased 12% to US$115.1 million
from US$131.0 million. Including asbestos, net operating profit increased 3% to US$58.2
million.
Operating Performance
Second quarter net sales decreased 5% to US$390.1 million, gross profit was down 11% to
US$138.8 million and EBIT excluding asbestos decreased 15% to US$74.7 million. EBIT including
asbestos increased 9% from US$41.0 million to US$44.7 million.
For the half year, net sales decreased 1% to US$814.5 million, gross profit was down 2% to
US$305.7 million and EBIT excluding asbestos decreased 2% to US$180.4 million. EBIT including
asbestos increased 9% from US$109.9 million to US$119.7 million.
Housing construction activity in our major markets continued to weaken during the quarter,
with new construction in the United States, our largest market, significantly below the level
of activity in the same quarter last year. Our USA Fibre Cement business again partly offset
the impact of the weaker market through market share gains and a higher average net sales
price. Net sales fell 9% for the quarter and 5% for the half year. EBIT was down 14% to
US$84.3 million and 1% to US$198.7 million for the quarter and half year respectively, due to
lower volumes and higher costs in the second quarter.
Despite weaker market conditions in Australia, Asia Pacific Fibre Cement net sales were up
19% for the quarter due to increased demand for fibre cement, a higher average net sales
price and the strength of the Australian dollar against the US dollar. Asia Pacific Fibre
Cement EBIT increased 8% to US$12.4 million for the quarter and 14% to US$24.8 million for
the half year due to improved operating performance in the Australia and New Zealand Fibre
Cement businesses and favourable currency movements.
In this Media Release, James Hardie may present financial measures, sales volume terms,
financial ratios, and Non-US GAAP financial measures included in the Definitions section of
this document starting on page 7. The company presents financial measures that it believes
are customarily used by its Australian investors. Specifically, these financial measures, for
which reconciliations to GAAP measures follow such definitions, include “EBIT”, “EBIT
margin”, “Operating profit” and “Net operating profit”. The company may also present other
terms for measuring its sales volumes (“million square feet (mmsf)” and “thousand square feet
(msf)”); financial ratios (“Gearing ratio”, “Net interest expense cover”, “Net interest paid
cover”, “Net debt payback”, “Net debt/cash”); and Non-US GAAP financial measures (“EBIT and
EBIT margin excluding asbestos”, “Net operating profit excluding asbestos”, “Diluted earnings
per share excluding asbestos”, “Operating profit before income taxes excluding asbestos”,
“Income tax expense excluding asbestos”, “Effective tax rate excluding asbestos”, and
“EBITDA”). Unless otherwise stated, results and comparisons are of the 2nd
quarter and 1st half of the current fiscal year versus the 2nd
quarter and 1st half of the prior fiscal year.
|
|
|
| Media Release: James Hardie
— 2nd Quarter and Half Year FY08
|
|
1 |
Diluted earnings per share for the quarter fell to US4.1 cents per share from US4.5
cents in the same period last year and increased by 2% from US12.1 cents to US12.4 cents for
the half year.
Diluted earnings per share excluding asbestos decreased by 32% from US14.7 cents to US10.0
cents for the quarter and decreased by 12% from US28.1 cents to US24.6 cents for the half
year.
2nd Quarter and Half Year at a Glance
| |
|
|
|
|
|
|
|
|
|
|
|
|
|
|
|
|
|
|
|
|
|
|
|
|
| US$ Million |
|
Q2 |
|
|
Q2 |
|
|
% |
|
|
HY |
|
|
HY |
|
|
% |
|
| |
|
FY 2008 |
|
|
FY 2007 |
|
|
Change |
|
|
FY 2008 |
|
|
FY 2007 |
|
|
Change |
|
Net sales |
|
$ |
390.1 |
|
|
$ |
411.4 |
|
|
|
(5 |
) |
|
$ |
814.5 |
|
|
$ |
826.9 |
|
|
|
(1 |
) |
Gross profit |
|
|
138.8 |
|
|
|
155.2 |
|
|
|
(11 |
) |
|
|
305.7 |
|
|
|
312.9 |
|
|
|
(2 |
) |
SCI and other related expenses |
|
|
— |
|
|
|
(3.2 |
) |
|
|
— |
|
|
|
— |
|
|
|
(5.6 |
) |
|
|
— |
|
EBIT excluding asbestos |
|
|
74.7 |
|
|
|
88.2 |
|
|
|
(15 |
) |
|
|
180.4 |
|
|
|
184.3 |
|
|
|
(2 |
) |
AICF SG&A expenses |
|
|
(1.1 |
) |
|
|
— |
|
|
|
— |
|
|
|
(1.7 |
) |
|
|
— |
|
|
|
— |
|
Asbestos adjustments |
|
|
(28.9 |
) |
|
|
(47.2 |
) |
|
|
39 |
|
|
|
(59.0 |
) |
|
|
(74.4 |
) |
|
|
21 |
|
EBIT |
|
|
44.7 |
|
|
|
41.0 |
|
|
|
9 |
|
|
|
119.7 |
|
|
|
109.9 |
|
|
|
9 |
|
Net interest income (expense) |
|
|
2.0 |
|
|
|
1.0 |
|
|
|
— |
|
|
|
2.5 |
|
|
|
(1.0 |
) |
|
|
— |
|
Income tax expense |
|
|
(27.6 |
) |
|
|
(20.9 |
) |
|
|
(32 |
) |
|
|
(64.0 |
) |
|
|
(53.2 |
) |
|
|
(20 |
) |
Net operating profit |
|
|
19.1 |
|
|
|
21.1 |
|
|
|
(9 |
) |
|
|
58.2 |
|
|
|
56.6 |
|
|
|
3 |
|
| |
Net operating profit excluding asbestos decreased 32% for the quarter to US$46.5
million and was 12% lower for the half year at US$115.1 million, as shown in the following
table:
| |
|
|
|
|
|
|
|
|
|
|
|
|
|
|
|
|
|
|
|
|
|
|
|
|
| US$ Million |
|
Q2 |
|
|
Q2 |
|
|
% |
|
|
HY |
|
|
HY |
|
|
% |
|
| |
|
FY 2008 |
|
|
FY 2007 |
|
|
Change |
|
|
FY 2008 |
|
|
FY 2007 |
|
|
Change |
|
Net operating profit |
|
$ |
19.1 |
|
|
$ |
21.1 |
|
|
|
(9 |
) |
|
$ |
58.2 |
|
|
$ |
56.6 |
|
|
|
3 |
|
Asbestos: |
|
|
|
|
|
|
|
|
|
|
|
|
|
|
|
|
|
|
|
|
|
|
|
|
Asbestos adjustments |
|
|
28.9 |
|
|
|
47.2 |
|
|
|
(39 |
) |
|
|
59.0 |
|
|
|
74.4 |
|
|
|
(21 |
) |
AICF SG&A expenses |
|
|
1.1 |
|
|
|
— |
|
|
|
— |
|
|
|
1.7 |
|
|
|
— |
|
|
|
— |
|
AICF interest income |
|
|
(2.6 |
) |
|
|
— |
|
|
|
— |
|
|
|
(4.2 |
) |
|
|
— |
|
|
|
— |
|
Tax expense related to asbestos
adjustments |
|
|
— |
|
|
|
— |
|
|
|
— |
|
|
|
0.4 |
|
|
|
— |
|
|
|
— |
|
| |
|
|
Net operating profit excluding asbestos |
|
$ |
46.5 |
|
|
$ |
68.3 |
|
|
|
(32 |
) |
|
$ |
115.1 |
|
|
$ |
131.0 |
|
|
|
(12 |
) |
| |
Commentary
James Hardie’s CEO, Mr Louis Gries said: “Our major businesses experienced a further
deterioration in market conditions during the second quarter, but they continued to perform
well and helped produce a solid half year operating result with EBIT down only 2%, excluding
asbestos.
“Sales in our USA Fibre Cement business were again affected by the down-turn in US housing
activity, but it continued to take market share from alternative materials and outperform
the broader market.
|
|
|
| Media Release: James Hardie
— 2nd Quarter and Half Year FY08
|
|
2 |
“The outlook for North America is for further weakness in new housing activity at least
through the remainder of this fiscal year. We recently announced the suspension of
operations at our Blandon, Pennsylvania, facility and we believe that this, together with
our earlier business reset, positions us well to address the weaker market conditions.
“Our Asia Pacific Fibre Cement business performed very well in the first half, also
outperforming the broader market and growing both sales and EBIT. Its range of
differentiated products is helping to grow demand for fibre cement in Australia and New
Zealand,” Mr Gries said.
Dividend
The company today announced an interim dividend of US12 cents a share. The dividend was
declared in US currency and will be paid on 18 December 2007, with a record date of 4
December 2007. The Australian currency equivalent of the dividend to be paid to CUFS holders
will be announced to the ASX on that date. ADR holders will receive their dividend in US
currency.
Share Repurchase Program
On 15 August 2007, the company announced a share repurchase program of up to 10% of the
company’s issued capital, approximately 46.8 million shares. The company had repurchased
approximately 7.5 million shares of common stock having an aggregate cost of A$54.0 million
(US$47.1 million) as at 30 September 2007. During the period between 1 October 2007 and 12
October 2007, the company repurchased approximately 4.2 million shares of common stock having
an aggregate cost of A$30.8 million (US$27.1 million). The company plans to repurchase shares
periodically, depending on market conditions.
USA Fibre Cement
Second quarter net sales were down 9% compared to the same quarter last year, to US$308.0
million. Sales volume decreased 11% to 511.7 million square feet, and the average net sales
price was 2% higher at US$602 per thousand square feet.
For the half year, net sales were down 5% compared to the same period last year, to US$654.1
million. Sales volume decreased 8% to 1,085.1 million square feet, and the average net sales
price was 3% higher at US$603 per thousand square feet.
The residential construction market weakened further during the quarter due to high inventory
levels of new houses for sale and affordability issues associated with higher interest rates
and tightened lending standards in the mortgage market. Repair and remodelling activity was
slightly weaker compared to the same quarter last year.
Geographically, the Western Division continued to perform well, but sales were down for all
divisions against the same quarter last year. Market penetration against alternative
materials and a higher average net sales price again helped partly offset the impact of the
weaker market. There was moderate sales growth in our ColorPlus® collection of products,
XLD® trim and Hardiebacker™ 500 underlayment, but sales of other higher-priced,
differentiated products decreased compared to the same period last year. Sales in our
interior products category were slightly lower compared to the same quarter last year.
EBIT for the quarter was 14% lower at US$84.3 million, primarily due to lower volume and
higher manufacturing costs, partly offset by lower SG&A spending compared to the same quarter
last year. The EBIT margin was 27.4%. For the half year, EBIT was 1% lower at US$198.7
million and the EBIT margin was 30.4%.
|
|
|
| Media Release: James Hardie
— 2nd Quarter and Half Year FY08
|
|
3 |
Asia Pacific Fibre Cement
Net sales increased 19% to US$76.1 million for the quarter. In Australian dollars, net sales
increased 7% due to a 4% increase in sales volumes and a 3% increase in the average
Australian dollar net sales price.
For the half year net sales increased 20% to US$147.3 million. In Australian dollars, net
sales increased 7% due to a 5% increase in sales volumes and a 2% increase in the average
Australian dollar net sales price.
Residential construction activity was slightly weaker in Australia, flat in New Zealand and
stronger in the Philippines compared to the same quarter last year. In Australia, the
business continued to grow demand for fibre cement and increase market share through
increased sales of its Scyon™ product range. In New Zealand, continuing strong growth in
sales of Linea™ weatherboards helped the business increase market share. In the Philippines,
net sales increased due mainly to higher domestic prices and an increased proportion of
export sales in the sales mix.
EBIT was 8% higher for the quarter at US$12.4 million and 14% higher at US$24.8 million for
the half year due to the improved sales performance together with the increase in the
Australian dollar against the US dollar. The EBIT margin was 16.4% for the quarter and 16.8%
for the half year.
USA Hardie Pipe
Net sales for the quarter and half year decreased compared to the same periods last year due
to the impact of weaker residential and non-residential construction activity in Florida,
partly offset by an increase in the average net sales price. The business is continuing to
focus on growing sales in its core markets and expanding into other strategic markets. A
small negative EBIT was recorded for the quarter and half year.
Europe Fibre Cement
Sales continued to grow steadily during the quarter. EBIT losses for the quarter and half
year were materially reduced compared to the same periods last year.
Asbestos Adjustments
The effect of asbestos adjustments on EBIT for the quarter and half year ended 30 September
2007 are as follows:
| |
|
|
|
|
|
|
|
|
|
|
|
|
|
|
|
|
| US$ Million |
|
Q2 FY 2008 |
|
|
Q2 FY 2007 |
|
|
HY FY 2008 |
|
|
HY FY 2007 |
|
| |
Effect of foreign exchange |
|
$ |
(27.0 |
) |
|
$ |
(5.4 |
) |
|
$ |
(60.2 |
) |
|
$ |
(32.6 |
) |
Other adjustments |
|
|
(1.9 |
) |
|
|
(41.8 |
) |
|
|
1.2 |
|
|
|
(41.8 |
) |
| |
|
|
Asbestos adjustments to EBIT |
|
$ |
(28.9 |
) |
|
$ |
(47.2 |
) |
|
$ |
(59.0 |
) |
|
$ |
(74.4 |
) |
| |
|
|
Readers are referred to Note 6 of the company’s 30 September 2007 Consolidated Financial
Statements for further information on the asbestos adjustments.
|
|
|
| Media Release: James Hardie
— 2nd Quarter and Half Year FY08
|
|
4 |
ASIC Proceedings
In February 2007, the Australian Securities and Investments Commission (ASIC) commenced civil
proceedings against JHI NV, a former subsidiary and ten former officers and directors of the
James Hardie group. The civil proceedings concern alleged contraventions of certain
provisions of the Corporations Law and/or the Corporations Act connected with the affairs of
the company and certain subsidiaries during the period February 2001 to June 2003.
The company has considered the impact of the ASIC proceedings upon its current financial
statements and believes that these proceedings will have no material impact. However, there
remains considerable uncertainty surrounding the likely outcome of the ASIC proceedings in
the longer term and there is a possibility that the related costs to the company could become
material. At this stage it is not possible to determine the amount of any such liability.
Readers are referred to Note 7 of the company’s 30 September 2007 Consolidated Financial
Statements for further information on the ASIC Proceedings.
Cash Flow
Operating cash flow for the half year ended 30 September 2007 increased from a utilisation of
US$22.3 million to cash provided of US$231.0 million. The increase was driven primarily by
the payment of the initial ATO deposit during the six months ended 30 September 2006
totalling US$141.4 million, compared to a US$3.7 million payment in the current half year.
In addition, the increase was driven by an increased focus on working capital management
throughout the half year. Capital expenditures for the purchase of property, plant and
equipment decreased from US$61.4 million to US$24.2 million.
Outlook
In North America, the outlook for residential construction activity is for some further
weakness through to at least the end of this fiscal year. There is still a large backlog of
new houses for sale and indicators of future activity such as housing permits and builder
confidence all suggest that a recovery is not likely in the near-term.
Further adjustments are being made to the US business with the suspension of operations at
our Blandon, Pennsylvania plant and this, together with the earlier business reset in late
2006 and early 2007, are expected to keep the company well-positioned for dealing with the
weaker market conditions. The business is now being set on the basis that new housing starts
will be at an annual rate of 1.1 million, down from the earlier assumption of 1.3 million
starts.
The business is continuing to focus on increasing primary demand for fibre cement and growing
its market share in both the exterior and interior product categories to help reduce the
impact of weaker housing construction activity. Cost pressures, particularly from higher
input material costs are expected to remain in the second half of this fiscal year.
In our Asia Pacific business, some further weakening in market conditions is expected in
Australia and New Zealand over the short-term, but conditions in the Philippines are expected
to remain healthy. The business is continuing to focus on market initiatives around its
differentiated product range to grow primary demand. Further manufacturing efficiencies and
cost savings are expected. Non-differentiated products are expected to remain subject to
strong competitive pressures.
We note the range of analysts’ forecasts for operating profit from continuing operations,
excluding asbestos and the Blandon, Pennsylvania plant impairment cost, for the year ended 31
March 2008 of between US$181 million and US$207 million. The company is comfortable with the
bottom end of this range, but notes there is still a significant amount of uncertainty over
the outlook for US housing activity.
|
|
|
| Media Release: James Hardie
— 2nd Quarter and Half Year FY08
|
|
5 |
Changes to the Amended FFA liability to reflect changes in foreign exchange rates or updates
to the actuarial estimate may have a material impact on the company’s consolidated financial
statements. Refer to Note 6 of the company’s 30 September 2007 Consolidated Financial
Statements for more information.
END
Media/Analyst Enquiries:
Steve Ashe
Vice President Investor Relations
| |
|
|
Telephone:
|
|
61 2 8274 5246 |
Mobile:
|
|
61 408 164 011 |
Email:
|
|
[email protected] |
Facsimile:
|
|
61 2 8274 5218 |
This Media Release forms part of a package of information about the company’s results. It
should be read in conjunction with the other parts of the package, including Management’s
Analysis of Results, a Management Presentation and a Financial Report.
These documents, along with an audio-cast of the management presentation on 19 November
2007, are available from the Investor Relations area of James Hardie’s website at:
www.jameshardie.com
The company lodged its annual filing for the year ended 31 March 2007 with the SEC on 6 July
2007.
All holders of the company’s securities may receive, on request, a hard copy of our complete
audited financial statements, free of charge. Requests can be made via the company website
or by contacting one of the company’s corporate offices. Contact details are available on
the company’s website.
|
|
|
| Media Release: James Hardie
— 2nd Quarter and Half Year FY08
|
|
6 |
Definitions
Financial Measures — US GAAP equivalents
EBIT and EBIT margin — EBIT, as used in this document, is equivalent to the US
GAAP measure of operating income. EBIT margin is defined as EBIT as a percentage of net
sales. James Hardie believes EBIT and EBIT margin to be relevant and useful information as
these are the primary measures used by management to measure the operating profit or loss of
its business. EBIT is one of several metrics used by management to measure the earnings
generated by the company’s operations, excluding interest and income tax expenses.
Additionally, EBIT is believed to be a primary measure and terminology used by its Australian
investors. EBIT and EBIT margin should be considered in addition to, but not as a substitute
for, other measures of financial performance reported in accordance with accounting
principles generally accepted in the United States of America. EBIT and EBIT margin, as the
company has defined them, may not be comparable to similarly titled measures reported by
other companies.
Operating profit — is equivalent to the US GAAP measure of income.
Net operating profit — is equivalent to the US GAAP measure of net income.
Sales Volumes
mmsf — million square feet, where a square foot is defined as a standard square
foot of 5/16” thickness.
msf — thousand square feet, where a square foot is defined as a standard square foot
of 5/16” thickness.
Financial Ratios
Gearing Ratio — Net debt/cash divided by net debt/cash plus shareholders’
equity.
Net interest expense cover — EBIT divided by net interest expense.
Net interest paid cover — EBIT divided by cash paid during the period for interest,
net of amounts capitalised.
Net debt payback — Net debt/cash divided by cash flow from operations.
Net debt/cash — short-term and long-term debt less cash and cash equivalents.
|
|
|
| Media Release: James Hardie
— 2nd Quarter and Half Year FY08
|
|
7 |
Non-US GAAP Financial Measures
EBIT and EBIT margin excluding asbestos — EBIT and EBIT margin excluding
asbestos are not measures of financial performance under US GAAP and should not be considered
to be more meaningful than EBIT and EBIT margin. James Hardie has included these financial
measures to provide investors with an alternative method for assessing its operating results
in a manner that is focussed on the performance of its ongoing operations and provides useful
information regarding its financial condition and results of operations. The company uses
these non-US GAAP measures for the same purposes.
| |
|
|
|
|
|
|
|
|
|
|
|
|
|
|
|
|
| US$ Millions |
|
Q2 |
|
|
Q2 |
|
|
HY |
|
|
HY |
|
| |
|
FY08 |
|
|
FY07 |
|
|
FY08 |
|
|
FY07 |
|
| |
EBIT |
|
$ |
44.7 |
|
|
$ |
41.0 |
|
|
$ |
119.7 |
|
|
$ |
109.9 |
|
Asbestos: |
|
|
|
|
|
|
|
|
|
|
|
|
|
|
|
|
Asbestos adjustments |
|
|
28.9 |
|
|
|
47.2 |
|
|
|
59.0 |
|
|
|
74.4 |
|
AICF SG&A expenses |
|
|
1.1 |
|
|
|
— |
|
|
|
1.7 |
|
|
|
— |
|
| |
|
|
EBIT excluding asbestos |
|
$ |
74.7 |
|
|
$ |
88.2 |
|
|
$ |
180.4 |
|
|
$ |
184.3 |
|
Net Sales |
|
$ |
390.1 |
|
|
$ |
411.4 |
|
|
$ |
814.5 |
|
|
$ |
826.9 |
|
EBIT margin
excluding asbestos |
|
|
19.1 |
% |
|
|
21.4 |
% |
|
|
22.1 |
% |
|
|
22.3 |
% |
| |
|
|
Net operating profit excluding asbestos — Net operating profit excluding
asbestos is not a measure of financial performance under US GAAP and should not be considered
to be more meaningful than net income. The company has included this financial measure to
provide investors with an alternative method for assessing its operating results in a manner
that is focussed on the performance of its ongoing operations. The company uses this non-US
GAAP measure for the same purposes.
| |
|
|
|
|
|
|
|
|
|
|
|
|
|
|
|
|
| US$ Millions |
|
Q2 |
|
|
Q2 |
|
|
HY |
|
|
HY |
|
| |
|
FY08 |
|
|
FY07 |
|
|
FY08 |
|
|
FY07 |
|
| |
Net operating profit |
|
$ |
19.1 |
|
|
$ |
21.1 |
|
|
$ |
58.2 |
|
|
$ |
56.6 |
|
Asbestos: |
|
|
|
|
|
|
|
|
|
|
|
|
|
|
|
|
Asbestos adjustments |
|
|
28.9 |
|
|
|
47.2 |
|
|
|
59.0 |
|
|
|
74.4 |
|
AICF SG&A expenses |
|
|
1.1 |
|
|
|
— |
|
|
|
1.7 |
|
|
|
— |
|
AICF interest income |
|
|
(2.6 |
) |
|
|
— |
|
|
|
(4.2 |
) |
|
|
— |
|
Tax expense related to asbestos adjustments |
|
|
— |
|
|
|
— |
|
|
|
0.4 |
|
|
|
— |
|
| |
|
|
Net operating profit excluding asbestos |
|
$ |
46.5 |
|
|
$ |
68.3 |
|
|
$ |
115.1 |
|
|
$ |
131.0 |
|
| |
|
|
Diluted earnings per share excluding asbestos — Diluted earnings per share
excluding asbestos is not a measure of financial performance under US GAAP and should not be
considered to be more meaningful than diluted earnings per share. The company has included
this financial measure to provide investors with an alternative method for assessing its
operating results in a manner that is focussed on the performance of its ongoing operations.
The company’s management uses this non-US GAAP measure for the same purposes.
| |
|
|
|
|
|
|
|
|
|
|
|
|
|
|
|
|
| US$ Millions |
|
Q2 |
|
|
Q2 |
|
|
HY |
|
|
HY |
|
| |
|
FY08 |
|
|
FY07 |
|
|
FY08 |
|
|
FY07 |
|
| |
Net operating profit excluding asbestos |
|
$ |
46.5 |
|
|
$ |
68.3 |
|
|
$ |
115.1 |
|
|
$ |
131.0 |
|
Weighted average common shares outstanding — diluted
(millions) |
|
|
468.3 |
|
|
|
465.1 |
|
|
|
468.5 |
|
|
|
466.0 |
|
| |
|
|
Diluted earnings per share excluding asbestos (US cents) |
|
|
10.0 |
|
|
|
14.7 |
|
|
|
24.6 |
|
|
|
28.1 |
|
| |
|
|
|
|
|
| Media Release: James Hardie — 2nd Quarter and Half Year FY08
|
|
8 |
Effective tax rate excluding asbestos — Effective tax rate excluding asbestos
is not a measure of financial performance under US GAAP and should not be considered to be
more meaningful than effective tax rate. The company has included this financial measure to
provide investors with an alternative method for assessing its operating results in a manner
that is focussed on the performance of its ongoing operations. The company’s management uses
this non-US GAAP measure for the same purposes.
| |
|
|
|
|
|
|
|
|
|
|
|
|
|
|
|
|
| US$ Millions |
|
Q2 |
|
|
Q2 |
|
|
HY |
|
|
HY |
|
| |
|
FY08 |
|
|
FY07 |
|
|
FY08 |
|
|
FY07 |
|
| |
Operating profit before income taxes |
|
$ |
46.7 |
|
|
$ |
42.0 |
|
|
$ |
122.2 |
|
|
$ |
108.9 |
|
Asbestos: |
|
|
|
|
|
|
|
|
|
|
|
|
|
|
|
|
Asbestos adjustments |
|
|
28.9 |
|
|
|
47.2 |
|
|
|
59.0 |
|
|
|
74.4 |
|
AICF SG&A expenses |
|
|
1.1 |
|
|
|
— |
|
|
|
1.7 |
|
|
|
— |
|
AICF interest income |
|
|
(2.6 |
) |
|
|
— |
|
|
|
(4.2 |
) |
|
|
— |
|
| |
|
|
Operating profit before income taxes
excluding asbestos |
|
$ |
74.1 |
|
|
$ |
89.2 |
|
|
$ |
178.7 |
|
|
$ |
183.3 |
|
| |
|
|
Income tax expense |
|
$ |
27.6 |
|
|
$ |
20.9 |
|
|
$ |
64.0 |
|
|
$ |
53.2 |
|
Asbestos: |
|
|
|
|
|
|
|
|
|
|
|
|
|
|
|
|
Tax expense related to asbestos adjustments |
|
|
— |
|
|
|
— |
|
|
|
(0.4 |
) |
|
|
— |
|
| |
|
|
Income tax expense excluding asbestos |
|
$ |
27.6 |
|
|
$ |
20.9 |
|
|
$ |
63.6 |
|
|
$ |
53.2 |
|
| |
|
|
Effective tax rate excluding asbestos |
|
|
37.2 |
% |
|
|
23.4 |
% |
|
|
35.6 |
% |
|
|
29.0 |
% |
| |
|
|
EBITDA — is not a measure of financial performance under US GAAP and should not
be considered an alternative to, or more meaningful than, income from operations, net income
or cash flows as defined by US GAAP or as a measure of profitability or liquidity. Not all
companies calculate EBITDA in the same manner as James Hardie has and, accordingly, EBITDA
may not be comparable with other companies. The company has included information concerning
EBITDA because it believes that this data is commonly used by investors to evaluate the
ability of a company’s earnings from its core business operations to satisfy its debt,
capital expenditure and working capital requirements.
| |
|
|
|
|
|
|
|
|
|
|
|
|
|
|
|
|
| US$ Millions |
|
Q2 |
|
|
Q2 |
|
|
HY |
|
|
HY |
|
| |
|
FY08 |
|
|
FY07 |
|
|
FY08 |
|
|
FY07 |
|
| |
EBIT |
|
$ |
44.7 |
|
|
$ |
41.0 |
|
|
$ |
119.7 |
|
|
$ |
109.9 |
|
Depreciation and amortisation |
|
|
13.5 |
|
|
|
13.2 |
|
|
|
27.7 |
|
|
|
24.2 |
|
| |
|
|
EBITDA |
|
$ |
58.2 |
|
|
$ |
54.2 |
|
|
$ |
147.4 |
|
|
$ |
134.1 |
|
| |
|
|
|
|
|
| Media Release: James Hardie — 2nd Quarter and Half Year FY08
|
|
9 |
Disclaimer
This Media Release contains forward-looking statements. We may from time to time make
forward-looking statements in our periodic reports filed with or furnished to the United
States Securities and Exchange Commission on Forms 20-F and 6-K, in our annual reports to
shareholders, in offering circulars, invitation memoranda and prospectuses, in media releases
and other written materials and in oral statements made by our officers, directors or
employees to analysts, institutional investors, lenders and potential lenders,
representatives of the media and others. Examples of forward-looking statements include:
| • |
|
expectations about the timing and amount of payments to the Asbestos Injuries
Compensation Fund (AICF), a special purpose fund for the compensation of proven
asbestos-related personal injury and death claims; |
| |
| • |
|
expectations with respect to the effect on our financial statements of those
payments; |
| |
| • |
|
statements as to the possible consequences of proceedings brought against us and
certain of our former directors and officers by the Australian Securities and Investments
Commission; |
| |
| • |
|
expectations that our credit facilities will be extended or renewed; |
| |
| • |
|
projections of our operating results or financial condition; |
| |
| • |
|
statements regarding our plans, objectives or goals, including those relating to
competition, acquisitions, dispositions and our products; |
| |
| • |
|
statements about our future performance; |
| |
| • |
|
statements about product or environmental liabilities; and |
| |
| • |
|
statements regarding tax liabilities and related proceedings. |
Words such as “believe,” “anticipate,” “plan,” “expect,” “intend,” “target,” “estimate,”
“project,” “predict,” “forecast,” “guideline,” “should,” “aim” and similar expressions are
intended to identify forward-looking statements but are not the exclusive means of
identifying such statements.
Forward-looking statements involve inherent risks and uncertainties. We caution you that a
number of important factors could cause actual results to differ materially from the plans,
objectives, expectations, estimates and intentions expressed in such forward-looking
statements. These factors, some of which are discussed under “Risk Factors” beginning on page
6 of our Form 20-F filed on 6 July 2007 with the Securities and Exchange Commission, include
but are not limited to: all matters relating to or arising out of the prior manufacture of
products that contained asbestos by current and former James Hardie subsidiaries; required
contributions to the AICF and the effect of foreign exchange on the amount recorded in our
financial statements as an asbestos liability; complia’nce with and changes in tax laws and
treatments; competition and product pricing in the markets in which we operate; the
consequences of product failures or defects; exposure to environmental, asbestos or other
legal proceedings; general economic and market conditions; the supply and cost of raw
materials; the success of our research and development efforts; our reliance on a small
number of product distributors; compliance with and changes in environmental and health and
safety laws; risks of conducting business internationally; compliance with and changes in
laws and regulations; foreign exchange risks; the successful implementation of new software
systems; and the effect of natural disasters. We caution you that the foregoing list of
factors is not exhaustive and that other risks and uncertainties may cause actual results to
differ materially from those in forward-looking statements. Forward-looking statements speak
only as of the date they are made.
|
|
|
| Media Release: James Hardie — 2nd Quarter and Half Year FY08
|
|
10 |
19 November 2007
James Hardie Industries N.V.
Results for the 2nd Quarter and Half Year Ended 30 September 2007
| |
|
|
|
|
|
|
|
|
|
|
|
|
|
|
|
|
|
|
|
|
|
|
|
|
| |
|
Three Months and First Half Ended 30 September |
| US GAAP - US$ Millions |
|
Q2 FY08 |
|
|
Q2 FY07 |
|
|
% Change |
|
|
HY FY08 |
|
|
HY FY07 |
|
|
% Change |
|
Net Sales |
|
|
|
|
|
|
|
|
|
|
|
|
|
|
|
|
|
|
|
|
|
|
|
|
USA Fibre Cement |
|
$ |
308.0 |
|
|
$ |
339.0 |
|
|
|
(9 |
) |
|
$ |
654.1 |
|
|
$ |
687.9 |
|
|
|
(5 |
) |
Asia Pacific Fibre Cement |
|
|
76.1 |
|
|
|
63.8 |
|
|
|
19 |
|
|
|
147.3 |
|
|
|
123.0 |
|
|
|
20 |
|
Other |
|
|
6.0 |
|
|
|
8.6 |
|
|
|
(30 |
) |
|
|
13.1 |
|
|
|
16.0 |
|
|
|
(18 |
) |
|
|
|
|
|
|
|
|
|
|
|
|
|
|
|
|
|
|
|
Total Net Sales |
|
$ |
390.1 |
|
|
$ |
411.4 |
|
|
|
(5 |
) |
|
$ |
814.5 |
|
|
$ |
826.9 |
|
|
|
(1 |
) |
Cost of goods sold |
|
|
(251.3 |
) |
|
|
(256.2 |
) |
|
|
2 |
|
|
|
(508.8 |
) |
|
|
(514.0 |
) |
|
|
1 |
|
|
|
|
|
|
|
|
|
|
|
|
|
|
|
|
|
|
|
|
Gross profit |
|
|
138.8 |
|
|
|
155.2 |
|
|
|
(11 |
) |
|
|
305.7 |
|
|
|
312.9 |
|
|
|
(2 |
) |
Selling, general and administrative
expenses |
|
|
(58.1 |
) |
|
|
(57.2 |
) |
|
|
(2 |
) |
|
|
(113.6 |
) |
|
|
(108.9 |
) |
|
|
(4 |
) |
Research & development expenses |
|
|
(7.1 |
) |
|
|
(6.6 |
) |
|
|
(8 |
) |
|
|
(13.4 |
) |
|
|
(14.1 |
) |
|
|
5 |
|
SCI and other related expenses |
|
|
— |
|
|
|
(3.2 |
) |
|
|
— |
|
|
|
— |
|
|
|
(5.6 |
) |
|
|
— |
|
Asbestos adjustments |
|
|
(28.9 |
) |
|
|
(47.2 |
) |
|
|
39 |
|
|
|
(59.0 |
) |
|
|
(74.4 |
) |
|
|
21 |
|
|
|
|
|
|
|
|
|
|
|
|
|
|
|
|
|
|
|
|
EBIT |
|
|
44.7 |
|
|
|
41.0 |
|
|
|
9 |
|
|
|
119.7 |
|
|
|
109.9 |
|
|
|
9 |
|
Net interest income (expense) |
|
|
2.0 |
|
|
|
1.0 |
|
|
|
— |
|
|
|
2.5 |
|
|
|
(1.0 |
) |
|
|
— |
|
|
|
|
|
|
|
|
|
|
|
|
|
|
|
|
|
|
|
|
Operating profit before income taxes |
|
|
46.7 |
|
|
|
42.0 |
|
|
|
11 |
|
|
|
122.2 |
|
|
|
108.9 |
|
|
|
12 |
|
Income tax expense |
|
|
(27.6 |
) |
|
|
(20.9 |
) |
|
|
(32 |
) |
|
|
(64.0 |
) |
|
|
(53.2 |
) |
|
|
(20 |
) |
|
|
|
|
|
|
|
|
|
|
|
|
|
|
|
|
|
|
|
Operating profit before cumulative
effect of change in accounting
principle |
|
|
19.1 |
|
|
|
21.1 |
|
|
|
(9 |
) |
|
|
58.2 |
|
|
|
55.7 |
|
|
|
4 |
|
Cumulative effect of change in
accounting principle for
stock-based compensation, net of
income tax expense of nil and
US$0.4 million, respectively |
|
|
— |
|
|
|
— |
|
|
|
— |
|
|
|
— |
|
|
|
0.9 |
|
|
|
— |
|
|
|
|
|
|
|
|
|
|
|
|
|
|
|
|
|
|
|
|
Net operating profit |
|
$ |
19.1 |
|
|
$ |
21.1 |
|
|
|
(9 |
) |
|
$ |
58.2 |
|
|
$ |
56.6 |
|
|
|
3 |
|
|
|
|
|
|
|
|
|
|
|
|
|
|
|
|
|
|
|
|
Earnings per share — diluted (US
cents) |
|
|
4.1 |
|
|
|
4.5 |
|
|
|
(9 |
) |
|
|
12.4 |
|
|
|
12.1 |
|
|
|
2 |
|
Volume (mmsf) |
|
|
|
|
|
|
|
|
|
|
|
|
|
|
|
|
|
|
|
|
|
|
|
|
USA Fibre Cement |
|
|
511.7 |
|
|
|
573.4 |
|
|
|
(11 |
) |
|
|
1,085.1 |
|
|
|
1,179.1 |
|
|
|
(8 |
) |
Asia Pacific Fibre Cement |
|
|
104.5 |
|
|
|
100.7 |
|
|
|
4 |
|
|
|
202.5 |
|
|
|
192.5 |
|
|
|
5 |
|
Average net sales price per unit
(per msf) |
|
|
|
|
|
|
|
|
|
|
|
|
|
|
|
|
|
|
|
|
|
|
|
|
USA Fibre Cement |
|
US$ |
602 |
|
|
US$ |
591 |
|
|
|
2 |
|
|
US$ |
603 |
|
|
US$ |
583 |
|
|
|
3 |
|
Asia Pacific Fibre Cement |
|
|
A$859 |
|
|
|
A$837 |
|
|
|
3 |
|
|
|
A$866 |
|
|
|
A$849 |
|
|
|
2 |
|
|
|
|
|
|
|
|
|
|
|
|
|
|
|
|
|
|
|
|
In this Management’s Analysis of Results, James Hardie may present financial measures,
sales volume terms, financial ratios, and Non-US GAAP financial measures included in the
Definitions section of this document starting on page 13. The company presents financial measures
that it believes are customarily used by its Australian investors. Specifically, these financial
measures, for which reconciliations to GAAP measures follow such definitions, include “EBIT”,
“EBIT margin”, “Operating profit” and “Net operating profit”. The company may also present other
terms for measuring its sales volumes (“million square feet (mmsf)” and “thousand square feet
(msf)”); financial ratios (“Gearing ratio”, “Net interest expense cover”, “Net interest paid
cover”, “Net debt payback”, “Net debt/cash”); and Non-US GAAP financial measures (“EBIT and EBIT
margin excluding asbestos”, “Net operating profit excluding asbestos”, “Diluted earnings per
share excluding asbestos”, “Operating profit before income taxes excluding asbestos”, “Income tax
expense excluding asbestos”, “Effective tax rate excluding asbestos”, and “EBITDA”). Unless otherwise stated, results and comparisons are of the
2nd quarter and 1st half of the current fiscal year versus the
2nd quarter and 1st half of the prior fiscal year.
|
|
|
| Management’s
Analysis of Results: James Hardie — 2nd Quarter and Half Year FY08
|
|
1
|
Total Net Sales
Total net sales for the quarter decreased 5% compared to the same quarter of the previous
year, from US$411.4 million to US$390.1 million. For the half year, total net sales
decreased 1% from US$826.9 million to US$814.5 million.
Net sales from USA Fibre Cement for the quarter decreased 9% from US$339.0 million to
US$308.0 million due to decreased sales volume, partly offset by an increase in the average
net sales price. For the half year, net sales from USA Fibre Cement decreased 5% from
US$687.9 million to US$654.1 million due to decreased sales volume, partly offset by a higher
average net sales price.
Net sales from Asia Pacific Fibre Cement for the quarter increased 19% from US$63.8 million
to US$76.1 million. For the half year, net sales from Asia Pacific Fibre Cement increased
20% from US$123.0 million to US$147.3 million. The increases were due to favourable currency
exchange differences, increased sales volumes and a higher average net sales price.
Other net sales for the quarter decreased 30% from US$8.6 million to US$6.0 million, and for
the half year decreased 18% from US$16.0 million to US$13.1 million. The decreases were due
to reduced sales in the USA Hardie Pipe business, partly offset by improved sales performance
in the Europe Fibre Cement business.
USA Fibre Cement
Quarter
Net sales decreased 9% from US$339.0 million in the second quarter of the prior fiscal year
to US$308.0 million due to decreased sales volume, partly offset by an increase in the
average net sales price.
Sales volume decreased 11% from 573.4 million square feet to 511.7 million square feet for
the quarter, as demand for the company’s products was adversely affected by the weaker
residential housing construction market.
The average net sales price increased 2% from US$591 per thousand square feet to US$602 per
thousand square feet primarily due to price increases within the past year.
Half Year
Net sales decreased 5% from US$687.9 million to US$654.1 million due to decreased sales
volume, partly offset by a higher average net sales price.
Sales volume decreased 8% from 1,179.1 million square feet to 1,085.1 million square feet for
the half year, as demand for the company’s products was adversely affected by a weaker
residential housing construction market.
The average net sales price increased 3% from US$583 per thousand square feet to US$603 per
thousand square feet due to price increases within the past year.
Discussion
The residential construction market weakened further during the quarter as high inventory
levels of new houses for sale and affordability issues associated with higher interest rates
and tightened lending standards in the mortgage market continued to impact housing
construction activity.
|
|
|
| Management’s Analysis of Results: James Hardie — 2nd Quarter and Half Year FY08
|
|
2
|
Housing starts, as reported by the US Census Bureau, decreased 24% for the three months ended
30 September 2007, following a 21% and 31% decline in starts for the previous two quarters
respectively. The National Association of Home Builders reported that builder confidence in
September was at a record low level. Repair and remodelling activity was again slightly
weaker during the quarter compared to the same period last year.
The impact of the weaker housing market on net sales was again partly offset by market
penetration against alternative materials and a small increase in the average net sales
price. There was moderate sales growth in our ColorPlus® collection of products, XLD® trim
and in our half-inch interior backerboard product, but sales of other higher-priced
differentiated products such as HardieShingle™ planks and Vented Soffit were significantly
lower compared to the same period last year.
Geographically, sales volumes in our exterior products category were lower in all operating
divisions, although the Western Division continued to perform particularly well, reporting
only a 3% decrease in sales volumes despite a 24-30% decline in housing starts for the
regions in that division. Sales in our interior products category were slightly lower
compared to the same quarter last year.
In September, the business launched Artisan® Lap and Artisan™ Accent Trim in the Atlanta,
Georgia market. The new premium exterior products are designed to appeal to architects,
developers and builders who work in the custom home segment of the market. A wider
geographic launch of these products is expected to commence in 2008.
For the half year, market penetration in the exterior and interior product categories and an
increase in the average net sales price helped to partly buffer the impact on net sales of
significantly weaker residential housing construction activity during the first six months of
this fiscal year.
On 31 October 2007, the company announced the proposed suspension of production at its
Blandon, Pennsylvania plant in response to current US housing market conditions. The Blandon
facility has an annual production capacity of 200 million square feet, but has been running
at reduced operating levels since the business was reset in late 2006-early 2007 in
anticipation of reduced demand. Blandon is the least cost-efficient of the business’ ten
manufacturing plants, which have a total production capacity of 3.4 billion square feet.
Asia Pacific Fibre Cement
Net sales for the quarter increased 19% from US$63.8 million to US$76.1 million. Net sales
increased 7% in Australian dollars due to a 4% increase in sales volume and a 3% increase in
the average Australian dollar net sales price. The increase in reported sales in US dollars
was also assisted by the favourable Australian dollar exchange rate. Over the period the
weighted average value of the Australian dollar was 12% higher against the US dollar compared
to the same period last year.
Net sales for the half year increased 20% from US$123.0 million to US$147.3 million. Net
sales increased 7% in Australian dollars due to a 5% increase in sales volume and a 2%
increase in the average Australian dollar net sales price. The increase in reported sales in
US dollars was also assisted by the favourable Australian dollar exchange rate. Over the
period the weighted average value of the Australian dollar was 13% higher against the US
dollar compared to the same period last year.
|
|
|
| Management’s Analysis of Results: James Hardie — 2nd Quarter and Half Year FY08
|
|
3
|
Discussion
Residential construction activity was slightly weaker in Australia, flat in New Zealand and
stronger in the Philippines compared to the same quarter last year. Net sales increased in
Australia, New Zealand and the Philippines. In Australia, the business continued to grow the
fibre cement segment and increase market share through sales of its Scyon™ product range.
Sales of the Scyon™ product range increased 65% compared to the same quarter last year. In
New Zealand, continuing strong growth in sales of Linea™ weatherboards helped the business
increase market share and the proportion of value-added, differentiated products in its sales
mix. In the Philippines, net sales increased mainly as a result of higher domestic prices
and an increased proportion of higher-priced exports in the sales mix.
The average sales price increased 3%, from A$837 per thousand square feet to A$859 per
thousand square feet due to a price increase in Australia, New Zealand and the Philippines
and a change in the sales mix.
For the half year, the increase in net sales was driven by stronger primary demand for fibre
cement in Australia and New Zealand, helped by sales growth in the Scyon™ product range in
Australia and Linea™ weatherboards in New Zealand, a higher average net sales price and
favourable foreign currency movements.
Other
USA Hardie Pipe
Net sales for the quarter and half year decreased compared to the same periods last year due
to materially lower sales volume as a result of weaker residential and non-residential
construction activity in Florida, partly offset by an increase in the average net sales
price. The business continued to focus on building sales volume in core markets and
expanding into other strategic markets.
Europe Fibre Cement
Sales continued to grow steadily during the quarter and half year.
Gross Profit
Quarter
Gross profit decreased 11% from US$155.2 million to US$138.8 million. The gross profit margin
decreased 2.1 percentage points from 37.7% to 35.6%.
USA Fibre Cement gross profit decreased 14% compared to the same quarter last year due to
lower sales volume and higher unit costs. The increase in unit costs was due primarily to
higher material costs and costs associated with recommencing production on two manufacturing
lines at Fontana, California and Peru, Illinois to help rebuild inventory to enable an
improvement in service levels. Pulp costs increased 10% compared to the same quarter last
year. The gross profit margin decreased by 2.1 percentage points.
Asia Pacific Fibre Cement gross profit increased 12% compared to the same period last year
due to favourable currency movements. In Australian dollars, gross profit was flat due to
increased sales volumes and a higher average sales price being offset by higher manufacturing
costs. The gross profit margin decreased by 1.9 percentage points.
|
|
|
| Management’s Analysis of Results: James Hardie — 2nd Quarter and Half Year FY08
|
|
4
|
Half Year
Gross profit decreased 2% from US$312.9 million to US$305.7 million. The gross profit margin
decreased 0.3 of a percentage point from 37.8% to 37.5%.
USA Fibre Cement gross profit decreased 4% compared to the same period last year due to lower
sales volumes and higher unit costs, partly offset by a higher average net sales price. The
gross profit margin decreased by 0.2 of a percentage point.
Asia Pacific Fibre Cement gross profit increased 12% compared to the same period last year
due to favourable currency movements. In Australian dollars, gross profit was flat due to
increased sales volumes and a higher average sales price, offset by higher manufacturing
costs. The gross profit margin decreased by 2.2 percentage points.
Selling, General and Administrative (SG&A) Expenses
SG&A expenses increased 2% for the quarter from US$57.2 million to US$58.1 million. As a
percentage of sales, SG&A expenses increased 1.0 percentage point to 14.9%.
For the half year, SG&A expenses increased 4% from US$108.9 million to US$113.6 million,
primarily due to higher warranty provisions relating to non-US activities. As a percentage
of sales, SG&A expense increased 0.7 of a percentage point to 13.9%.
SG&A expenses for the current quarter and half year also include non-claims handling related
operating expenses of the Asbestos Injuries Compensation Fund (AICF) amounting to US$1.1
million and US$1.7 million, respectively.
Australian Securities and Investments Commission (ASIC) Proceedings
In February 2007 ASIC commenced civil proceedings against JHI NV, a former subsidiary and ten
former officers and directors of the James Hardie group. The civil proceedings concern
alleged contraventions of certain provisions of the Corporations Law and/or the Corporations
Act connected with the affairs of the company and certain subsidiaries during the period
February 2001 to June 2003.
The company has considered the impact of the ASIC Proceedings upon its current financial
statements and believes that these proceedings will have no material impact. However, there
remains considerable uncertainty surrounding the likely outcome of the ASIC Proceedings in
the longer term and there is a possibility that the related costs to the company could become
material. At this stage it is not possible to determine the amount of any such liability.
Readers are referred to Note 7 of the company’s 30 September 2007 Consolidated Financial
Statements for further information on the ASIC Proceedings.
Research and Development Expenses
Research and development expenses include costs associated with “core” research projects that
are designed to benefit all business units. These costs are recorded in the Research and
Development segment rather than being attributed to individual business units. These costs
were 45% higher for the quarter at US$4.5 million and 33% higher for the half year at US$8.5
million.
Other research and development costs associated with commercialisation projects in business
units are included in the business unit segment results. In total, these costs were 26%
lower for the quarter at US$2.6 million and 36% lower for the half year at US$4.9 million.
|
|
|
| Management’s Analysis of Results: James Hardie — 2nd Quarter and Half Year FY08
|
|
5
|
Special Commission of Inquiry (SCI) and Other Related Expenses
During the second quarter, SCI and other related expenses were nil compared to US$3.2 million
for the same period last year. For the half year, SCI and other related expenses were nil
compared to US$5.6 million for the same period last year. Now that the Amended Final Funding
Agreement (Amended FFA) has been implemented, the company anticipates no significant SCI and
other related expenses going forward.
Asbestos Adjustments
The asbestos adjustments are derived from an estimate of future Australian asbestos-related
liabilities in accordance with the Amended FFA that was signed with the NSW Government on 21
November 2006 and approved by the company’s security holders on 7 February 2007.
The asbestos-related assets and liabilities are denominated in Australian dollars. Therefore
the reported value of these asbestos-related assets and liabilities in the company’s
consolidated balance sheets in US dollars is subject to adjustment depending on the closing
exchange rate between the two currencies at the balance sheet date.
The asbestos adjustments for the quarter and half year ended 30 September 2007 are as
follows:
| |
|
|
|
|
|
|
|
|
|
|
|
|
|
|
|
|
| US$ Million |
|
Q2 FY08 |
|
|
Q2 FY07 |
|
|
HY FY08 |
|
|
HY FY07 |
|
Effect of foreign exchange |
|
$ |
(27.0 |
) |
|
$ |
(5.4 |
) |
|
$ |
(60.2 |
) |
|
$ |
(32.6 |
) |
Other adjustments |
|
|
(1.9 |
) |
|
|
(41.8 |
) |
|
|
1.2 |
|
|
|
(41.8 |
) |
|
|
|
|
|
|
|
|
|
|
|
|
|
Asbestos adjustments |
|
$ |
(28.9 |
) |
|
$ |
(47.2 |
) |
|
$ |
(59.0 |
) |
|
$ |
(74.4 |
) |
|
|
|
|
|
|
|
|
|
|
|
|
|
Readers are referred to Note 6 of the company’s 30 September 2007 Consolidated Financial
Statements for further information on the asbestos adjustments.
EBIT
EBIT for the quarter increased from US$41.0 million for the same quarter last year to US$44.7
million for the current quarter. EBIT for the quarter includes net unfavourable asbestos
adjustments of US$28.9 million and AICF SG&A expenses of US$1.1 million. For the same period
in the prior year, EBIT includes net unfavourable asbestos adjustments of US$47.2 million, as
shown in the table below.
EBIT for the half year increased from US$109.9 million for the same period last year to
US$119.7 million for the current period. EBIT for the half year includes net unfavourable
asbestos adjustments of US$59.0 million and AICF SG&A expenses of US$1.7 million; for the
same period in the prior year EBIT includes net unfavourable asbestos adjustments of US$74.4
million, as shown in the table below.
|
|
|
| Management’s Analysis of Results: James Hardie — 2nd Quarter and Half Year FY08
|
|
6
|
| |
|
|
|
|
|
|
|
|
|
|
|
|
|
|
|
|
|
|
|
|
|
|
|
|
| EBIT - US$ Millions |
|
Three Months and First Half Ended 30 September |
|
| |
|
Q2 FY08 |
|
|
Q2 FY07 |
|
|
% Change |
|
|
HY FY08 |
|
|
HY FY07 |
|
|
% Change |
|
USA Fibre Cement |
|
$ |
84.3 |
|
|
$ |
97.8 |
|
|
|
(14 |
) |
|
$ |
198.7 |
|
|
$ |
201.1 |
|
|
|
(1 |
) |
Asia Pacific Fibre Cement |
|
|
12.4 |
|
|
|
11.5 |
|
|
|
8 |
|
|
|
24.8 |
|
|
|
21.8 |
|
|
|
14 |
|
Other |
|
|
(1.9 |
) |
|
|
(1.5 |
) |
|
|
(27 |
) |
|
|
(3.2 |
) |
|
|
(4.2 |
) |
|
|
24 |
|
Research & Development |
|
|
(4.8 |
) |
|
|
(4.1 |
) |
|
|
(17 |
) |
|
|
(8.9 |
) |
|
|
(8.7 |
) |
|
|
(2 |
) |
General Corporate |
|
|
(15.3 |
) |
|
|
(15.5 |
) |
|
|
1 |
|
|
|
(31.0 |
) |
|
|
(25.7 |
) |
|
|
(21 |
) |
Asbestos adjustments |
|
|
(28.9 |
) |
|
|
(47.2 |
) |
|
|
39 |
|
|
|
(59.0 |
) |
|
|
(74.4 |
) |
|
|
21 |
|
AICF SG&A expenses |
|
|
(1.1 |
) |
|
|
— |
|
|
|
— |
|
|
|
(1.7 |
) |
|
|
— |
|
|
|
— |
|
|
|
|
|
|
|
|
|
|
|
|
|
|
|
|
|
|
|
|
EBIT |
|
|
44.7 |
|
|
|
41.0 |
|
|
|
9 |
|
|
|
119.7 |
|
|
|
109.9 |
|
|
|
9 |
|
Excluding: |
|
|
|
|
|
|
|
|
|
|
|
|
|
|
|
|
|
|
|
|
|
|
|
|
Asbestos: |
|
|
|
|
|
|
|
|
|
|
|
|
|
|
|
|
|
|
|
|
|
|
|
|
Asbestos adjustments |
|
|
28.9 |
|
|
|
47.2 |
|
|
|
(39 |
) |
|
|
59.0 |
|
|
|
74.4 |
|
|
|
(21 |
) |
AICF SG&A expenses |
|
|
1.1 |
|
|
|
— |
|
|
|
— |
|
|
|
1.7 |
|
|
|
— |
|
|
|
— |
|
|
|
|
|
|
|
|
|
|
|
|
|
|
|
|
|
|
|
|
EBIT excluding asbestos |
|
$ |
74.7 |
|
|
$ |
88.2 |
|
|
|
(15 |
) |
|
$ |
180.4 |
|
|
$ |
184.3 |
|
|
|
(2 |
) |
Net sales |
|
$ |
390.1 |
|
|
$ |
411.4 |
|
|
|
(5 |
) |
|
$ |
814.5 |
|
|
$ |
826.9 |
|
|
|
(1 |
) |
EBIT margin excluding asbestos |
|
|
19.1 |
% |
|
|
21.4 |
% |
|
|
|
|
|
|
22.1 |
% |
|
|
22.3 |
% |
|
|
|
|
|
|
|
|
|
|
|
|
|
|
|
|
|
|
|
|
|
|
|
USA Fibre Cement EBIT
USA Fibre Cement EBIT for the quarter decreased 14% from US$97.8 million to US$84.3 million,
primarily due to lower volume and higher manufacturing costs partly offset by lower SG&A
spending. For the half year, EBIT decreased 1% from US$201.1 million to US$198.7 million,
primarily due to a lower gross margin partly offset by lower SG&A spending. The USA Fibre
Cement EBIT margin was 1.4 percentage points lower at 27.4% for the quarter and increased 1.2
percentage points to 30.4% for the half year.
Asia Pacific Fibre Cement EBIT
Asia Pacific Fibre Cement EBIT for the quarter increased 8% from US$11.5 million to US$12.4
million. In Australian dollars, Asia Pacific Fibre Cement EBIT for the quarter decreased 3%
due to a flat gross margin and increased SG&A expenses. SG&A expenses include a lease cost
adjustment of US$2.7 million related to prior periods. The EBIT margin was 1.7 percentage
points lower at 16.3% for the quarter.
Asia Pacific Fibre Cement EBIT for the half year increased 14% from US$21.8 million to
US$24.8 million. In Australian dollars, Asia Pacific Fibre Cement EBIT for the half year
increased 2%. The EBIT margin was 0.9 of a percentage point lower at 16.8% for the half year.
Other EBIT
The USA Hardie Pipe business recorded a small EBIT loss for the quarter and half year
compared to a small positive EBIT for the same periods last year.
The Europe Fibre Cement business incurred significantly reduced EBIT losses for the quarter
and half year as it continued to build sales.
|
|
|
| Management’s
Analysis of Results: James Hardie — 2nd Quarter FY08
|
|
7
|
General Corporate Costs
General corporate costs for the quarter decreased by US$0.2 million from US$15.5 million to
US$15.3 million.
For the half year, general corporate costs increased by US$5.3 million from US$25.7 million
to US$31.0 million. The increase was primarily due to increased warranty provisions relating
to non-US activities and legal expenses associated with the ASIC proceedings.
Net Interest Income (Expense)
Net interest income for the quarter increased from US$1.0 million to US$2.0 million. The
increase was primarily due to interest income of US$2.6 million earned on investments by the
AICF in the current quarter and an increase in interest income earned by the underlying
business, partly offset by a decrease in capitalised interest.
For the half year, net interest income (expense) increased from expense of US$1.0 million to
income of US$2.5 million. The increase was primarily due to interest income of US$4.2 million
earned on investments by the AICF and the one-time make-whole payment of US$6.0 million made
in the first half of fiscal year 2007, partly offset by a decrease in capitalised interest
and a decrease in the interest income earned by the underlying business.
Income Tax Expense
Income tax expense for the quarter increased from US$20.9 million to US$27.6 million. For the
half year, income tax expense increased from US$53.2 million to US$64.0 million.
The company’s effective tax rate on earnings excluding asbestos was 35.6% for the half year
ended 30 September 2007. The increase in the effective tax rate excluding asbestos over the
same period in the prior year is due to a tax provision write-back in the prior half year and
the impact of the change in the geographical mix of earnings.
With effect from 1 April 2007, the company was required to adopt the provisions of FASB
Interpretation No. 48 (FIN 48), “Accounting for Uncertainty in Income Taxes, an
interpretation of Statement of Financial Accounting Standards No. 109, Accounting for Income
Taxes”. The adoption of FIN 48 resulted in the reduction of the company’s consolidated
beginning retained earnings of US$90.4 million.
Readers are referred to Note 2 of the company’s 30 September 2007 Consolidated Financial
Statements for further information on the adoption of FIN 48.
Disputed Amended Australian Income Tax Assessment
As announced on 22 March 2006, RCI Pty Ltd (RCI), a wholly owned subsidiary of the company,
received an amended assessment from the ATO in respect of RCI’s income tax return for the
year ended 31 March 1999. The amended assessment relates to the amount of net capital gains
arising as a result of an internal corporate restructure carried out in 1998 and has been
issued pursuant to the discretion granted to the Commissioner of Taxation under Part IVA of
the Income Tax Assessment Act 1936. The original amended assessment issued to RCI was for a
total of A$412.0 million.
However, after subsequent remissions of general interest charges (GIC) by the ATO, the total
was changed to A$368.0 million, comprising A$172.0 million of primary tax after allowable
credits, A$43.0 million of penalties (representing 25% of primary tax) and A$153.0 million of
GIC.
|
|
|
| Management’s Analysis of Results: James Hardie — 2nd Quarter FY08
|
|
8
|
RCI is appealing the amended assessment. During fiscal year 2007, the company agreed with the
ATO that, in accordance with the ATO Receivable Policy, the company would pay 50% of the
total amended assessment, being A$184.0 million. The company also agreed to guarantee the
payment of the remaining 50% of the amended assessment should its appeal not be successful
and to pay GIC accruing on the unpaid balance of the amended assessment in arrears on a
quarterly basis. Up to 30 September 2007, GIC totalling A$88.7 million has been paid to the
ATO. On 15 October 2007, the company paid A$3.2 million in GIC in respect of the quarter
ended 30 September 2007. However, the company has not recorded any liability at 30 September
2007 for the remainder of the amended assessment because, at this time, the company believes
it is more likely than not that RCI’s view of its tax position will be upheld on appeal.
On 30 May 2007, the ATO issued a Notice of Decision disallowing the company’s objection to
the amended assessment. On 11 July 2007, the company filed an application appealing the
Objection Decision with the Federal Court of Australia.
Readers are referred to Note 10 of the company’s 30 September 2007 Consolidated Financial
Statements for further information on the ATO amended assessment.
Net Operating Profit
Net operating profit for the quarter decreased from US$21.1 million to US$19.1 million. Net
operating profit excluding asbestos decreased 32% from US$68.3 million to US$46.5 million as
shown in the table below.
For the half year, net operating profit increased from US$56.6 million to US$58.2 million.
Net operating profit excluding asbestos decreased 12% from US$131.0 million to US$115.1
million as shown in the table below.
| |
|
|
|
|
|
|
|
|
|
|
|
|
|
|
|
|
|
|
|
|
|
|
|
|
| Net Operating Profit |
|
Three Months and Half Year Ended 30 September |
|
| US$ Millions |
|
Q2 FY08 |
|
|
Q2 FY07 |
|
|
% Change |
|
|
HY FY08 |
|
|
HY FY07 |
|
|
% Change |
|
Net operating profit |
|
$ |
19.1 |
|
|
$ |
21.1 |
|
|
|
(9 |
) |
|
$ |
58.2 |
|
|
$ |
56.6 |
|
|
|
3 |
|
Excluding: |
|
|
|
|
|
|
|
|
|
|
|
|
|
|
|
|
|
|
|
|
|
|
|
|
Asbestos: |
|
|
|
|
|
|
|
|
|
|
|
|
|
|
|
|
|
|
|
|
|
|
|
|
Asbestos adjustments |
|
|
28.9 |
|
|
|
47.2 |
|
|
|
(39 |
) |
|
|
59.0 |
|
|
|
74.4 |
|
|
|
(21 |
) |
Tax expense related to
asbestos adjustments |
|
|
— |
|
|
|
— |
|
|
|
— |
|
|
|
0.4 |
|
|
|
— |
|
|
|
— |
|
AICF SG&A costs |
|
|
1.1 |
|
|
|
— |
|
|
|
— |
|
|
|
1.7 |
|
|
|
— |
|
|
|
— |
|
AICF interest income |
|
|
(2.6 |
) |
|
|
— |
|
|
|
— |
|
|
|
(4.2 |
) |
|
|
— |
|
|
|
— |
|
|
|
|
|
|
|
|
|
|
|
|
|
|
|
|
|
|
|
|
Net operating profit
excluding asbestos |
|
$ |
46.5 |
|
|
$ |
68.3 |
|
|
|
(32 |
) |
|
$ |
115.1 |
|
|
$ |
131.0 |
|
|
|
(12 |
) |
|
|
|
|
|
|
|
|
|
|
|
|
|
|
|
|
|
|
|
|
|
|
| Management’s Analysis of Results: James Hardie — 2nd Quarter FY08
|
|
9
|
Liquidity and Capital Resources
The company has historically met its working capital needs and capital expenditure
requirements through a combination of cash flow from operations, proceeds from the
divestiture of businesses, credit facilities and other borrowings, proceeds from the sale of
property, plant and equipment, and proceeds from the redemption of investments. Seasonal
fluctuations in working capital generally have not had a significant impact on its short-term
or long-term liquidity. The company believes that it can meet its present working capital
requirements for at least the next 12 months based on its current capital resources. Any cash
commitments arising from the Amended FFA will be met either from cash generated by operating
activities or, should this prove insufficient, from borrowings under existing credit
facilities.
Excluding restricted cash, the company had cash and cash equivalents of US$33.1 million as of
30 September 2007. At that date it also had credit facilities totalling US$355.0 million, of
which US$123.0 million was drawn. The credit facilities are all uncollateralised and consist
of the following:
| |
|
|
|
|
|
|
|
|
|
|
|
|
| |
|
At 30 September 2007 |
|
| Description |
|
Effective
Interest
Rate |
|
|
Total Facility |
|
|
Principal Drawn |
|
(US$ millions) |
|
|
|
|
|
|
|
|
|
|
|
| |
|
|
|
|
|
|
|
|
|
|
|
|
364-day facilities, can be
drawn in US$, variable
interest rates based on
LIBOR plus margin, can be
repaid and redrawn until
June 2008 |
|
|
5.95 |
% |
|
$ |
68.3 |
|
|
$ |
53.0 |
|
| |
|
|
|
|
|
|
|
|
|
|
|
|
364-day facilities, can be
drawn in US$, variable
interest rates based on
LIBOR plus margin, can be
repaid and redrawn until
December 2008 |
|
|
5.72 |
% |
|
$ |
41.7 |
|
|
$ |
40.0 |
|
| |
|
|
|
|
|
|
|
|
|
|
|
|
Term facilities, can be
drawn in US$, variable
interest rates based on
LIBOR plus margin, can be
repaid and redrawn until
June 2010 |
|
|
6.17 |
% |
|
|
245.0 |
|
|
|
30.0 |
|
|
|
|
|
|
|
|
|
|
|
|
| |
|
|
|
|
|
|
|
|
|
|
|
|
Total |
|
|
|
|
|
$ |
355.0 |
|
|
$ |
123.0 |
|
|
|
|
|
|
|
|
|
|
|
|
At 30 September 2007, the company had net debt of US$89.9 million, compared with net
debt of US$153.9 million at 31 March 2007.
The company’s credit facilities consist of 364-day facilities in the amount of US$110.0
million, which as of 30 September 2007, US$68.3 million expire in June 2008 and US$41.7
million expire in December 2008. The company also has term facilities in the amount of
US$245.0 million, which expire in June 2010. At 30 September 2007, there was US$123.0
million drawn under the combined facilities and US$232.0 million was available, but
unutilised.
In July 2006, pursuant to an agreement negotiated with the ATO and in accordance with the ATO
Receivable Policy, the company made a payment of A$189.0 million (US$166.9 million)
along with the provision of a guarantee from JHI NV in favour of the ATO for the unpaid
balance of the assessment. The company has also agreed to pay GIC accruing on the unpaid
balance of the assessment in arrears on a quarterly basis. Even if the company is ultimately
successful in its appeal and the cash deposit is refunded, this procedural requirement to
post a cash deposit materially and adversely affects the company’s financial position and
liquidity in the intervening period. See “Disputed Amended Australian Income Tax Assessment”
above for further information on the ATO amended assessment.
|
|
|
| Management’s Analysis of Results: James Hardie — 2nd Quarter FY08
|
|
10
|
If the company is unable to extend its credit facilities, or is unable to renew its credit
facilities on terms that are substantially similar to the ones it presently has, it may
experience liquidity issues and will have to reduce its levels of planned capital
expenditures, reduce or eliminate dividend payments or take other measures to conserve cash
in order to meet its future cash flow requirements. The company believes it will have
sufficient funds to meet its planned working capital and other cash requirements for the next
12 months based on its existing cash balances and anticipated operating cash flows arising
during the year.
Share Repurchase Program
On 15 August 2007, the company announced a share repurchase program of up to 10% of the
company’s issued capital, approximately 46.8 million shares. The company repurchased
approximately 7.5 million shares of common stock having an aggregate cost of A$54.0 million
(US$47.1 million) as at 30 September 2007. During the period between 1 October 2007 and 12
October 2007, the company repurchased approximately 4.2 million shares of common stock having
an aggregate cost of A$30.8 million (US$27.1 million). The company plans to repurchase shares
periodically depending on market conditions.
Cash Flow
Operating cash flow for the half year ended 30 September 2007 increased from a utilisation of
US$22.3 million to cash generated of US$231.0 million. The increase was driven primarily by
the payment of the initial ATO deposit during the six months ended 30 September 2006 totaling
US$141.4 million compared to US$3.7 million payment in the current half year. In addition,
the increase was driven by an increased focus on working capital management throughout the
half year. Capital expenditures for the purchase of property, plant and equipment decreased
from US$61.4 million to US$24.2 million.
Subsequent Events
On 31 October 2007, the company announced plans to suspend production at its Blandon,
Pennsylvania plant in North America. The company will record an impairment charge of
approximately US$31.7 million and a provision for closure costs currently estimated at US$1.8
million in the third quarter of fiscal year 2008.
END
|
|
|
| Management’s Analysis of Results: James Hardie — 2nd Quarter FY08
|
|
11
|
Media/Analyst Enquiries:
Steve Ashe
Vice President Investor Relations
Telephone: 61 2 8274 5246
Mobile: 61 0408 164 011
Facsimile: 61 2 8274 5218
This Management’s Analysis of Results forms part of a package of information about James
Hardie’s results. It should be read in conjunction with the other parts of this package,
including a Media Release, a Management Presentation and a Financial Report.
These documents, along with an audio-cast of the presentation on 19 November 2007, are
available from the Investor Relations area of the James Hardie website at
www.jameshardie.com
The company lodged its annual filing for the year ended 31 March 2007 with the SEC on 6 July
2007.
All holders of the company’s securities may receive, on request, a hard copy of our complete
audited financial statements, free of charge. Requests can be made via the Investor
Relations area of the company’s website or by contacting one of the company’s corporate
offices. Contact details are available on the company’s website.
|
|
|
| Management’s Analysis of Results: James Hardie — 2nd Quarter FY08
|
|
12
|
Definitions
Financial Measures — US GAAP equivalents
EBIT and EBIT margin — EBIT, as used in this document, is equivalent to the US
GAAP measure of operating income. EBIT margin is defined as EBIT as a percentage of net
sales. James Hardie believes EBIT and EBIT margin to be relevant and useful information as
these are the primary measures used by management to measure the operating profit or loss of
its business. EBIT is one of several metrics used by management to measure the earnings
generated by the company’s operations, excluding interest and income tax expenses.
Additionally, EBIT is believed to be a primary measure and terminology used by its Australian
investors. EBIT and EBIT margin should be considered in addition to, but not as a substitute
for, other measures of financial performance reported in accordance with accounting
principles generally accepted in the United States of America. EBIT and EBIT margin, as the
company has defined them, may not be comparable to similarly titled measures reported by
other companies.
Operating profit — is equivalent to the US GAAP measure of income.
Net operating profit — is equivalent to the US GAAP measure of net income.
Sales Volumes
mmsf — million square feet, where a square foot is defined as a standard square
foot of 5/16” thickness.
msf — thousand square feet, where a square foot is defined as a standard square foot
of 5/16” thickness.
Financial Ratios
Gearing Ratio — Net debt/cash divided by net debt/cash plus shareholders’
equity.
Net interest expense cover — EBIT divided by net interest expense.
Net interest paid cover — EBIT divided by cash paid during the period for interest,
net of amounts capitalised.
Net debt payback — Net debt/cash divided by cash flow from operations.
Net debt/cash — short-term and long-term debt less cash and cash equivalents.
|
|
|
| Management’s Analysis of Results: James Hardie — 2nd Quarter and Half Year FY08
|
|
13
|
Non-US GAAP Financial Measures
EBIT and EBIT margin excluding asbestos — EBIT and EBIT margin excluding
asbestos are not measures of financial performance under US GAAP and should not be considered
to be more meaningful than EBIT and EBIT margin. James Hardie has included these financial
measures to provide investors with an alternative method for assessing its operating results
in a manner that is focussed on the performance of its ongoing operations and provides useful
information regarding its financial condition and results of operations. The company uses
these non-US GAAP measures for the same purposes.
| |
|
|
|
|
|
|
|
|
|
|
|
|
|
|
|
|
| |
| |
|
Q2 |
|
Q2 |
|
HY |
|
HY |
| US$ Millions |
|
FY08 |
|
FY07 |
|
FY08 |
|
FY07 |
| |
EBIT |
|
$ |
44.7 |
|
|
$ |
41.0 |
|
|
$ |
119.7 |
|
|
$ |
109.9 |
|
Asbestos: |
|
|
|
|
|
|
|
|
|
|
|
|
|
|
|
|
Asbestos adjustments |
|
|
28.9 |
|
|
|
47.2 |
|
|
|
59.0 |
|
|
|
74.4 |
|
AICF SG&A expenses |
|
|
1.1 |
|
|
|
— |
|
|
|
1.7 |
|
|
|
— |
|
| |
|
|
EBIT excluding asbestos |
|
$ |
74.7 |
|
|
$ |
88.2 |
|
|
$ |
180.4 |
|
|
$ |
184.3 |
|
Net Sales |
|
$ |
390.1 |
|
|
$ |
411.4 |
|
|
$ |
814.5 |
|
|
$ |
826.9 |
|
|
|
|
|
|
|
|
|
|
|
|
|
|
|
|
|
|
EBIT margin excluding asbestos |
|
|
19.1 |
% |
|
|
21.4 |
% |
|
|
22.1 |
% |
|
|
22.3 |
% |
| |
|
|
Net operating profit excluding asbestos — Net operating profit excluding
asbestos is not a measure of financial performance under US GAAP and should not be considered
to be more meaningful than net income. The company has included this financial measure to
provide investors with an alternative method for assessing its operating results in a manner
that is focussed on the performance of its ongoing operations. The company uses this non-US
GAAP measure for the same purposes.
| |
|
|
|
|
|
|
|
|
|
|
|
|
|
|
|
|
| |
| |
|
Q2 |
|
Q2 |
|
HY |
|
HY |
| US$ Millions |
|
FY08 |
|
FY07 |
|
FY08 |
|
FY07 |
| |
Net operating profit |
|
$ |
19.1 |
|
|
$ |
21.1 |
|
|
$ |
58.2 |
|
|
$ |
56.6 |
|
Asbestos: |
|
|
|
|
|
|
|
|
|
|
|
|
|
|
|
|
Asbestos adjustments |
|
|
28.9 |
|
|
|
47.2 |
|
|
|
59.0 |
|
|
|
74.4 |
|
AICF SG&A expenses |
|
|
1.1 |
|
|
|
— |
|
|
|
1.7 |
|
|
|
— |
|
AICF interest income |
|
|
(2.6 |
) |
|
|
— |
|
|
|
(4.2 |
) |
|
|
— |
|
Tax expense related to asbestos adjustments |
|
|
— |
|
|
|
— |
|
|
|
0.4 |
|
|
|
— |
|
| |
|
|
Net operating profit excluding asbestos |
|
$ |
46.5 |
|
|
$ |
68.3 |
|
|
$ |
115.1 |
|
|
$ |
131.0 |
|
| |
|
|
Diluted earnings per share excluding asbestos — Diluted earnings per share
excluding asbestos is not a measure of financial performance under US GAAP and should not be
considered to be more meaningful than diluted earnings per share. The company has included
this financial measure to provide investors with an alternative method for assessing its
operating results in a manner that is focussed on the performance of its ongoing operations.
The company’s management uses this non-US GAAP measure for the same purposes.
| |
|
|
|
|
|
|
|
|
|
|
|
|
|
|
|
|
| |
| |
|
Q2 |
|
Q2 |
|
HY |
|
HY |
| US$ Millions |
|
FY08 |
|
FY07 |
|
FY08 |
|
FY07 |
| |
Net operating profit excluding asbestos |
|
$ |
46.5 |
|
|
$ |
68.3 |
|
|
$ |
115.1 |
|
|
$ |
131.0 |
|
Weighted average common shares outstanding — diluted
(millions) |
|
|
468.3 |
|
|
|
465.1 |
|
|
|
468.5 |
|
|
|
466.0 |
|
| |
|
|
Diluted earnings per share excluding asbestos (US cents) |
|
|
10.0 |
|
|
|
14.7 |
|
|
|
24.6 |
|
|
|
28.1 |
|
| |
|
|
|
|
|
| Management’s Analysis of Results: James Hardie — 2nd Quarter and Half Year FY08
|
|
14
|
Effective tax rate excluding asbestos — Effective tax rate excluding asbestos
is not a measure of financial performance under US GAAP and should not be considered to be
more meaningful than effective tax rate. The company has included this financial measure to
provide investors with an alternative method for assessing its operating results in a manner
that is focussed on the performance of its ongoing operations. The company’s management uses
this non-US GAAP measure for the same purposes.
| |
|
|
|
|
|
|
|
|
|
|
|
|
|
|
|
|
| |
| |
|
Q2 |
|
Q2 |
|
HY |
|
HY |
| US$ Millions |
|
FY08 |
|
FY07 |
|
FY08 |
|
FY07 |
| |
Operating profit before income taxes |
|
$ |
46.7 |
|
|
$ |
42.0 |
|
|
$ |
122.2 |
|
|
$ |
108.9 |
|
Asbestos: |
|
|
|
|
|
|
|
|
|
|
|
|
|
|
|
|
Asbestos adjustments |
|
|
28.9 |
|
|
|
47.2 |
|
|
|
59.0 |
|
|
|
74.4 |
|
AICF SG&A expenses |
|
|
1.1 |
|
|
|
— |
|
|
|
1.7 |
|
|
|
— |
|
AICF interest income |
|
|
(2.6 |
) |
|
|
— |
|
|
|
(4.2 |
) |
|
|
— |
|
| |
|
|
Operating profit before income taxes
excluding asbestos |
|
$ |
74.1 |
|
|
$ |
89.2 |
|
|
$ |
178.7 |
|
|
$ |
183.3 |
|
| |
|
|
Income tax expense |
|
$ |
27.6 |
|
|
$ |
20.9 |
|
|
$ |
64.0 |
|
|
$ |
53.2 |
|
Asbestos: |
|
|
|
|
|
|
|
|
|
|
|
|
|
|
|
|
Tax expense related to asbestos adjustments |
|
|
— |
|
|
|
— |
|
|
|
(0.4 |
) |
|
|
— |
|
| |
|
|
Income tax expense excluding asbestos |
|
$ |
27.6 |
|
|
$ |
20.9 |
|
|
$ |
63.6 |
|
|
$ |
53.2 |
|
| |
|
|
|
|
|
|
|
|
|
|
|
|
|
|
|
|
|
|
|
Effective tax rate excluding asbestos |
|
|
37.2 |
% |
|
|
23.4 |
% |
|
|
35.6 |
% |
|
|
29.0 |
% |
| |
|
|
EBITDA — is not a measure of financial performance under US GAAP and should not
be considered an alternative to, or more meaningful than, income from operations, net income
or cash flows as defined by US GAAP or as a measure of profitability or liquidity. Not all
companies calculate EBITDA in the same manner as James Hardie has and, accordingly, EBITDA
may not be comparable with other companies. The company has included information concerning
EBITDA because it believes that this data is commonly used by investors to evaluate the
ability of a company’s earnings from its core business operations to satisfy its debt,
capital expenditure and working capital requirements.
| |
|
|
|
|
|
|
|
|
|
|
|
|
|
|
|
|
| |
| |
|
Q2 |
|
Q2 |
|
HY |
|
HY |
| US$ Millions |
|
FY08 |
|
FY07 |
|
FY08 |
|
FY07 |
| |
EBIT |
|
$ |
44.7 |
|
|
$ |
41.0 |
|
|
$ |
119.7 |
|
|
$ |
109.9 |
|
Depreciation and amortisation |
|
|
13.5 |
|
|
|
13.2 |
|
|
|
27.7 |
|
|
|
24.2 |
|
| |
|
|
EBITDA |
|
$ |
58.2 |
|
|
$ |
54.2 |
|
|
$ |
147.4 |
|
|
$ |
134.1 |
|
| |
|
|
|
|
|
| Management’s Analysis of Results: James Hardie — 2nd Quarter and Half Year FY08
|
|
15
|
Supplemental Financial Information
James Hardie’s management measures its operating performance and analyses year-over-year
changes in operating results with and without the effect of the net Amended FFA liability
recorded in the fourth quarter of fiscal year 2006 and believes that security holders will do
the same.
As set forth in Note 6 of the 30 September 2007 Financial Report, the net Amended FFA
liability, while recurring, is based on periodic actuarial determinations, claims experience
and currency fluctuations. It has no relation to the results of the company’s operations.
Accordingly, management believes that the following information is useful to it and investors
in evaluating ongoing operating financial performance.
The following tables are considered non-GAAP and are not intended to be used or viewed in any
respect as substitutes for the company’s GAAP consolidated financial statements. These
non-GAAP measures should only be viewed as a supplement to reported GAAP financial
statements, and, in all cases, the corresponding GAAP amounts are shown on the same line as
the non-GAAP measure, to avoid any possible confusion.
The following tables should be read in conjunction with JHI NV’s financial statements and
related notes contained in the company’s 30 September 2007 Consolidated Financial Statements.
|
|
|
| Management’s Analysis of Results: James Hardie — 2nd Quarter and Half Year FY08
|
|
16
|
James Hardie Industries N.V.
Consolidated Balance Sheet 30 September 2007 (Unaudited)
| |
|
|
|
|
|
|
|
|
|
|
|
|
| |
|
Total Fibre |
|
|
|
|
| |
|
Cement |
|
|
|
|
| |
|
Operations |
|
|
|
|
| |
|
- excluding |
|
|
|
|
| |
|
Asbestos |
|
Asbestos |
|
|
| US$ Million |
|
Compensation |
|
Compensation |
|
As Reported |
ASSETS |
|
|
|
|
|
|
|
|
|
|
|
|
Current assets: |
|
|
|
|
|
|
|
|
|
|
|
|
Cash and cash equivalents |
|
$ |
182.0 |
|
|
$ |
(148.9 |
) |
|
$ |
33.1 |
|
Restricted cash and cash equivalents |
|
|
5.0 |
|
|
|
— |
|
|
|
5.0 |
|
Restricted cash and cash equivalents — Asbestos |
|
|
— |
|
|
|
61.6 |
|
|
|
61.6 |
|
Restricted short-term investments — Asbestos |
|
|
— |
|
|
|
78.5 |
|
|
|
78.5 |
|
Accounts and notes receivable, net of
allowance for doubtful accounts of $1.8m |
|
|
170.8 |
|
|
|
0.3 |
|
|
|
171.1 |
|
Inventories |
|
|
136.2 |
|
|
|
— |
|
|
|
136.2 |
|
Prepaid expenses and other current assets |
|
|
36.9 |
|
|
|
0.3 |
|
|
|
37.2 |
|
Insurance receivable — Asbestos |
|
|
— |
|
|
|
10.3 |
|
|
|
10.3 |
|
Workers’ compensation — Asbestos |
|
|
— |
|
|
|
3.0 |
|
|
|
3.0 |
|
Deferred income taxes |
|
|
25.8 |
|
|
|
— |
|
|
|
25.8 |
|
Deferred income taxes — Asbestos |
|
|
— |
|
|
|
9.1 |
|
|
|
9.1 |
|
|
|
|
|
|
|
|
|
|
|
|
|
|
Total current assets |
|
|
556.7 |
|
|
|
14.2 |
|
|
|
570.9 |
|
Property, plant and equipment, net |
|
|
838.6 |
|
|
|
0.4 |
|
|
|
839.0 |
|
Insurance receivable — Asbestos |
|
|
— |
|
|
|
171.0 |
|
|
|
171.0 |
|
Workers’ compensation — Asbestos |
|
|
— |
|
|
|
83.7 |
|
|
|
83.7 |
|
Deferred income taxes |
|
|
3.1 |
|
|
|
— |
|
|
|
3.1 |
|
Deferred income taxes — Asbestos |
|
|
— |
|
|
|
342.5 |
|
|
|
342.5 |
|
Deposit with Australian Taxation Office |
|
|
186.3 |
|
|
|
— |
|
|
|
186.3 |
|
Other assets |
|
|
1.4 |
|
|
|
— |
|
|
|
1.4 |
|
|
|
|
|
|
|
|
|
|
|
|
|
|
Total assets |
|
$ |
1,586.1 |
|
|
$ |
611.8 |
|
|
$ |
2,197.9 |
|
|
|
|
|
|
|
|
|
|
|
|
|
|
LIABILITIES AND SHAREHOLDERS’ EQUITY |
|
|
|
|
|
|
|
|
|
|
|
|
Current liabilities: |
|
|
|
|
|
|
|
|
|
|
|
|
Accounts payable and accrued liabilities |
|
$ |
149.8 |
|
|
$ |
1.1 |
|
|
$ |
150.9 |
|
Short-term debt |
|
|
93.0 |
|
|
|
— |
|
|
|
93.0 |
|
Accrued payroll and employee benefits |
|
|
38.0 |
|
|
|
0.1 |
|
|
|
38.1 |
|
Accrued product warranties |
|
|
7.3 |
|
|
|
— |
|
|
|
7.3 |
|
Income taxes payable |
|
|
26.5 |
|
|
|
(14.7 |
) |
|
|
11.8 |
|
Asbestos liability |
|
|
— |
|
|
|
69.5 |
|
|
|
69.5 |
|
Workers’ compensation — Asbestos |
|
|
— |
|
|
|
3.0 |
|
|
|
3.0 |
|
Other liabilities |
|
|
14.8 |
|
|
|
— |
|
|
|
14.8 |
|
|
|
|
|
|
|
|
|
|
|
|
|
|
Total current liabilities |
|
|
329.4 |
|
|
|
59.0 |
|
|
|
388.4 |
|
Long-term debt |
|
|
30.0 |
|
|
|
— |
|
|
|
30.0 |
|
Deferred income taxes |
|
|
123.9 |
|
|
|
— |
|
|
|
123.9 |
|
Accrued product warranties |
|
|
10.0 |
|
|
|
— |
|
|
|
10.0 |
|
Asbestos liability |
|
|
— |
|
|
|
1,309.1 |
|
|
|
1,309.1 |
|
Workers’ compensation — Asbestos |
|
|
— |
|
|
|
83.7 |
|
|
|
83.7 |
|
Other liabilities |
|
|
136.6 |
|
|
|
3.8 |
|
|
|
140.4 |
|
|
|
|
|
|
|
|
|
|
|
|
|
|
Total liabilities |
|
|
629.9 |
|
|
|
1,455.6 |
|
|
|
2,085.5 |
|
Commitments and contingencies |
|
|
|
|
|
|
|
|
|
|
|
|
Shareholders’ equity |
|
|
|
|
|
|
|
|
|
|
|
|
Common stock |
|
|
252.1 |
|
|
|
— |
|
|
|
252.1 |
|
Additional paid-in capital |
|
|
185.4 |
|
|
|
— |
|
|
|
185.4 |
|
Retained earnings (Accumulated deficit) |
|
|
561.4 |
|
|
|
(843.0 |
) |
|
|
(281.6 |
) |
Common stock in treasury |
|
|
(47.1 |
) |
|
|
— |
|
|
|
(47.1 |
) |
Accumulated other comprehensive income |
|
|
4.4 |
|
|
|
(0.8 |
) |
|
|
3.6 |
|
|
|
|
|
|
|
|
|
|
|
|
|
|
Total shareholders’ equity |
|
|
956.2 |
|
|
|
(843.8 |
) |
|
|
112.4 |
|
|
|
|
|
|
|
|
|
|
|
|
|
|
Total liabilities and shareholders’ equity |
|
$ |
1,586.1 |
|
|
$ |
611.8 |
|
|
$ |
2,197.9 |
|
|
|
|
|
|
|
|
|
|
|
|
|
|
|
|
|
| Management’s Analysis of Results: James Hardie — 2nd Quarter and Half Year FY08
|
|
17
|
James Hardie Industries N.V.
Consolidated Statement of Operations
For the six months ended 30 September 2007
(Unaudited)
| |
|
|
|
|
|
|
|
|
|
|
|
|
| |
|
Total Fibre |
|
|
|
|
| |
|
Cement |
|
|
|
|
| |
|
Operations |
|
|
|
|
| |
|
- excluding |
|
|
|
|
| |
|
Asbestos |
|
Asbestos |
|
|
| US$ Million |
|
Compensation |
|
Compensation |
|
As Reported |
Net Sales |
|
|
|
|
|
|
|
|
|
|
|
|
USA Fibre Cement |
|
$ |
654.1 |
|
|
|
— |
|
|
$ |
654.1 |
|
Asia Pacific Fibre Cement |
|
|
147.3 |
|
|
|
— |
|
|
|
147.3 |
|
Other |
|
|
13.1 |
|
|
|
— |
|
|
|
13.1 |
|
|
|
|
|
|
|
|
|
|
|
|
|
|
Total Net Sales |
|
|
814.5 |
|
|
|
— |
|
|
|
814.5 |
|
Cost of goods sold |
|
|
(508.8 |
) |
|
|
— |
|
|
|
(508.8 |
) |
|
|
|
|
|
|
|
|
|
|
|
|
|
Gross profit |
|
|
305.7 |
|
|
|
— |
|
|
|
305.7 |
|
Selling, general and administrative expenses |
|
|
(111.9 |
) |
|
|
(1.7 |
) |
|
|
(113.6 |
) |
Research and development expenses |
|
|
(13.4 |
) |
|
|
— |
|
|
|
(13.4 |
) |
Asbestos adjustments |
|
|
— |
|
|
|
(59.0 |
) |
|
|
(59.0 |
) |
|
|
|
|
|
|
|
|
|
|
|
|
|
EBIT |
|
|
180.4 |
|
|
|
(60.7 |
) |
|
|
119.7 |
|
Net interest (expense) income |
|
|
(1.7 |
) |
|
|
4.2 |
|
|
|
2.5 |
|
|
|
|
|
|
|
|
|
|
|
|
|
|
Operating profit (loss) before income taxes |
|
|
178.7 |
|
|
|
(56.5 |
) |
|
|
122.2 |
|
Income tax expense |
|
|
(63.6 |
) |
|
|
(0.4 |
) |
|
|
(64.0 |
) |
|
|
|
|
|
|
|
|
|
|
|
|
|
Net Operating Profit (Loss) |
|
$ |
115.1 |
|
|
$ |
(56.9 |
) |
|
$ |
58.2 |
|
|
|
|
|
|
|
|
|
|
|
|
|
|
|
|
|
| Management’s Analysis of Results: James Hardie — 2nd Quarter and Half Year FY08
|
|
18
|
James Hardie Industries N.V.
Consolidated Statement of Cash Flows
For the six months ended 30 September 2007
(Unaudited)
| |
|
|
|
|
|
|
|
|
|
|
|
|
| |
|
Total Fibre |
|
|
|
|
| |
|
Cement |
|
|
|
|
| |
|
Operations |
|
|
|
|
| |
|
- excluding |
|
|
|
|
| |
|
Asbestos |
|
Asbestos |
|
|
| US $ Million |
|
Compensation |
|
Compensation |
|
As Reported |
Cash Flows From Operating Activities |
|
|
|
|
|
|
|
|
|
|
|
|
Net income (loss) |
|
$ |
115.1 |
|
|
$ |
(56.9 |
) |
|
$ |
58.2 |
|
Adjustments to reconcile net income (loss) to
net cash provided by operating activities: |
|
|
|
|
|
|
|
|
|
|
|
|
Depreciation and amortisation |
|
|
27.7 |
|
|
|
— |
|
|
|
27.7 |
|
Deferred income taxes |
|
|
30.7 |
|
|
|
— |
|
|
|
30.7 |
|
Prepaid pension cost |
|
|
0.9 |
|
|
|
— |
|
|
|
0.9 |
|
Stock-based compensation |
|
|
3.1 |
|
|
|
— |
|
|
|
3.1 |
|
Asbestos adjustments |
|
|
— |
|
|
|
59.0 |
|
|
|
59.0 |
|
Other |
|
|
(0.2 |
) |
|
|
(2.1 |
) |
|
|
(2.3 |
) |
Changes in operating assets and liabilities: |
|
|
|
|
|
|
|
|
|
|
|
|
Restricted cash and cash equivalents |
|
|
— |
|
|
|
21.5 |
|
|
|
21.5 |
|
Accounts and notes receivable |
|
|
(3.7 |
) |
|
|
0.1 |
|
|
|
(3.6 |
) |
Inventories |
|
|
14.6 |
|
|
|
— |
|
|
|
14.6 |
|
Prepaid expenses and other current assets |
|
|
(4.1 |
) |
|
|
— |
|
|
|
(4.1 |
) |
Insurance receivable |
|
|
— |
|
|
|
9.4 |
|
|
|
9.4 |
|
Accounts payable and accrued liabilities |
|
|
41.5 |
|
|
|
— |
|
|
|
41.5 |
|
Asbestos liability |
|
|
— |
|
|
|
(31.2 |
) |
|
|
(31.2 |
) |
Deposit with Australian Taxation Office |
|
|
(3.7 |
) |
|
|
— |
|
|
|
(3.7 |
) |
Other accrued liabilities and other liabilities |
|
|
9.1 |
|
|
|
0.2 |
|
|
|
9.3 |
|
|
|
|
|
|
|
|
|
|
|
|
|
|
Net cash provided by operating activities |
|
$ |
231.0 |
|
|
|
— |
|
|
$ |
231.0 |
|
|
|
|
|
|
|
|
|
|
|
|
|
|
Cash Flows From Investing Activities |
|
|
|
|
|
|
|
|
|
|
|
|
Purchases of property, plant and equipment |
|
|
(24.2 |
) |
|
|
— |
|
|
|
(24.2 |
) |
|
|
|
|
|
|
|
|
|
|
|
|
|
Net cash used in investing activities |
|
$ |
(24.2 |
) |
|
|
— |
|
|
$ |
(24.2 |
) |
|
|
|
|
|
|
|
|
|
|
|
|
|
Cash Flows From Financing Activities |
|
|
|
|
|
|
|
|
|
|
|
|
Proceeds from short-term borrowings |
|
|
10.0 |
|
|
|
— |
|
|
|
10.0 |
|
Repayments of long-term borrowings |
|
|
(75.0 |
) |
|
|
— |
|
|
|
(75.0 |
) |
Proceeds from issuance of shares |
|
|
2.2 |
|
|
|
— |
|
|
|
2.2 |
|
Tax benefit from stock options exercised |
|
|
0.2 |
|
|
|
— |
|
|
|
0.2 |
|
Treasury stock purchased |
|
|
(47.1 |
) |
|
|
— |
|
|
|
(47.1 |
) |
Dividends paid |
|
|
(70.7 |
) |
|
|
— |
|
|
|
(70.7 |
) |
|
|
|
|
|
|
|
|
|
|
|
|
|
Net cash used in financing activities |
|
$ |
(180.4 |
) |
|
|
— |
|
|
$ |
(180.4 |
) |
|
|
|
|
|
|
|
|
|
|
|
|
|
Effects of exchange rate changes on cash |
|
|
(27.4 |
) |
|
|
— |
|
|
|
(27.4 |
) |
|
|
|
|
|
|
|
|
|
|
|
|
|
Net decrease in cash and cash equivalents |
|
|
(1.0 |
) |
|
|
— |
|
|
|
(1.0 |
) |
Cash and cash equivalents at beginning of period |
|
|
34.1 |
|
|
|
— |
|
|
|
34.1 |
|
|
|
|
|
|
|
|
|
|
|
|
|
|
Cash and cash equivalents at end of period |
|
$ |
33.1 |
|
|
|
— |
|
|
$ |
33.1 |
|
|
|
|
|
|
|
|
|
|
|
|
|
|
Components of Cash and Cash Equivalents |
|
|
|
|
|
|
|
|
|
|
|
|
Cash at bank and on hand |
|
$ |
29.5 |
|
|
|
— |
|
|
$ |
29.5 |
|
Short-term deposits |
|
|
3.6 |
|
|
|
— |
|
|
|
3.6 |
|
|
|
|
|
|
|
|
|
|
|
|
|
|
Cash and cash equivalents at end of period |
|
$ |
33.1 |
|
|
|
— |
|
|
$ |
33.1 |
|
|
|
|
|
|
|
|
|
|
|
|
|
|
|
|
|
| Management’s
Analysis of Results: James Hardie — 2nd Quarter and Half Year FY08
|
|
19
|
Disclaimer
This Management’s Analysis of Results contains forward-looking statements. We may from time
to time make forward-looking statements in our periodic reports filed with or furnished to
the United States Securities and Exchange Commission on Forms 20-F and 6-K, in our annual
reports to shareholders, in offering circulars, invitation memoranda and prospectuses, in
media releases and other written materials and in oral statements made by our officers,
directors or employees to analysts, institutional investors, lenders and potential lenders,
representatives of the media and others. Examples of forward-looking statements include:
| • |
|
expectations about the timing and amount of payments to the Asbestos Injuries
Compensation Fund (AICF), a special purpose fund for the compensation of proven
asbestos-related personal injury and death claims; |
| |
| • |
|
expectations with respect to the effect on our financial statements of those
payments; |
| |
| • |
|
statements as to the possible consequences of proceedings brought against us and
certain of our former directors and officers by the Australian Securities and Investments
Commission; |
| |
| • |
|
expectations that our credit facilities will be extended or renewed; |
| |
| • |
|
projections of our operating results or financial condition; |
| |
| • |
|
statements regarding our plans, objectives or goals, including those relating to
competition, acquisitions, dispositions and our products; |
| |
| • |
|
statements about our future performance; |
| |
| • |
|
statements about product or environmental liabilities; and |
| |
| • |
|
statements regarding tax liabilities and related proceedings. |
Words such as “believe,” “anticipate,” “plan,” “expect,” “intend,” “target,” “estimate,”
“project,” “predict,” “forecast,” “guideline,” “should,” “aim” and similar expressions are
intended to identify forward-looking statements but are not the exclusive means of
identifying such statements.
Forward-looking statements involve inherent risks and uncertainties. We caution you that a
number of important factors could cause actual results to differ materially from the plans,
objectives, expectations, estimates and intentions expressed in such forward-looking
statements. These factors, some of which are discussed under “Risk Factors” beginning on page
6 of our Form 20-F filed on 6 July 2007 with the Securities and Exchange Commission, include
but are not limited to: all matters relating to or arising out of the prior manufacture of
products that contained asbestos by current and former James Hardie subsidiaries; required
contributions to the AICF and the effect of foreign exchange on the amount recorded in our
financial statements as an asbestos liability; compliance with and changes in tax laws and
treatments; competition and product pricing in the markets in which we operate; the
consequences of product failures or defects; exposure to environmental, asbestos or other
legal proceedings; general economic and market conditions; the supply and cost of raw
materials; the success of our research and development efforts; our reliance on a small
number of product distributors; compliance with and changes in environmental and health and
safety laws; risks of conducting business internationally; compliance with and changes in
laws and regulations; foreign exchange risks; the successful implementation of new software
systems; and the effect of natural disasters. We caution you that the foregoing list of
factors is not exhaustive and that other risks and uncertainties may cause actual results to
differ materially from those in forward-looking statements. Forward-looking statements speak
only as of the date they are made.
|
|
|
| Management’s Analysis of Results: James Hardie — 2nd Quarter and Half Year FY08
|
|
20
|
|
James Hardie
FY08 2nd Quarter and Half Year Results
19 November 2007
In this Management Presentation, James Hardie may present financial measures, sales volume terms, financial ratios, and Non-US GAAP financial measures
included in the Definitions section of this document starting on page 53. The company presents financial measures that it believes are customarily used by its
Australian investors. Specifically, these financial measures, for which reconciliations to GAAP measures follow such definitions, include "EBIT", "EBIT margin",
"Operating profit" and "Net operating profit". The company may also present other terms for measuring its sales volumes ("million square feet (mmsf)" and "thousand
square feet (msf)"); financial ratios ("Gearing ratio", "Net interest expense cover", "Net interest paid cover", "Net debt payback", "Net debt/cash"); and Non-US GAAP
financial measures ("EBIT and EBIT margin excluding asbestos", "Net operating profit excluding asbestos", "Diluted earnings per share excluding asbestos",
"Operating profit before income taxes excluding asbestos", "Income tax expense excluding asbestos", "Effective tax rate excluding asbestos", and "EBITDA"). Unless
otherwise stated, results and comparisons are of the 2nd quarter and 1st half of the current fiscal year versus the 2nd quarter and 1st half of the prior fiscal year.
|
|
Overview and Operating Review - Louis Gries, CEO
Financial Review - Russell Chenu, CFO
Questions and Answers
Agenda
|
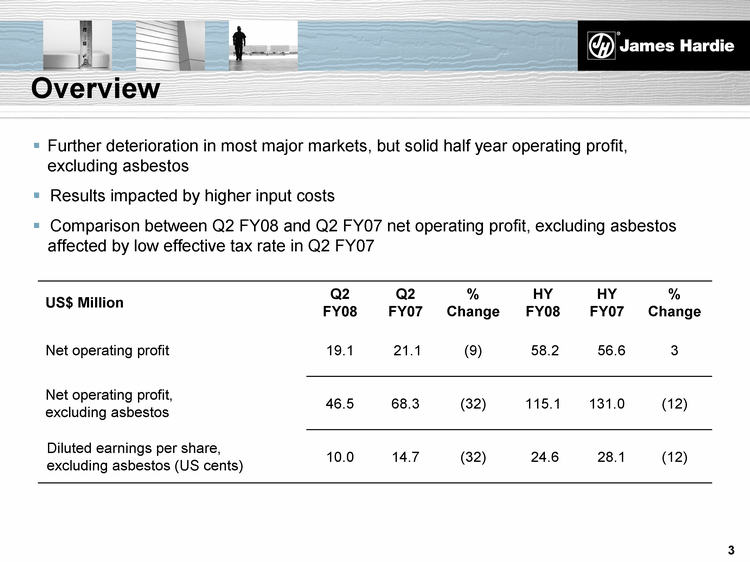
|
US$ Million Q2
FY08 Q2
FY07 %
Change HY
FY08 HY
FY07 %
Change
Net operating profit 19.1 21.1 (9) 58.2 56.6 3
Net operating profit,
excluding asbestos 46.5 68.3 (32) 115.1 131.0 (12)
Diluted earnings per share,
excluding asbestos (US cents) 10.0 14.7 (32) 24.6 28.1 (12)
Further deterioration in most major markets, but solid half year operating profit,
excluding asbestos
Results impacted by higher input costs
Comparison between Q2 FY08 and Q2 FY07 net operating profit, excluding asbestos
affected by low effective tax rate in Q2 FY07
Overview
|
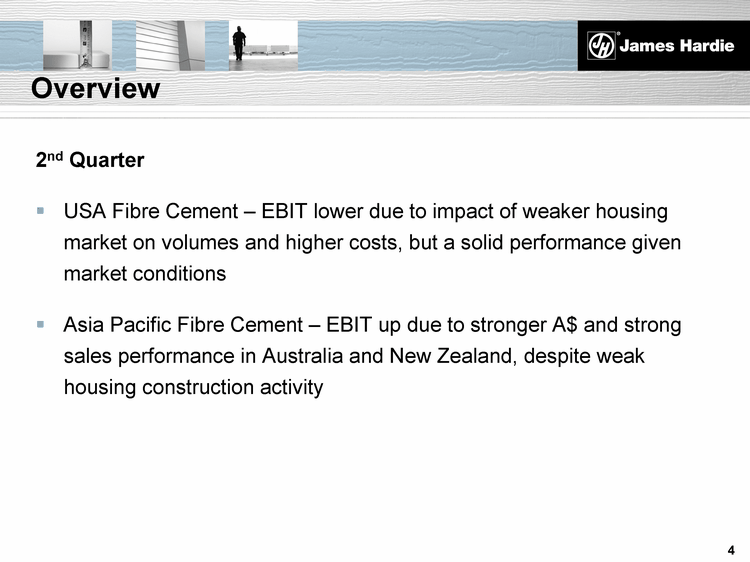
|
2nd Quarter
USA Fibre Cement - EBIT lower due to impact of weaker housing
market on volumes and higher costs, but a solid performance given
market conditions
Asia Pacific Fibre Cement - EBIT up due to stronger A$ and strong
sales performance in Australia and New Zealand, despite weak
housing construction activity
Overview
|
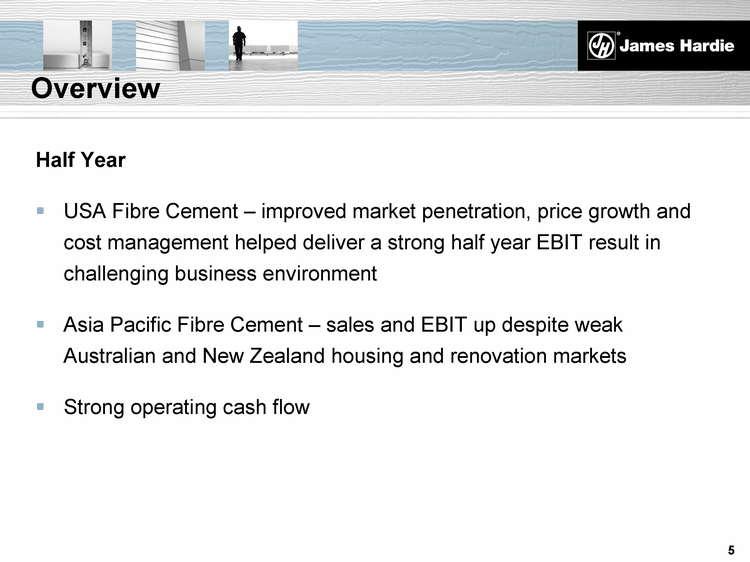
|
Half Year
USA Fibre Cement - improved market penetration, price growth and
cost management helped deliver a strong half year EBIT result in
challenging business environment
Asia Pacific Fibre Cement - sales and EBIT up despite weak
Australian and New Zealand housing and renovation markets
Strong operating cash flow
Overview
|
|
Operating Review
Louis Gries, CEO
|
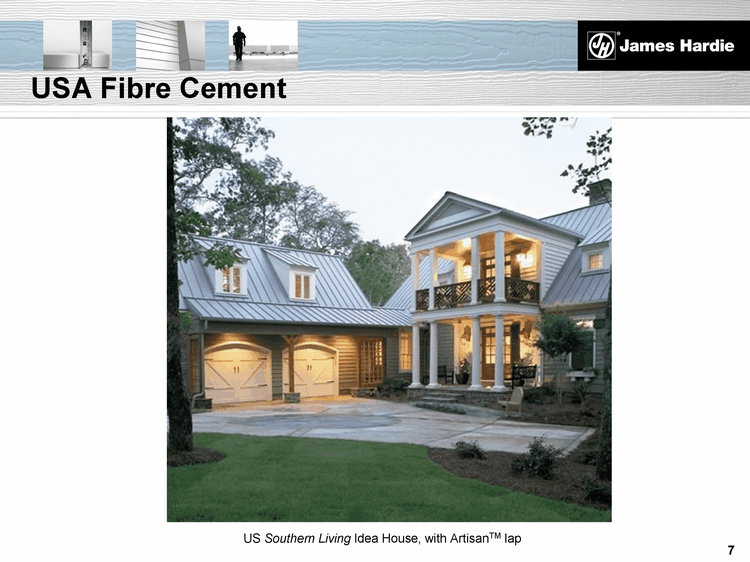
|
USA Fibre Cement
US Southern Living Idea House, with ArtisanTM lap
|
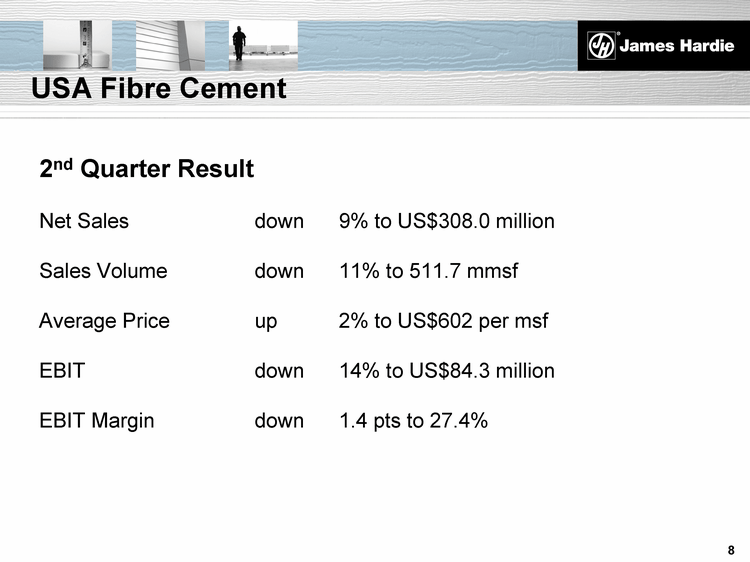
|
2nd Quarter Result
Net Sales down 9% to US$308.0 million
Sales Volume down 11% to 511.7 mmsf
Average Price up 2% to US$602 per msf
EBIT down 14% to US$84.3 million
EBIT Margin down 1.4 pts to 27.4%
USA Fibre Cement
|
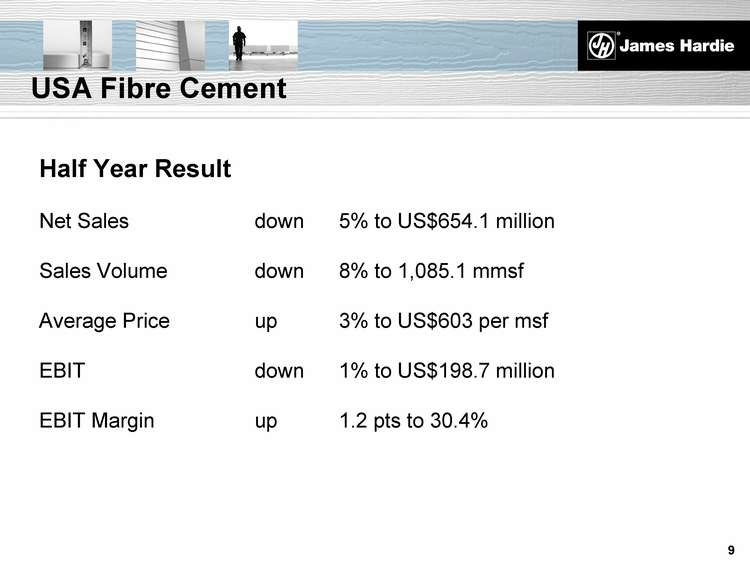
|
Half Year Result
Net Sales down 5% to US$654.1 million
Sales Volume down 8% to 1,085.1 mmsf
Average Price up 3% to US$603 per msf
EBIT down 1% to US$198.7 million
EBIT Margin up 1.2 pts to 30.4%
USA Fibre Cement
|
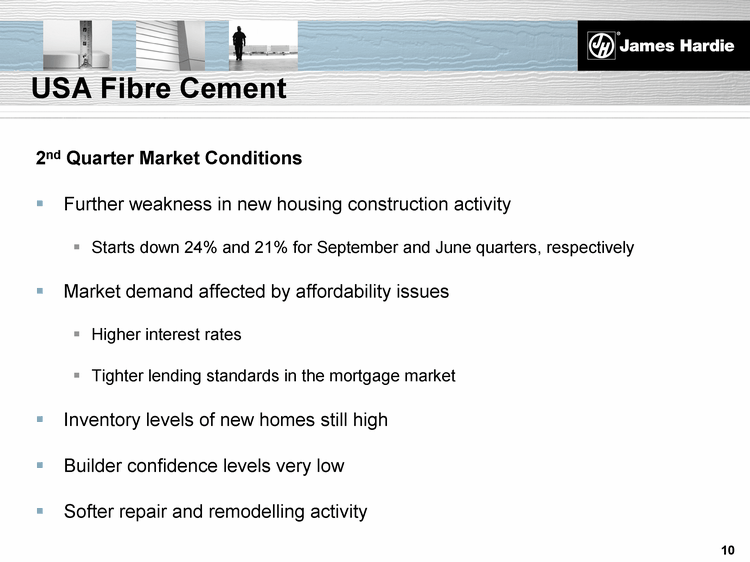
|
2nd Quarter Market Conditions
Further weakness in new housing construction activity
Starts down 24% and 21% for September and June quarters, respectively
Market demand affected by affordability issues
Higher interest rates
Tighter lending standards in the mortgage market
Inventory levels of new homes still high
Builder confidence levels very low
Softer repair and remodelling activity
USA Fibre Cement
|
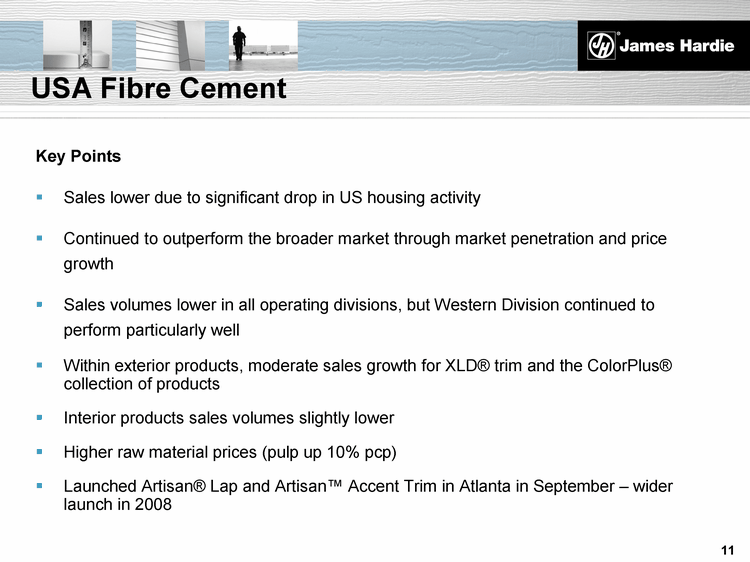
|
Key Points
Sales lower due to significant drop in US housing activity
Continued to outperform the broader market through market penetration and price
growth
Sales volumes lower in all operating divisions, but Western Division continued to
perform particularly well
Within exterior products, moderate sales growth for XLD(r) trim and the ColorPlus(r)
collection of products
Interior products sales volumes slightly lower
Higher raw material prices (pulp up 10% pcp)
Launched Artisan(r) Lap and Artisan(tm) Accent Trim in Atlanta in September - wider
launch in 2008
USA Fibre Cement
|
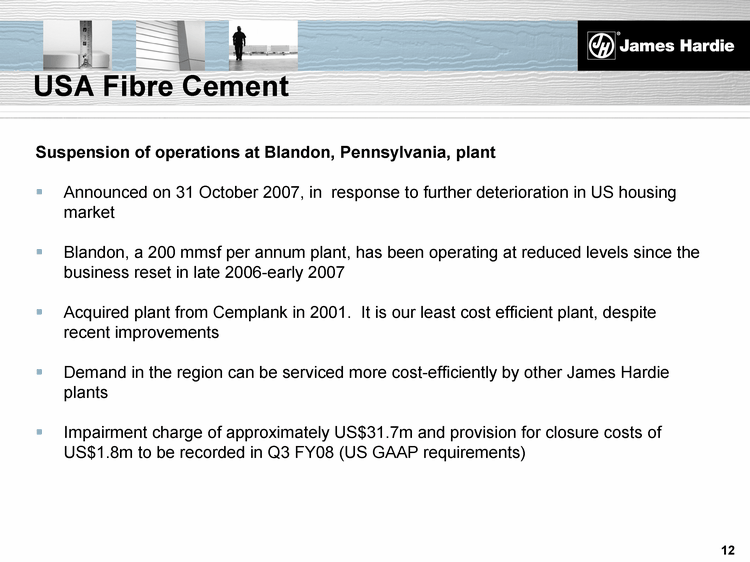
|
Suspension of operations at Blandon, Pennsylvania, plant
Announced on 31 October 2007, in response to further deterioration in US housing
market
Blandon, a 200 mmsf per annum plant, has been operating at reduced levels since the
business reset in late 2006-early 2007
Acquired plant from Cemplank in 2001. It is our least cost efficient plant, despite
recent improvements
Demand in the region can be serviced more cost-efficiently by other James Hardie
plants
Impairment charge of approximately US$31.7m and provision for closure costs of
US$1.8m to be recorded in Q3 FY08 (US GAAP requirements)
USA Fibre Cement
|
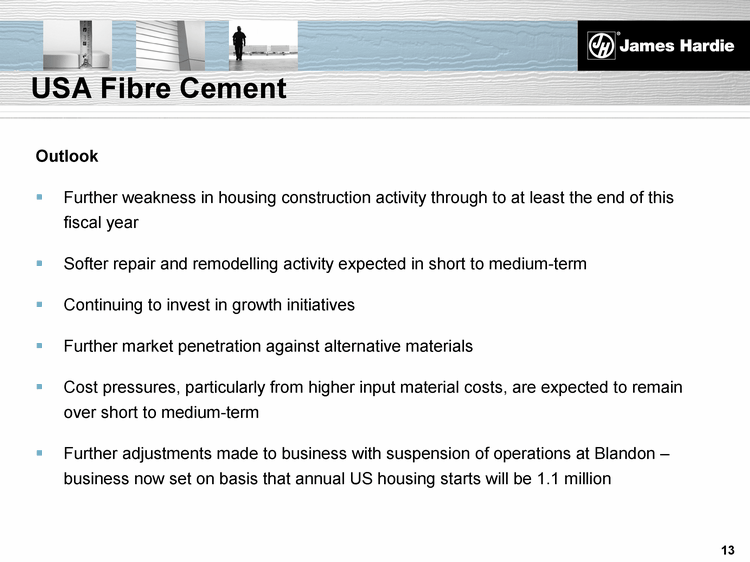
|
Outlook
Further weakness in housing construction activity through to at least the end of this
fiscal year
Softer repair and remodelling activity expected in short to medium-term
Continuing to invest in growth initiatives
Further market penetration against alternative materials
Cost pressures, particularly from higher input material costs, are expected to remain
over short to medium-term
Further adjustments made to business with suspension of operations at Blandon -
business now set on basis that annual US housing starts will be 1.1 million
USA Fibre Cement
|
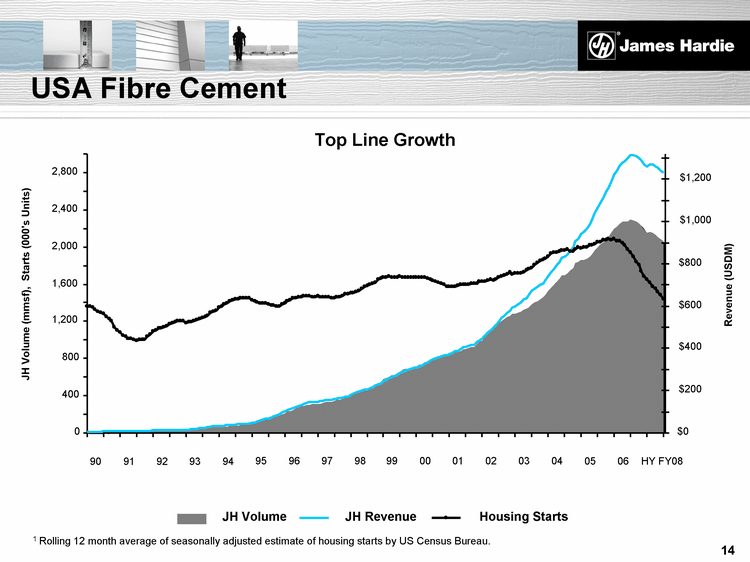
|
1 Rolling 12 month average of seasonally adjusted estimate of housing starts by US Census Bureau.
USA Fibre Cement
Top Line Growth
0
400
800
1,200
1,600
2,000
2,400
2,800
90
91
92
93
94
95
96
97
98
99
00
01
02
03
04
05
06
HY FY08
JH Volume (mmsf), Starts (000's Units)
$0
$200
$400
$600
$800
$1,000
$1,200
Revenue (USDM)
JH Volume
JH Revenue
Housing Starts
|
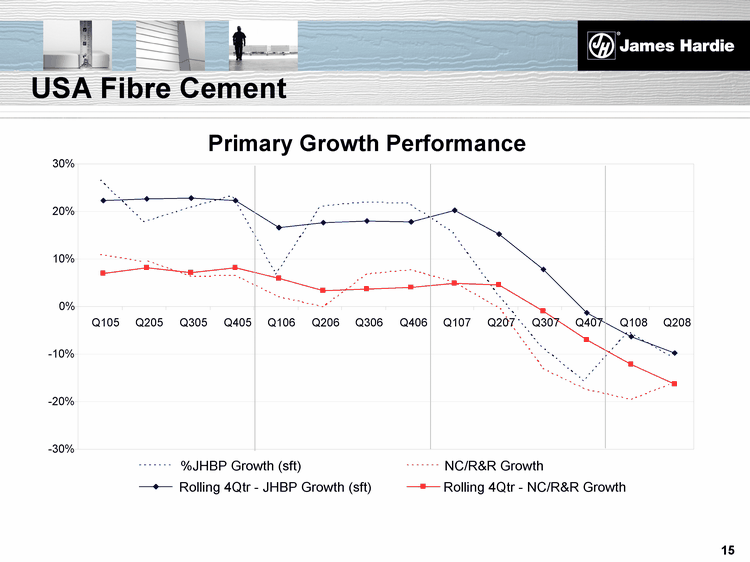
|
USA Fibre Cement
Primary Growth Performance
- -30%
- -20%
- -10%
0%
10%
20%
30%
Q105
Q205
Q305
Q405
Q106
Q206
Q306
Q406
Q107
Q207
Q307
Q407
Q108
Q208
%JHBP Growth (sft)
NC/R&R Growth
Rolling 4Qtr - JHBP Growth (sft)
Rolling 4Qtr - NC/R&R Growth
|
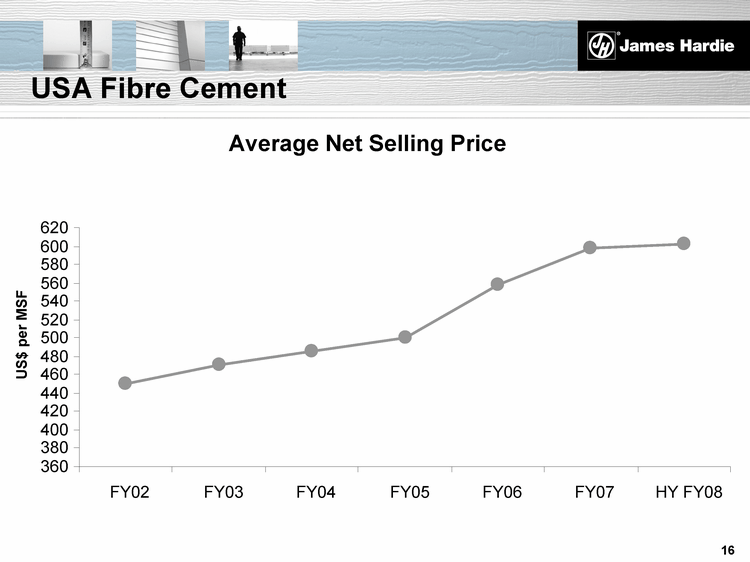
|
USA Fibre Cement
Average Net Selling Price
US$ per MSF
360
380
400
420
440
460
480
500
520
540
560
580
600
620
FY02
FY03
FY04
FY05
FY06
FY07
HY FY08
|
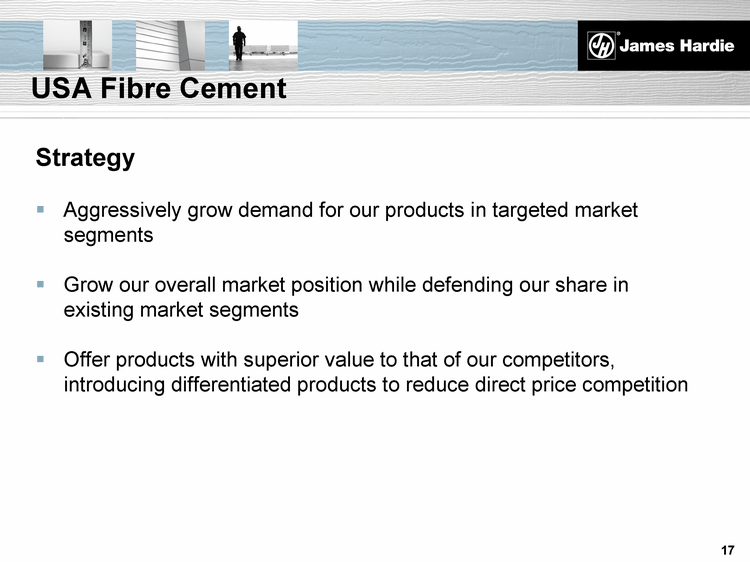
|
Strategy
Aggressively grow demand for our products in targeted market
segments
Grow our overall market position while defending our share in
existing market segments
Offer products with superior value to that of our competitors,
introducing differentiated products to reduce direct price competition
USA Fibre Cement
|
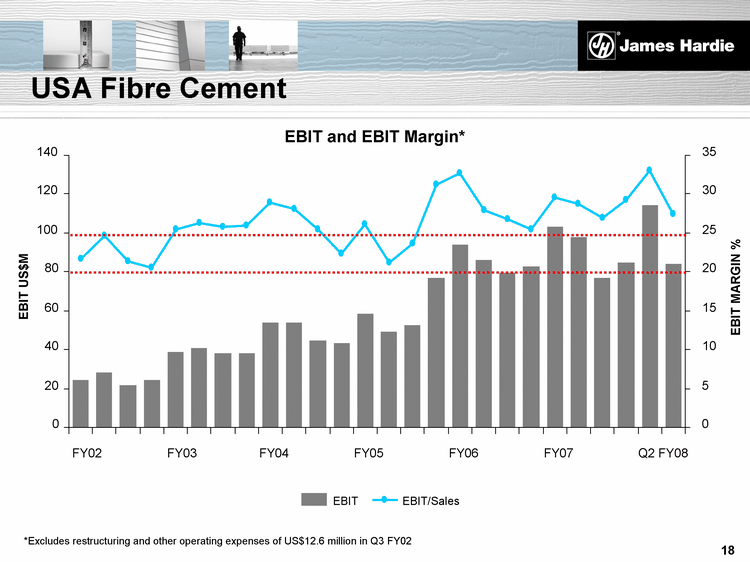
|
*Excludes restructuring and other operating expenses of US$12.6 million in Q3 FY02
USA Fibre Cement
0
20
40
60
80
100
120
140
FY02
FY03
FY04
FY05
FY06
FY07
Q2 FY08
EBIT US$M
0
5
10
15
20
25
30
35
EBIT MARGIN %
EBIT
EBIT/Sales
EBIT and EBIT Margin*
|
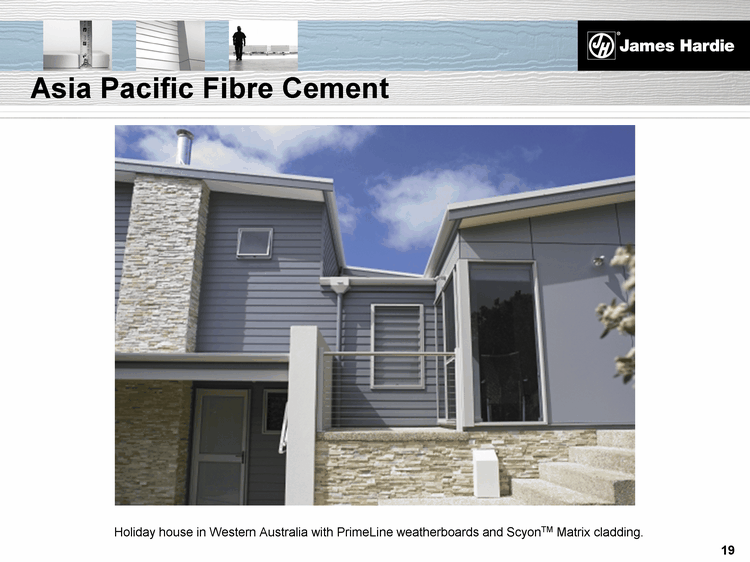
|
Asia Pacific Fibre Cement
Holiday house in Western Australia with PrimeLine weatherboards and ScyonTM Matrix cladding.
|
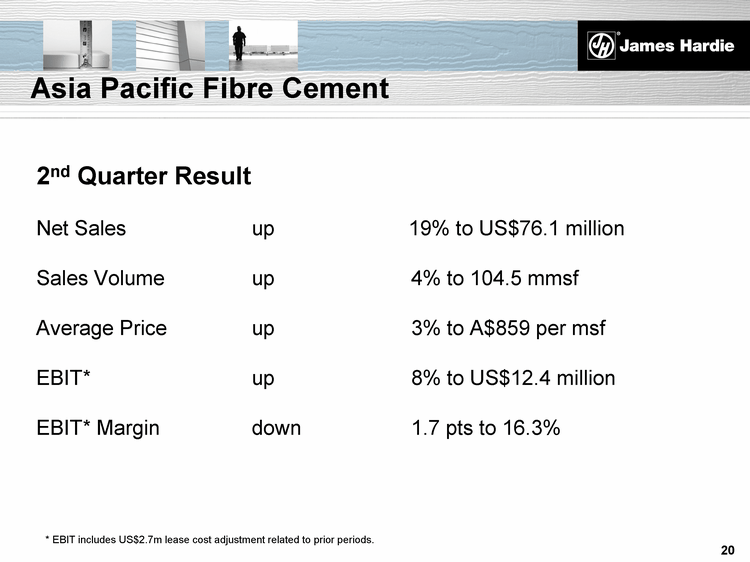
|
2nd Quarter Result
Net Sales up 19% to US$76.1 million
Sales Volume up 4% to 104.5 mmsf
Average Price up 3% to A$859 per msf
EBIT* up 8% to US$12.4 million
EBIT* Margin down 1.7 pts to 16.3%
Asia Pacific Fibre Cement
* EBIT includes US$2.7m lease cost adjustment related to prior periods.
|
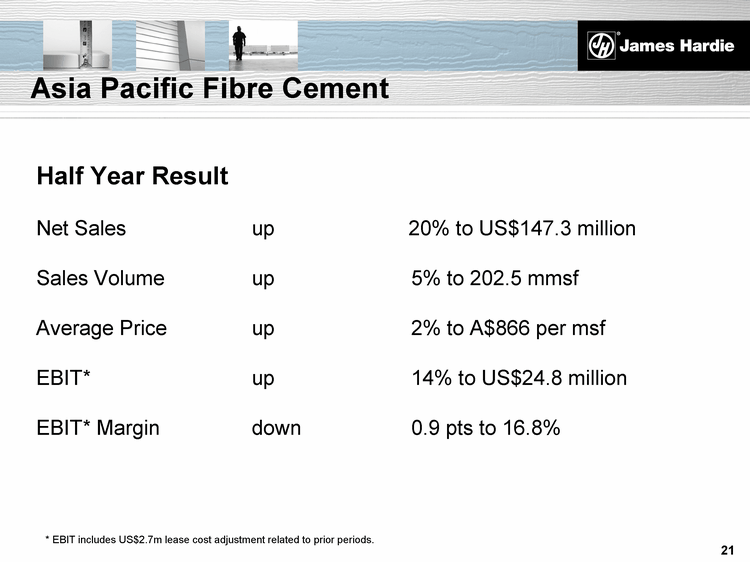
|
Half Year Result
Net Sales up 20% to US$147.3 million
Sales Volume up 5% to 202.5 mmsf
Average Price up 2% to A$866 per msf
EBIT* up 14% to US$24.8 million
EBIT* Margin down 0.9 pts to 16.8%
Asia Pacific Fibre Cement
* EBIT includes US$2.7m lease cost adjustment related to prior periods.
|
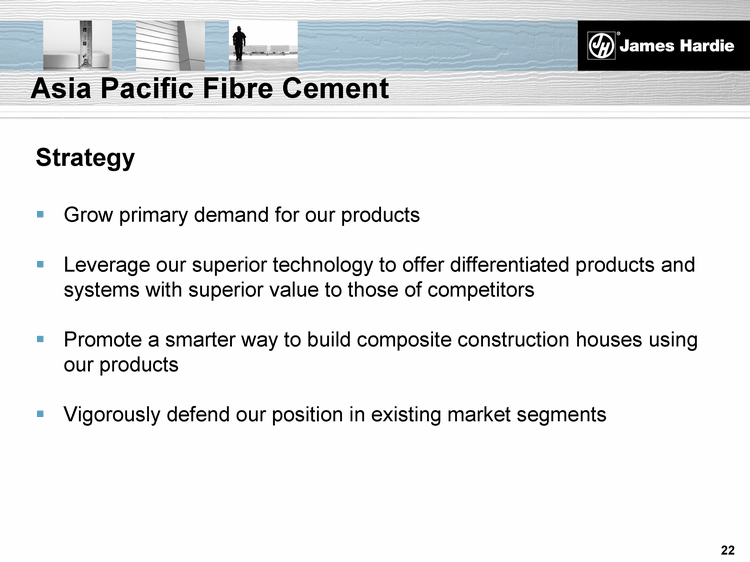
|
Strategy
Grow primary demand for our products
Leverage our superior technology to offer differentiated products and
systems with superior value to those of competitors
Promote a smarter way to build composite construction houses using
our products
Vigorously defend our position in existing market segments
Asia Pacific Fibre Cement
|
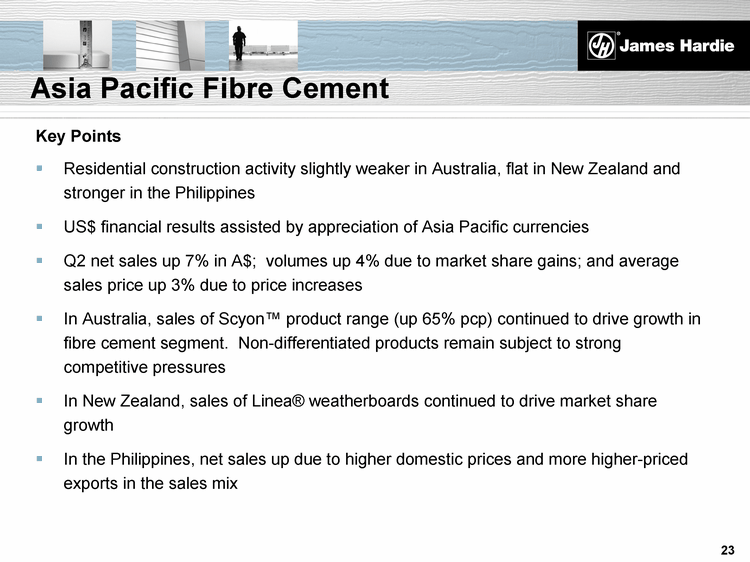
|
Key Points
Residential construction activity slightly weaker in Australia, flat in New Zealand and
stronger in the Philippines
US$ financial results assisted by appreciation of Asia Pacific currencies
Q2 net sales up 7% in A$; volumes up 4% due to market share gains; and average
sales price up 3% due to price increases
In Australia, sales of Scyon(tm) product range (up 65% pcp) continued to drive growth in
fibre cement segment. Non-differentiated products remain subject to strong
competitive pressures
In New Zealand, sales of Linea(r) weatherboards continued to drive market share
growth
In the Philippines, net sales up due to higher domestic prices and more higher-priced
exports in the sales mix
Asia Pacific Fibre Cement
|
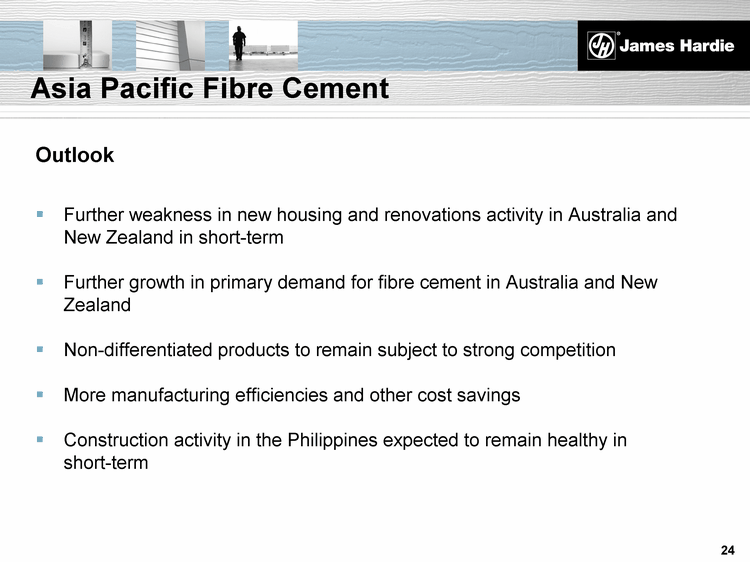
|
Outlook
Further weakness in new housing and renovations activity in Australia and
New Zealand in short-term
Further growth in primary demand for fibre cement in Australia and New
Zealand
Non-differentiated products to remain subject to strong competition
More manufacturing efficiencies and other cost savings
Construction activity in the Philippines expected to remain healthy in
short-term
Asia Pacific Fibre Cement
|
|
USA Hardie Pipe
Q2 net sales lower due to weaker residential and non-residential
construction activity in Florida
Impact of lower volumes partly offset by higher average net
sales price and improved manufacturing performance
Small EBIT loss for the quarter
Europe Fibre Cement
Sales continuing to grow steadily
Small EBIT loss
Other
|
|
USA Fibre Cement
Further weakness in US housing activity expected at least through
the remainder of fiscal 2008
Expect to continue outperforming the broader market
Asia Pacific Fibre Cement
Market conditions to remain challenging in Australia and New
Zealand, but further growth in primary demand for fibre cement
expected
Overall Outlook for Operations
|

|
Financial Review
Russell Chenu, CFO
|
|
Solid Q2 and half year operating performance given weaker market
conditions
Comparison of net operating profit excluding asbestos for Q2 and
half year affected by low effective tax rate in Q2 FY07 due to write
back of tax provisions
Current year tax rate increased slightly due to change in
geographical mix of earnings
Asbestos adjustments - Q2:
US$27.0m - unfavourable impact of stronger A$ on US$ asbestos liability
US$1.9m - unfavourable other adjustments
AICF claims costs for half year better than expected
Overview
|
|
Strong balance sheet
Net debt - US$89.9m
Cash and unused term facilities - US$265.1m
Announced significantly increased interim dividend of US 12 cents
(FY07 US 5 cents) - up 140%
Record date 4 December 2007; Payment date 18 December 2007
Commenced share buy-back
Capital Management
|
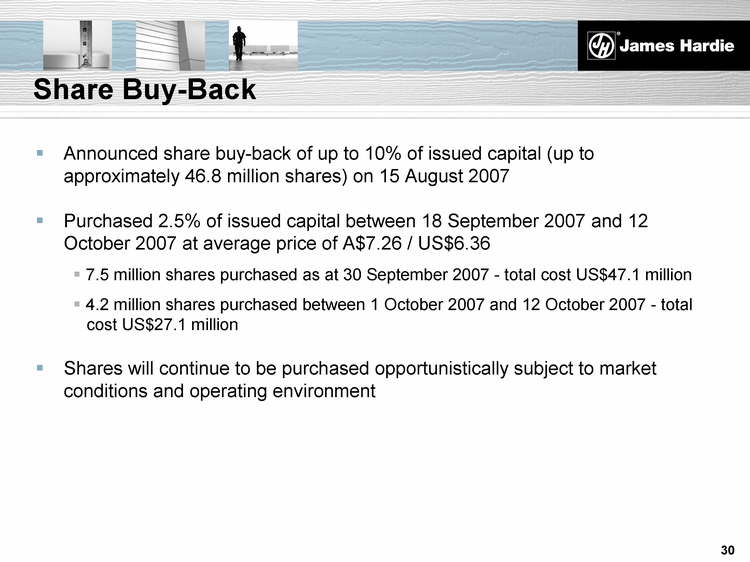
|
Share Buy-Back
Announced share buy-back of up to 10% of issued capital (up to
approximately 46.8 million shares) on 15 August 2007
Purchased 2.5% of issued capital between 18 September 2007 and 12
October 2007 at average price of A$7.26 / US$6.36
7.5 million shares purchased as at 30 September 2007 - total cost US$47.1 million
4.2 million shares purchased between 1 October 2007 and 12 October 2007 - total
cost US$27.1 million
Shares will continue to be purchased opportunistically subject to market
conditions and operating environment
|
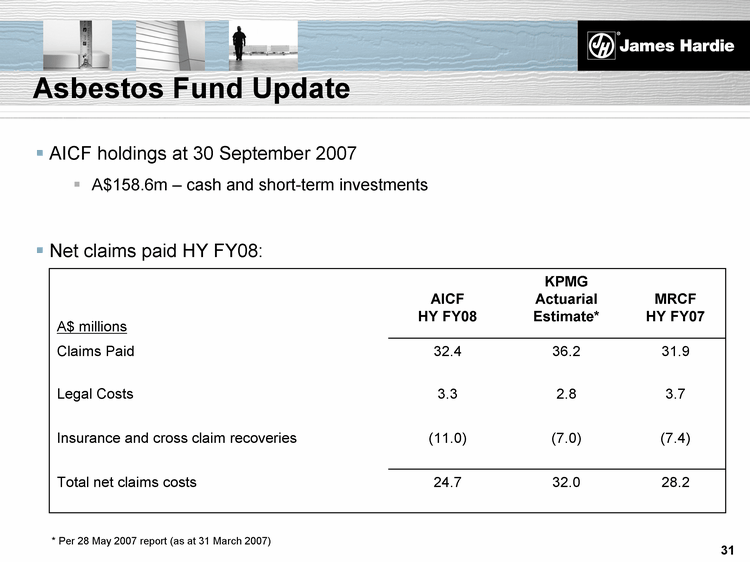
|
Asbestos Fund Update
AICF holdings at 30 September 2007
A$158.6m - cash and short-term investments
Net claims paid HY FY08:
A$ millions
AICF
HY FY08 KPMG
Actuarial
Estimate*
MRCF
HY FY07
Claims Paid 32.4 36.2 31.9
Legal Costs 3.3 2.8 3.7
Insurance and cross claim recoveries (11.0) (7.0) (7.4)
Total net claims costs 24.7 32.0 28.2
* Per 28 May 2007 report (as at 31 March 2007)
|
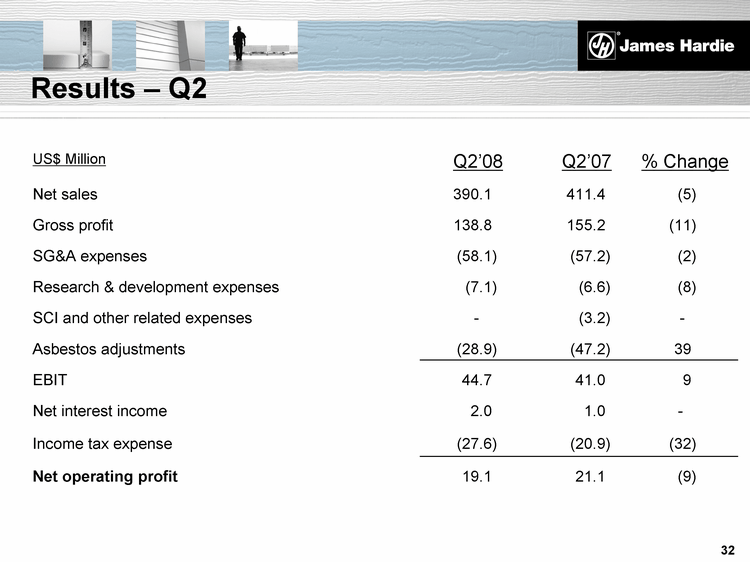
|
US$ Million
Q2'08
Q2'07
% Change
Net sales 390.1 411.4 (5)
Gross profit 138.8 155.2 (11)
SG&A expenses (58.1) (57.2) (2)
Research & development expenses (7.1) (6.6) (8)
SCI and other related expenses - (3.2) -
Asbestos adjustments (28.9) (47.2) 39
EBIT 44.7 41.0 9
Net interest income 2.0 1.0 -
Income tax expense (27.6) (20.9) (32)
Net operating profit 19.1 21.1 (9)
Results - Q2
|
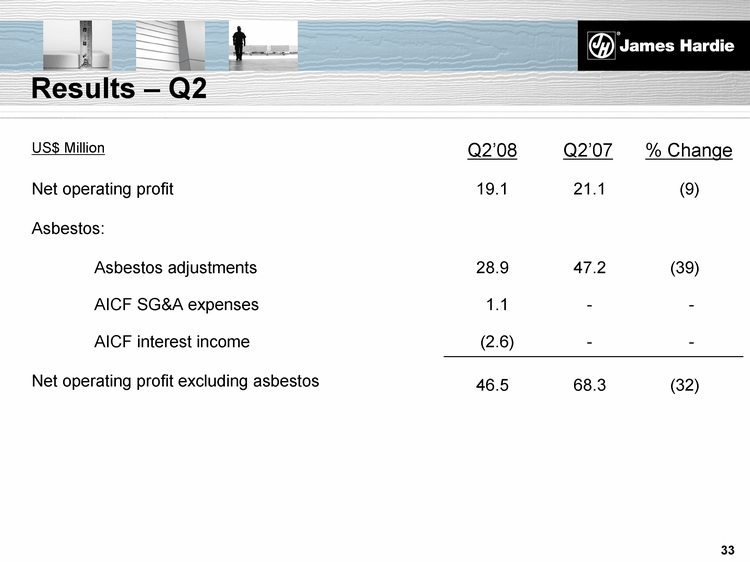
|
US$ Million
Q2'08
Q2'07
% Change
Net operating profit 19.1 21.1 (9)
Asbestos:
Asbestos adjustments 28.9 47.2 (39)
AICF SG&A expenses 1.1 - -
AICF interest income (2.6) - -
Net operating profit excluding asbestos 46.5 68.3 (32)
Results - Q2
|
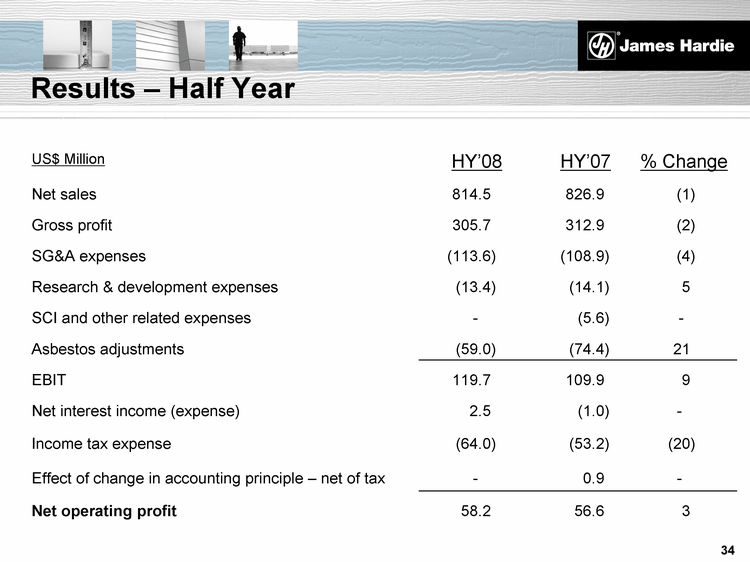
|
US$ Million
HY'08
HY'07
% Change
Net sales 814.5 826.9 (1)
Gross profit 305.7 312.9 (2)
SG&A expenses (113.6) (108.9) (4)
Research & development expenses (13.4) (14.1) 5
SCI and other related expenses - (5.6) -
Asbestos adjustments (59.0) (74.4) 21
EBIT 119.7 109.9 9
Net interest income (expense) 2.5 (1.0) -
Income tax expense (64.0) (53.2) (20)
Effect of change in accounting principle - net of tax - 0.9 -
Net operating profit 58.2 56.6 3
Results - Half Year
|
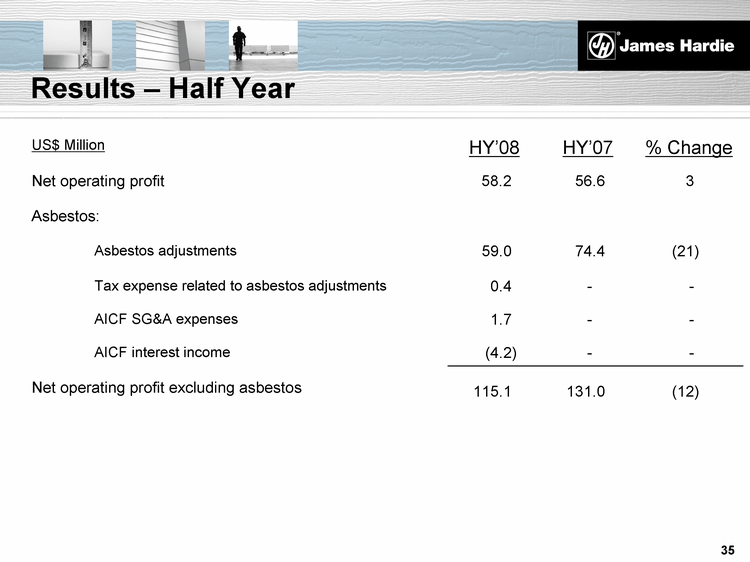
|
US$ Million
HY'08
HY'07
% Change
Net operating profit 58.2 56.6 3
Asbestos:
Asbestos adjustments 59.0 74.4 (21)
Tax expense related to asbestos adjustments 0.4 - -
AICF SG&A expenses 1.7 - -
AICF interest income (4.2) - -
Net operating profit excluding asbestos 115.1 131.0 (12)
Results - Half Year
|
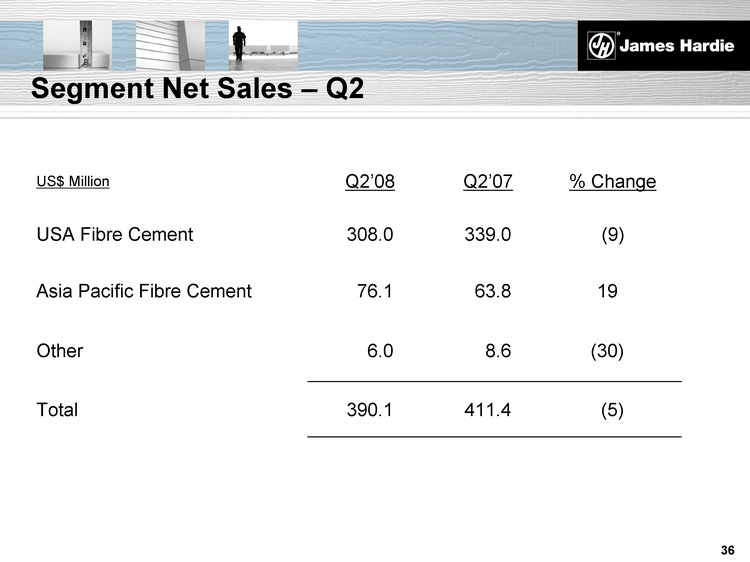
|
US$ Million Q2'08 Q2'07 % Change
USA Fibre Cement 308.0 339.0 (9)
Asia Pacific Fibre Cement 76.1 63.8 19
Other 6.0 8.6 (30)
Total 390.1 411.4 (5)
Segment Net Sales - Q2
|
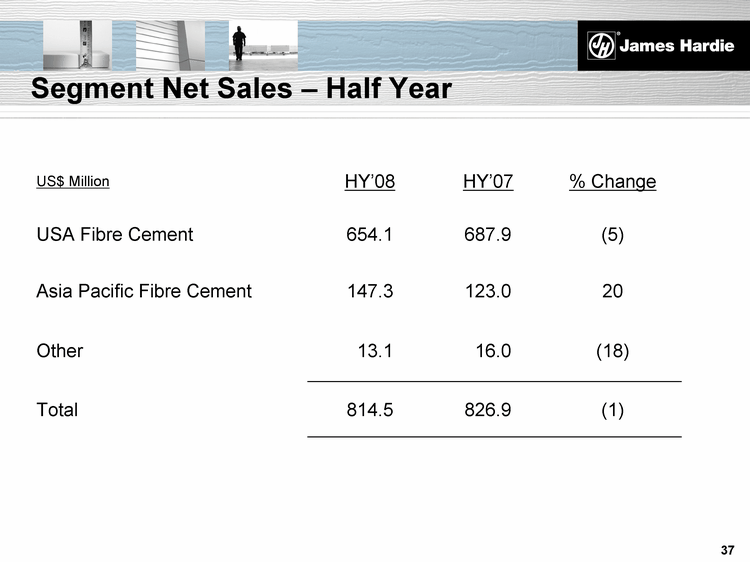
|
US$ Million HY'08 HY'07 % Change
USA Fibre Cement 654.1 687.9 (5)
Asia Pacific Fibre Cement 147.3 123.0 20
Other 13.1 16.0 (18)
Total 814.5 826.9 (1)
Segment Net Sales - Half Year
|
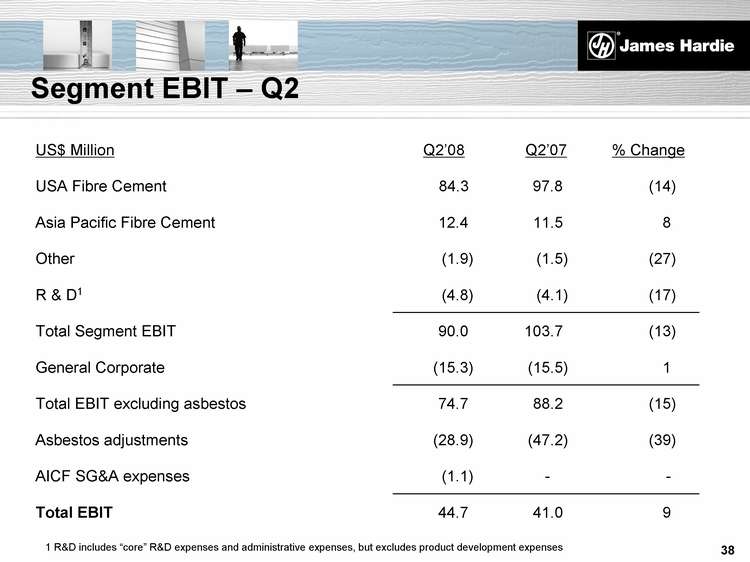
|
US$ Million Q2'08 Q2'07 % Change
USA Fibre Cement 84.3 97.8 (14)
Asia Pacific Fibre Cement 12.4 11.5 8
Other (1.9) (1.5) (27)
R & D1 (4.8) (4.1) (17)
Total Segment EBIT 90.0 103.7 (13)
General Corporate (15.3) (15.5) 1
Total EBIT excluding asbestos 74.7 88.2 (15)
Asbestos adjustments (28.9) (47.2) (39)
AICF SG&A expenses (1.1) - -
Total EBIT 44.7 41.0 9
1 R&D includes "core" R&D expenses and administrative expenses, but excludes product development expenses
Segment EBIT - Q2
|
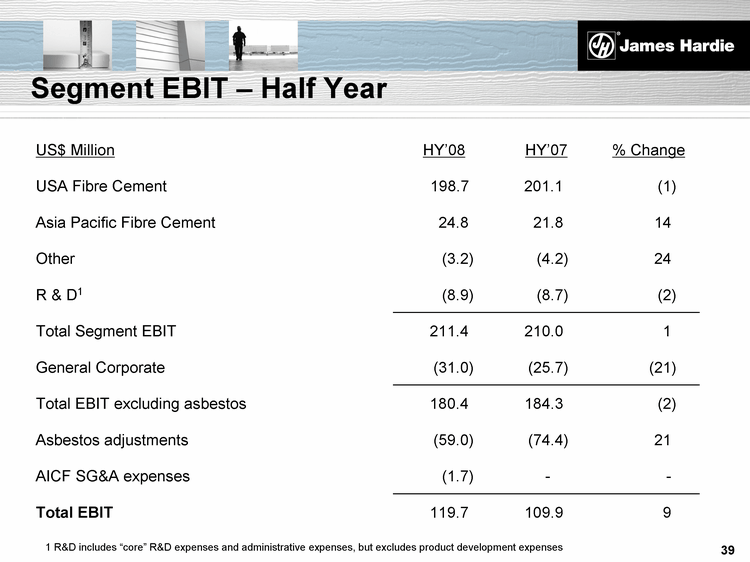
|
US$ Million HY'08 HY'07 % Change
USA Fibre Cement 198.7 201.1 (1)
Asia Pacific Fibre Cement 24.8 21.8 14
Other (3.2) (4.2) 24
R & D1 (8.9) (8.7) (2)
Total Segment EBIT 211.4 210.0 1
General Corporate (31.0) (25.7) (21)
Total EBIT excluding asbestos 180.4 184.3 (2)
Asbestos adjustments (59.0) (74.4) 21
AICF SG&A expenses (1.7) - -
Total EBIT 119.7 109.9 9
1 R&D includes "core" R&D expenses and administrative expenses, but excludes product development expenses
Segment EBIT - Half Year
|
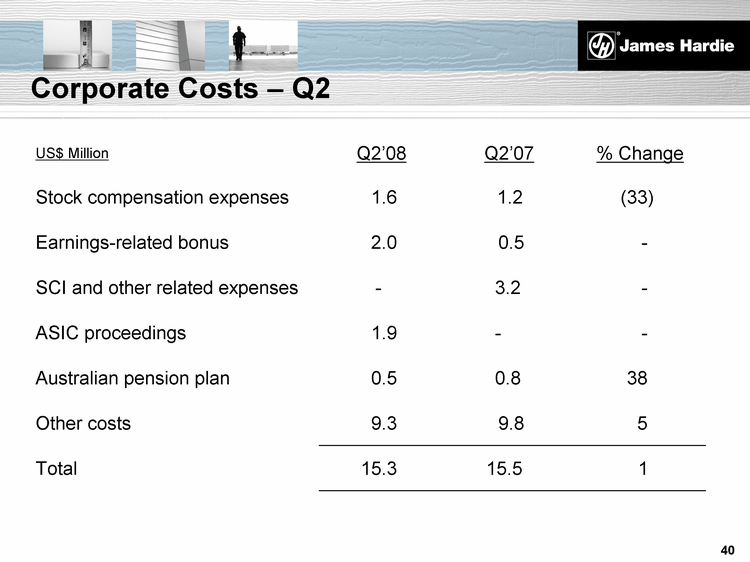
|
US$ Million Q2'08 Q2'07 % Change
Stock compensation expenses 1.6 1.2 (33)
Earnings-related bonus 2.0 0.5 -
SCI and other related expenses - 3.2 -
ASIC proceedings 1.9 - -
Australian pension plan 0.5 0.8 38
Other costs 9.3 9.8 5
Total 15.3 15.5 1
Corporate Costs - Q2
|
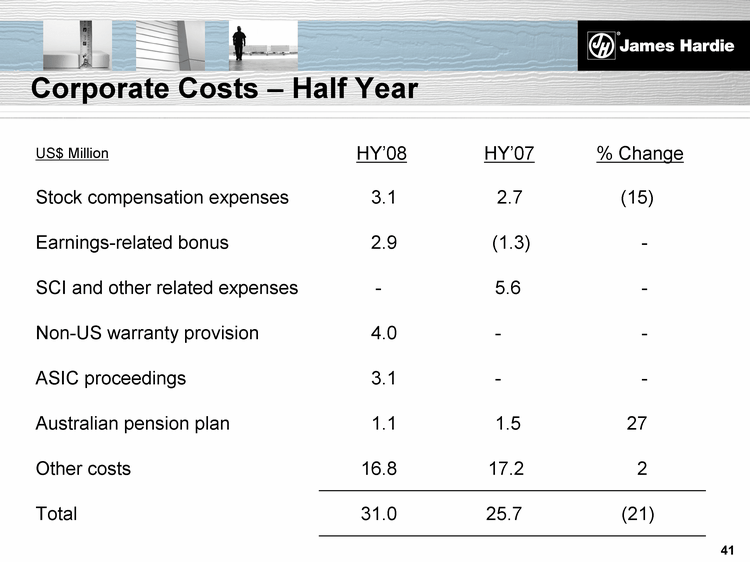
|
US$ Million HY'08 HY'07 % Change
Stock compensation expenses 3.1 2.7 (15)
Earnings-related bonus 2.9 (1.3) -
SCI and other related expenses - 5.6 -
Non-US warranty provision 4.0 - -
ASIC proceedings 3.1 - -
Australian pension plan 1.1 1.5 27
Other costs 16.8 17.2 2
Total 31.0 25.7 (21)
Corporate Costs - Half Year
|
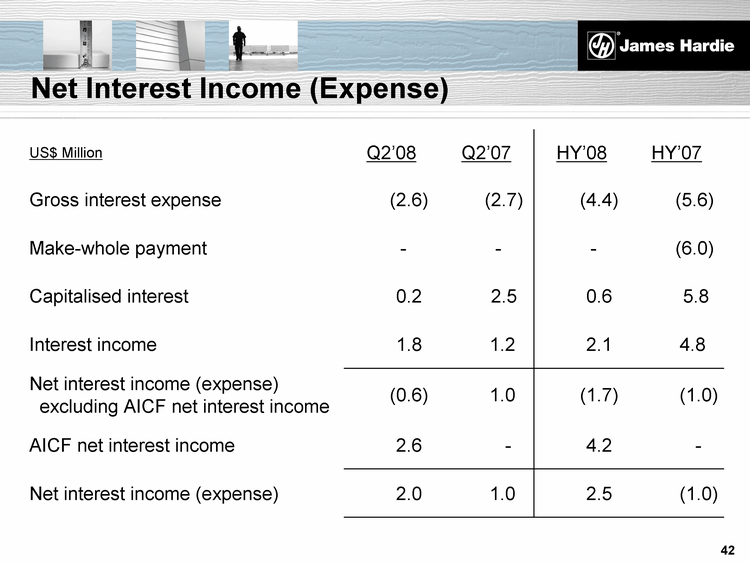
|
Net Interest Income (Expense)
US$ Million Q2'08 Q2'07 HY'08 HY'07
Gross interest expense (2.6) (2.7) (4.4) (5.6)
Make-whole payment - - - (6.0)
Capitalised interest 0.2 2.5 0.6 5.8
Interest income 1.8 1.2 2.1 4.8
Net interest income (expense)
excluding AICF net interest income (0.6) 1.0 (1.7) (1.0)
AICF net interest income 2.6 - 4.2 -
Net interest income (expense) 2.0 1.0 2.5 (1.0)
|
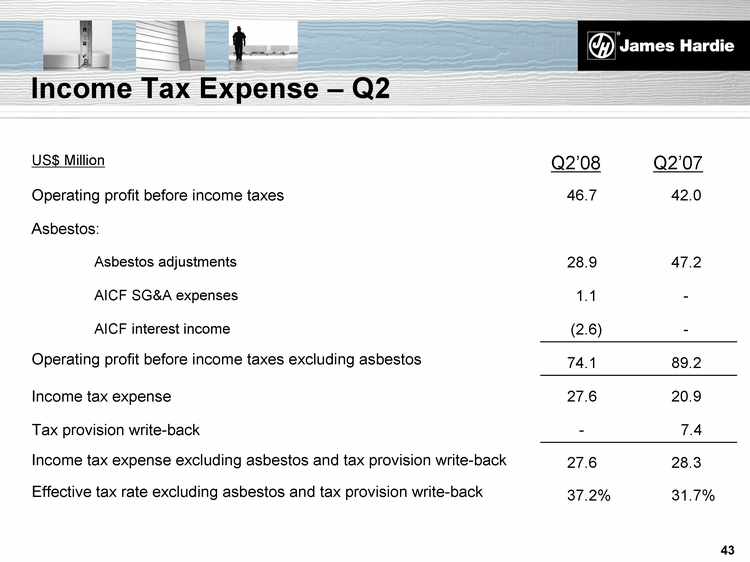
|
US$ Million
Q2'08
Q2'07
Operating profit before income taxes 46.7 42.0
Asbestos:
Asbestos adjustments 28.9 47.2
AICF SG&A expenses 1.1 -
AICF interest income (2.6) -
Operating profit before income taxes excluding asbestos 74.1 89.2
Income tax expense 27.6 20.9
Tax provision write-back - 7.4
Income tax expense excluding asbestos and tax provision write-back 27.6 28.3
Effective tax rate excluding asbestos and tax provision write-back 37.2% 31.7%
Income Tax Expense - Q2
|
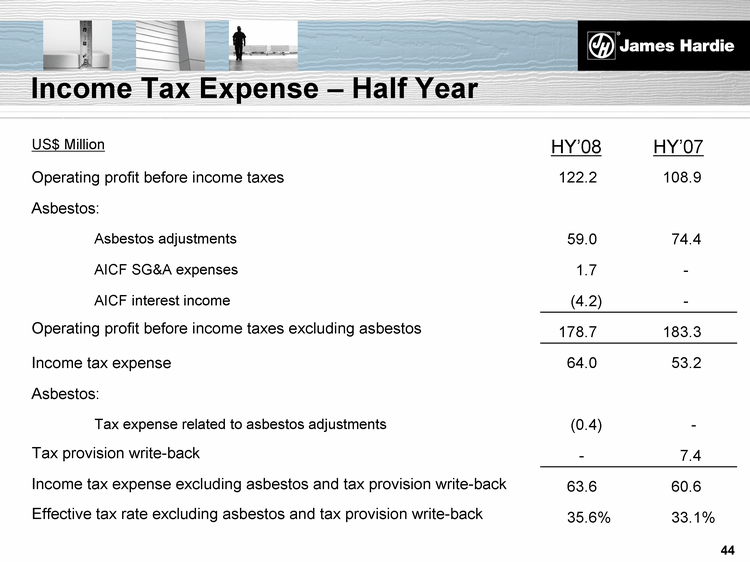
|
US$ Million
HY'08
HY'07
Operating profit before income taxes 122.2 108.9
Asbestos:
Asbestos adjustments 59.0 74.4
AICF SG&A expenses 1.7 -
AICF interest income (4.2) -
Operating profit before income taxes excluding asbestos 178.7 183.3
Income tax expense 64.0 53.2
Asbestos:
Tax expense related to asbestos adjustments (0.4) -
Tax provision write-back - 7.4
Income tax expense excluding asbestos and tax provision write-back 63.6 60.6
Effective tax rate excluding asbestos and tax provision write-back 35.6% 33.1%
Income Tax Expense - Half Year
|
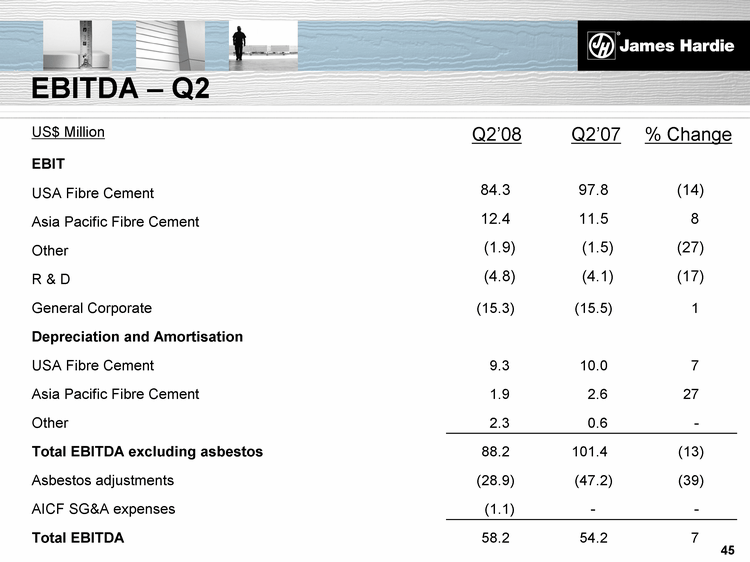
|
US$ Million
Q2'08
Q2'07
% Change
EBIT
USA Fibre Cement 84.3 97.8 (14)
Asia Pacific Fibre Cement 12.4 11.5 8
Other (1.9) (1.5) (27)
R & D (4.8) (4.1) (17)
General Corporate (15.3) (15.5) 1
Depreciation and Amortisation
USA Fibre Cement 9.3 10.0 7
Asia Pacific Fibre Cement 1.9 2.6 27
Other 2.3 0.6 -
Total EBITDA excluding asbestos 88.2 101.4 (13)
Asbestos adjustments (28.9) (47.2) (39)
AICF SG&A expenses (1.1) - -
Total EBITDA 58.2 54.2 7
EBITDA - Q2
|
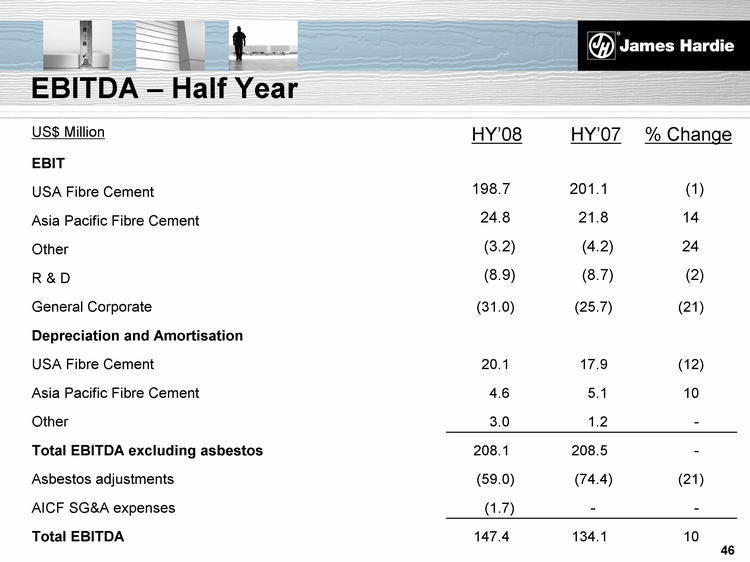
|
US$ Million
HY'08
HY'07
% Change
EBIT
USA Fibre Cement 198.7 201.1 (1)
Asia Pacific Fibre Cement 24.8 21.8 14
Other (3.2) (4.2) 24
R & D (8.9) (8.7) (2)
General Corporate (31.0) (25.7) (21)
Depreciation and Amortisation
USA Fibre Cement 20.1 17.9 (12)
Asia Pacific Fibre Cement 4.6 5.1 10
Other 3.0 1.2 -
Total EBITDA excluding asbestos 208.1 208.5 -
Asbestos adjustments (59.0) (74.4) (21)
AICF SG&A expenses (1.7) - -
Total EBITDA 147.4 134.1 10
EBITDA - Half Year
|
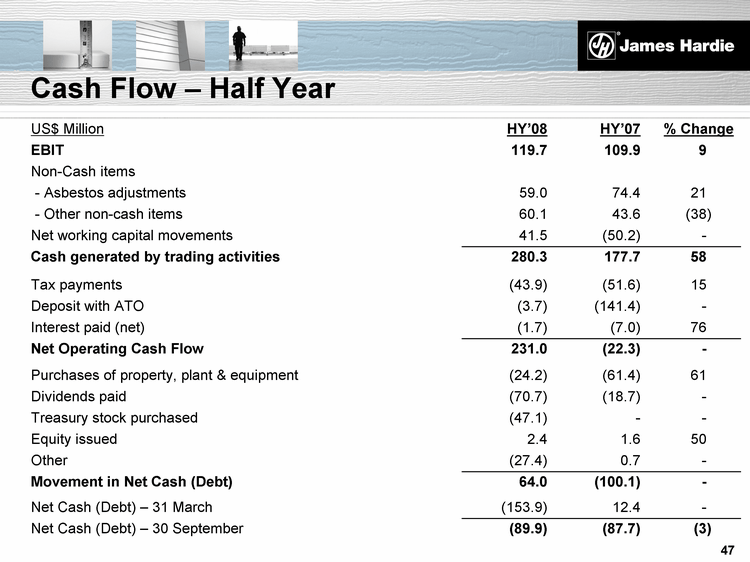
|
Cash Flow - Half Year
US$ Million HY'08 HY'07 % Change
EBIT 119.7 109.9 9
Non-Cash items
- Asbestos adjustments 59.0 74.4 21
- Other non-cash items 60.1 43.6 (38)
Net working capital movements 41.5 (50.2) -
Cash generated by trading activities 280.3 177.7 58
Tax payments (43.9) (51.6) 15
Deposit with ATO (3.7) (141.4) -
Interest paid (net) (1.7) (7.0) 76
Net Operating Cash Flow 231.0 (22.3) -
Purchases of property, plant & equipment (24.2) (61.4) 61
Dividends paid (70.7) (18.7) -
Treasury stock purchased (47.1) - -
Equity issued 2.4 1.6 50
Other (27.4) 0.7 -
Movement in Net Cash (Debt) 64.0 (100.1) -
Net Cash (Debt) - 31 March (153.9) 12.4 -
Net Cash (Debt) - 30 September (89.9) (87.7) (3)
|
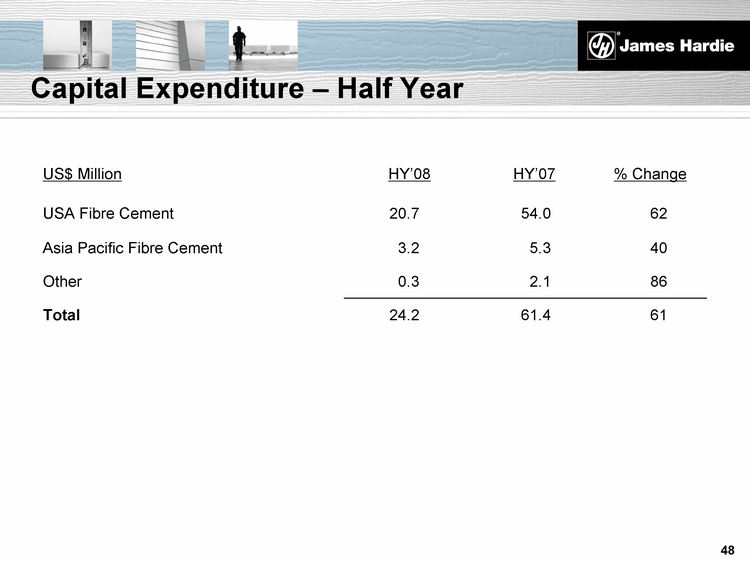
|
US$ Million HY'08 HY'07 % Change
USA Fibre Cement 20.7 54.0 62
Asia Pacific Fibre Cement 3.2 5.3 40
Other 0.3 2.1 86
Total 24.2 61.4 61
Capital Expenditure - Half Year
|
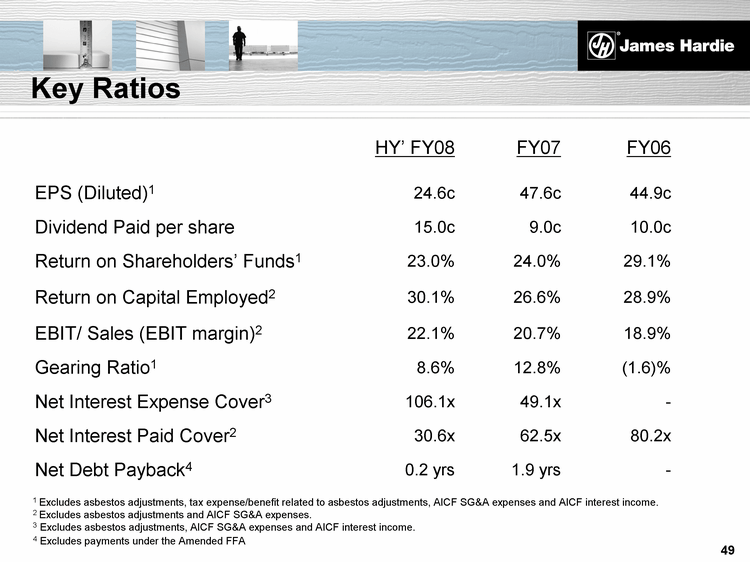
|
HY' FY08 FY07 FY06
EPS (Diluted)1 24.6c 47.6c 44.9c
Dividend Paid per share 15.0c 9.0c 10.0c
Return on Shareholders' Funds1 23.0% 24.0% 29.1%
Return on Capital Employed2 30.1% 26.6% 28.9%
EBIT/ Sales (EBIT margin)2 22.1% 20.7% 18.9%
Gearing Ratio1 8.6% 12.8% (1.6)%
Net Interest Expense Cover3 106.1x 49.1x -
Net Interest Paid Cover2 30.6x 62.5x 80.2x
Net Debt Payback4 0.2 yrs 1.9 yrs -
1 Excludes asbestos adjustments, tax expense/benefit related to asbestos adjustments, AICF SG&A expenses and AICF interest income.
2 Excludes asbestos adjustments and AICF SG&A expenses.
3 Excludes asbestos adjustments, AICF SG&A expenses and AICF interest income.
4 Excludes payments under the Amended FFA
Key Ratios
|
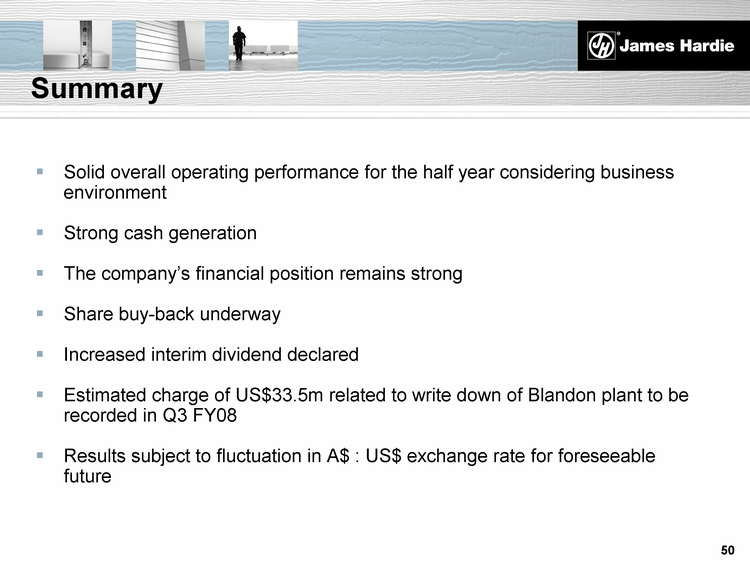
|
Solid overall operating performance for the half year considering business
environment
Strong cash generation
The company's financial position remains strong
Share buy-back underway
Increased interim dividend declared
Estimated charge of US$33.5m related to write down of Blandon plant to be
recorded in Q3 FY08
Results subject to fluctuation in A$ : US$ exchange rate for foreseeable
future
Summary
|
|
Disclaimer
This Management Presentation contains forward-looking statements. We may from time to time make forward-looking statements in our periodic
reports filed with or furnished to the United States Securities and Exchange Commission on Forms 20-F and 6-K, in our annual reports to
shareholders, in offering circulars and prospectuses, in media releases and other written materials and in oral statements made by our officers,
directors or employees to analysts, institutional investors, representatives of the media and others. Examples of forward-looking statements
include:
expectations about the timing and amount of payments to the Asbestos Injuries Compensation Fund (AICF), a special purpose fund for the
compensation of proven asbestos-related personal injury and death claims;
expectations with respect to the effect on our financial statements of those payments;
statements as to the possible consequences of proceedings brought against us and certain of our former directors and officers by the Australian
Securities and Investments Commission;
expectations that our credit facilities will be extended or renewed;
projections of our operating results or financial condition;
statements regarding our plans, objectives or goals, including those relating to competition, acquisitions, dispositions and our products;
statements about our future performance;
statements about product or environmental liabilities; and
statements regarding tax liabilities and related proceedings.
Words such as "believe," "anticipate," "plan," "expect," "intend," "target," "estimate," "project," "predict," "forecast," "guideline," "should," "aim" and
similar expressions are intended to identify forward-looking statements but are not the exclusive means of identifying such statements.
Forward-looking statements involve inherent risks and uncertainties. We caution you that a number of important factors could cause actual results
to differ materially from the plans, objectives, expectations, estimates and intentions expressed in such forward-looking statements. These factors,
some of which are discussed under "Risk Factors" beginning on page 6 of our Form 20-F filed on 6 July 2007 with the Securities and
Exchange Commission, include but are not limited to: all matters relating to or arising out of the prior manufacture of products that contained
asbestos by current and former James Hardie subsidiaries; required contributions to the AICF and the effect of foreign exchange on the amount
recorded in our financial statements as an asbestos liability; compliance with and changes in tax laws and treatments; competition and product
pricing in the markets in which we operate; the consequences of product failures or defects; exposure to environmental, asbestos or other legal
proceedings; general economic and market conditions; the supply and cost of raw materials; the success of our research and development efforts;
our reliance on a small number of product distributors; compliance with and changes in environmental and health and safety laws; risks of
conducting business internationally; compliance with and changes in laws and regulations; foreign exchange risks; the successful implementation
of new software systems; and the effect of natural disasters. We caution you that the foregoing list of factors is not exhaustive and that other risks
and uncertainties may cause actual results to differ materially from those in forward-looking statements. Forward-looking statements speak only as
of the date they are made.
|
|
Endnotes
This Management Presentation forms part of a package of information about the company's results. It should be read in conjunction with the other
parts of this package, including Management's Analysis of Results, a Media Release and a Financial Report.
Definitions
Financial Measures - US GAAP equivalents
EBIT and EBIT Margin - EBIT, as used in this document, is equivalent to the US GAAP measure of operating income. EBIT margin is defined as
EBIT as a percentage of net sales. We believe EBIT and EBIT margin to be relevant and useful information as these are the primary measures used
by our management to measure the operating profit or loss of our business. EBIT is one of several metrics used by our management to measure the
earnings generated from our operations, excluding interest and income tax expenses. Additionally, EBIT is believed to be a primary measure and
terminology used by our Australian investors. EBIT and EBIT margin should be considered in addition to, but not as a substitute for, other measures
of financial performance reported in accordance with accounting principles generally accepted in the United States of America. EBIT and EBIT margin,
as we have defined them, may not be comparable to similarly titled measures reported by other companies.
Operating profit - is equivalent to the US GAAP measure of income.
Net operating profit - is equivalent to the US GAAP measure of net income.
Sales Volumes
mmsf - million square feet
msf - thousand square feet
|
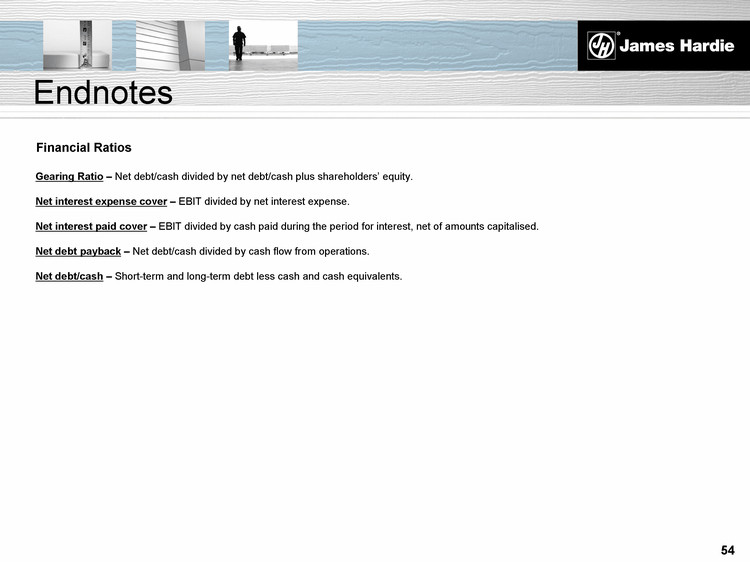
|
Endnotes
Financial Ratios
Gearing Ratio - Net debt/cash divided by net debt/cash plus shareholders' equity.
Net interest expense cover - EBIT divided by net interest expense.
Net interest paid cover - EBIT divided by cash paid during the period for interest, net of amounts capitalised.
Net debt payback - Net debt/cash divided by cash flow from operations.
Net debt/cash - Short-term and long-term debt less cash and cash equivalents.
|
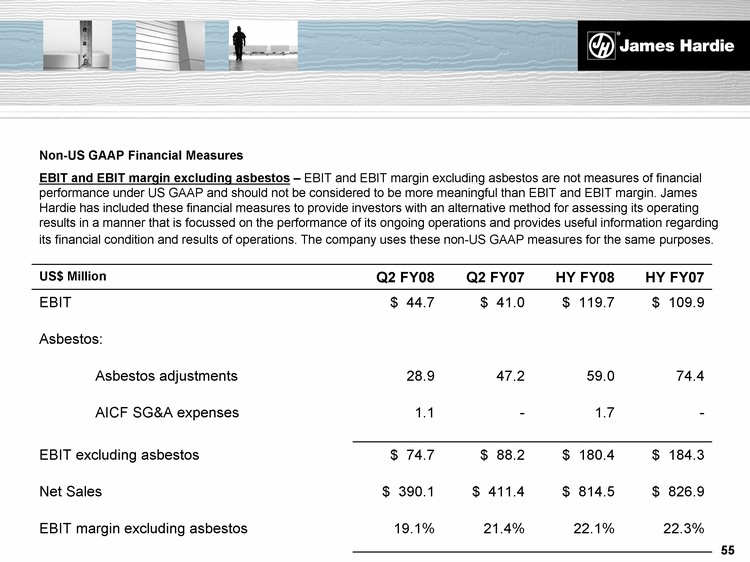
|
Non-US GAAP Financial Measures
EBIT and EBIT margin excluding asbestos - EBIT and EBIT margin excluding asbestos are not measures of financial
performance under US GAAP and should not be considered to be more meaningful than EBIT and EBIT margin. James
Hardie has included these financial measures to provide investors with an alternative method for assessing its operating
results in a manner that is focussed on the performance of its ongoing operations and provides useful information regarding
its financial condition and results of operations. The company uses these non-US GAAP measures for the same purposes.
US$ Million Q2 FY08 Q2 FY07 HY FY08 HY FY07
EBIT $ 44.7 $ 41.0 $ 119.7 $ 109.9
Asbestos:
Asbestos adjustments 28.9 47.2 59.0 74.4
AICF SG&A expenses
1.1 - 1.7 -
EBIT excluding asbestos $ 74.7 $ 88.2 $ 180.4 $ 184.3
Net Sales $ 390.1 $ 411.4 $ 814.5 $ 826.9
EBIT margin excluding asbestos 19.1% 21.4% 22.1% 22.3%
|
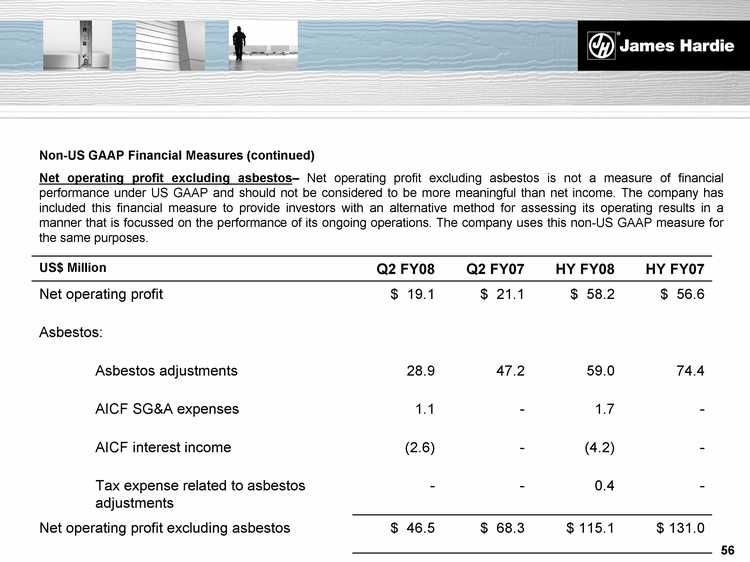
|
Non-US GAAP Financial Measures (continued)
Net operating profit excluding asbestos- Net operating profit excluding asbestos is not a measure of financial
performance under US GAAP and should not be considered to be more meaningful than net income. The company has
included this financial measure to provide investors with an alternative method for assessing its operating results in a
manner that is focussed on the performance of its ongoing operations. The company uses this non-US GAAP measure for
the same purposes.
US$ Million Q2 FY08 Q2 FY07 HY FY08 HY FY07
Net operating profit $ 19.1 $ 21.1 $ 58.2 $ 56.6
Asbestos:
Asbestos adjustments 28.9 47.2 59.0 74.4
AICF SG&A expenses 1.1 - 1.7 -
AICF interest income (2.6) - (4.2) -
Tax expense related to asbestos adjustments - - 0.4 -
Net operating profit excluding asbestos $ 46.5 $ 68.3 $ 115.1 $ 131.0
|
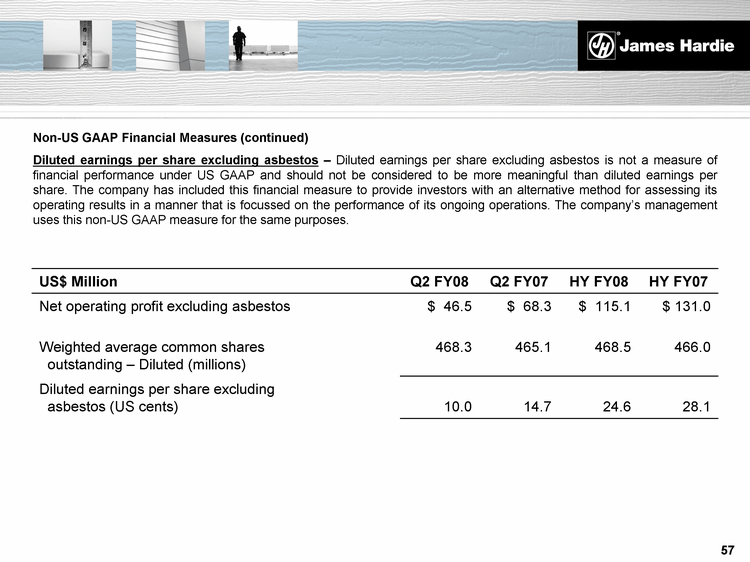
|
Non-US GAAP Financial Measures (continued)
Diluted earnings per share excluding asbestos - Diluted earnings per share excluding asbestos is not a measure of
financial performance under US GAAP and should not be considered to be more meaningful than diluted earnings per
share. The company has included this financial measure to provide investors with an alternative method for assessing its
operating results in a manner that is focussed on the performance of its ongoing operations. The company's management
uses this non-US GAAP measure for the same purposes.
US$ Million Q2 FY08 Q2 FY07 HY FY08 HY FY07
Net operating profit excluding asbestos $ 46.5 $ 68.3 $ 115.1 $ 131.0
Weighted average common shares
outstanding - Diluted (millions) 468.3 465.1 468.5 466.0
Diluted earnings per share excluding
asbestos (US cents)
10.0
14.7
24.6
28.1
|
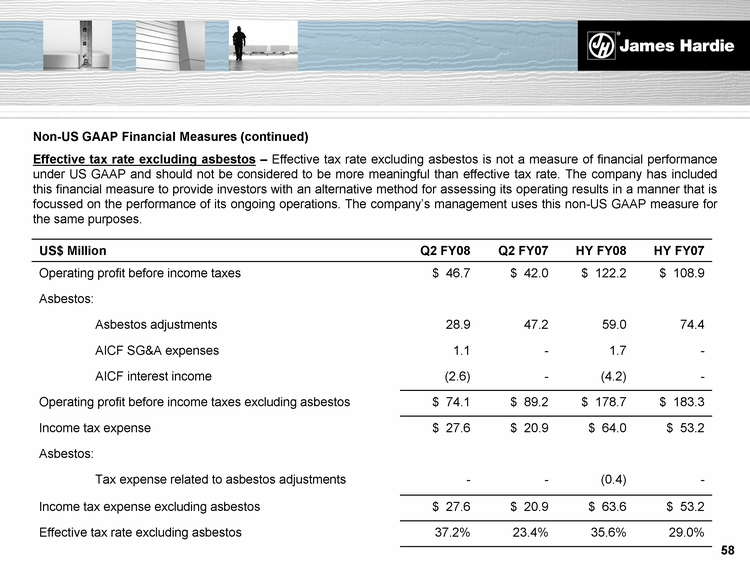
|
Non-US GAAP Financial Measures (continued)
Effective tax rate excluding asbestos - Effective tax rate excluding asbestos is not a measure of financial performance
under US GAAP and should not be considered to be more meaningful than effective tax rate. The company has included
this financial measure to provide investors with an alternative method for assessing its operating results in a manner that is
focussed on the performance of its ongoing operations. The company's management uses this non-US GAAP measure for
the same purposes.
US$ Million Q2 FY08 Q2 FY07 HY FY08 HY FY07
Operating profit before income taxes $ 46.7 $ 42.0 $ 122.2 $ 108.9
Asbestos:
Asbestos adjustments 28.9 47.2 59.0 74.4
AICF SG&A expenses 1.1 - 1.7 -
AICF interest income (2.6) - (4.2) -
Operating profit before income taxes excluding asbestos $ 74.1 $ 89.2 $ 178.7 $ 183.3
Income tax expense $ 27.6 $ 20.9 $ 64.0 $ 53.2
Asbestos:
Tax expense related to asbestos adjustments - - (0.4) -
Income tax expense excluding asbestos $ 27.6 $ 20.9 $ 63.6 $ 53.2
Effective tax rate excluding asbestos 37.2% 23.4% 35.6% 29.0%
|
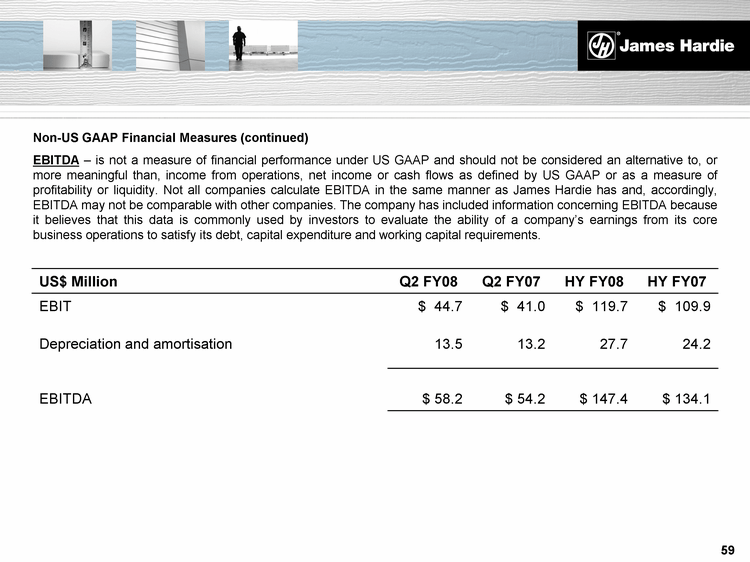
|
Non-US GAAP Financial Measures (continued)
EBITDA - is not a measure of financial performance under US GAAP and should not be considered an alternative to, or
more meaningful than, income from operations, net income or cash flows as defined by US GAAP or as a measure of
profitability or liquidity. Not all companies calculate EBITDA in the same manner as James Hardie has and, accordingly,
EBITDA may not be comparable with other companies. The company has included information concerning EBITDA because
it believes that this data is commonly used by investors to evaluate the ability of a company's earnings from its core
business operations to satisfy its debt, capital expenditure and working capital requirements.
US$ Million Q2 FY08 Q2 FY07 HY FY08 HY FY07
EBIT $ 44.7 $ 41.0 $ 119.7 $ 109.9
Depreciation and amortisation 13.5 13.2 27.7 24.2
EBITDA
$ 58.2
$ 54.2
$ 147.4
$ 134.1
|
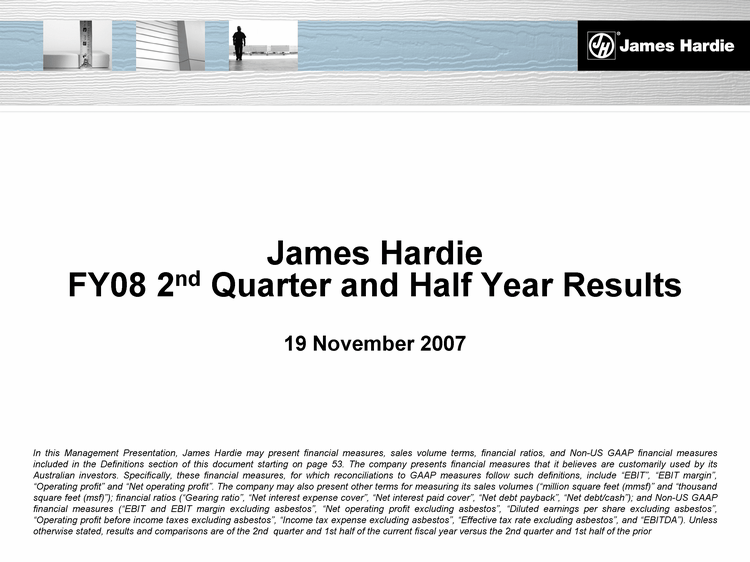
|
James Hardie
FY08 2nd Quarter and Half Year Results
19 November 2007
In this Management Presentation, James Hardie may present financial measures, sales volume terms, financial ratios, and Non-US GAAP financial measures
included in the Definitions section of this document starting on page 53. The company presents financial measures that it believes are customarily used by its
Australian investors. Specifically, these financial measures, for which reconciliations to GAAP measures follow such definitions, include "EBIT", "EBIT margin",
"Operating profit" and "Net operating profit". The company may also present other terms for measuring its sales volumes ("million square feet (mmsf)" and "thousand
square feet (msf)"); financial ratios ("Gearing ratio", "Net interest expense cover", "Net interest paid cover", "Net debt payback", "Net debt/cash"); and Non-US GAAP
financial measures ("EBIT and EBIT margin excluding asbestos", "Net operating profit excluding asbestos", "Diluted earnings per share excluding asbestos",
"Operating profit before income taxes excluding asbestos", "Income tax expense excluding asbestos", "Effective tax rate excluding asbestos", and "EBITDA"). Unless
otherwise stated, results and comparisons are of the 2nd quarter and 1st half of the current fiscal year versus the 2nd quarter and 1st half of the prior
|
James Hardie Industries N.V.
and Subsidiaries
Condensed Consolidated Financial Statements
For the Period Ended 30 September 2007
James Hardie Industries N.V. and Subsidiaries
Index
| |
|
|
|
|
| |
|
Page |
|
Item 1. Condensed Consolidated Financial Statements (Unaudited) |
|
|
|
|
Report of Independent Registered Public Accounting Firm |
|
|
F-3 |
|
Condensed Consolidated Balance Sheets as of 30 September 2007
and 31 March 2007 |
|
|
F-4 |
|
Condensed Consolidated Statements of Operations for the Three and Six Months
Ended 30 September 2007 and 2006 |
|
|
F-5 |
|
Condensed Consolidated Statements of Cash Flows for the Six Months
Ended 30 September 2007 and 2006 |
|
|
F-7 |
|
Condensed Consolidated Statements of Changes in Shareholders’ Equity for the
Six Months Ended 30 September 2007 |
|
|
F-9 |
|
Notes to Condensed Consolidated Financial Statements |
|
|
F-10 |
|
|
|
|
|
|
Item 2. Quantitative and Qualitative Disclosures About Market Risk |
|
|
F-29 |
|
F-2
Report of Independent Registered Public Accounting Firm
To the Board of Directors and Shareholders of
James Hardie Industries N.V.:
We have reviewed the accompanying condensed consolidated balance sheet of James Hardie Industries
N.V. and its subsidiaries as of 30 September 2007, and the related condensed consolidated
statements of operations for each of the three-month and six-month periods ended 30 September 2007
and 2006 and the condensed consolidated statement of cash flows for the six-month periods ended 30
September 2007 and 2006 and the condensed consolidated statement of changes in shareholders’ equity
for the six-month period ended 30 September 2007, as stated in US dollars. We have not reviewed any
amounts stated in Australian dollars included in the accompanying condensed consolidated financial
statements. These interim financial statements are the responsibility of the Company’s management.
We conducted our review in accordance with the standards of the Public Company Accounting Oversight
Board (United States). A review of interim financial information consists principally of applying
analytical procedures and making inquiries of persons responsible for financial and accounting
matters. It is substantially less in scope than an audit conducted in accordance with the standards
of the Public Company Accounting Oversight Board (United States), the objective of which is the
expression of an opinion
regarding the financial statements taken as a whole. Accordingly, we do not express such an
opinion.
Based on our review, we are not aware of any material modifications that should be made to the
accompanying condensed consolidated interim financial statements for them to be in conformity with
accounting principles generally accepted in the United States of America.
We previously audited in accordance with the standards of the Public Company Accounting Oversight
Board (United States), the Company’s consolidated balance sheet as of 31 March 2007, and the
related consolidated statements of operations, cash flows and changes in shareholders’ equity for
the year then ended (not presented herein), and in our report dated 28 June 2007, we expressed an
unqualified opinion on those consolidated financial statements. In our opinion, the information set
forth as stated in US dollars in the accompanying condensed consolidated balance sheet information
as of 31 March 2007, is fairly stated in all material respects in relation to the consolidated
balance sheet from which it has been derived.
PricewaterhouseCoopers LLP
Los Angeles, California
12 November 2007
F-3
Item 1. Financial Statements
James Hardie Industries N.V. and Subsidiaries
Condensed Consolidated Balance Sheets
(Unaudited)
| |
|
|
|
|
|
|
|
|
|
|
|
|
|
|
|
|
| |
|
(Millions of |
|
|
(Millions of |
|
| |
|
US dollars) |
|
|
Australian dollars) |
|
| |
|
30 September |
|
|
31 March |
|
|
30 September |
|
|
31 March |
|
| |
|
2007 |
|
|
2007 |
|
|
2007 |
|
|
2007 |
|
| |
|
|
|
|
|
|
|
|
|
|
|
|
|
|
|
|
|
Assets |
|
|
|
|
|
|
|
|
|
|
|
|
|
|
|
|
Current assets: |
|
|
|
|
|
|
|
|
|
|
|
|
|
|
|
|
Cash and cash equivalents |
|
$ |
33.1 |
|
|
$ |
34.1 |
|
|
A$ |
37.5 |
|
|
A$ |
42.3 |
|
Restricted cash and cash equivalents |
|
|
5.0 |
|
|
|
5.0 |
|
|
|
5.7 |
|
|
|
6.2 |
|
Restricted cash and cash equivalents — Asbestos |
|
|
61.6 |
|
|
|
146.9 |
|
|
|
69.7 |
|
|
|
182.1 |
|
Restricted short-term investments — Asbestos |
|
|
78.5 |
|
|
|
— |
|
|
|
88.9 |
|
|
|
— |
|
Accounts and notes receivable, net of allowance for
doubtful accounts of $1.8 million (A$2.0 million) and
$1.5 million (A$1.9 million) as of 30 September 2007
and 31 March 2007, respectively |
|
|
171.1 |
|
|
|
163.4 |
|
|
|
193.7 |
|
|
|
202.5 |
|
Inventories |
|
|
136.2 |
|
|
|
147.6 |
|
|
|
154.2 |
|
|
|
183.0 |
|
Prepaid expenses and other current assets |
|
|
37.2 |
|
|
|
32.4 |
|
|
|
42.1 |
|
|
|
40.2 |
|
Insurance receivable — Asbestos |
|
|
10.3 |
|
|
|
9.4 |
|
|
|
11.7 |
|
|
|
11.7 |
|
Workers’ compensation — Asbestos |
|
|
3.0 |
|
|
|
2.7 |
|
|
|
3.4 |
|
|
|
3.3 |
|
Deferred income taxes |
|
|
25.8 |
|
|
|
27.3 |
|
|
|
29.2 |
|
|
|
33.8 |
|
Deferred income taxes — Asbestos |
|
|
9.1 |
|
|
|
7.8 |
|
|
|
10.3 |
|
|
|
9.7 |
|
|
|
|
|
|
|
|
|
|
|
|
|
|
Total current assets |
|
|
570.9 |
|
|
|
576.6 |
|
|
|
646.4 |
|
|
|
714.8 |
|
Property, plant and equipment, net |
|
|
839.0 |
|
|
|
827.7 |
|
|
|
950.0 |
|
|
|
1,025.9 |
|
Insurance receivable — Asbestos |
|
|
171.0 |
|
|
|
165.1 |
|
|
|
193.6 |
|
|
|
204.6 |
|
Workers’ compensation — Asbestos |
|
|
83.7 |
|
|
|
76.5 |
|
|
|
94.8 |
|
|
|
94.8 |
|
Deferred income taxes |
|
|
3.1 |
|
|
|
6.9 |
|
|
|
3.5 |
|
|
|
8.6 |
|
Deferred income taxes — Asbestos |
|
|
342.5 |
|
|
|
318.2 |
|
|
|
387.8 |
|
|
|
394.4 |
|
Deposit with Australian Taxation Office |
|
|
186.3 |
|
|
|
154.8 |
|
|
|
210.9 |
|
|
|
191.9 |
|
Other assets |
|
|
1.4 |
|
|
|
2.3 |
|
|
|
1.6 |
|
|
|
2.9 |
|
|
|
|
|
|
|
|
|
|
|
|
|
|
Total assets |
|
$ |
2,197.9 |
|
|
$ |
2,128.1 |
|
|
A$ |
2,488.6 |
|
|
A$ |
2,637.9 |
|
|
|
|
|
|
|
|
|
|
|
|
|
|
Liabilities and Shareholders’ Equity |
|
|
|
|
|
|
|
|
|
|
|
|
|
|
|
|
Current liabilities: |
|
|
|
|
|
|
|
|
|
|
|
|
|
|
|
|
Accounts payable and accrued liabilities |
|
$ |
150.9 |
|
|
$ |
100.8 |
|
|
A$ |
170.9 |
|
|
A$ |
124.9 |
|
Short-term debt |
|
|
93.0 |
|
|
|
83.0 |
|
|
|
105.3 |
|
|
|
102.9 |
|
Accrued payroll and employee benefits |
|
|
38.1 |
|
|
|
42.0 |
|
|
|
43.1 |
|
|
|
52.1 |
|
Accrued product warranties |
|
|
7.3 |
|
|
|
5.7 |
|
|
|
8.3 |
|
|
|
7.1 |
|
Income taxes payable |
|
|
11.8 |
|
|
|
10.6 |
|
|
|
13.4 |
|
|
|
13.1 |
|
Asbestos liability |
|
|
69.5 |
|
|
|
63.5 |
|
|
|
78.7 |
|
|
|
78.7 |
|
Workers’ compensation — Asbestos |
|
|
3.0 |
|
|
|
2.7 |
|
|
|
3.4 |
|
|
|
3.3 |
|
Other liabilities |
|
|
14.8 |
|
|
|
9.3 |
|
|
|
16.8 |
|
|
|
11.5 |
|
|
|
|
|
|
|
|
|
|
|
|
|
|
Total current liabilities |
|
|
388.4 |
|
|
|
317.6 |
|
|
|
439.9 |
|
|
|
393.6 |
|
Long-term debt |
|
|
30.0 |
|
|
|
105.0 |
|
|
|
34.0 |
|
|
|
130.1 |
|
Deferred income taxes |
|
|
123.9 |
|
|
|
93.8 |
|
|
|
140.3 |
|
|
|
116.3 |
|
Accrued product warranties |
|
|
10.0 |
|
|
|
9.5 |
|
|
|
11.3 |
|
|
|
11.8 |
|
Asbestos liability |
|
|
1,309.1 |
|
|
|
1,225.8 |
|
|
|
1,482.3 |
|
|
|
1,519.4 |
|
Workers’ compensation — Asbestos |
|
|
83.7 |
|
|
|
76.5 |
|
|
|
94.8 |
|
|
|
94.8 |
|
Other liabilities |
|
|
140.4 |
|
|
|
41.2 |
|
|
|
159.0 |
|
|
|
51.1 |
|
|
|
|
|
|
|
|
|
|
|
|
|
|
Total liabilities |
|
|
2,085.5 |
|
|
|
1,869.4 |
|
|
A$ |
2,361.6 |
|
|
A$ |
2,317.1 |
|
|
|
|
|
|
|
|
|
|
|
|
|
|
Commitments and contingencies (Note 7) |
|
|
|
|
|
|
|
|
|
|
|
|
|
|
|
|
Shareholders’ equity: |
|
|
|
|
|
|
|
|
|
|
|
|
|
|
|
|
Common stock, Euro 0.59 par value, 2.0 billion
shares authorised; 467,701,751 shares issued
at 30 September 2007 and 467,295,391 shares
issued at 31 March 2007 |
|
|
252.1 |
|
|
|
251.8 |
|
|
|
|
|
|
|
|
|
Additional paid-in capital |
|
|
185.4 |
|
|
|
180.2 |
|
|
|
|
|
|
|
|
|
Accumulated deficit |
|
|
(281.6 |
) |
|
|
(178.7 |
) |
|
|
|
|
|
|
|
|
Common stock in treasury, at cost, 7,516,387
shares and nil shares at 30 September 2007
and 31 March 2007, respectively |
|
|
(47.1 |
) |
|
|
— |
|
|
|
|
|
|
|
|
|
Accumulated other comprehensive income |
|
|
3.6 |
|
|
|
5.4 |
|
|
|
|
|
|
|
|
|
|
|
|
|
|
|
|
|
|
|
|
|
|
|
|
Total shareholders’ equity |
|
|
112.4 |
|
|
|
258.7 |
|
|
|
|
|
|
|
|
|
|
|
|
|
|
|
|
|
|
|
|
|
|
|
|
Total liabilities and shareholders’ equity |
|
$ |
2,197.9 |
|
|
$ |
2,128.1 |
|
|
|
|
|
|
|
|
|
|
|
|
|
|
|
|
|
|
|
|
|
|
|
|
The accompanying notes are an integral part of these interim condensed consolidated financial statements.
F-4
James Hardie Industries N.V. and Subsidiaries
Condensed Consolidated Statements of Operations
(Unaudited)
| |
|
|
|
|
|
|
|
|
|
|
|
|
|
|
|
|
| |
|
Three Months |
|
|
Six Months |
|
| |
|
Ended 30 September |
|
|
Ended 30 September |
|
| (Millions of US dollars, except per share data) |
|
2007 |
|
|
2006 |
|
|
2007 |
|
|
2006 |
|
| |
|
|
|
|
|
|
|
|
|
|
|
|
|
|
|
|
|
Net sales |
|
$ |
390.1 |
|
|
$ |
411.4 |
|
|
$ |
814.5 |
|
|
$ |
826.9 |
|
Cost of goods sold |
|
|
(251.3 |
) |
|
|
(256.2 |
) |
|
|
(508.8 |
) |
|
|
(514.0 |
) |
|
|
|
|
|
|
|
|
|
|
|
|
|
Gross profit |
|
|
138.8 |
|
|
|
155.2 |
|
|
|
305.7 |
|
|
|
312.9 |
|
|
|
|
|
|
|
|
|
|
|
|
|
|
|
|
|
|
Selling, general and administrative expenses |
|
|
(58.1 |
) |
|
|
(57.2 |
) |
|
|
(113.6 |
) |
|
|
(108.9 |
) |
Research and development expenses |
|
|
(7.1 |
) |
|
|
(6.6 |
) |
|
|
(13.4 |
) |
|
|
(14.1 |
) |
SCI and other related expenses |
|
|
— |
|
|
|
(3.2 |
) |
|
|
— |
|
|
|
(5.6 |
) |
Asbestos adjustments |
|
|
(28.9 |
) |
|
|
(47.2 |
) |
|
|
(59.0 |
) |
|
|
(74.4 |
) |
|
|
|
|
|
|
|
|
|
|
|
|
|
Operating income |
|
|
44.7 |
|
|
|
41.0 |
|
|
|
119.7 |
|
|
|
109.9 |
|
Interest expense |
|
|
(2.5 |
) |
|
|
(0.2 |
) |
|
|
(3.8 |
) |
|
|
(5.8 |
) |
Interest income |
|
|
4.5 |
|
|
|
1.2 |
|
|
|
6.3 |
|
|
|
4.8 |
|
|
|
|
|
|
|
|
|
|
|
|
|
|
Income before income taxes |
|
|
46.7 |
|
|
|
42.0 |
|
|
|
122.2 |
|
|
|
108.9 |
|
|
|
|
|
|
|
|
|
|
|
|
|
|
|
|
|
|
Income tax expense |
|
|
(27.6 |
) |
|
|
(20.9 |
) |
|
|
(64.0 |
) |
|
|
(53.2 |
) |
|
|
|
|
|
|
|
|
|
|
|
|
|
Income before cumulative effect of change
in accounting principle |
|
|
19.1 |
|
|
|
21.1 |
|
|
|
58.2 |
|
|
|
55.7 |
|
Cumulative effect of change in accounting principle
for stock-based compensation, net of income tax
expense of nil and $0.4 million, respectively |
|
|
— |
|
|
|
— |
|
|
|
— |
|
|
|
0.9 |
|
|
|
|
|
|
|
|
|
|
|
|
|
|
Net income |
|
$ |
19.1 |
|
|
$ |
21.1 |
|
|
$ |
58.2 |
|
|
$ |
56.6 |
|
|
|
|
|
|
|
|
|
|
|
|
|
|
|
|
|
|
|
|
|
|
|
|
|
|
|
|
|
|
|
Net income per share — basic |
|
$ |
0.04 |
|
|
$ |
0.04 |
|
|
$ |
0.12 |
|
|
$ |
0.12 |
|
|
|
|
|
|
|
|
|
|
|
|
|
|
|
|
|
|
Net income per share — diluted |
|
$ |
0.04 |
|
|
$ |
0.04 |
|
|
$ |
0.12 |
|
|
$ |
0.12 |
|
|
|
|
|
|
|
|
|
|
|
|
|
|
|
|
|
|
Weighted average common shares outstanding
(Millions): |
|
|
|
|
|
|
|
|
|
|
|
|
|
|
|
|
Basic |
|
|
467.2 |
|
|
|
463.4 |
|
|
|
467.3 |
|
|
|
463.4 |
|
Diluted |
|
|
468.3 |
|
|
|
465.1 |
|
|
|
468.5 |
|
|
|
466.0 |
|
The accompanying notes are an integral part of these interim condensed consolidated financial statements.
F-5
James Hardie Industries N.V. and Subsidiaries
Condensed Consolidated Statements of Operations
(Unaudited)
| |
|
|
|
|
|
|
|
|
|
|
|
|
|
|
|
|
| |
|
Three Months |
|
|
Six Months |
|
| |
|
Ended 30 September |
|
|
Ended 30 September |
|
| (Millions of Australian dollars, except per share data) |
|
2007 |
|
|
2006 |
|
|
2007 |
|
|
2006 |
|
| |
|
|
|
|
|
|
|
|
|
|
|
|
|
|
|
|
|
Net sales |
|
A$ |
459.7 |
|
|
A$ |
546.8 |
|
|
A$ |
970.0 |
|
|
A$ |
1,099.1 |
|
Cost of goods sold |
|
|
(296.3 |
) |
|
|
(340.5 |
) |
|
|
(605.9 |
) |
|
|
(683.2 |
) |
|
|
|
|
|
|
|
|
|
|
|
|
|
Gross profit |
|
|
163.4 |
|
|
|
206.3 |
|
|
|
364.1 |
|
|
|
415.9 |
|
|
|
|
|
|
|
|
|
|
|
|
|
|
|
|
|
|
Selling, general and administrative expenses |
|
|
(68.6 |
) |
|
|
(76.0 |
) |
|
|
(135.3 |
) |
|
|
(144.7 |
) |
Research and development expenses |
|
|
(8.4 |
) |
|
|
(8.8 |
) |
|
|
(16.0 |
) |
|
|
(18.7 |
) |
SCI and other related expenses |
|
|
— |
|
|
|
(4.3 |
) |
|
|
— |
|
|
|
(7.4 |
) |
Asbestos adjustments |
|
|
(34.1 |
) |
|
|
(62.8 |
) |
|
|
(70.3 |
) |
|
|
(98.9 |
) |
|
|
|
|
|
|
|
|
|
|
|
|
|
Operating income |
|
|
52.3 |
|
|
|
54.4 |
|
|
|
142.5 |
|
|
|
146.2 |
|
|
|
|
|
|
|
|
|
|
|
|
|
|
|
|
|
|
Interest expense |
|
|
(2.9 |
) |
|
|
(0.3 |
) |
|
|
(4.5 |
) |
|
|
(7.7 |
) |
Interest income |
|
|
5.3 |
|
|
|
1.6 |
|
|
|
7.5 |
|
|
|
6.4 |
|
|
|
|
|
|
|
|
|
|
|
|
|
|
Income before income taxes |
|
|
54.7 |
|
|
|
55.7 |
|
|
|
145.5 |
|
|
|
144.9 |
|
|
|
|
|
|
|
|
|
|
|
|
|
|
|
|
|
|
Income tax expense |
|
|
(32.4 |
) |
|
|
(27.7 |
) |
|
|
(76.2 |
) |
|
|
(70.9 |
) |
|
|
|
|
|
|
|
|
|
|
|
|
|
Income before cumulative effect of change
in accounting principle |
|
|
22.3 |
|
|
|
28.0 |
|
|
|
69.3 |
|
|
|
74.0 |
|
Cumulative effect of change in accounting principle
for stock-based compensation, net of income tax
expense of nil and A$0.5 million, respectively |
|
|
— |
|
|
|
— |
|
|
|
— |
|
|
|
1.2 |
|
|
|
|
|
|
|
|
|
|
|
|
|
|
Net income |
|
A$ |
22.3 |
|
|
A$ |
28.0 |
|
|
A$ |
69.3 |
|
|
A$ |
75.2 |
|
|
|
|
|
|
|
|
|
|
|
|
|
|
|
|
|
|
|
|
|
|
|
|
|
|
|
|
|
|
|
Net income per share — basic |
|
A$ |
0.05 |
|
|
A$ |
0.06 |
|
|
A$ |
0.15 |
|
|
A$ |
0.16 |
|
|
|
|
|
|
|
|
|
|
|
|
|
|
|
|
|
|
Net income per share — diluted |
|
A$ |
0.05 |
|
|
A$ |
0.06 |
|
|
A$ |
0.15 |
|
|
A$ |
0.16 |
|
Weighted average common shares outstanding
(Millions): |
|
|
|
|
|
|
|
|
|
|
|
|
|
|
|
|
Basic |
|
|
467.2 |
|
|
|
463.4 |
|
|
|
467.3 |
|
|
|
463.4 |
|
Diluted |
|
|
468.3 |
|
|
|
465.1 |
|
|
|
468.5 |
|
|
|
466.0 |
|
The accompanying notes are an integral part of these interim condensed consolidated financial statements.
F-6
James Hardie Industries N.V. and Subsidiaries
Condensed Consolidated Statements of Cash Flows
(Unaudited)
| |
|
|
|
|
|
|
|
|
| |
|
Six Months |
|
| |
|
Ended 30 September |
|
| (Millions of US dollars) |
|
2007 |
|
|
2006 |
|
| |
|
|
|
|
|
|
|
|
|
Cash Flows From Operating Activities |
|
|
|
|
|
|
|
|
Net income |
|
$ |
58.2 |
|
|
$ |
56.6 |
|
Adjustments to reconcile net income to net cash
provided by operating activities: |
|
|
|
|
|
|
|
|
Depreciation and amortisation |
|
|
27.7 |
|
|
|
24.2 |
|
Deferred income taxes |
|
|
30.7 |
|
|
|
17.4 |
|
Prepaid pension cost |
|
|
0.9 |
|
|
|
1.5 |
|
Stock-based compensation |
|
|
3.1 |
|
|
|
1.4 |
|
Asbestos adjustments |
|
|
59.0 |
|
|
|
74.4 |
|
Cumulative effect of change in accounting principle |
|
|
— |
|
|
|
(0.9 |
) |
Other |
|
|
(2.3 |
) |
|
|
— |
|
Changes in operating assets and liabilities: |
|
|
|
|
|
|
|
|
Restricted cash and cash equivalents |
|
|
21.5 |
|
|
|
(5.0 |
) |
Accounts and notes receivable |
|
|
(3.6 |
) |
|
|
(1.9 |
) |
Inventories |
|
|
14.6 |
|
|
|
(16.8 |
) |
Prepaid expenses and other current assets |
|
|
(4.1 |
) |
|
|
(16.6 |
) |
Insurance receivable |
|
|
9.4 |
|
|
|
— |
|
Accounts payable and accrued liabilities |
|
|
41.5 |
|
|
|
(1.9 |
) |
Asbestos liability |
|
|
(31.2 |
) |
|
|
— |
|
Deposit with Australian Taxation Office |
|
|
(3.7 |
) |
|
|
(141.4 |
) |
Other accrued liabilities and other liabilities |
|
|
9.3 |
|
|
|
(13.3 |
) |
|
|
|
|
|
|
|
Net cash provided by (used in) operating activities |
|
|
231.0 |
|
|
|
(22.3 |
) |
|
|
|
|
|
|
|
Cash Flows From Investing Activities |
|
|
|
|
|
|
|
|
Purchases of property, plant and equipment |
|
|
(24.2 |
) |
|
|
(61.4 |
) |
|
|
|
|
|
|
|
Net cash used in investing activities |
|
|
(24.2 |
) |
|
|
(61.4 |
) |
|
|
|
|
|
|
|
Cash Flows From Financing Activities |
|
|
|
|
|
|
|
|
Proceeds from short-term borrowings |
|
|
10.0 |
|
|
|
— |
|
Repayments of short-term borrowings |
|
|
— |
|
|
|
(46.0 |
) |
Repayments of long-term borrowings |
|
|
(75.0 |
) |
|
|
(121.7 |
) |
Proceeds from issuance of shares |
|
|
2.2 |
|
|
|
1.5 |
|
Tax benefit from stock options exercised |
|
|
0.2 |
|
|
|
0.1 |
|
Treasury stock purchased |
|
|
(47.1 |
) |
|
|
— |
|
Dividends paid |
|
|
(70.7 |
) |
|
|
(18.7 |
) |
Collections on loans receivable |
|
|
— |
|
|
|
0.1 |
|
|
|
|
|
|
|
|
Net cash used in financing activities |
|
|
(180.4 |
) |
|
|
(184.7 |
) |
|
|
|
|
|
|
|
Effects of exchange rate changes on cash |
|
|
(27.4 |
) |
|
|
0.6 |
|
|
|
|
|
|
|
|
Net decrease in cash and cash equivalents |
|
|
(1.0 |
) |
|
|
(267.8 |
) |
Cash and cash equivalents at beginning of period |
|
|
34.1 |
|
|
|
315.1 |
|
|
|
|
|
|
|
|
Cash and cash equivalents at end of period |
|
$ |
33.1 |
|
|
$ |
47.3 |
|
|
|
|
|
|
|
|
|
|
|
|
|
|
|
|
|
Components of Cash and Cash Equivalents |
|
|
|
|
|
|
|
|
Cash at bank and on hand |
|
$ |
29.5 |
|
|
$ |
27.0 |
|
Short-term deposits |
|
|
3.6 |
|
|
|
20.3 |
|
|
|
|
|
|
|
|
Cash and cash equivalents at end of period |
|
$ |
33.1 |
|
|
$ |
47.3 |
|
|
|
|
|
|
|
|
The accompanying notes are an integral part of these interim condensed consolidated financial statements.
F-7
James Hardie Industries N.V. and Subsidiaries
Condensed Consolidated Statements of Cash Flows
(Unaudited)
| |
|
|
|
|
|
|
|
|
| |
|
Six Months |
|
| |
|
Ended 30 September |
|
| (Millions of Australian dollars) |
|
2007 |
|
|
2006 |
|
| |
|
|
|
|
|
|
|
|
|
Cash Flows From Operating Activities |
|
|
|
|
|
|
|
|
Net income |
|
A$ |
69.3 |
|
|
A$ |
75.2 |
|
Adjustments to reconcile net income to net cash
provided by operating activities: |
|
|
|
|
|
|
|
|
Depreciation and amortisation |
|
|
33.0 |
|
|
|
32.2 |
|
Deferred income taxes |
|
|
36.6 |
|
|
|
23.1 |
|
Prepaid pension cost |
|
|
1.1 |
|
|
|
2.0 |
|
Stock-based compensation |
|
|
3.7 |
|
|
|
1.9 |
|
Asbestos adjustments |
|
|
70.3 |
|
|
|
98.9 |
|
Cumulative effect of change in accounting principle |
|
|
— |
|
|
|
(1.2 |
) |
Other |
|
|
(2.7 |
) |
|
|
— |
|
Changes in operating assets and liabilities: |
|
|
— |
|
|
|
|
|
Restricted cash and cash equivalents |
|
|
25.6 |
|
|
|
(6.6 |
) |
Accounts and notes receivable |
|
|
(4.3 |
) |
|
|
(2.5 |
) |
Inventories |
|
|
17.4 |
|
|
|
(22.3 |
) |
Prepaid expenses and other current assets |
|
|
(4.9 |
) |
|
|
(22.1 |
) |
Insurance receivable |
|
|
11.2 |
|
|
|
— |
|
Accounts payable and accrued liabilities |
|
|
49.4 |
|
|
|
(2.5 |
) |
Asbestos liability |
|
|
(37.2 |
) |
|
|
— |
|
Deposit with Australian Taxation Office |
|
|
(4.4 |
) |
|
|
(189.0 |
) |
Other accrued liabilities and other liabilities |
|
|
11.1 |
|
|
|
(17.7 |
) |
|
|
|
|
|
|
|
Net cash provided by (used in) operating activities |
|
|
275.2 |
|
|
|
(30.6 |
) |
|
|
|
|
|
|
|
Cash Flows From Investing Activities |
|
|
|
|
|
|
|
|
Purchases of property, plant and equipment |
|
|
(28.8 |
) |
|
|
(81.6 |
) |
|
|
|
|
|
|
|
Net cash used in investing activities |
|
|
(28.8 |
) |
|
|
(81.6 |
) |
|
|
|
|
|
|
|
Cash Flows From Financing Activities |
|
|
|
|
|
|
|
|
Proceeds from short-term borrowings |
|
|
11.9 |
|
|
|
— |
|
Repayments of short-term borrowings |
|
|
— |
|
|
|
(61.1 |
) |
Repayments of long-term borrowings |
|
|
(89.3 |
) |
|
|
(161.8 |
) |
Proceeds from issuance of shares |
|
|
2.6 |
|
|
|
2.0 |
|
Tax benefit from stock options exercised |
|
|
0.2 |
|
|
|
0.1 |
|
Treasury stock purchased |
|
|
(56.1 |
) |
|
|
— |
|
Dividends paid |
|
|
(84.2 |
) |
|
|
(24.9 |
) |
Collections on loans receivable |
|
|
— |
|
|
|
0.1 |
|
|
|
|
|
|
|
|
Net cash used in financing activities |
|
|
(214.9 |
) |
|
|
(245.6 |
) |
|
|
|
|
|
|
|
Effects of exchange rate changes on cash |
|
|
(36.3 |
) |
|
|
(19.4 |
) |
|
|
|
|
|
|
|
Net decrease in cash and cash equivalents |
|
|
(4.8 |
) |
|
|
(377.2 |
) |
Cash and cash equivalents at beginning of period |
|
|
42.3 |
|
|
|
440.4 |
|
|
|
|
|
|
|
|
Cash and cash equivalents at end of period |
|
A$ |
37.5 |
|
|
A$ |
63.2 |
|
|
|
|
|
|
|
|
|
|
|
|
|
|
|
|
|
Components of Cash and Cash Equivalents |
|
|
|
|
|
|
|
|
Cash at bank and on hand |
|
A$ |
33.4 |
|
|
A$ |
36.1 |
|
Short-term deposits |
|
|
4.1 |
|
|
|
27.1 |
|
|
|
|
|
|
|
|
Cash and cash equivalents at end of period |
|
A$ |
37.5 |
|
|
A$ |
63.2 |
|
|
|
|
|
|
|
|
The accompanying notes are an integral part of these interim condensed consolidated financial statements.
F-8
James Hardie Industries N.V. and Subsidiaries
Condensed Consolidated Statements of Changes in Shareholders’ Equity
(Unaudited)
| |
|
|
|
|
|
|
|
|
|
|
|
|
|
|
|
|
|
|
|
|
|
|
|
|
| |
|
|
|
|
|
|
|
|
|
|
|
|
|
Accumulated |
|
|
|
|
|
|
|
| |
|
|
|
|
|
Additional |
|
|
|
|
|
|
Other |
|
|
|
|
|
|
|
| |
|
Common |
|
|
Paid-in |
|
|
Accumulated |
|
|
Comprehensive |
|
|
Treasury |
|
|
|
|
| (Millions of US dollars) |
|
Stock |
|
|
Capital |
|
|
Deficit |
|
|
Income (Loss) |
|
|
Stock |
|
|
Total |
|
|
|
|
|
|
|
|
|
|
|
|
|
|
|
|
|
|
|
|
|
|
|
|
|
|
Balances as of 31 March 2007 |
|
$ |
251.8 |
|
|
$ |
180.2 |
|
|
$ |
(178.7 |
) |
|
$ |
5.4 |
|
|
$ |
— |
|
|
$ |
258.7 |
|
|
|
|
|
|
|
|
|
|
|
|
|
|
|
|
|
|
|
|
|
|
|
|
|
|
Comprehensive income (loss): |
|
|
|
|
|
|
|
|
|
|
|
|
|
|
|
|
|
|
|
|
|
|
|
|
Net income |
|
|
— |
|
|
|
— |
|
|
|
58.2 |
|
|
|
— |
|
|
|
— |
|
|
|
58.2 |
|
Pension and post-retirement benefit
adjustments |
|
|
— |
|
|
|
— |
|
|
|
— |
|
|
|
(0.2 |
) |
|
|
— |
|
|
|
(0.2 |
) |
Unrealised loss on investments |
|
|
— |
|
|
|
— |
|
|
|
— |
|
|
|
(0.8 |
) |
|
|
— |
|
|
|
(0.8 |
) |
Foreign currency translation loss |
|
|
— |
|
|
|
— |
|
|
|
— |
|
|
|
(0.8 |
) |
|
|
— |
|
|
|
(0.8 |
) |
|
|
|
|
|
|
|
|
|
|
|
|
|
|
|
|
|
|
|
Other comprehensive loss |
|
|
— |
|
|
|
— |
|
|
|
— |
|
|
|
(1.8 |
) |
|
|
— |
|
|
|
(1.8 |
) |
|
|
|
|
|
|
|
|
|
|
|
|
|
|
|
|
|
|
|
|
|
|
|
|
Total comprehensive income |
|
|
|
|
|
|
|
|
|
|
|
|
|
|
|
|
|
|
|
|
|
|
56.4 |
|
Adoption of FIN 48 |
|
|
— |
|
|
|
— |
|
|
|
(90.4 |
) |
|
|
— |
|
|
|
— |
|
|
|
(90.4 |
) |
Stock-based compensation |
|
|
— |
|
|
|
3.1 |
|
|
|
— |
|
|
|
— |
|
|
|
— |
|
|
|
3.1 |
|
Tax benefit from stock options exercised |
|
|
— |
|
|
|
0.2 |
|
|
|
— |
|
|
|
— |
|
|
|
— |
|
|
|
0.2 |
|
Stock options exercised |
|
|
0.3 |
|
|
|
1.9 |
|
|
|
— |
|
|
|
— |
|
|
|
— |
|
|
|
2.2 |
|
Dividends paid |
|
|
— |
|
|
|
— |
|
|
|
(70.7 |
) |
|
|
— |
|
|
|
— |
|
|
|
(70.7 |
) |
Treasury stock purchased |
|
|
— |
|
|
|
— |
|
|
|
— |
|
|
|
— |
|
|
|
(47.1 |
) |
|
|
(47.1 |
) |
|
|
|
|
|
|
|
|
|
|
|
|
|
|
|
|
|
|
|
Balances as of 30 September 2007 |
|
$ |
252.1 |
|
|
$ |
185.4 |
|
|
$ |
(281.6 |
) |
|
$ |
3.6 |
|
|
$ |
(47.1 |
) |
|
$ |
112.4 |
|
|
|
|
|
|
|
|
|
|
|
|
|
|
|
|
|
|
|
|
The accompanying notes are an integral part of these interim condensed consolidated financial statements.
F-9
James Hardie Industries N.V. and Subsidiaries
Notes to Condensed Consolidated Financial Statements
(Unaudited)
| 1. |
|
Basis of Presentation |
| |
| |
|
Nature of Operations |
| |
| |
|
The Company manufactures and sells fibre cement building products for interior and exterior
building construction applications primarily in the United States, Australia, New Zealand,
Philippines and Europe. |
| |
| |
|
Basis of Presentation |
| |
| |
|
The condensed consolidated financial statements represent the financial position, results of
operations and cash flows of James Hardie Industries N.V. (“JHI NV”) and its current wholly owned
subsidiaries and special interest entities, collectively referred to as either the “Company” or
“James Hardie” and JHI NV together with its subsidiaries as of the time relevant to the applicable
reference, the “James Hardie Group”, unless the context indicates otherwise. These interim
condensed consolidated financial statements should be read in conjunction with the audited
consolidated financial statements and the notes thereto, included in the Company’s Annual Report on
Form 20-F for the fiscal year ended 31 March 2007. |
| |
| |
|
The condensed consolidated financial statements included herein are unaudited; however, they
contain all normal recurring adjustments which, in the opinion of the Company’s management, are
necessary to state fairly the consolidated financial position of the Company at 30 September 2007,
the consolidated results of operations for the three and six months ended 30 September 2007 and
2006 and the consolidated cash flows for the six months ended 30 September 2007 and 2006. Income
from continuing operations for the three and six months ended 30 September 2007 includes a charge
of US$2.7 million relating to prior period lease costs. The impact of this adjustment on prior
periods’ financial statements is not material. The results of operations for the three and six
months ended 30 September 2007 are not necessarily indicative of the results to be expected for the
full year. The balance sheet at 31 March 2007 has been derived from the audited financial
statements at that date but does not include all of the information and footnotes required by
generally accepted accounting principles for complete financial statements. |
| |
| |
|
The assets, liabilities, statements of operations and statements of cash flows of the Company have
been presented with accompanying Australian dollar (A$) convenience translations as the majority of
the Company’s shareholder base is Australian. These A$ convenience translations are not prepared in
accordance with accounting principles generally accepted in the United States of America. The
exchange rates used to calculate the convenience translations are as follows: |
| |
|
|
|
|
|
|
|
|
|
|
|
|
| |
|
31 March |
|
|
30 September |
|
| (US$1 = A$) |
|
2007 |
|
|
2007 |
|
|
2006 |
|
| |
|
|
|
|
|
|
|
|
|
|
|
|
|
Assets and liabilities |
|
|
1.2395 |
|
|
|
1.1323 |
|
|
|
1.3365 |
|
Statements of operations |
|
|
n/a |
|
|
|
1.1909 |
|
|
|
1.3292 |
|
Cash flows — beginning cash |
|
|
n/a |
|
|
|
1.2395 |
|
|
|
1.3975 |
|
Cash flows — ending cash |
|
|
n/a |
|
|
|
1.1323 |
|
|
|
1.3365 |
|
Cash flows — current period movements |
|
|
n/a |
|
|
|
1.1909 |
|
|
|
1.3292 |
|
F-10
James Hardie Industries N.V. and Subsidiaries
Notes to Condensed Consolidated Financial Statements (Continued)
(Unaudited)
| 2. |
|
Summary of Significant Accounting Policies |
| |
| |
|
Earnings Per Share |
| |
| |
|
The Company is required to disclose basic and diluted earnings per share (“EPS”). Basic EPS is
calculated using income divided by the weighted average number of common shares outstanding during
the period. Diluted EPS is similar to basic EPS except that the weighted average number of common
shares outstanding is increased to include the number of additional common shares calculated using
the treasury method that would have been outstanding if dilutive potential common shares, such as
options, had been exercised. Accordingly, basic and dilutive common shares outstanding used in
determining net income per share are as follows: |
| |
|
|
|
|
|
|
|
|
|
|
|
|
|
|
|
|
| |
|
Three Months |
|
|
Six Months |
|
| |
|
Ended 30 September |
|
|
Ended 30 September |
|
| (Millions of shares) |
|
2007 |
|
|
2006 |
|
|
2007 |
|
|
2006 |
|
| |
|
|
|
|
|
|
|
|
|
|
|
|
|
|
|
|
|
|
|
Basic common shares outstanding |
|
|
467.2 |
|
|
|
463.4 |
|
|
|
467.3 |
|
|
|
463.4 |
|
Dilutive effect of stock options |
|
|
1.1 |
|
|
|
1.7 |
|
|
|
1.2 |
|
|
|
2.6 |
|
|
|
|
|
|
|
|
|
|
|
|
|
|
Diluted common shares outstanding |
|
|
468.3 |
|
|
|
465.1 |
|
|
|
468.5 |
|
|
|
466.0 |
|
|
|
|
|
|
|
|
|
|
|
|
|
|
| |
|
|
|
|
|
|
|
|
|
|
|
|
|
|
|
|
| (US dollars) |
|
2007 |
|
|
2006 |
|
|
2007 |
|
|
2006 |
|
| |
|
|
|
|
|
|
|
|
|
|
|
|
|
|
|
|
|
|
|
Net income per share — basic |
|
$ |
0.04 |
|
|
$ |
0.04 |
|
|
$ |
0.12 |
|
|
$ |
0.12 |
|
Net income per share — diluted |
|
$ |
0.04 |
|
|
$ |
0.04 |
|
|
$ |
0.12 |
|
|
$ |
0.12 |
|
| |
|
Potential common shares of 10.3 million and 10.3 million for the three months ended 30
September 2007 and 2006, respectively, and 10.0 million and 6.5 million for the six months ended 30
September 2007 and 2006, respectively, have been excluded from the calculations of diluted common
shares outstanding because the effect of their inclusion would be anti-dilutive. |
| |
| |
|
Advertising |
| |
| |
|
The Company expenses the production costs of advertising the first time the advertising takes
place. Advertising expense was US$1.9 million and US$4.6 million for the three months ended 30
September 2007 and 2006, respectively, and US$5.9 million and US$8.9 million for the six months
ended 30 September 2007 and 2006, respectively. |
| |
| |
|
Stock-Based Compensation |
| |
| |
|
The Company recognised stock-based compensation expense (included in selling, general and
administrative expenses) of US$1.6 million and US$1.2 million for the three months ended 30
September 2007 and 2006, respectively, and US$3.1 million and US$2.7 million for the six months
ended 30 September 2007 and 2006, respectively. The amount for the six months ended 30 September
2006 excludes the forfeiture adjustment of US$1.3 million (US$0.9 million net of tax) which is
separately disclosed as “Cumulative effect of change in accounting principle for stock-based
compensation”. The tax benefit related to the forfeiture adjustment was US$0.4 million for the six
months ended 30 September 2006.
|
F-11
James Hardie Industries N.V. and Subsidiaries
Notes to Condensed Consolidated Financial Statements (Continued)
(Unaudited)
| |
|
Upon adoption of Statement of Financial Accounting Standards (“SFAS”) No. 123R, “Accounting
for Stock-Based Compensation”, at the beginning of fiscal year 2007, the Company analysed
forfeiture rates on all of its 2001 Stock Option Plan grants for which vesting was complete
resulting in an estimated weighted average forfeiture rate of 30.7%. Based on this estimated rate,
a cumulative adjustment to stock-based compensation expense of US$1.3 million net of an income tax
benefit of US$0.4 million was recorded effective 1 April 2006. The adjustment is presented on the
consolidated statements of operations as a cumulative effect of change in accounting principle (net
of income tax). The portion of the cumulative adjustment that relates to USA-based employees caused
a reduction in the deferred tax asset previously recorded. For the six months ended 30 September
2006, the amount of the cumulative adjustment related to USA-based employees was US$1.0 million for
which the related USA income tax adjustment was US$0.4 million. |
| |
| |
|
Impairment of Long-Lived Assets |
| |
| |
|
In accordance with Statement of Financial Accounting Standards (“SFAS”) No. 144, “Accounting for
the Impairment or Disposal of Long-Lived Assets”, long-lived assets, such as property, plant and
equipment, and purchased intangibles subject to amortisation are reviewed for impairment whenever
events or changes in circumstances indicate that the carrying amount of an asset may not be
recoverable. Recoverability of assets to be held and used is measured by a comparison of the
carrying amount of an asset to estimated undiscounted future cash flows expected to be generated by
the asset. If the carrying amount of the asset exceeds its estimated future cash flows, an
impairment charge is recognised by the amount by which the carrying amount of the asset exceeds the
fair value of the assets. |
| |
| |
|
Asbestos |
| |
| |
|
Prior to 31 March 2007, the Company’s consolidated financial statements included an asbestos
provision relating to its anticipated future payments to a Special Purpose Fund (“SPF”) based on
the terms of the Original Final Funding Agreement (“Original FFA”) entered into on 1 December 2005. |
| |
| |
|
In February 2007, the shareholders approved the Amended Final Funding Agreement (“Amended FFA”)
entered into on 21 November 2006 to provide long-term funding to the Asbestos Injuries Compensation
Fund (“AICF”), a special purpose fund that provides compensation for Australian-related personal
injury claims against certain former subsidiary companies of James Hardie in Australia (being Amaca
Pty Ltd (“Amaca”), Amaba Pty Ltd (“Amaba”) and ABN 60 Pty Ltd (“ABN 60”) (collectively, the “Liable
Entities”)). |
| |
| |
|
Amaca and Amaba separated from the James Hardie Group in February 2001. ABN 60 separated from the
James Hardie Group in March 2003. Upon shareholder approval of the Amended FFA in February 2007,
shares in the Liable Entities were transferred to the AICF. The Company appoints three of the AICF
directors and the NSW state government appoints two of the AICF directors. The AICF manages
Australian asbestos-related personal injury claims made against the Liable Entities, and makes
compensation payments in respect of those proven claims. |
| |
| |
|
AICF |
| |
| |
|
Under the terms of the Amended FFA, James Hardie 117 Pty Ltd (the “Performing Subsidiary”) has a
contractual liability to make payments to the AICF. This funding to the AICF results in the Company
having a pecuniary interest in the AICF. The interest is considered variable because the potential
impact on the Company will vary based upon the annual actuarial assessments obtained by the Company
with respect to asbestos-related personal injury claims against the Liable Entities. Due to the
Company’s variable interest in the AICF, it consolidates the AICF in accordance with Financial
Accounting Standards Board (“FASB”) Interpretation No. 46R, “Consolidation of Variable Interest
Entities”.
|
F-12
James Hardie Industries N.V. and Subsidiaries
Notes to Condensed Consolidated Financial Statements (Continued)
(Unaudited)
| |
|
The AICF has operating costs that are claims related and non-claims related. Claims related
costs incurred by the AICF are treated as reductions to the accrued asbestos liability balances
previously reflected in the consolidated balance sheets. Non-claims related operating costs
incurred by the AICF are expensed as incurred in the line item Selling, general and administrative
expenses in the consolidated statements of operations. The AICF earns interest on its cash and cash
equivalents and on its short-term investments; these amounts are included in the line item Interest
income in the consolidated statements of operations. |
| |
| |
|
Asbestos-Related Assets and Liabilities |
| |
| |
|
The Company has recorded on its consolidated balance sheets certain assets and liabilities under
the terms of the Amended FFA. These items are Australian dollar-denominated and are subject to
translation into US dollars at each reporting date. These assets and liabilities are commonly
referred to by the Company as Asbestos-Related Assets and Liabilities and include: |
| |
| |
|
Asbestos Liability |
| |
| |
|
The amount of the asbestos liability reflects the terms of the Amended FFA and has been calculated
by reference to (but is not exclusively based upon) the most recent actuarial estimate of projected
future cash flows prepared by KPMG Actuaries Pty Ltd (“KPMG Actuaries”). The asbestos liability
includes these cash flows as undiscounted and uninflated on the basis that it is inappropriate to
discount or inflate future cash flows when the timing and amounts of such cash flows are not fixed
or readily determinable. The asbestos liability also includes an allowance for the future
claims-handling costs of the AICF. |
| |
| |
|
Adjustments in the asbestos liability due to changes in the actuarial estimate of projected future
cash flows and changes in the estimate of future operating costs of the AICF are reflected in the
consolidated statements of operations during the period in which they occur. Claims paid by the
AICF and claims-handling costs incurred by the AICF are treated as reductions in the accrued
balances previously reflected in the consolidated balance sheets. |
| |
| |
|
Insurance Receivable |
| |
| |
|
There are various insurance policies and insurance companies with exposure to the asbestos claims.
The insurance receivable determined by KPMG Actuaries reflects the recoveries expected from all
such policies based on the expected pattern of claims against such policies less an allowance for
credit risk based on credit agency ratings. The insurance receivable generally includes these cash
flows as undiscounted and uninflated on the basis that it is inappropriate to discount or inflate
future cash flows when the timing and amounts of such cash flows are not fixed or readily
determinable. The Company only records insurance
receivables that it deems to be probable. |
| |
| |
|
Included in insurance receivable is US$14.3 million recorded on a discounted basis because the
timing of the recoveries has been agreed with the insurer. |
| |
| |
|
Adjustments in insurance receivable due to changes in the actuarial estimate, or changes in the
Company’s assessment of recoverability are reflected in the consolidated statements of operations
during the period in which they occur. Insurance recoveries are treated as a reduction in the
insurance receivable balance. |
| |
| |
|
Workers’ Compensation |
| |
| |
|
Workers’ compensation claims are claims made by former employees of the Liable Entities. Such past,
current and future reported claims were insured with various insurance companies and the various
Australian State-based workers’ compensation schemes (collectively “workers’ compensation schemes
or policies”). An estimate of the liability related to workers’ compensation claims is prepared by
KPMG Actuaries as part of the annual actuarial assessment. This estimate contains two components,
amounts that will be met by a workers’ compensation scheme or policy, and amounts that will be met
by the Liable Entities.
|
F-13
James Hardie Industries N.V. and Subsidiaries
Notes to Condensed Consolidated Financial Statements (Continued)
(Unaudited)
| |
|
The portion of the KPMG Actuaries estimate that is expected to be met by the Liable Entities
is included as part of the Asbestos Liability. Adjustments to this estimate are reflected in the
consolidated statements of operations during the period in which they occur. |
| |
| |
|
The portion of the KPMG Actuaries estimate that is expected to be met by the workers’ compensation
schemes or policies of the Liable Entities is recorded by the Company as a workers’ compensation
liability. Since these amounts are expected to be met by the workers’ compensation schemes or
policies, the Company records an equivalent workers’ compensation receivable. Adjustments to the
workers’ compensation liability result in an equal adjustment in the workers’ compensation
receivable recorded by the Company and have no effect on the consolidated statements of operations. |
| |
| |
|
Asbestos-Related Research and Education Contributions |
| |
| |
|
The Company has agreed to fund asbestos-related research and education initiatives for a period of
10 years, beginning in fiscal year 2007. The liabilities related to these agreements are included
in “Other Liabilities” on the consolidated balance sheets. |
| |
| |
|
Restricted Cash Assets of the AICF |
| |
| |
|
Cash and cash equivalents of the AICF are reflected as restricted assets, as the use of these
assets is restricted to the settlement of asbestos claims and payment of the operating costs of the
AICF. |
| |
| |
|
Restricted Short-Term Investments |
| |
| |
|
Short-term investments consist of highly liquid investments held in the custody of major financial
institutions. All short-term investments are classified as available for sale and are recorded at
market value using the specific identification method. Unrealised gains and losses on these
investments are included as a separate component of accumulated other comprehensive income, net of
tax. |
| |
| |
|
AICF — Other Assets and Liabilities |
| |
| |
|
Other assets and liabilities of the AICF, including fixed assets, trade receivables and payables
are included on the consolidated balance sheets under the appropriate captions and their use is
restricted to the operations of the AICF. |
| |
| |
|
Deferred Income Taxes |
| |
| |
|
The Performing Subsidiary is able to claim a taxation deduction for its contributions to the AICF
over a five-year period from the date of contribution. Consequently, a deferred tax asset has been
recognised equivalent to the anticipated tax benefit over the life of the Amended FFA. |
| |
| |
|
Adjustments are made to the deferred income tax asset as adjustments to the asbestos-related assets
and liabilities are recorded. |
| |
| |
|
Foreign Currency Translation |
| |
| |
|
The asbestos-related assets and liabilities are denominated in Australian dollars and thus the
reported value of these asbestos-related assets and liabilities in the Company’s consolidated
balance sheets in US dollars are subject to adjustment depending on the closing exchange rate
between the two currencies at the balance sheet date. The effect of foreign exchange rate
movements between these currencies is included in Asbestos Adjustments in the consolidated
statements of operations.
|
F-14
James Hardie Industries N.V. and Subsidiaries
Notes to Condensed Consolidated Financial Statements (Continued)
(Unaudited)
| |
|
Recent Accounting Pronouncements |
| |
| |
|
Fair Value Measurements |
| |
| |
|
In September 2006, the FASB issued Statement No. 157, “Fair Value Measurements,” (“SFAS No.
157”), which defines fair value, establishes a framework for measuring fair value in generally
accepted accounting principles (“GAAP”) and expands disclosures about fair value measurements.
The expanded disclosures in this statement about the use of fair value to measure assets and
liabilities should provide users of financial statements with better information about the
extent to which fair value is used to measure recognised assets and liabilities, the inputs
used to develop the measurements, and the effect of certain measurements on earnings (or
changes in net assets) for the period. The provisions of SFAS No. 157 are effective for the
Company on 1 April 2008, and it is currently evaluating the impact on its financial statements
of adopting SFAS No. 157. |
| |
| |
|
Fair Value Option for Financial Assets and Financial Liabilities |
| |
| |
|
In February 2007, the FASB issued Statement No. 159, “The Fair Value Option for Financial
Assets and Financial Liabilities” (“SFAS No. 159”), which allows for voluntary measurement of
financial assets and liabilities as well as certain other items at fair value. Unrealised
gains and losses on financial instruments for which the fair value option has been elected are
reported in earnings. The provisions of SFAS No. 159 are effective for the Company on 1 April
2008, and it is currently evaluating the impact on its financial statements of adopting SFAS
No. 159. |
| |
| 3. |
|
Inventories |
| |
| |
|
Inventories consist of the following components: |
| |
|
|
|
|
|
|
|
|
| |
|
30 September |
|
|
31 March |
|
| (Millions of US dollars) |
|
2007 |
|
|
2007 |
|
| |
|
|
|
|
|
|
|
|
|
Finished goods |
|
$ |
80.4 |
|
|
$ |
101.5 |
|
Work-in-process |
|
|
9.9 |
|
|
|
12.3 |
|
Raw materials and supplies |
|
|
52.3 |
|
|
|
37.8 |
|
Provision for obsolete finished goods and raw materials |
|
|
(6.4 |
) |
|
|
(4.0 |
) |
|
|
|
|
|
|
|
Total inventories |
|
$ |
136.2 |
|
|
$ |
147.6 |
|
|
|
|
|
|
|
|
| 4. |
|
Operating Segment Information and Concentrations of Risk |
| |
| |
|
The Company has reported its operating segment information in the format that the operating
segment information is available to and evaluated by the Board of Directors. USA Fibre Cement
manufactures and sells fibre cement interior linings, exterior siding and related accessories
products in the United States. Asia Pacific Fibre Cement includes all fibre cement
manufactured in Australia, New Zealand and the Philippines and sold in Australia, New Zealand
and Asia. Research and Development represents the cost incurred by the research and
development centres. Other includes the manufacture and sale of fibre cement reinforced pipes
in the United States, fibre cement operations in Europe and roofing operations in the United
States. The roofing plant was closed and the business ceased operations in April 2006. The
Company’s operating segments are strategic operating units that are managed separately due to
their different products and/or geographical location.
|
F-15
James Hardie Industries N.V. and Subsidiaries
Notes to Condensed Consolidated Financial Statements (Continued)
(Unaudited)
| |
|
The following are the Company’s operating segments and geographical information: |
| |
| |
|
Operating Segments |
| |
|
|
|
|
|
|
|
|
|
|
|
|
|
|
|
|
| |
|
Net Sales to Customers |
|
|
Net Sales to Customers |
|
| |
|
Three Months |
|
|
Six Months |
|
| |
|
Ended 30 September |
|
|
Ended 30 September |
|
| (Millions of US dollars) |
|
2007 |
|
|
2006 |
|
|
2007 |
|
|
2006 |
|
| |
|
|
|
|
|
|
|
|
|
|
|
|
|
|
|
|
|
USA Fibre Cement |
|
$ |
308.0 |
|
|
$ |
339.0 |
|
|
$ |
654.1 |
|
|
$ |
687.9 |
|
Asia Pacific Fibre Cement |
|
|
76.1 |
|
|
|
63.8 |
|
|
|
147.3 |
|
|
|
123.0 |
|
Other |
|
|
6.0 |
|
|
|
8.6 |
|
|
|
13.1 |
|
|
|
16.0 |
|
|
|
|
|
|
|
|
|
|
|
|
|
|
Worldwide total |
|
$ |
390.1 |
|
|
$ |
411.4 |
|
|
$ |
814.5 |
|
|
$ |
826.9 |
|
|
|
|
|
|
|
|
|
|
|
|
|
|
| |
|
|
|
|
|
|
|
|
|
|
|
|
|
|
|
|
| |
|
Income (loss) |
|
|
Income (loss) |
|
| |
|
Before Income Taxes |
|
|
Before Income Taxes |
|
| |
|
Three Months |
|
|
Six Months |
|
| |
|
Ended 30 September |
|
|
Ended 30 September |
|
| (Millions of US dollars) |
|
2007 |
|
|
2006 |
|
|
2007 |
|
|
2006 |
|
| |
|
|
|
|
|
|
|
|
|
|
|
|
|
|
|
|
|
USA Fibre Cement |
|
$ |
84.3 |
|
|
$ |
97.8 |
|
|
$ |
198.7 |
|
|
$ |
201.1 |
|
Asia Pacific Fibre Cement |
|
|
12.4 |
|
|
|
11.5 |
|
|
|
24.8 |
|
|
|
21.8 |
|
Research and Development |
|
|
(4.8 |
) |
|
|
(4.1 |
) |
|
|
(8.9 |
) |
|
|
(8.7 |
) |
Other |
|
|
(1.9 |
) |
|
|
(1.5 |
) |
|
|
(3.2 |
) |
|
|
(4.2 |
) |
|
|
|
|
|
|
|
|
|
|
|
|
|
Segments total |
|
|
90.0 |
|
|
|
103.7 |
|
|
|
211.4 |
|
|
|
210.0 |
|
General Corporate1 |
|
|
(45.3 |
) |
|
|
(62.7 |
) |
|
|
(91.7 |
) |
|
|
(100.1 |
) |
|
|
|
|
|
|
|
|
|
|
|
|
|
Total operating income |
|
|
44.7 |
|
|
|
41.0 |
|
|
|
119.7 |
|
|
|
109.9 |
|
Net interest income (expense)2 |
|
|
2.0 |
|
|
|
1.0 |
|
|
|
2.5 |
|
|
|
(1.0 |
) |
|
|
|
|
|
|
|
|
|
|
|
|
|
Worldwide total |
|
$ |
46.7 |
|
|
$ |
42.0 |
|
|
$ |
122.2 |
|
|
$ |
108.9 |
|
|
|
|
|
|
|
|
|
|
|
|
|
|
| |
|
|
|
|
|
|
|
|
| |
|
Total Identifiable Assets |
|
| |
|
30 September |
|
|
31 March |
|
| (Millions of US dollars) |
|
2007 |
|
|
2007 |
|
| |
|
|
|
|
|
|
|
|
|
USA Fibre Cement |
|
$ |
883.4 |
|
|
$ |
893.0 |
|
Asia Pacific Fibre Cement |
|
|
213.7 |
|
|
|
199.3 |
|
Other |
|
|
59.7 |
|
|
|
52.5 |
|
|
|
|
|
|
|
|
Segments total |
|
|
1,156.8 |
|
|
|
1,144.8 |
|
General Corporate3 |
|
|
1,041.1 |
|
|
|
983.3 |
|
|
|
|
|
|
|
|
Worldwide total |
|
$ |
2,197.9 |
|
|
$ |
2,128.1 |
|
|
|
|
|
|
|
|
F-16
James Hardie Industries N.V. and Subsidiaries
Notes to Condensed Consolidated Financial Statements (Continued)
(Unaudited)
| |
|
|
|
|
|
|
|
|
|
|
|
|
|
|
|
|
| Geographic Areas |
|
Net Sales to Customers |
|
|
Net Sales to Customers |
|
| |
|
Three Months |
|
|
Six Months |
|
| |
|
Ended 30 September |
|
|
Ended 30 September |
|
| (Millions of US dollars) |
|
2007 |
|
|
2006 |
|
|
2007 |
|
|
2006 |
|
| |
|
|
|
|
|
|
|
|
|
|
|
|
|
|
|
|
|
USA |
|
$ |
310.0 |
|
|
$ |
344.5 |
|
|
$ |
659.1 |
|
|
$ |
698.2 |
|
Australia |
|
|
51.3 |
|
|
|
43.3 |
|
|
|
98.1 |
|
|
|
84.3 |
|
New Zealand |
|
|
16.3 |
|
|
|
13.5 |
|
|
|
33.6 |
|
|
|
25.9 |
|
Other Countries |
|
|
12.5 |
|
|
|
10.1 |
|
|
|
23.7 |
|
|
|
18.5 |
|
|
|
|
|
|
|
|
|
|
|
|
|
|
Worldwide total |
|
$ |
390.1 |
|
|
$ |
411.4 |
|
|
$ |
814.5 |
|
|
$ |
826.9 |
|
|
|
|
|
|
|
|
|
|
|
|
|
|
| |
|
|
|
|
|
|
|
|
| |
|
Total Identifiable Assets |
|
| |
|
30 September |
|
|
31 March |
|
| (Millions of US dollars) |
|
2007 |
|
|
2007 |
|
| |
|
|
|
|
|
|
|
|
|
USA |
|
$ |
928.6 |
|
|
$ |
935.7 |
|
Australia |
|
|
138.5 |
|
|
|
127.1 |
|
New Zealand |
|
|
25.3 |
|
|
|
23.1 |
|
Other Countries |
|
|
64.4 |
|
|
|
58.9 |
|
|
|
|
|
|
|
|
Segments total |
|
|
1,156.8 |
|
|
|
1,144.8 |
|
General Corporate3 |
|
|
1,041.1 |
|
|
|
983.3 |
|
|
|
|
|
|
|
|
Worldwide total |
|
$ |
2,197.9 |
|
|
$ |
2,128.1 |
|
|
|
|
|
|
|
|
|
|
|
| 1 |
|
Included in General Corporate for the three months ended 30 September 2007 are
unfavourable asbestos adjustments of US$28.9 million and AICF SG&A expenses of US$1.1 million.
Included in General Corporate for the three months ended 30 September 2006 are unfavourable
asbestos adjustments of US$47.2 million. Included in General Corporate for the six months ended 30
September 2007 are unfavourable asbestos adjustments of US$59.0 million and AICF SG&A expenses of
US$1.7 million. Included in General
Corporate for the six months ended 30 September 2006 are unfavourable asbestos adjustments of
US$74.4 million. See Note 6. |
| |
| 2 |
|
Included in Net Interest Income for the three and six months ended 30 September 2007
is AICF interest income of US$2.6 million and US$4.2 million, respectively. See Note 6. |
| |
| 3 |
|
Asbestos-related assets at 30 September 2007 and 31 March 2007 are US$760.7
million and US$727.6 million, respectively, and are included in the General Corporate segment. See
Note 6. |
F-17
James Hardie Industries N.V. and Subsidiaries
Notes to Condensed Consolidated Financial Statements (Continued)
(Unaudited)
| 5. |
|
Accumulated Other Comprehensive Income |
| |
| |
|
Accumulated other comprehensive income consists of the following components: |
| |
|
|
|
|
|
|
|
|
| |
|
30 September |
|
|
31 March |
|
| (Millions of US dollars) |
|
2007 |
|
|
2007 |
|
| |
|
|
|
|
|
|
|
|
|
Pension and post-retirement benefit adjustments
(net of US$1.2 million and US$1.2 million tax benefit, respectively) |
|
$ |
(2.9 |
) |
|
$ |
(2.7 |
) |
Unrealised loss on restricted short-term investments |
|
|
(0.8 |
) |
|
|
— |
|
Foreign currency translation adjustments |
|
|
7.3 |
|
|
|
8.1 |
|
|
|
|
|
|
|
|
Total accumulated other comprehensive income |
|
$ |
3.6 |
|
|
$ |
5.4 |
|
|
|
|
|
|
|
|
| 6. |
|
Asbestos |
| |
| |
|
The Amended FFA to provide long-term funding to the AICF was approved by shareholders in
February 2007. The accounting policies utilised by the Company to account for the Amended FFA
are described in Note 2, Summary of Significant Accounting Policies. |
| |
| |
|
Asbestos Adjustments |
| |
| |
|
The asbestos adjustments included in the condensed consolidated statements of operations comprise
the following: |
| |
|
|
|
|
|
|
|
|
|
|
|
|
|
|
|
|
| |
|
Three Months |
|
|
Six Months |
|
| |
|
Ended 30 September |
|
|
Ended 30 September |
|
| (Millions of US dollars) |
|
2007 |
|
|
2006 |
|
|
2007 |
|
|
2006 |
|
| |
|
|
Effect of foreign exchange |
|
$ |
(27.0 |
) |
|
$ |
(5.4 |
) |
|
$ |
(60.2 |
) |
|
$ |
(32.6 |
) |
Other adjustments |
|
|
(1.9 |
) |
|
|
(41.8 |
) |
|
|
1.2 |
|
|
|
(41.8 |
) |
|
|
|
|
|
|
|
|
|
|
|
|
|
Total Asbestos Adjustments |
|
$ |
(28.9 |
) |
|
$ |
(47.2 |
) |
|
$ |
(59.0 |
) |
|
$ |
(74.4 |
) |
|
|
|
|
|
|
|
|
|
|
|
|
|
F-18
James Hardie Industries N.V. and Subsidiaries
Notes to Condensed Consolidated Financial Statements (Continued)
(Unaudited)
| |
|
Asbestos-Related Assets and Liabilities |
| |
| |
|
Under the terms of the Amended FFA, the Company has included on its consolidated balance sheets
certain asbestos-related assets and liabilities. These amounts are detailed in the table below, and
the net total of these asbestos-related assets and liabilities is commonly referred to by the
Company as the “Net Amended FFA Liability”. |
| |
|
|
|
|
|
|
|
|
| |
|
30 September |
|
|
31 March |
|
| (Millions of US dollars ) |
|
2007 |
|
|
2007 |
|
| |
Asbestos liability — current |
|
$ |
(69.5 |
) |
|
$ |
(63.5 |
) |
Asbestos liability — non-current |
|
|
(1,309.1 |
) |
|
|
(1,225.8 |
) |
|
|
|
|
|
|
|
Asbestos liability — Total |
|
|
(1,378.6 |
) |
|
|
(1,289.3 |
) |
|
|
|
|
|
|
|
|
|
Insurance receivable — current |
|
|
10.3 |
|
|
|
9.4 |
|
Insurance receivable — non-current |
|
|
171.0 |
|
|
|
165.1 |
|
|
|
|
|
|
|
|
Insurance receivable — Total |
|
|
181.3 |
|
|
|
174.5 |
|
|
|
|
|
|
|
|
|
|
Workers’ compensation asset — current |
|
|
3.0 |
|
|
|
2.7 |
|
Workers’ compensation asset — non-current |
|
|
83.7 |
|
|
|
76.5 |
|
Workers’ compensation liability — current |
|
|
(3.0 |
) |
|
|
(2.7 |
) |
Workers’ compensation liability — non-current |
|
|
(83.7 |
) |
|
|
(76.5 |
) |
|
|
|
|
|
|
|
Workers’ compensation — Total |
|
|
— |
|
|
|
— |
|
|
|
|
|
|
|
|
|
|
Deferred income taxes — current |
|
|
9.1 |
|
|
|
7.8 |
|
Deferred income taxes — non-current |
|
|
342.5 |
|
|
|
318.2 |
|
|
|
|
|
|
|
|
Deferred income taxes — Total |
|
|
351.6 |
|
|
|
326.0 |
|
|
|
|
|
|
|
|
|
|
Income tax payable (reduction in income tax payable) |
|
|
14.7 |
|
|
|
9.0 |
|
Other net liabilities |
|
|
(4.0 |
) |
|
|
(6.3 |
) |
|
|
|
|
|
|
|
|
|
|
|
|
|
|
|
|
Net Amended FFA liability |
|
|
(835.0 |
) |
|
|
(786.1 |
) |
|
|
|
|
|
|
|
|
|
Restricted cash and short-term investment assets of the AICF |
|
|
140.1 |
|
|
|
146.9 |
|
|
|
|
|
|
|
|
|
|
|
|
|
|
|
|
|
Unfunded Net Amended FFA liability |
|
$ |
(694.9 |
) |
|
$ |
(639.2 |
) |
|
|
|
|
|
|
|
F-19
James Hardie Industries N.V. and Subsidiaries
Notes to Condensed Consolidated Financial Statements (Continued)
(Unaudited)
| |
|
Asbestos Liability |
| |
| |
|
The amount of the asbestos liability reflects the terms of the Amended FFA, which has been
calculated by reference to (but is not exclusively based upon) the most recent actuarial estimate
of the projected future asbestos-related cash flows prepared by KPMG Actuaries. The asbestos
liability also includes an allowance for the future claims-handling costs of the AICF. The Company
will receive an updated actuarial estimate as of 31 March each year. The last actuarial assessment
was performed as of 31 March 2007. |
| |
| |
|
The changes in the asbestos liability for the six months ended 30 September 2007 are detailed in
the table below: |
| |
|
|
|
|
|
|
|
|
|
|
|
|
| |
|
A$ |
|
|
A$ to US$ |
|
|
US$ |
|
| |
|
Millions |
|
|
rate |
|
|
Millions |
|
| |
Asbestos liability — 31 March 2007 |
|
A$ |
(1,598.1 |
) |
|
|
1.2395 |
|
|
$ |
(1,289.3 |
) |
|
|
|
|
|
|
|
|
|
|
|
|
|
Asbestos claims paid1 |
|
|
35.7 |
|
|
|
1.1909 |
|
|
|
30.0 |
|
AICF claims-handling costs incurred1 |
|
|
1.4 |
|
|
|
1.1909 |
|
|
|
1.2 |
|
Effect of foreign exchange |
|
|
|
|
|
|
|
|
|
|
(120.5 |
) |
|
|
|
|
|
|
|
|
|
|
|
Asbestos liability — 30 September 2007 |
|
A$ |
(1,561.0 |
) |
|
|
1.1323 |
|
|
$ |
(1,378.6 |
) |
|
|
|
|
|
|
|
|
|
|
|
| Insurance Receivable — Asbestos |
| |
| The changes in the insurance receivable for the six months ended 30 September 2007 are detailed in
the table below: |
| |
|
|
|
|
|
|
|
|
|
|
|
|
| |
|
A$ |
|
|
A$ to US$ |
|
|
US$ |
|
| |
|
Millions |
|
|
rate |
|
|
Millions |
|
| |
Insurance receivable — 31 March 2007 |
|
A$ |
216.3 |
|
|
|
1.2395 |
|
|
$ |
174.5 |
|
|
|
|
|
|
|
|
|
|
|
|
|
|
Insurance recoveries1 |
|
|
(11.2 |
) |
|
|
1.1909 |
|
|
|
(9.4 |
) |
Change in estimate2 |
|
|
0.2 |
|
|
|
1.1782 |
|
|
|
0.2 |
|
Effect of foreign exchange |
|
|
|
|
|
|
|
|
|
|
16.0 |
|
|
|
|
|
|
|
|
|
|
|
|
Insurance receivable — 30 September 2007 |
|
A$ |
205.3 |
|
|
|
1.1323 |
|
|
$ |
181.3 |
|
|
|
|
|
|
|
|
|
|
|
|
| Deferred Income Taxes — Asbestos |
| |
| The changes in the deferred income taxes — asbestos for the six months ended 30 September 2007 are
detailed in the table below: |
| |
|
|
|
|
|
|
|
|
|
|
|
|
| |
|
A$ |
|
|
A$ to US$ |
|
|
US$ |
|
| |
|
Millions |
|
|
rate |
|
|
Millions |
|
| |
Deferred income taxes — 31 March 2007 |
|
A$ |
404.1 |
|
|
|
1.2395 |
|
|
$ |
326.0 |
|
|
|
|
|
|
|
|
|
|
|
|
|
|
Amounts offset against income tax payable1 |
|
|
(5.5 |
) |
|
|
1.1909 |
|
|
|
(4.6 |
) |
Impact of asbestos adjustments1 |
|
|
(0.5 |
) |
|
|
1.1909 |
|
|
|
(0.4 |
) |
Effect of foreign exchange |
|
|
|
|
|
|
|
|
|
|
30.6 |
|
|
|
|
|
|
|
|
|
|
|
|
Deferred income taxes — 30 September 2007 |
|
A$ |
398.1 |
|
|
|
1.1323 |
|
|
$ |
351.6 |
|
|
|
|
|
|
|
|
|
|
|
|
F-20
James Hardie Industries N.V. and Subsidiaries
Notes to Condensed Consolidated Financial Statements (Continued)
(Unaudited)
| |
|
Other Net Liabilities |
| |
| |
|
Other net liabilities include a provision for asbestos-related education and medical research
contributions of US$3.8 million at 30 September 2007. Also included in other net liabilities are
the other assets and liabilities of the AICF at 30 September 2007, which include US$0.6 million of
trade receivables and prepayments, US$0.4 million of fixed assets, and US$1.2 million of trade
payables and accruals. |
| |
| |
|
Restricted Cash and Short-term Investment Assets of the AICF |
| |
| |
|
Cash and cash equivalents and short-term investments of the AICF are reflected as restricted assets
as these assets are restricted for use in the settlement of asbestos claims and payment of the
operating costs of the AICF. During the three and six months ended 30 September 2007 no short-term
investments were purchased or sold |
| |
| |
|
The changes in the restricted cash and short-term investment assets of the AICF for the six months
ended 30 September 2007 are detailed in the table below: |
| |
|
|
|
|
|
|
|
|
|
|
|
|
| |
|
A$ |
|
|
A$ to US$ |
|
|
US$ |
|
| |
|
Millions |
|
|
rate |
|
|
Millions |
|
| |
Restricted cash and short-term investment
assets — 31 March 2007 |
|
A$ |
182.1 |
|
|
|
1.2395 |
|
|
$ |
146.9 |
|
|
|
|
|
|
|
|
|
|
|
|
|
|
Asbestos claims paid1 |
|
|
(35.7 |
) |
|
|
1.1909 |
|
|
|
(30.0 |
) |
AICF operating costs paid — claims-handling1 |
|
|
(1.4 |
) |
|
|
1.1909 |
|
|
|
(1.2 |
) |
AICF operating costs paid — non claims-handling1 |
|
|
(2.0 |
) |
|
|
1.1909 |
|
|
|
(1.7 |
) |
Insurance recoveries1 |
|
|
11.2 |
|
|
|
1.1909 |
|
|
|
9.4 |
|
Interest and investment income1 |
|
|
5.0 |
|
|
|
1.1909 |
|
|
|
4.2 |
|
Unrealized loss on investments1 |
|
|
(0.9 |
) |
|
|
1.1909 |
|
|
|
(0.8 |
) |
Other1 |
|
|
0.3 |
|
|
|
1.1909 |
|
|
|
0.3 |
|
Effect of foreign exchange |
|
|
— |
|
|
|
|
|
|
|
13.0 |
|
|
|
|
|
|
|
|
|
|
|
|
Restricted cash and short-term investment
assets — 30 September 2007 |
|
A$ |
158.6 |
|
|
|
1.1323 |
|
|
$ |
140.1 |
|
|
|
|
|
|
|
|
|
|
|
|
|
|
|
| 1 |
|
The average exchange rate for the period is used to convert the Australian dollar
amount to US dollars based on the assumption that these transactions occurred evenly throughout
the period. |
| |
| 2 |
|
The spot exchange rate at 30 June 2007 is used to convert the Australian dollar
amount to US dollars as the adjustment to the estimate was made on that date. |
F-21
James Hardie Industries N.V. and Subsidiaries
Notes to Condensed Consolidated Financial Statements (Continued)
(Unaudited)
| |
|
Claims Data |
| |
| |
|
The AICF provides compensation payments for Australian asbestos-related personal injury claims
against the Liable Entities. The claims data in this section are only reflective of these
Australian asbestos-related personal injury claims against the Liable Entities. |
| |
| |
|
For the six months ended 30 September 2007 and twelve months ended 31 March 2007, the following
table, provided by KPMG Actuaries, shows the claims filed, the number of claims dismissed, settled
or otherwise resolved for each period and the average settlement amount per claim: |
| |
|
|
|
|
|
|
|
|
| |
|
Six Months |
|
|
Twelve Months |
|
| |
|
Ended |
|
|
Ended |
|
| |
|
30 September 2007 |
|
|
31 March 2007 |
|
| |
|
|
|
|
|
|
|
|
|
Number of claims filed |
|
|
275 |
|
|
|
463 |
|
Number of claims dismissed |
|
|
38 |
|
|
|
121 |
|
Number of claims settled or otherwise resolved |
|
|
219 |
|
|
|
416 |
|
Average settlement amount per settled claim |
|
A$ |
147,249 |
|
|
A$ |
166,164 |
|
Average settlement amount per settled claim |
|
US$ |
123,645 |
|
|
US$ |
127,165 |
|
| |
|
The following table, provided by KPMG Actuaries, shows the activity related to the numbers of
open claims, new claims and closed claims during each of the past five years and the average
settlement per settled claim and case closed: |
| |
|
|
|
|
|
|
|
|
|
|
|
|
|
|
|
|
|
|
|
|
| |
|
For the |
|
|
|
|
| |
|
Period Ended |
|
|
For the Year Ended 31 March |
|
| |
|
30 September 2007 |
|
|
2007 |
|
|
20061 |
|
|
2005 |
|
|
2004 |
|
| |
|
|
|
|
|
|
|
|
|
|
|
|
|
|
|
|
|
|
|
|
|
Number of open claims at beginning of period |
|
|
490 |
|
|
|
564 |
|
|
|
712 |
|
|
|
687 |
|
|
|
743 |
|
Number of new claims |
|
|
275 |
|
|
|
463 |
|
|
|
346 |
|
|
|
489 |
|
|
|
379 |
|
Number of closed claims |
|
|
257 |
|
|
|
537 |
|
|
|
502 |
|
|
|
464 |
|
|
|
435 |
|
Number of open claims at end of period |
|
|
508 |
|
|
|
490 |
|
|
|
556 |
|
|
|
712 |
|
|
|
687 |
|
Average settlement amount per settled claim |
|
A$ |
147,249 |
|
|
A$ |
166,164 |
|
|
A$ |
151,883 |
|
|
A$ |
157,594 |
|
|
A$ |
167,450 |
|
Average settlement amount per case closed |
|
A$ |
125,477 |
|
|
A$ |
128,723 |
|
|
A$ |
122,535 |
|
|
A$ |
136,536 |
|
|
A$ |
121,642 |
|
|
|
|
|
|
|
|
|
|
|
|
|
|
|
|
|
|
|
|
|
|
Average settlement amount per settled claim |
|
US$ |
123,645 |
|
|
US$ |
127,165 |
|
|
US$ |
114,318 |
|
|
US$ |
116,572 |
|
|
US$ |
116,127 |
|
Average settlement amount per case closed |
|
US$ |
105,363 |
|
|
US$ |
98,510 |
|
|
US$ |
92,229 |
|
|
US$ |
100,996 |
|
|
US$ |
84,356 |
|
|
|
|
| 1 |
|
Information includes claims data for only 11 months ended 28 February 2006. Claims
data for the 12 months ended 31 March 2006 were not available at the time the Company’s
financial statements were prepared. |
| |
|
Under the terms of the Amended FFA, the Company has obtained rights of access to actuarial
information produced for the AICF by the actuary appointed by the AICF (the “Approved Actuary”).
The Company’s future disclosures with respect to claims statistics are subject to it obtaining such
information from the Approved Actuary. The Company has had no general right (and has not obtained
any right under the Amended FFA) to audit or otherwise require independent verification of such
information or the methodologies to be adopted by the Approved Actuary. As such, the Company will
need to rely on the accuracy and completeness of the information and analysis of the Approved
Actuary when making future disclosures with respect to claims statistics.
|
F-22
James Hardie Industries N.V. and Subsidiaries
Notes to Condensed Consolidated Financial Statements (Continued)
(Unaudited)
| 7. |
|
Commitments and Contingencies |
| |
| |
|
ASIC Proceedings |
| |
| |
|
In February 2007 ASIC commenced civil proceedings in the Supreme Court of New South Wales (the
“Court”) against the Company, ABN 60 and ten former officers and directors of the James Hardie
Group. While the subject matter of the allegations varies between individual defendants, the
allegations against the Company are confined to alleged contraventions of provisions of the
Australian Corporations Act/Law relating to continuous disclosure, a director’s duty of care
and diligence, and engaging in misleading or deceptive conduct in respect of a security. |
| |
| |
|
In the proceedings, ASIC seeks: |
| |
• |
|
declarations regarding the alleged contraventions; |
| |
| |
• |
|
orders for pecuniary penalties in such amount as the Court thinks fit up to the limits
specified in the Corporations Act; |
| |
| |
• |
|
orders that former James Hardie group directors or
officers Michael Brown, Michael Gillfillan, Meredith Hellicar, Martin Koffel, Peter Macdonald,
Philip Morley, Geoffrey O’Brien, Peter Shafron, Gregory Terry and Peter Willcox be prohibited
from managing an Australian corporation for such period as the Court thinks fit; |
| |
| |
• |
|
an order
that the Company execute a deed of indemnity in favour of ABN 60 Pty Limited in the amount of
A$1.9 billion or such amount as ABN 60 or its directors consider is necessary to ensure that
ABN 60 remains solvent; and |
| |
| |
• |
|
its costs of the
proceedings. |
| |
|
The Company is defending each of the allegations made by ASIC and the orders
sought against it in the proceedings, as are the other former directors and officers. |
| |
| |
|
ASIC has indicated that its investigations into other related matters continue and may result
in further actions, both civil and criminal. However, it has not indicated the possible
defendants to any such actions. |
| |
| |
|
The Company has entered into deeds of indemnity with certain of its directors and officers, as
is common practice for publicly listed companies. The Company’s articles of association also
contain an indemnity for directors and officers and the Company has granted indemnities to
certain of its former related corporate bodies which may require the Company to indemnify
those entities against indemnities they have granted their directors and officers. To date,
claims for payments of expenses incurred have been received from certain former directors and
officers in relation to the ASIC investigation, and in relation to the examination of these
persons by ASIC delegates, the amount of which is not significant. Now that proceedings have
been brought against former directors and officers of the James Hardie Group, the Company will
incur further liabilities under these indemnities. Initially, the Company has obligations, or
has offered, to advance funds in respect of defence costs and depending on the outcome of the
proceedings, may be or become responsible for these and other amounts. |
| |
| |
|
There remains considerable uncertainty surrounding the likely outcome of the ASIC proceedings
in the longer term and there is a possibility that the related costs to the Company could be
material. However, at this stage, it is not possible to determine the amount of any such
liability. Therefore, the Company believes that both the probable and estimable requirements
under SFAS No. 5, “Accounting for Contingencies” for recording a liability have not been met.
|
F-23
James Hardie Industries N.V. and Subsidiaries
Notes to Condensed Consolidated Financial Statements (Continued)
(Unaudited)
| |
|
Environmental and Legal |
| |
| |
|
The operations of the Company, like those of other companies engaged in similar businesses,
are subject to a number of federal, state and local laws and regulations on air and water
quality, waste handling and disposal. The Company’s policy is to accrue for environmental
costs when it is determined that it is probable that an obligation exists and the amount can
be reasonably estimated. In the opinion of management, based on information presently known
except as set forth above, the ultimate liability for such matters should not have a material
adverse effect on either the Company’s consolidated financial position, results of operations
or cash flows. |
| |
| |
|
The Company is involved from time to time in various legal proceedings and administrative
actions incidental or related to the normal conduct of its business. Although it is impossible
to predict the outcome of any pending legal proceeding, management believes that such
proceedings and actions should not, except as it relates to asbestos as described above,
individually or in the aggregate, have a material adverse effect on its consolidated financial
position, results of operations or cash flows. |
| |
| 8. |
|
Short and Long-Term Debt |
| |
| |
|
Debt consists of the following components: |
| |
|
|
|
|
|
|
|
|
| |
|
30 September |
|
|
31 March |
|
| (Millions of US dollars) |
|
2007 |
|
|
2007 |
|
| |
|
|
|
|
|
|
|
|
|
Short-term debt |
|
$ |
93.0 |
|
|
$ |
83.0 |
|
Long-term debt |
|
|
30.0 |
|
|
|
105.0 |
|
|
|
|
|
|
|
|
Total debt1 |
|
$ |
123.0 |
|
|
$ |
188.0 |
|
|
|
|
|
|
|
|
|
|
|
| 1 |
|
Total debt at 5.93% and 5.91% weighted average rates at 30 September 2007 and
31 March 2007, respectively. |
| |
|
The Company’s credit facilities currently consist of 364-day facilities in the amount of
US$110.0 million, which as of 30 September 2007, US$68.3 million had a maturity date in June 2008
and US$41.7 million had a maturity date in December 2008. The Company also has term facilities in
the amount of US$245.0 million, which as of 30 September 2007, had a maturity date in June 2010.
For all facilities, interest is calculated at the commencement of each draw-down period based on
the US$ London Interbank Offered Rate (“LIBOR”) plus the margins of individual lenders, and is
payable at the end of each draw-down period. During the three months ended 30 September 2007 and
2006, the Company paid commitment fees in the amount of US$0.1 million and US$0.2 million,
respectively, and US$0.2 million and US$0.4 million for the six months ended 30 September 2007 and
2006, respectively. At 30 September 2007, there was US$123.0 million drawn under the combined
facilities and US$232.0 million was available. |
| |
| |
|
Short-term debt at 30 September 2007 and 31 March 2007 comprised US$93.0 million and US$83.0
million, respectively, drawn under the 364-day facilities. Long-term debt at 30 September 2007 and
31 March 2007 comprised US$30.0 million and US$105.0 million, respectively, drawn under the term
facilities. |
| |
| |
|
At 30 September 2007, management believes that the Company was in compliance with all restrictive
covenants contained in its credit facility agreements. Under the most restrictive of these
covenants, the Company (i) is required to maintain a certain ratio of debt to equity, (ii) must
maintain a certain level of net worth, (iii) must maintain a certain ratio of earnings before
interest and taxes to net interest charges and (iv) has limits on how much it can spend on an
annual basis in relation to asbestos payments to the AICF. Such limits are consistent with the
contractual liabilities of the Performing Subsidiary and the Company under the Amended FFA.
|
F-24
James Hardie Industries N.V. and Subsidiaries
Notes to Condensed Consolidated Financial Statements (Continued)
(Unaudited)
| |
|
The Company anticipates being able to meet its future payment obligations from existing
cash, unutilised committed facilities and future net operating cash flows. |
| |
| 9. |
|
Income Taxes |
| |
| |
|
In June 2006, the FASB issued FASB Interpretation No. 48 (“FIN 48”), “Accounting for
Uncertainty in Income Taxes, an interpretation of SFAS No. 109, Accounting for Income Taxes”.
FIN 48 clarifies the accounting for uncertainty in income taxes recognised in an enterprise’s
financial statements in accordance with SFAS No. 109. Unlike SFAS No. 109, FIN 48 prescribes a
recognition threshold and measurement attribute for the financial statement recognition and
measurement of a tax position taken or expected to be taken in a tax return. Additionally, FIN
48 provides guidance on derecognition, classification, interest and penalties, accounting in
interim periods, disclosure and transition. |
| |
| |
|
The Company adopted FIN 48 on 1 April 2007. The adoption of FIN 48 resulted in the reduction
of the Company’s consolidated beginning retained earnings of US$90.4 million. As of the
adoption date, the Company had US$39.0 million of gross unrecognised tax benefits that, if
recognised, would affect the effective tax rate. As of the adoption date, the Company’s
opening accrual for interest and penalties is US$52.1 million. |
| |
| |
|
During the three and six months ended 30 September 2007, the gross increase in unrecognised
tax benefits as a result of tax positions taken during a prior period was nil and US$1.5
million,
respectively. For the three and six months ended 30 September 2007, there was an unfavourable
impact of changes in foreign currency exchange rates of US$1.7 million and US$3.7 million,
respectively. If recognised, US$40.6 million, of the 30 September 2007 balance would affect
the effective tax rate. |
| |
| |
|
The Company recognises penalties and interest accrued related to unrecognised tax benefits in
income tax expense. During the three and six months ended 30 September 2007, the Company
recognised increases of US$3.4 million and US$4.3 million, respectively, in interest and
penalties and recognised these amounts as income tax expense. For the three and six months
ended 30 September 2007, there was an unfavourable impact of changes in foreign currency
exchange rates of US$2.4 million and US$5.1 million, respectively. At 30 September 2007, the
accrual for interest and penalties is US$60.8 million. |
| |
| |
|
The Company or one of its subsidiaries files income tax returns in the US federal
jurisdiction, and various states and foreign jurisdictions including Australia and the
Netherlands. The Company is no longer subject to US federal examinations by US Internal
Revenue Service (“IRS”) for tax years prior to tax year 2004. The Company is no longer
subject to examinations by the Netherlands tax authority, the Belastingdienst, for tax years
prior to tax year 2002. With certain limited exceptions, the Company is no longer subject to
Australian federal examinations by the Australian Taxation Office (“ATO”) for tax years prior
to tax year 2000. The Company is currently subject to audit and review in a number of
jurisdictions in which it operates and has been advised that further audits will commence in
the next 12 months. It is anticipated that the audits and reviews currently being conducted
will be completed within the next 12 months. |
| |
| |
|
A number of years may elapse before an uncertain tax position is audited and ultimately
settled. It is difficult to predict the ultimate outcome or the timing of resolution for
uncertain tax positions. It is reasonably possible that the amount of unrecognised tax
benefits could significantly increase or decrease within the next twelve months. These changes
could result from the settlement of ongoing litigation, the completion of ongoing
examinations, the expiration of the statute of limitations, or other circumstances. At this
time, an estimate of the range of the reasonably possible change cannot be made.
|
F-25
James Hardie Industries N.V. and Subsidiaries
Notes to Condensed Consolidated Financial Statements (Continued)
(Unaudited)
| 10. |
|
Amended ATO Assessment |
| |
| |
|
In March 2006, RCI Pty Ltd (“RCI”), a wholly owned subsidiary of the Company, received an amended
assessment from the ATO in respect of RCI’s income tax return for the year ended 31 March 1999. The
amended assessment relates to the amount of net capital gains arising as a result of an internal
corporate restructure carried out in 1998 and has been issued pursuant to the discretion granted to
the Commissioner of Taxation under Part IVA of the Australian Income Tax Assessment Act 1936. The
original amended assessment issued to RCI was for a total of A$412.0 million. However, after two
remissions of general interest charges (“GIC”) made by the ATO during fiscal year 2007, the total
was revised to A$368.0 million and is comprised of the following as of 30 September 2007: |
| |
|
|
|
|
|
|
|
|
| (Millions of dollars) |
|
US$ 1 |
|
|
A$ |
|
| |
Primary tax after allowable credits |
|
$ |
151.9 |
|
|
A$ |
172.0 |
|
Penalties2 |
|
|
38.0 |
|
|
|
43.0 |
|
GIC |
|
|
135.1 |
|
|
|
153.0 |
|
|
|
|
|
|
|
|
Total amended assessment |
|
$ |
325.0 |
|
|
A$ |
368.0 |
|
|
|
|
|
|
|
|
|
|
|
| 1 |
|
US$ amounts calculated using the A$/US$ foreign exchange
spot rate at 30 September 2007. |
| |
| 2 |
|
Represents 25% of primary tax. |
| |
|
During fiscal year 2007, the Company agreed with the ATO that in accordance with the ATO
Receivable Policy, the Company would pay 50% of the total amended assessment being A$184.0 million
(US$162.5 million), and provide a guarantee from James Hardie Industries N.V. in favour of the ATO
for the remaining unpaid 50% of the amended assessment, pending outcome of the appeal of the
amended assessment. The Company also agreed to pay GIC accruing on the unpaid balance of the
amended assessment in arrears on a quarterly basis. Up to 30 September 2007, GIC totalling A$88.7
million has been paid to the ATO. On 15 October 2007, the Company paid A$3.2 million in GIC in
respect of the quarter ended 30 September 2007. |
| |
| |
|
On 30 May 2007, the ATO issued a Notice of Decision disallowing the Company’s objection to the
amended assessment. On 11 July 2007, the Company filed an application appealing the Objection
Decision with the Federal Court of Australia. |
| |
| |
|
RCI strongly disputes the amended assessment and is pursuing all avenues of appeal to contest the
ATO’s position in this matter. The ATO has confirmed that RCI has a reasonably arguable position
that the amount of net capital gains arising as a result of the corporate restructure carried out
in 1998 has been reported correctly in the fiscal year 1999 tax return and that Part IVA does not
apply. As a result, the ATO reduced the amount of penalty from an automatic 50% of primary tax that
would otherwise apply in these circumstances, to 25% of primary tax. In Australia, a reasonably
arguable position means that the tax position is about as likely to be correct as it is not
correct. The Company and RCI received legal and tax advice at the time of the transaction, during
the ATO enquiries and following receipt of the amended assessment. The Company believes that it is
more likely than not that the tax position reported in RCI’s tax return for the 1999 fiscal year
will be upheld on appeal. Therefore, the Company believes that the requirements under FIN 48 for
recording a liability have not been met and therefore it has not recorded any liability at 30
September 2007 for the remainder of the amended assessment. |
| |
| |
|
The Company expects that amounts paid in respect of the amended assessment would be recovered by
RCI (with interest) at the time RCI is successful in its appeal against the amended assessment. As
a result, the Company has treated all payments in respect of the amended assessment that have been
made up to 30 September 2007 as a deposit and it is the Company’s intention to treat any payments
to be made at a later date as a deposit.
|
F-26
James Hardie Industries N.V. and Subsidiaries
Notes to Condensed Consolidated Financial Statements (Continued)
(Unaudited)
| 11. |
|
Stock-Based Compensation |
| |
| |
|
At 30 September 2007, the Company had the following stock-based compensation plans: the Executive
Share Purchase Plan; the Managing Board Transitional Stock Option Plan; the JHI NV 2001 Equity
Incentive Plan; the JHI NV Stock Appreciation Rights Incentive Plan; the Supervisory Board Share
Plan; the Supervisory Board Share Plan 2006 and the Long-Term Incentive Plan. |
| |
| |
|
The following table summarises all of the Company’s shares available for grant and the movement in
all of the Company’s outstanding options: |
| |
|
|
|
|
|
|
|
|
|
|
|
|
| |
|
|
|
|
|
Outstanding Options |
|
| |
|
|
|
|
|
|
|
|
|
Weighted |
|
| |
|
Shares |
|
|
|
|
|
|
Average |
|
| |
|
Available for |
|
|
|
|
|
|
Exercise |
|
| |
|
Grant |
|
|
Number |
|
|
Price |
|
Balance at 1 April 2007 |
|
|
19,420,793 |
|
|
|
18,939,817 |
|
|
A$ |
7.52 |
|
|
|
|
|
|
|
|
|
|
|
|
|
|
Granted |
|
|
(1,016,000 |
) |
|
|
1,016,000 |
|
|
A$ |
7.83 |
|
Exercised |
|
|
— |
|
|
|
(406,360 |
) |
|
A$ |
6.50 |
|
Forfeited |
|
|
1,077,500 |
|
|
|
(1,077,500 |
) |
|
A$ |
8.03 |
|
|
|
|
|
|
|
|
|
|
|
|
|
|
|
|
|
|
|
|
|
|
|
|
|
Balance at 30 September 2007 |
|
|
19,482,293 |
|
|
|
18,471,957 |
|
|
A$ |
7.53 |
|
|
|
|
|
|
|
|
|
|
|
|
| |
|
Compensation expense arising from stock option grants, as estimated using option-pricing
models, was US$1.6 million and US$1.2 million for the three months ended 30 September 2007 and
2006, respectively, and US$3.1 million and US$2.7 million for the six months ended 30 September
2007 and 2006, respectively. As of 30 September 2007, the unrecorded deferred stock-based
compensation balance related to stock options was US$9.9 million after estimated forfeitures and
will be recognised over an estimated weighted average amortisation period of 2.0 years. |
| |
| |
|
Long-Term Incentive Plan |
| |
| |
|
At the 2006 Annual General Meeting, the Company’s shareholders approved the establishment of a
Long-Term Incentive Plan (“LTIP”) to provide incentives to members of the Company’s Managing Board
and to certain members of its management (“Executives”). The shareholders also approved, in
accordance with certain LTIP rules, the issue of certain options or other rights over, or interest
in, ordinary fully-paid shares in the Company (“Shares”), the issue and/or transfer of Shares under
them, and the grant of cash awards to members of the Company’s Managing Board and to Executives. In
November 2006, 1,132,000 options were granted under the LTIP to the Managing Board. In August 2007
an additional 1,016,000 options were granted to the Managing Board under the LTIP. The vesting of
these options is subject to ‘performance hurdles’ as outlined in the LTIP rules. Unexercised
options expire 10 years from the date of issue. At 30 September 2007, there were 2,148,000 options
outstanding under this plan. |
| |
| |
|
Options granted under the LTIP are valued using a lattice model that incorporates a Monte Carlo
Simulation since vesting of these options requires that certain target market conditions are
achieved. The determination of the fair value of stock-based payment awards on the date of grant
using an option-pricing model is affected by our stock price as well as assumptions regarding a
number of complex and subjective variables. These variables include our expected stock price
volatility over the term of the awards, actual and projected employee stock option exercise
behaviours, risk-free rate and expected dividends. We estimate the expected term of options granted
by calculating the average term from our historical stock option exercise experience. We estimate
the volatility of our common stock based on historical daily stock price volatility. We base the
risk-free interest rate on US Treasury notes with terms similar to the expected term of the
options. We calculate dividend yield using the current company dividend policy at the time of
option grant.
|
F-27
James Hardie Industries N.V. and Subsidiaries
Notes to Condensed Consolidated Financial Statements (Continued)
(Unaudited)
| |
|
The following table includes the weighted average assumptions and weighted average fair values
used for grants valued using the Monte Carlo method during the six months ended 30 September 2007: |
| |
|
|
|
|
Dividend yield |
|
|
1.6 |
% |
Expected volatility |
|
|
32.1 |
% |
Risk-free interest rate |
|
|
4.2 |
% |
Weighted average fair value at grant date |
|
A$ |
3.14 |
|
Number of stock options |
|
|
1,016,000 |
|
| 12. |
|
Share Repurchase Program |
| |
| |
|
On 15 August 2007, the Company announced a share repurchase program of up to 10% of the
Company’s issued capital, approximately 46.8 million shares. The Company repurchased
approximately 7.5 million shares of common stock having an aggregate cost of A$54.0 million
(US$47.1 million) during the three and six months ended 30 September 2007. The average price
paid per share of common stock was A$7.18 (US$6.28). During the period between 1 October 2007
and 12 October 2007, the Company repurchased approximately 4.2 million shares of common stock
having an aggregate cost of A$30.8 million (US$27.1 million). |
| |
| 13. |
|
Subsequent Events |
| |
| |
|
Suspension of Production at Blandon |
| |
| |
|
On 31 October 2007, the Company announced plans to suspend production at its Blandon,
Pennsylvania plant in North America. The Company will record an impairment of approximately
US$31.7 million and a provision for closure costs currently estimated at US$1.8 million in the
third quarter of fiscal year 2008. |
| |
| |
|
Interim Dividend |
| |
| |
|
On 19 November 2007, the Company announced an interim dividend of US12 cents a share. The
dividend was declared in United States currency and will be paid on 18 December 2007, with a
record date of 4 December 2007.
|
F-28
Item 2. Quantitative and Qualitative Disclosures About Market Risk
James Hardie Industries N.V. and Subsidiaries
(Unaudited)
| |
|
In this report, James Hardie Industries N.V. and its subsidiaries are collectively referred to
as “we,” “us,” or “our,” and the terms “US$”, “A$”, “NZ$”, “PHP”, refer to United States dollars,
Australian dollars, New Zealand dollars and Philippine pesos, respectively. |
| |
| |
|
We have operations in foreign countries and, as a result, are exposed to foreign currency exchange
rate risk inherent in purchases, sales, assets and liabilities denominated in currencies other than
the US dollar. We also are exposed to interest rate risk associated with our long-term debt and to
changes in prices of commodities we use in production. |
| |
| |
|
Our policy is to enter into derivative instruments solely to mitigate risks in our business and not
for trading or speculative purposes. |
| |
| |
|
Foreign Currency Exchange Rate Risk |
| |
| |
|
We have significant operations outside of the United States and, as a result, are exposed to
changes in exchange rates which affect our financial position, results of operations and cash
flows. In addition, payments to the AICF are required to be made in Australian dollars which,
because the majority of our revenues is produced in US dollars, exposes the Company to risks
associated with fluctuations in the US dollar/Australian dollar exchange rate. |
| |
| |
|
For the six months ended 30 September 2007, the following currencies comprised the following
percentages of our net sales, cost of goods sold, expenses and liabilities: |
| |
|
|
|
|
|
|
|
|
|
|
|
|
|
|
|
|
| |
|
|
US$ |
|
|
A$ |
|
|
NZ$ |
|
|
Other1 |
| |
|
|
|
|
|
|
|
|
|
|
|
|
|
|
|
|
|
Net sales |
|
|
80.9 |
% |
|
|
12.0 |
% |
|
|
4.1 |
% |
|
|
3.0 |
% |
Cost of goods sold |
|
|
81.9 |
% |
|
|
12.2 |
% |
|
|
3.4 |
% |
|
|
2.5 |
% |
Expenses 2 |
|
|
48.1 |
% |
|
|
46.2 |
% |
|
|
2.1 |
% |
|
|
3.6 |
% |
Liabilities (excluding borrowings)2 |
|
|
13.7 |
% |
|
|
84.6 |
% |
|
|
1.1 |
% |
|
|
0.6 |
% |
|
|
|
| 1 |
|
Comprises Philippine pesos and Euros. |
| |
| 2 |
|
Liabilities include A$ denominated asbestos liability, which w as initially
recorded in the fourth quarter of fiscal year 2006. Expenses include adjustments to the
liability. See Note 6 for further information. |
| |
|
We purchase raw materials and fixed assets and sell some finished product for amounts
denominated in currencies other than the functional currency of the business in which the related
transaction is generated. In order to protect against foreign exchange rate movements, we may
enter into forward exchange contracts timed to mature when settlement of the underlying transaction
is due to occur. At 30 September 2007, there were no such material contracts outstanding. |
| |
| |
|
Interest Rate Risk |
| |
| |
|
We have market risk from changes in interest rates, primarily related to our borrowings. At 30
September 2007, all of the Company’s borrowings were variable-rate. From time to time, we may enter
into interest rate swap contracts in an effort to mitigate interest rate risk. As of 30 September
2007, the Company had no interest swap contracts outstanding. As of 30 September 2007, the Company
had outstanding forward rate agreements totalling US$35.0 million with a fixed rate of 4.30%
excluding margin from July 2008 to October 2008.
|
F-29
Item 2. Quantitative and Qualitative Disclosures About Market Risk
James Hardie Industries N.V. and Subsidiaries
(Unaudited)
| |
|
Commodity Price Risk |
| |
| |
|
The Company is exposed to changes in prices of commodities used in its operations, primarily
associated with energy, fuel and raw materials such as pulp and cement. Pulp has historically
demonstrated more price sensitivity than other raw materials that we use in our manufacturing
process. In addition, energy, fuel, and cement prices rose in fiscal year 2007 and continued to
rise during the first half of fiscal year 2008. Pulp prices have also been subject to significant
price fluctuations in the past. The Company expects that pulp, energy, fuel and cement prices will
continue to fluctuate in the near future. To minimise the additional working capital requirements
caused by rising prices related to these commodities, the Company may seek to enter into contracts
with suppliers for the purchase of these commodities that could fix the Company’s prices over the
longer-term. However, if the Company enters into such contracts with suppliers and if such
commodity prices decrease, the Company’s cost of sales may be negatively impacted due to the fixed
pricing over the longer-term.
|
F-30
James Hardie Industries N.V. and Subsidiaries
(Unaudited)
| |
|
This Financial Report forms part of a package of information about the Company’s results. It
should be read in conjunction with the other parts of this package, including the Media Release,
Management Presentation and Management’s Analysis of Results. |
| |
| |
|
Disclaimer |
| |
| |
|
This Financial Report of results contains forward-looking statements. James Hardie may from time to
time
make forward-looking statements in its periodic reports filed with or furnished to the United
States Securities and Exchange Commission on Forms 20-F and 6-K, in the annual reports to
shareholders, in offering circulars, invitation memoranda and prospectuses, in media releases and
other written materials and in oral statements made by the Company’s officers, directors or
employees to analysts, institutional investors, lenders and potential lenders, representatives of
the media and others. Examples of forward-looking statements include: |
| |
— |
|
expectations about the timing and amount of payments to the Asbestos Injuries Compensation
Fund (AICF), a special purpose fund for the compensation of proven asbestos-related personal
injury and death claims; |
| |
| |
— |
|
expectations with respect to the effect on the Company’s financial statements of those
payments; |
| |
| |
— |
|
statements as to the possible consequences of proceedings brought against the Company and
certain of its former directors and officers by the Australian Securities and Investments
Commission; |
| |
| |
— |
|
expectations that our credit facilities will be extended or renewed; |
| |
| |
— |
|
projections of the Company’s operating results or financial condition; |
| |
| |
— |
|
statements regarding the Company’s plans, objectives or goals, including those relating
to competition, acquisitions, dispositions and the Company’s products; |
| |
| |
— |
|
statements about the Company’s future performance; |
| |
| |
— |
|
statements about product or environmental liabilities; and |
| |
| |
— |
|
statements regarding tax liabilities and related proceedings. |
| |
|
Words such as “believe,” “anticipate,” “plan,” “expect,” “intend,” “target,” “estimate,” “project,”
“predict,” “forecast,” “guideline,” “should,” “aim” and similar expressions are intended to
identify forward-looking statements but are not the exclusive means of identifying such statements. |
| |
| |
|
Forward-looking statements involve inherent risks and uncertainties. The Company cautions that a
number of important factors could cause actual results to differ materially from the plans,
objectives, expectations, estimates and intentions expressed in such forward-looking statements.
These factors, some of which are discussed under “Risk Factors” beginning on page 6 of the Form
20-F filed on 6 July 2007 with the Securities and Exchange Commission, include but are not limited
to: all matters relating to or arising out of the prior manufacture of products that contained
asbestos by current and former James Hardie subsidiaries; required contributions to the AICF and
the effect of foreign exchange on the amount recorded in the Company’s financial statements as an
asbestos liability; compliance with and changes in tax laws and treatments; competition and product
pricing in the markets in which the Company operates; the consequences of product failures or
defects; exposure to environmental, asbestos or other legal proceedings; general economic and
market conditions; the supply and cost of raw materials; the success of research and development
efforts; reliance on a small number of product distributors; compliance with and changes in
environmental and health and safety laws; risks of conducting business internationally; compliance
with and changes in laws and regulations; foreign exchange risks; the successful implementation of
new software systems; and the effect of natural disasters. The Company cautions that the foregoing
list of factors is not exhaustive and that other risks and uncertainties may cause actual results
to differ materially from those in forward-looking statements. Forward-looking statements speak
only as of the date they are made. |
F-31
| |
|
|
|
|
| |
|

James Hardie Industries N.V.
ARBN 097 829 895
Incorporated in The Netherlands
The liability of members is limited |
| |
|
|
| 19 November 2007 |
|
Atrium 8th Floor
Strawinskylaan 3077
1077 ZX Amsterdam,
The Netherlands
|
| |
|
|
|
|
Telephone:
Fax:
|
|
31-20-301 2980
31-20-404 2544 |
Directors’ Report
for the half year ended 30 September 2007
Directors
At the date of this report the members of the Supervisory Board are: Mr D DeFosset (Chairman), Mr
DG McGauchie AO (Deputy Chairman), Mrs CM Walter AM and Messrs DR Andrews, BP Anderson, JD Barr, MN
Hammes, JRH Loudon and RMJ van der Meer; and the members of the Managing Board are: Messrs L Gries
(CEO) and RL Chenu (CFO). The Joint Board consists of all of the members of the Supervisory Board
plus Mr Gries.
The changes in the composition of the Boards between 1 April 2007 and the date of this report were:
Mrs CM Walter AM was appointed as a member of the Supervisory and Joint Boards with effect from 1
July 2007 and re-elected for a 3 year term at the Annual General Meeting on 17 August 2007; Mr DR
Andrews was appointed as a member of the Supervisory and Joint Boards with effect from 1 September
2007; and Mr BP Butterfield resigned from the Managing Board with effect from 1 October 2007.
Review of Operations
Please see Management’s Analysis of Results relating to the period ended 30 September 2007.
Auditor’s Independence
The Directors obtained an annual independence declaration from the Company’s auditors,
PricewaterhouseCoopers.
This report is made in accordance with a resolution of the members of the Joint Board.
| |
|
|

D DeFossset
Chairman
Supervisory and Joint Boards
|
|

L Gries
Chief Executive Officer and
Chairman Managing Board |
Signed Amsterdam, The Netherlands, 19 November 2007
| |
|
|
|
|
| |
|

|
|
|
|
|
|
| |
|
James Hardie Industries N.V.
ARBN 097 829 895
Incorporated in The Netherlands
The liability of members is limited |
|
|
|
|
|
| 19 November 2007 |
|
Atrium 8th Floor
Strawinskylaan 3077
1077 ZX Amsterdam,
The Netherlands
|
|
|
|
|
|
|
|
Telephone:
|
|
31-20-301 2980 |
|
|
Fax:
|
|
31-20-404 2544 |
Joint Board of Directors’ Declaration
for the half year ended 30 September 2007
The Joint Board of Directors of James Hardie Industries NV declare that with regards to the
attached:
| a) |
|
the Report complies with the accounting standards in accordance with which it was prepared; |
| b) |
|
the information contained in the Report fairly presents, in all material respects, the
financial condition and results of operations of the Company; and |
| c) |
|
in the Directors’ opinion, there are reasonable grounds to believe that the Company will be
able to pay its debts as and when they become due and payable. |
This report is made in accordance with a resolution of the members of the Joint Board.
| |
|
|
D DeFossset
Chairman
Supervisory and Joint Boards
|
|
L Gries
Chief Executive Officer and
Chairman Managing Board
|
Signed Amsterdam, The Netherlands, 19 November 2007
| |
|
|

D DeFossset
Chairman
Supervisory and Joint Boards
|
|

L Gries
Chief Executive Officer and
Chairman Managing Board |
Signed Amsterdam, The Netherlands, 19 November 2007


