Exhibit 99.2
(PAGE)
BUSINESS OVERVIEW            In this Management Presentation, James Hardie may present the financial measures, sales volume terms, financial ratios, and Non-US GAAP financial measures included in the Endnotes section of this document starting on page 20. The company presents financial measures that it believes are customarily used by its Australian investors. Specifically, these financial measures include “EBIT” and “EBIT margin”. The company may also present other terms for measuring its sales volumes (“million square feet (mmsf)”); and Non-US GAAP financial measures (“EBIT and EBIT margin excluding adjustments to asbestos adjustments, SCI and other related expense, and impairment of roofing plant”). Unless otherwise stated, results are for continuing operations only. James Hardie US Investor/Analyst Tour 4-5 December 2007 Louis Gries Chief Executive Officer 2 Product Categories Exterior products .. Siding .. Soffit .. Fascia .. Trim Interior products .. 1/4 inch backerboard .. Hardiebacker 500®


(PAGE)
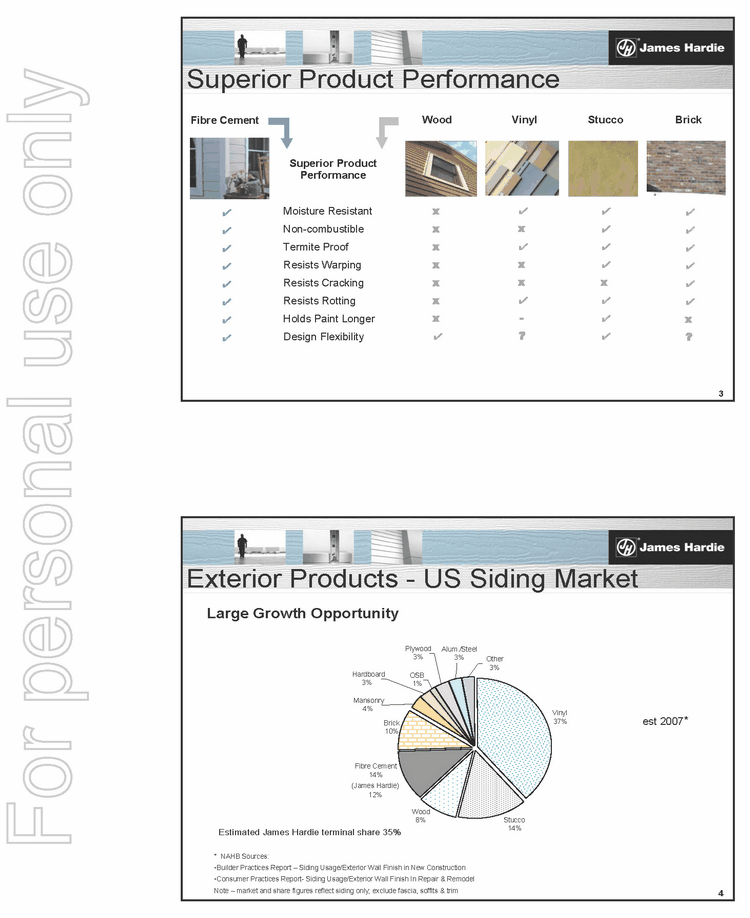
3 Superior Product Performance Fibre Cement Superior Product Performance Moisture Resistant Non-combustible Termite Proof Resists Warping Resists Cracking Resists Rotting Holds Paint Longer Design Flexibility ! ! ! ! ! ! ! ! Wood Vinyl Stucco Brick ! x ! x x ! — ? ! ! ! ! x ! ! ! ! ! ! ! ! ! x ? x x x x x x x ! 4 Exterior Products — US Siding Market Large Growth Opportunity est 2007* Vinyl 37% Fibre Cement 14% Brick 10% OSB 1% Plywood 3% Hardboard 3% Mansonry 4% Other 3% Alum./Steel 3% Stucco 14% Wood 8% * NAHB Sources: ·Builder Practices Report — Siding Usage/Exterior Wall Finish in New Construction Consumer Practices Report- Siding Usage/Exterior Wall Finish In Repair & Remodel Note — market and share figures reflect siding only; exclude fascia, soffits & trim Estimated James Hardie terminal share 35% (James Hardie) 12%


(PAGE)
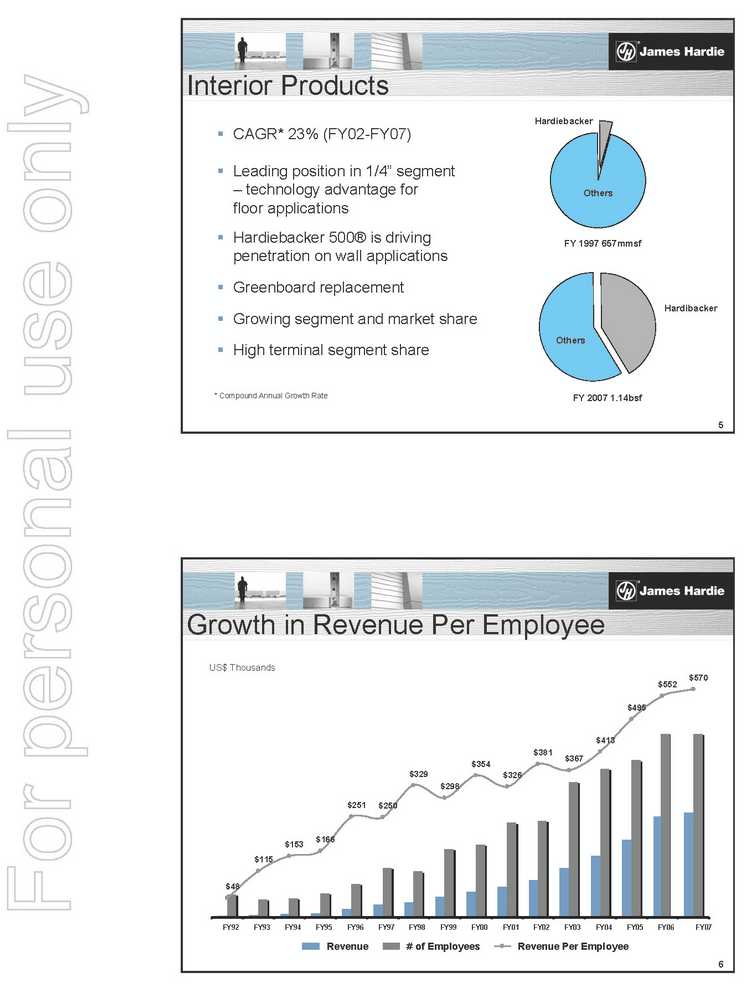
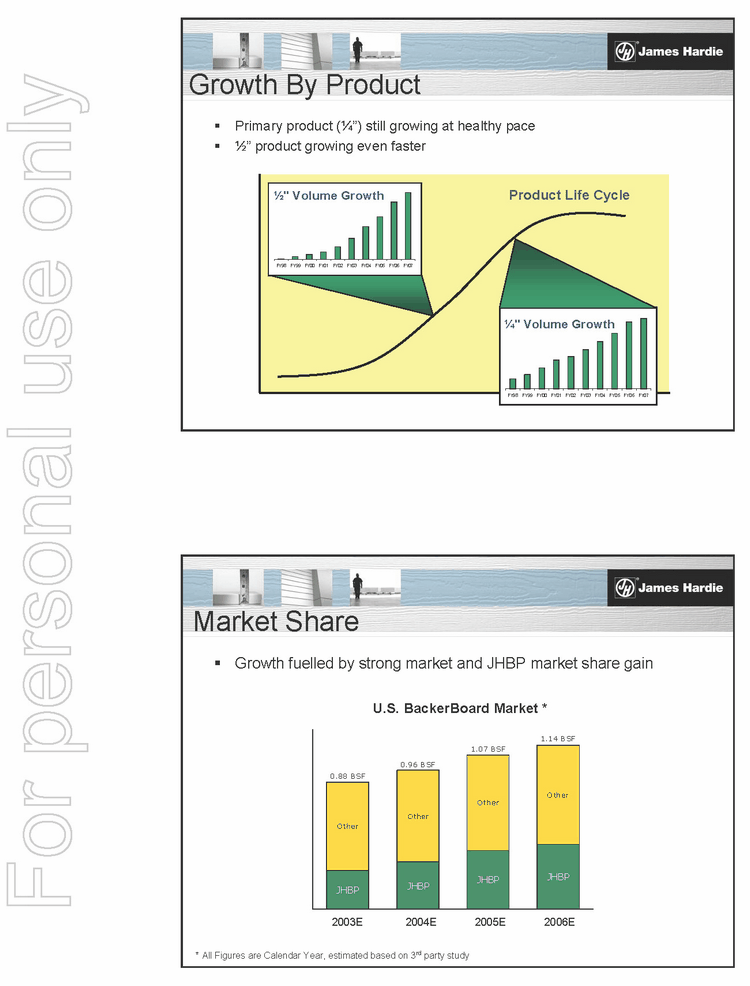
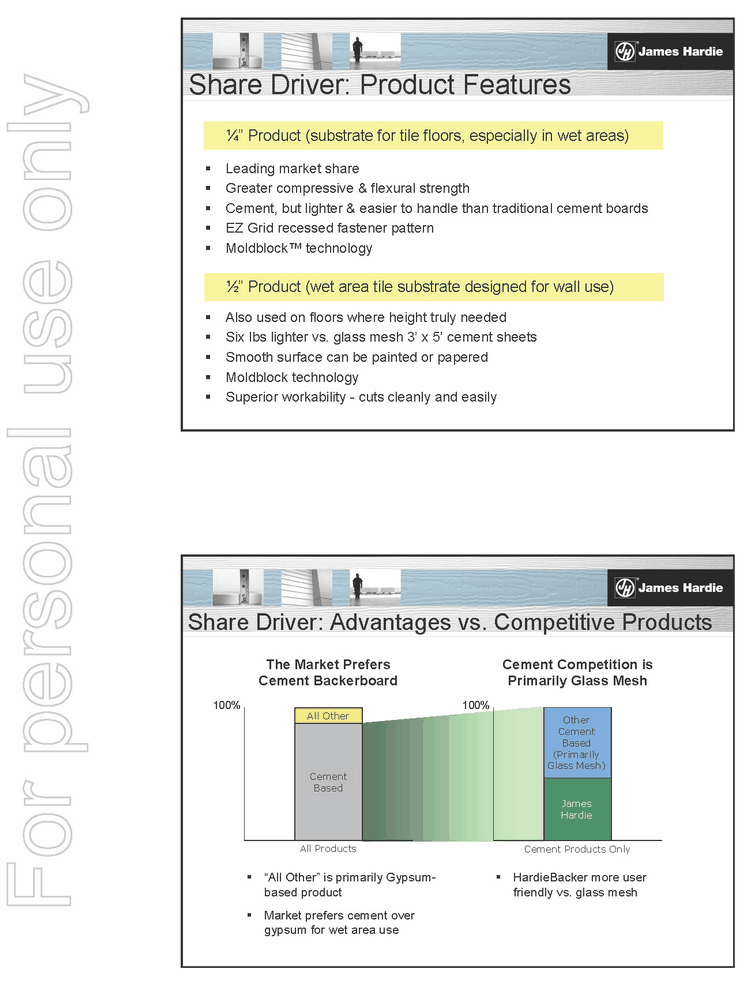
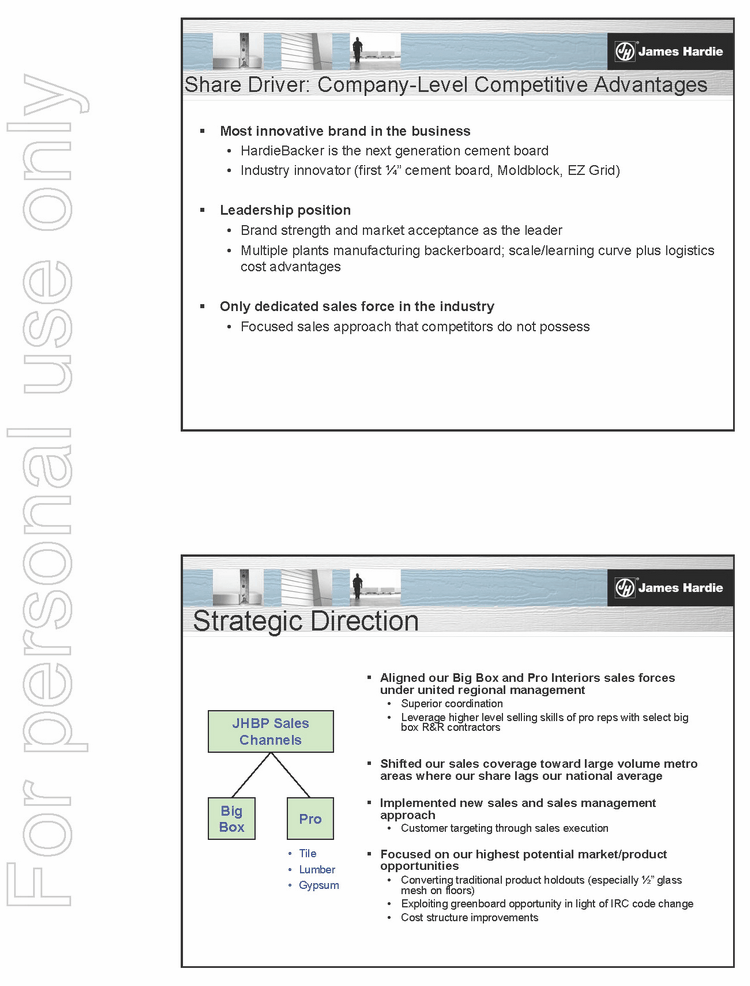
5 Interior Products .. CAGR* 23% (FY02-FY07) .. Leading position in 1/4” segment - technology advantage for floor applications .. Hardiebacker 500® is driving penetration on wall applications .. Greenboard replacement .. Growing segment and market share .. High terminal segment share * Compound Annual Growth Rate Hardiebacker FY 1997 657mmsf FY 2007 1.14bsf Others Hardibacker Others 6 Growth in Revenue Per Employee US$ Thousands $570 $552 $495 $48 $115 $153 $166 $251 $250 $329 $298 $354 $326 $381 $367 $413 FY92 FY93 FY94 FY95 FY96 FY97 FY98 FY99 FY00 FY01 FY02 FY03 FY04 FY05 FY06 FY07 Revenue # of Employees Revenue Per Employee


(PAGE)
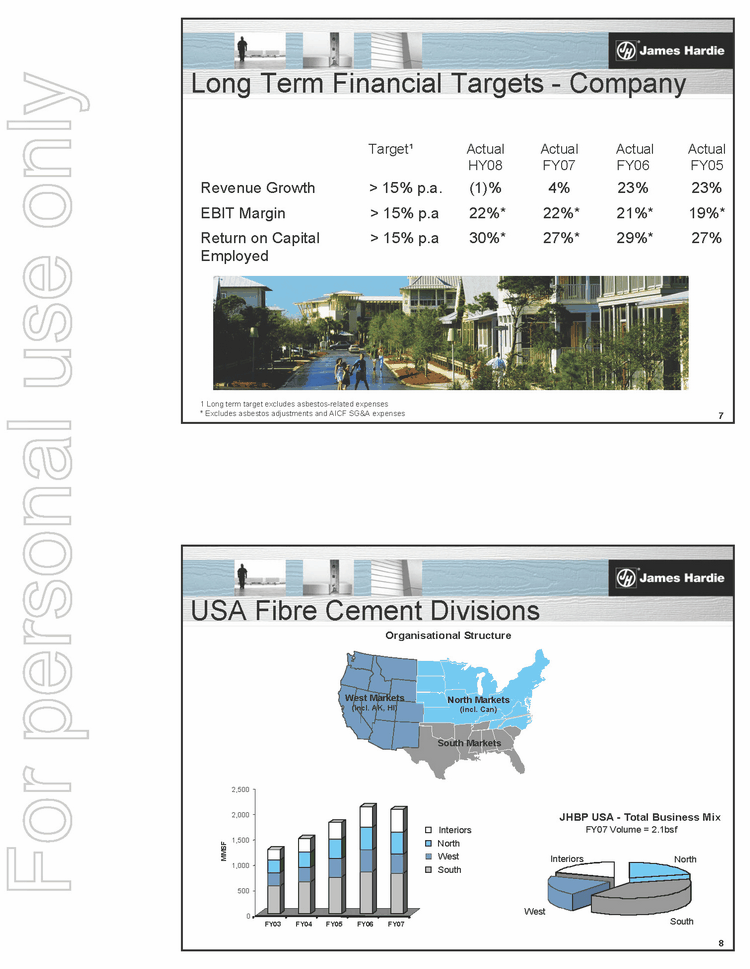
7 Long Term Financial Targets — Company 30%* 22%* (1)% Actual HY08 27%* 22%* 4% Actual FY07 29%* 21%* 23% Actual FY06 27% 19%* 23% Actual FY05 Return on Capital 15% p.a Employed EBIT Margin 15% p.a Revenue Growth 15% p.a. Target 1 1 Long term target excludes asbestos-related expenses * Excludes asbestos adjustments and AICF SG&A expenses 8 USA Fibre Cement Divisions West JHBP USA — Total Business Mix FY07 Volume = 2.1bsf North South Interiors Organisational Structure West Markets (incl. AK, HI) North Markets (incl. Can) South Markets 0 500 1,000 1,500 2,000 2,500 MMSF FY03 FY04 FY05 FY06 FY07 Interiors North West South


(PAGE)
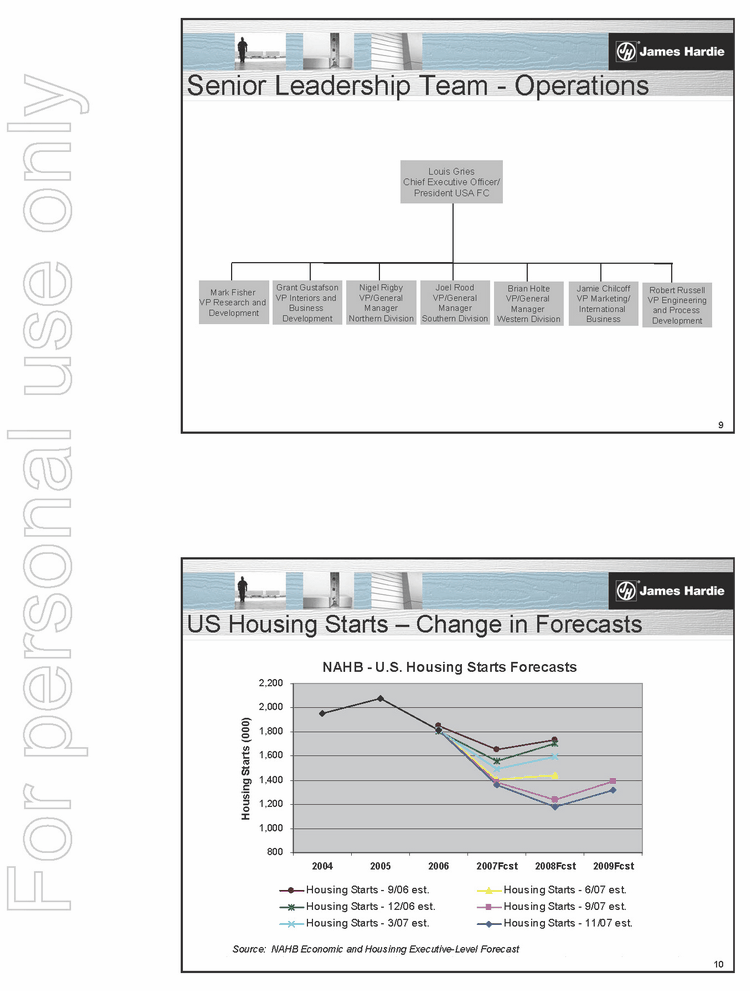
9 Senior Leadership Team — Operations Louis Gries Chief Executive Officer/ President USA FC Grant Gustafson VP Interiors and Business Development Nigel Rigby VP/General Manager Northern Division Joel Rood VP/General Manager Southern Division Brian Holte VP/General Manager Western Division Jamie Chilcoff VP Marketing/ International Business Mark Fisher VP Research and Development Robert Russell VP Engineering and Process Development 10 US Housing Starts — Change in Forecasts Source: NAHB Economic and Housinng Executive-Level Forecast NAHB - U.S. Housing Starts Forecasts 800 1,000 1,200 1,400 1,600 1,800 2,000 2,200 2004 2005 2006 2007Fcst 2008Fcst 2009Fcst Housing Starts (000) Housing Starts — 9/06 est. Housing Starts — 6/07 est. Housing Starts — 12/06 est. Housing Starts — 9/07 est. Housing Starts — 3/07 est. Housing Starts — 11/07 est.


(PAGE)
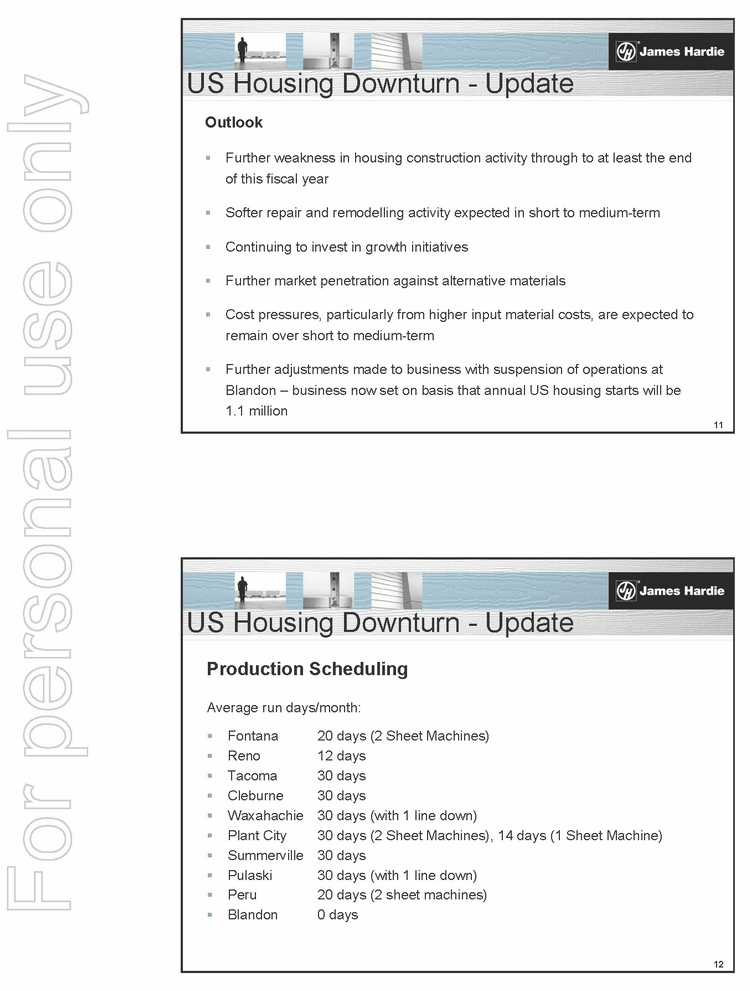
11 Outlook .. Further weakness in housing construction activity through to at least the end of this fiscal year .. Softer repair and remodelling activity expected in short to medium-term .. Continuing to invest in growth initiatives .. Further market penetration against alternative materials .. Cost pressures, particularly from higher input material costs, are expected to remain over short to medium-term .. Further adjustments made to business with suspension of operations at Blandon — business now set on basis that annual US housing starts will be 1.1 million US Housing Downturn — Update 12 Production Scheduling Average run days/month: .. Fontana 20 days (2 Sheet Machines) .. Reno 12 days .. Tacoma 30 days .. Cleburne 30 days .. Waxahachie 30 days (with 1 line down) .. Plant City 30 days (2 Sheet Machines), 14 days (1 Sheet Machine) .. Summerville 30 days .. Pulaski 30 days (with 1 line down) .. Peru 20 days (2 sheet machines) .. Blandon 0 days US Housing Downturn — Update


(PAGE)
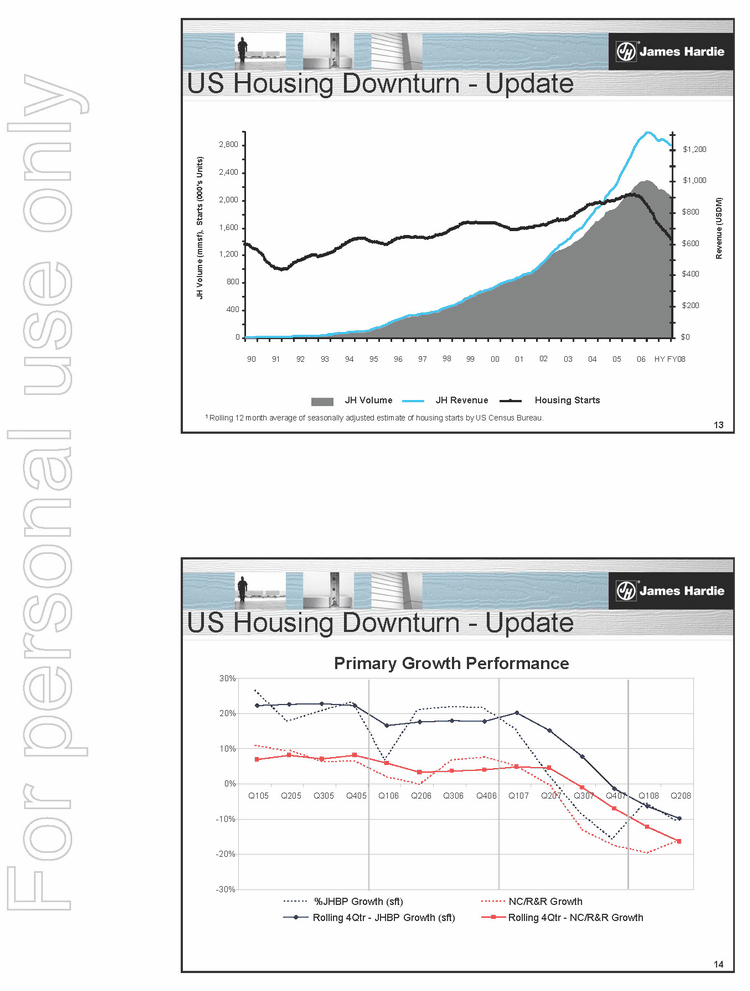
13 1 Rolling 12 month average of seasonally adjusted estimate of housing starts by US Census Bureau. 0 400 800 1,200 1,600 2,000 2,400 2,800 90 91 92 93 94 95 96 97 98 99 00 01 02 03 04 05 06 HY FY08 JH Volume (mmsf), Starts (000’s Units) $0 $200 $400 $600 $800 $1,000 $1,200 Revenue (USDM) JH Volume JH Revenue Housing Starts US Housing Downturn — Update 14 Primary Growth Performance -30% -20% -10% 0% 10% 20% 30% Q105 Q205 Q305 Q405 Q106 Q206 Q306 Q406 Q107 Q207 Q307 Q407 Q108 Q208 %JHBP Growth (sft) NC/R&R Growth Rolling 4Qtr — JHBP Growth (sft) Rolling 4Qtr — NC/R&R Growth US Housing Downturn — Update


(PAGE)
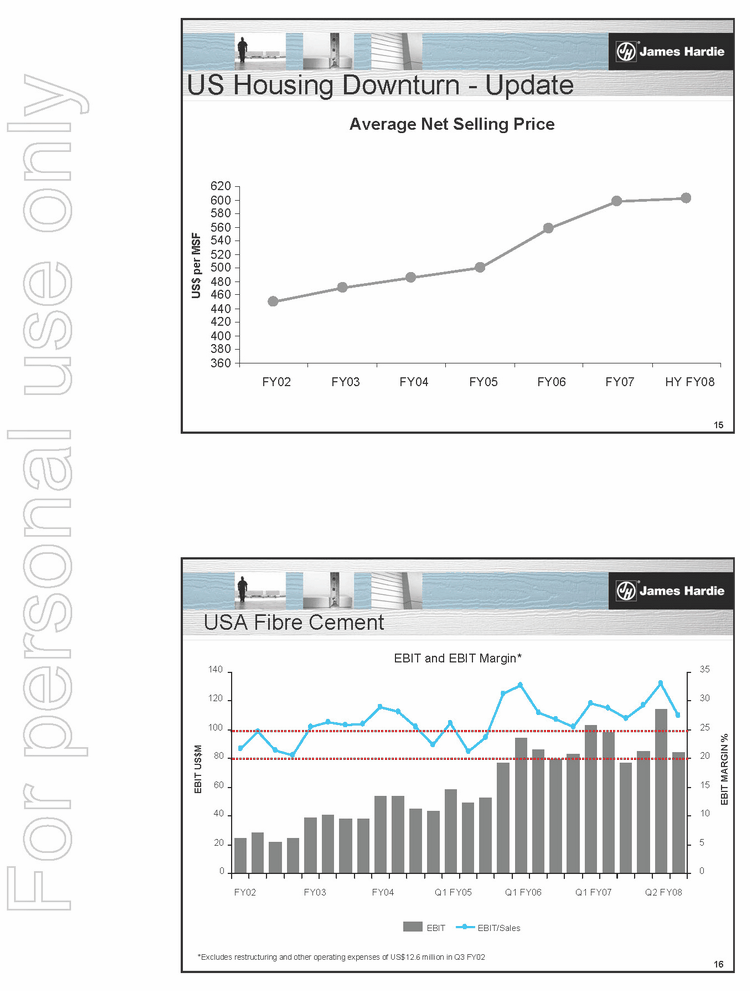
15 Average Net Selling Price US$  per MSF 360 380 400 420 440 460 480 500 520 540 560 580 600 620 FY02 FY03 FY04 FY05 FY06 FY07 HY FY08 US Housing Downturn — Update 16 *Excludes restructuring and other operating expenses of US$12.6 million in Q3 FY02 USA Fibre Cement 0 20 40 60 80 100 120 140 FY02 FY03 FY04 Q1 FY05 Q1 FY06 Q1 FY07 Q2 FY08 EBIT US$M 0 5 10 15 20 25 30 35 EBIT MARGIN % EBIT EBIT/Sales EBIT and EBIT Margin*


(PAGE)
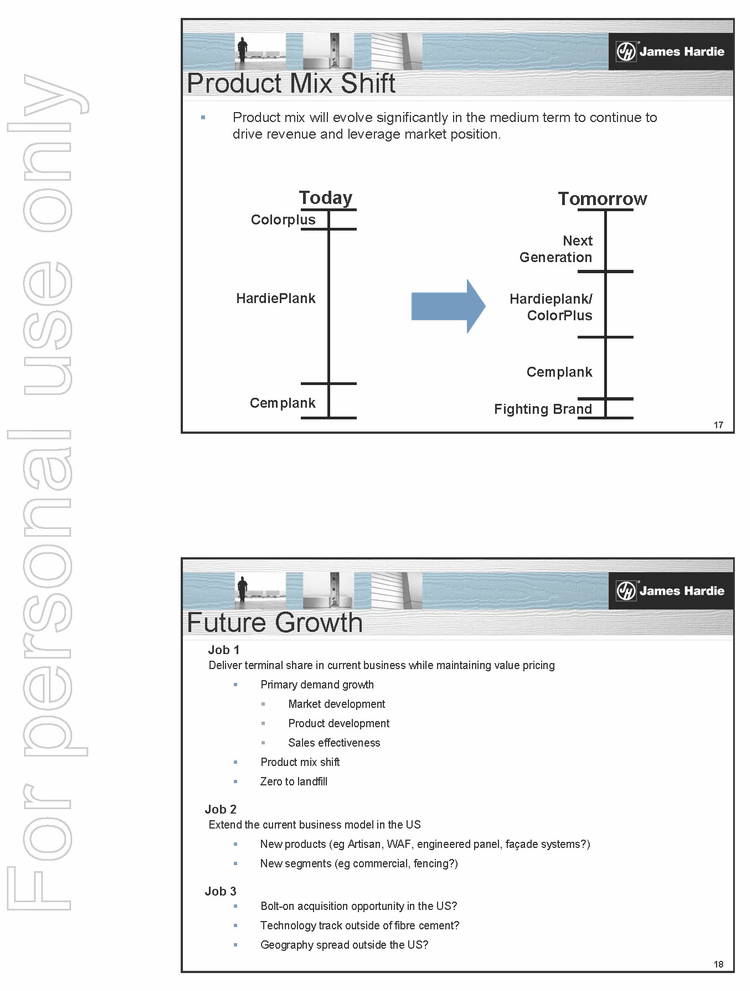
17 Product Mix Shift Today Tomorrow HardiePlank Colorplus Cemplank Next Generation Fighting Brand Cemplank Hardieplank/ ColorPlus .. Product mix will evolve significantly in the medium term to continue to drive revenue and leverage market position. 18 Future Growth Job 1 Deliver terminal share in current business while maintaining value pricing .. Primary demand growth .. Market development .. Product development .. Sales effectiveness .. Product mix shift         .. Zero to landfill Job 2 Extend the current business model in the US .. New products (eg Artisan, WAF, engineered panel, façade systems?) .. New segments (eg commercial, fencing?) Job 3         .. Bolt-on acquisition opportunity in the US? .. Technology track outside of fibre cement? .. Geography spread outside the US?


(PAGE)
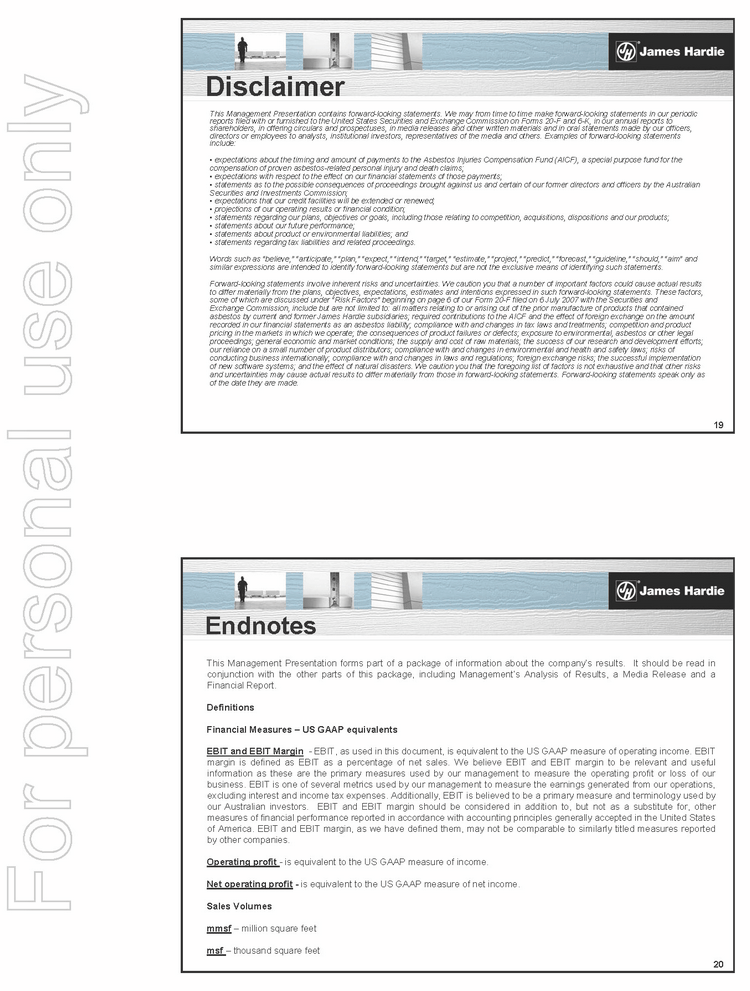
19 Disclaimer This Management Presentation contains forward-looking statements. We may from time to time make forward-looking statements in our periodic reports filed with or furnished to the United States Securities and Exchange Commission on Forms 20-F and 6-K, in our annual reports to shareholders, in offering circulars and prospectuses, in media releases and other written materials and in oral statements made by our officers, directors or employees to analysts, institutional investors, representatives of the media and others. Examples of forward-looking statements include: expectations about the timing and amount of payments to the Asbestos Injuries Compensation Fund (AICF), a special purpose fund for the compensation of proven asbestos-related personal injury and death claims; expectations with respect to the effect on our financial statements of those payments; statements as to the possible consequences of proceedings brought against us and certain of our former directors and officers by the Australian Securities and Investments Commission; expectations that our credit facilities will be extended or renewed; projections of our operating results or financial condition; statements regarding our plans, objectives or goals, including those relating to competition, acquisitions, dispositions and our products; statements about our future performance; statements about product or environmental liabilities; and statements regarding tax liabilities and related proceedings. Words such as “believe,” “anticipate,” “plan,” “expect,” “intend,” “target,” “estimate,” “project,” “predict,” “forecast,” “guideline,” “should,” “aim” and similar expressions are intended to identify forward-looking statements but are not the exclusive means of identifying such statements. Forward-looking statements involve inherent risks and uncertainties. We caution you that a number of important factors could cause actual results to differ materially from the plans, objectives, expectations, estimates and intentions expressed in such forward-looking statements. These factors, some of which are discussed under “Risk Factors” beginning on page 6 of our Form 20-F filed on 6 July 2007 with the Securities and Exchange Commission, include but are not limited to: all matters relating to or arising out of the prior manufacture of products that contained asbestos by current and former James Hardie subsidiaries; required contributions to the AICF and the effect of foreign exchange on the amount recorded in our financial statements as an asbestos liability; compliance with and changes in tax laws and treatments; competition and product pricing in the markets in which we operate; the consequences of product failures or defects; exposure to environmental, asbestos or other legal proceedings; general economic and market conditions; the supply and cost of raw materials; the success of our research and development efforts; our reliance on a small number of product distributors; compliance with and changes in environmental and health and safety laws; risks of conducting business internationally; compliance with and changes in laws and regulations; foreign exchange risks; the successful implementation of new software systems; and the effect of natural disasters. We caution you that the foregoing list of factors is not exhaustive and that other risks and uncertainties may cause actual results to differ materially from those in forward-looking statements. Forward-looking statements speak only as of the date they are made. 20 Endnotes This Management Presentation forms part of a package of information about the company’s results. It should be read in conjunction with the other parts of this package, including Management’s Analysis of Results, a Media Release and a Financial Report. Definitions Financial Measures — US GAAP equivalents EBIT and EBIT Margin — EBIT, as used in this document, is equivalent to the US GAAP measure of operating income. EBIT margin is defined as EBIT as a percentage of net sales. We believe EBIT and EBIT margin to be relevant and useful information as these are the primary measures used by our management to measure the operating profit or loss of our business. EBIT is one of several metrics used by our management to measure the earnings generated from our operations, excluding interest and income tax expenses. Additionally, EBIT is believed to be a primary measure and terminology used by our Australian investors. EBIT and EBIT margin should be considered in addition to, but not as a substitute for, other measures of financial performance reported in accordance with accounting principles generally accepted in the United States of America. EBIT and EBIT margin, as we have defined them, may not be comparable to similarly titled measures reported by other companies. Operating profit - - is equivalent to the US GAAP measure of income. Net operating profit — is equivalent to the US GAAP measure of net income. Sales Volumes mmsf — million square feet msf — thousand square feet


(PAGE)
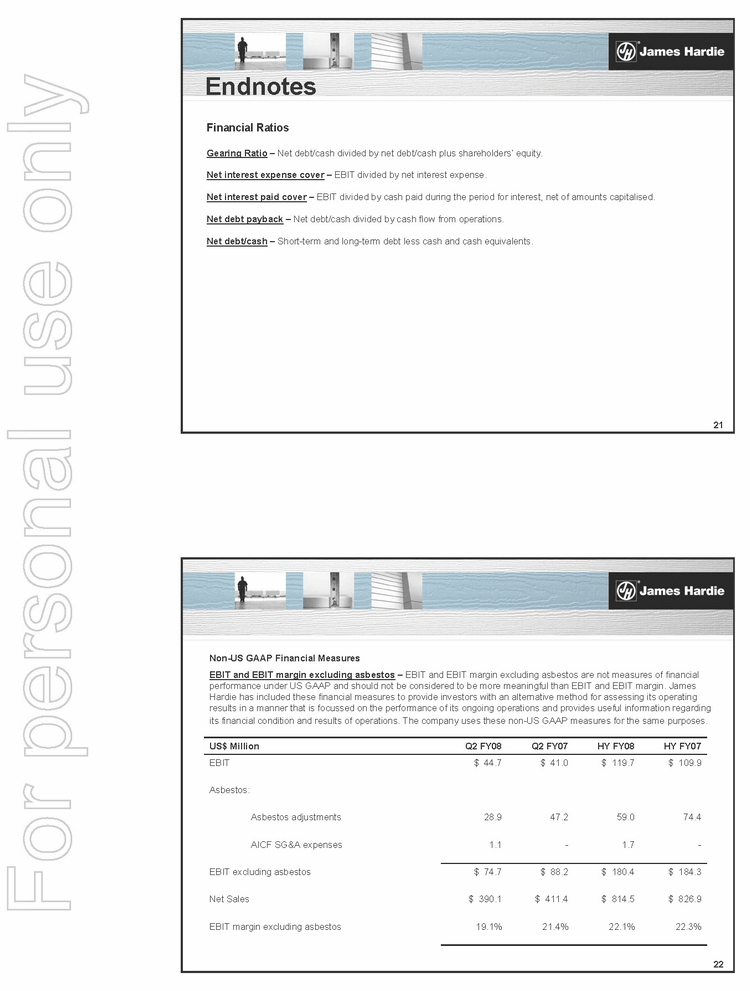
21 Endnotes Financial Ratios Gearing Ratio — Net debt/cash divided by net debt/cash plus shareholders’ equity. Net interest expense cover — EBIT divided by net interest expense. Net interest paid cover — EBIT divided by cash paid during the period for interest, net of amounts capitalised. Net debt payback — Net debt/cash divided by cash flow from operations. Net debt/cash - - Short-term and long-term debt less cash and cash equivalents. 22 Non-US GAAP Financial Measures EBIT and EBIT margin excluding asbestos — EBIT and EBIT margin excluding asbestos are not measures of financial performance under US GAAP and should not be considered to be more meaningful than EBIT and EBIT margin. James Hardie has included these financial measures to provide investors with an alternative method for assessing its operating results in a manner that is focussed on the performance of its ongoing operations and provides useful information regarding its financial condition and results of operations. The company uses these non-US GAAP measures for the same purposes. 19.1% $ 390.1 $ 74.7 1.1 28.9 $ 44.7 Q2 FY08 21.4% $ 411.4 $ 88.2 — 47.2 $ 41.0 Q2 FY07 Asbestos: AICF SG&A expenses 1.7 — EBIT margin excluding asbestos 22.1% 22.3% Net Sales $ 814.5 $ 826.9 EBIT excluding asbestos $ 180.4 $ 184.3 Asbestos adjustments 59.0 74.4 EBIT $ 119.7 $ 109.9 US$ Million HY FY08 HY FY07


(PAGE)
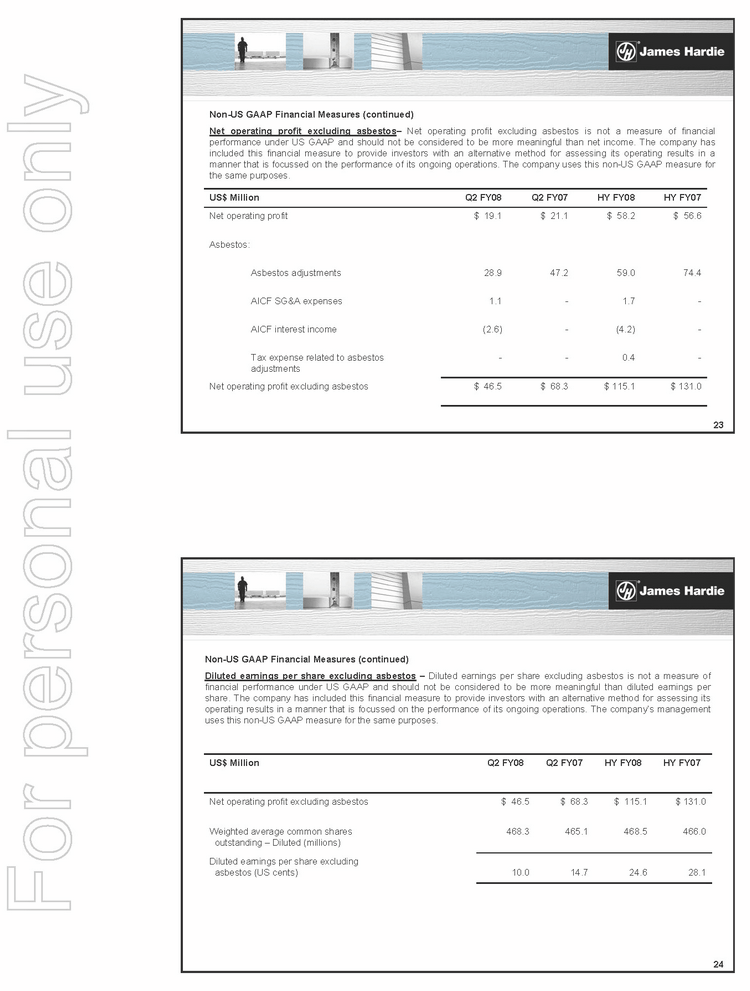
23 Non-US GAAP Financial Measures (continued) Net operating profit excluding asbestos- Net operating profit excluding asbestos is not a measure of financial performance under US GAAP and should not be considered to be more meaningful than net income. The company has included this financial measure to provide investors with an alternative method for assessing its operating results in a manner that is focussed on the performance of its ongoing operations. The company uses this non-US GAAP measure for the same purposes. $ 46.5 — (2.6) 1.1 28.9 $ 19.1 Q2 FY08 $ 68.3 — - — 47.2 $ 21.1 Q2 FY07 Asbestos: AICF interest income (4.2) — AICF SG&A expenses 1.7 - - Net operating profit excluding asbestos $ 115.1 $ 131.0 Tax expense related to asbestos 0.4 — adjustments Asbestos adjustments 59.0 74.4 Net operating profit $ 58.2 $ 56.6 US$ Million HY FY08 HY FY07 24 Non-US GAAP Financial Measures (continued) Diluted earnings per share excluding asbestos — Diluted earnings per share excluding asbestos is not a measure of financial performance under US GAAP and should not be considered to be more meaningful than diluted earnings per share. The company has included this financial measure to provide investors with an alternative method for assessing its operating results in a manner that is focussed on the performance of its ongoing operations. The company’s management uses this non-US GAAP measure for the same purposes. 10.0 468.3 $ 46.5 Q2 FY08 14.7 465.1 $ 68.3 Q2 FY07 24.6 28.1 Diluted earnings per share excluding asbestos (US cents) Weighted average common shares 468.5 466.0 outstanding — Diluted (millions) Net operating profit excluding asbestos $ 115.1 $ 131.0 US$ Million HY FY08 HY FY07


(PAGE)
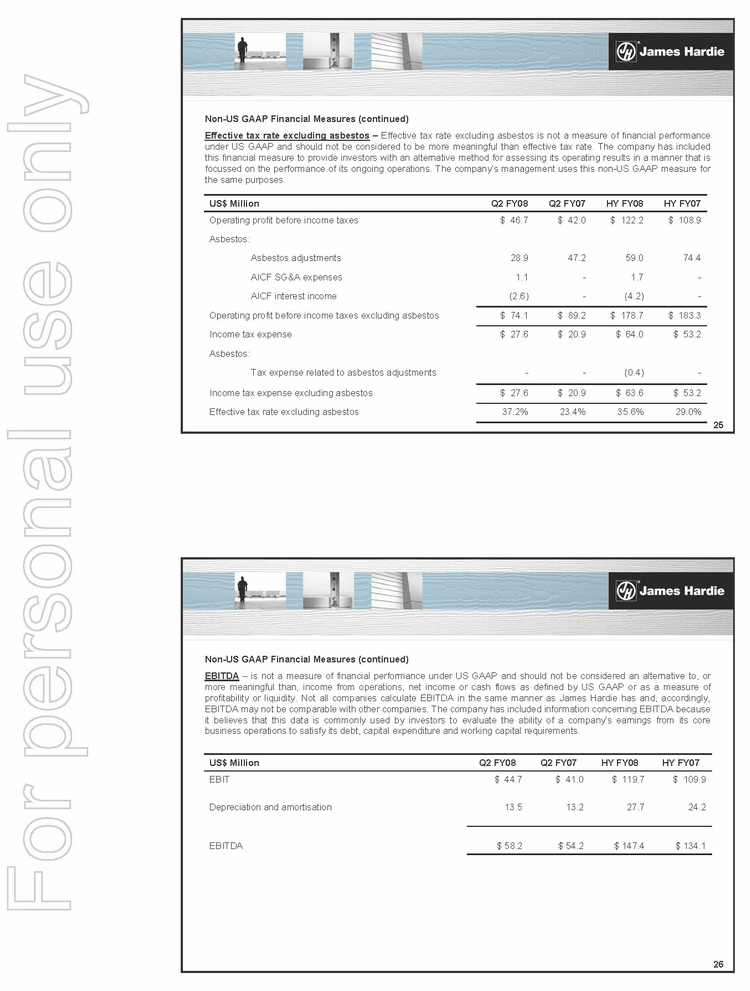
25 Non-US GAAP Financial Measures (continued) Effective tax rate excluding asbestos - Effective tax rate excluding asbestos is not a measure of financial performance under US GAAP and should not be considered to be more meaningful than effective tax rate. The company has included this financial measure to provide investors with an alternative method for assessing its operating results in a manner that is focussed on the performance of its ongoing operations. The company’s management uses this non-US GAAP measure for the same purposes. 37.2% $ 27.6 — $ 27.6 $ 74.1 (2.6) 1.1 28.9 $ 46.7 Q2 FY08 23.4% $ 20.9 — $ 20.9 $ 89.2 — - 47.2 $ 42.0 Q2 FY07 Asbestos: Asbestos: Asbestos adjustments 59.0 74.4 AICF SG&A expenses 1.7 — AICF interest income (4.2) — Effective tax rate excluding asbestos 35.6% 29.0% Income tax expense excluding asbestos $ 63.6 $ 53.2 Tax expense related to asbestos adjustments (0.4) — Income tax expense $ 64.0 $ 53.2 Operating profit before income taxes excluding asbestos $ 178.7 $ 183.3 Operating profit before income taxes $ 122.2 $ 108.9 US$ Million HY FY08 HY FY07 26 Non-US GAAP Financial Measures (continued) EBITDA — is not a measure of financial performance under US GAAP and should not be considered an alternative to, or more meaningful than, income from operations, net income or cash flows as defined by US GAAP or as a measure of profitability or liquidity. Not all companies calculate EBITDA in the same manner as James Hardie has and, accordingly, EBITDA may not be comparable with other companies. The company has included information concerning EBITDA because it believes that this data is commonly used by investors to evaluate the ability of a company’s earnings from its core business operations to satisfy its debt, capital expenditure and working capital requirements. $ 58.2 13.5 $ 44.7 Q2 FY08 $ 54.2 13.2 $ 41.0 Q2 FY07 EBITDA $ 147.4 $ 134.1 Depreciation and amortisation 27.7 24.2 EBIT $ 119.7 $ 109.9 US$ Million HY FY08 HY FY07


(PAGE)
USA Analyst/Investor Tour December 2007 In this Management Presentation, James Hardie may present the financial measures, sales volume terms, financial ratios, and Non-US GAAP financial measures included in the Endnotes section of this document starting on page 37. The company presents financial measures that it believes are customarily used by its Australian investors. Specifically, these financial measures include “EBIT” and “EBIT margin”. The company may also present other terms for measuring its sales volumes (“million square feet (mmsf)”); and Non-US GAAP financial measures (“EBIT and EBIT margin excluding adjustments to asbestos adjustments, SCI and other related expense, and impairment of roofing plant”). Unless otherwise stated, results are for continuing operations only.


(PAGE)
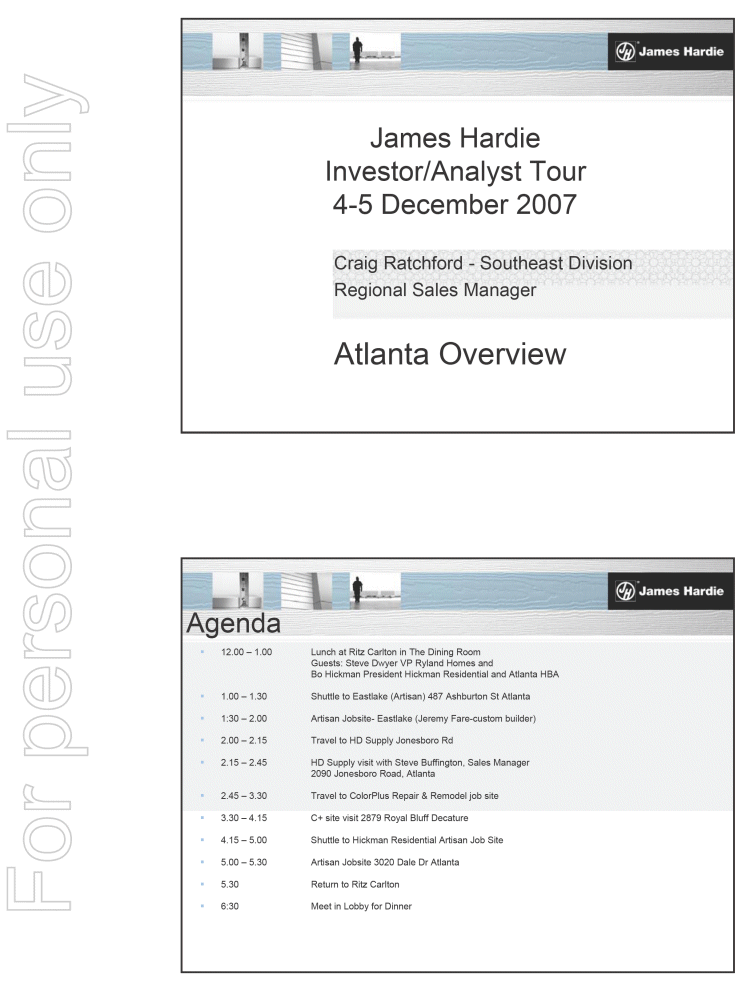
Craig Ratchford — Southeast Division Regional Sales Manager James Hardie Investor/Analyst Tour 4-5 December 2007 Atlanta Overview Agenda .. 12.00 — 1.00 Lunch at Ritz Carlton in The Dining Room Guests: Steve Dwyer VP Ryland Homes and Bo Hickman President Hickman Residential and Atlanta HBA .. 1.00 — 1.30 Shuttle to Eastlake (Artisan) 487 Ashburton St Atlanta .. 1:30 — 2.00 Artisan Jobsite- Eastlake (Jeremy Fare-custom builder) .. 2.00 — 2.15 Travel to HD Supply Jonesboro Rd .. 2.15 — 2.45 HD Supply visit with Steve Buffington, Sales Manager 2090 Jonesboro Road, Atlanta .. 2.45 — 3.30 Travel to ColorPlus Repair & Remodel job site .. 3.30 — 4.15 C+ site visit 2879 Royal Bluff Decature .. 4.15 — 5.00 Shuttle to Hickman Residential Artisan Job Site .. 5.00 — 5.30 Artisan Jobsite 3020 Dale Dr Atlanta .. 5.30 Return to Ritz Carlton .. 6:30 Meet in Lobby for Dinner


(PAGE)
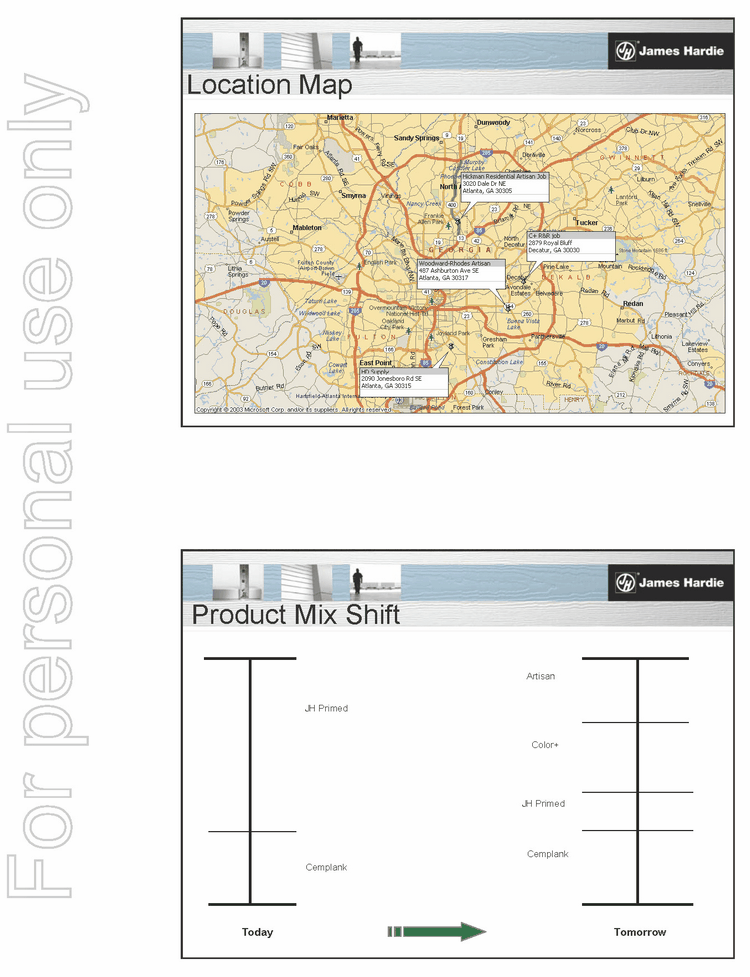
Location Map Product Mix Shift Cemplank JH Primed Artisan Color+ JH Primed Cemplank Today Tomorrow


(PAGE)
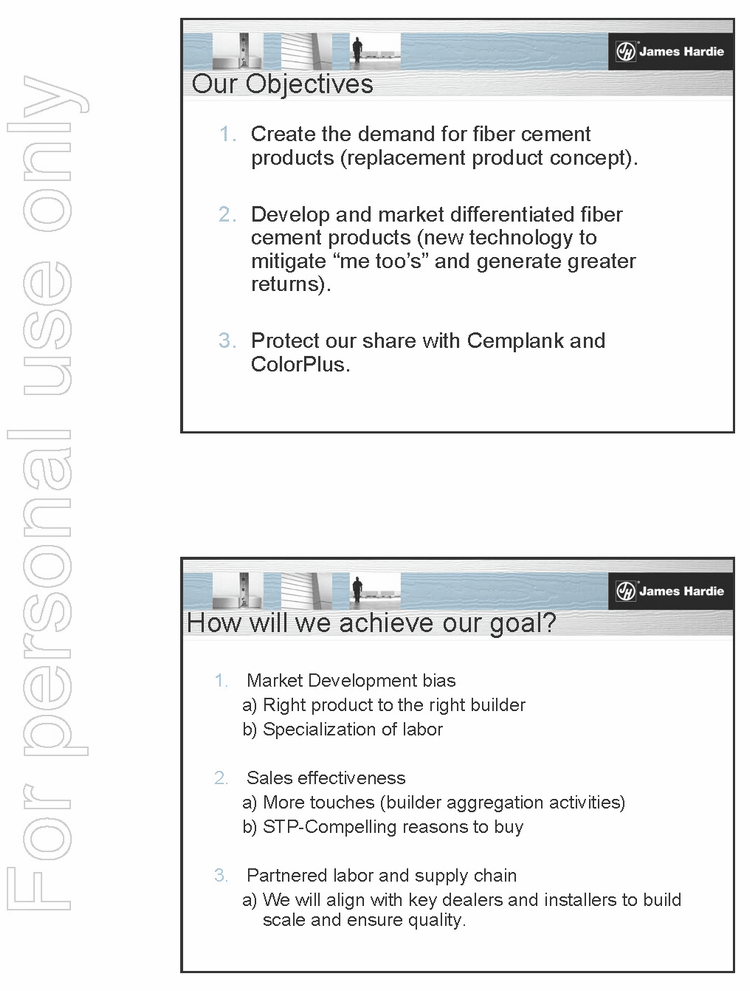
Our Objectives 1. Create the demand for fiber cement products (replacement product concept). 2. Develop and market differentiated fiber cement products (new technology to mitigate “me too’s” and generate greater returns). 3. Protect our share with Cemplank and ColorPlus. How will we achieve our goal? 1. Market Development bias a) Right product to the right builder b) Specialization of labor 2. Sales effectiveness a) More touches (builder aggregation activities) b) STP-Compelling reasons to buy 3. Partnered labor and supply chain a) We will align with key dealers and installers to build scale and ensure quality.


(PAGE)
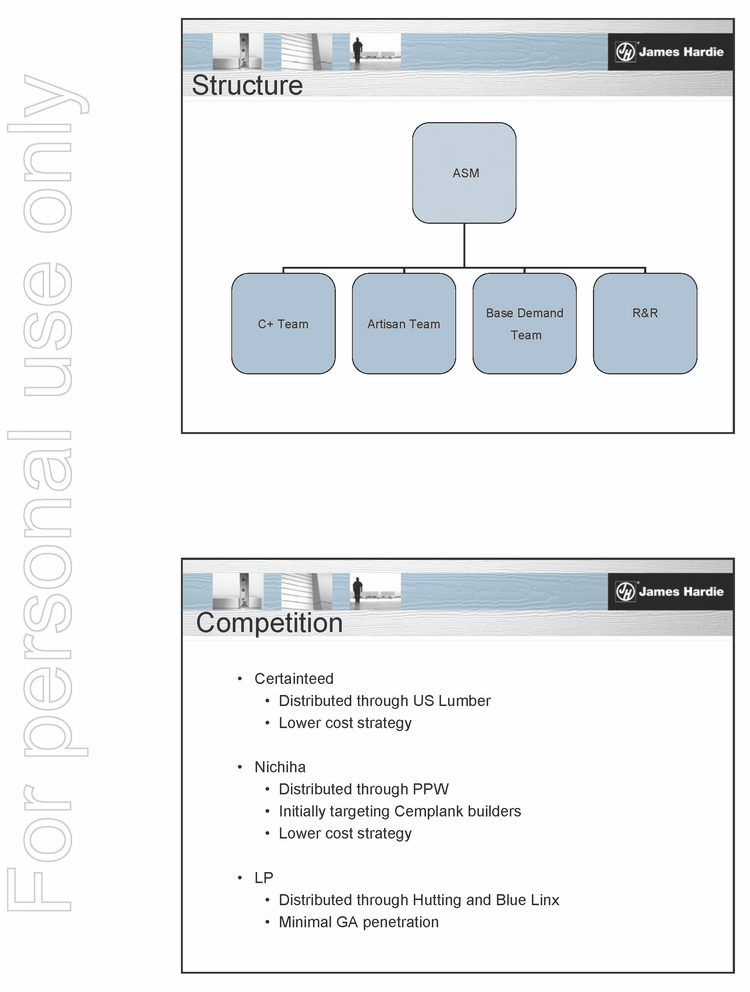
Structure ASM C+ Team Artisan Team Base Demand Team R&R Competition Certainteed Distributed through US Lumber Lower cost strategy Nichiha Distributed through PPW Initially targeting Cemplank builders Lower cost strategy LP Distributed through Hutting and Blue Linx Minimal GA penetration


(PAGE)
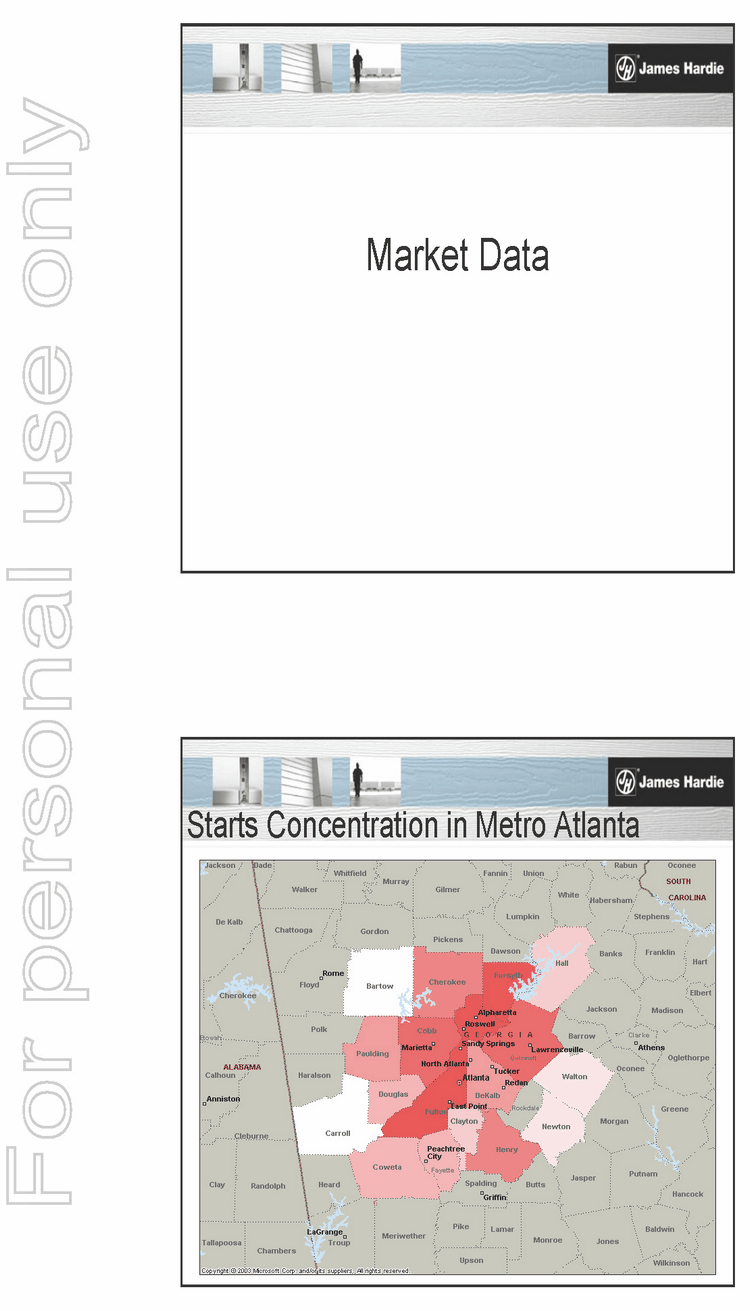
Market Data Starts Concentration in Metro Atlanta


(PAGE)
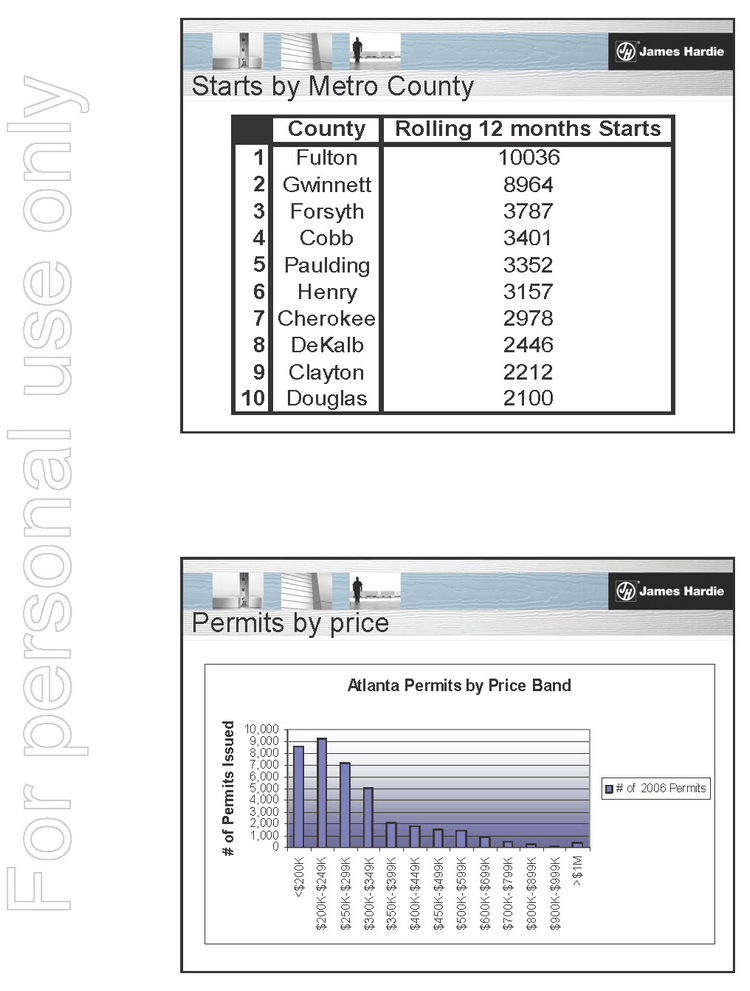
Starts by Metro County County Rolling 12 months Starts 1 Fulton 10036 2 Gwinnett 8964 3 Forsyth 3787 4 Cobb 3401 5 Paulding 3352 6 Henry 3157 7 Cherokee 2978 8 DeKalb 2446 9 Clayton 2212 10 Douglas 2100 Permits by price Atlanta Permits by Price Band 0 1,000 2,000 3,000 4,000 5,000 6,000 7,000 8,000 9,000 10,000 $200K $200K-$249K $250K-$299K $300K-$349K $350K-$399K $400K-$449K $450K-$499K $500K-$599K $600K-$699K $700K-$799K $800K-$899K $900K-$999K $1M # of Permits Issued # of 2006 Permits


(PAGE)
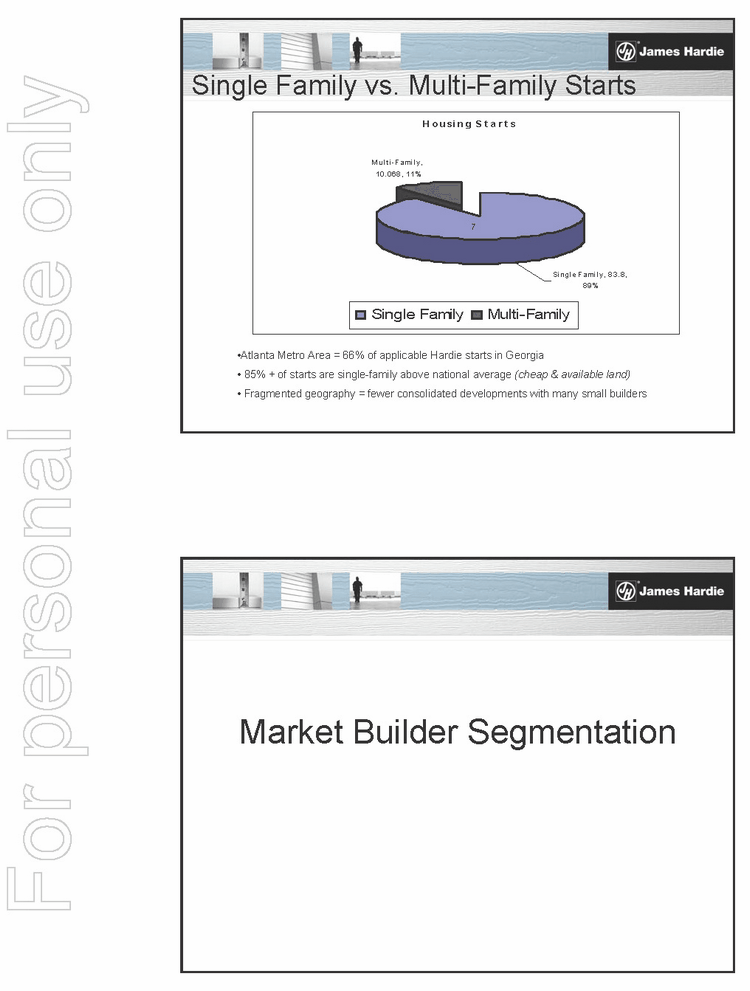
Single Family vs. Multi-Family Starts Housing S t ar t s Mul t i -Fami l y, 10.068, 11% Si ngl e Fami l y, 83. 8, 89% Single Family Multi-Family 7 Atlanta Metro Area = 66% of applicable Hardie starts in Georgia 85% + of starts are single-family above national average (cheap & available land) Fragmented geography = fewer consolidated developments with many small builders Market Builder Segmentation


(PAGE)
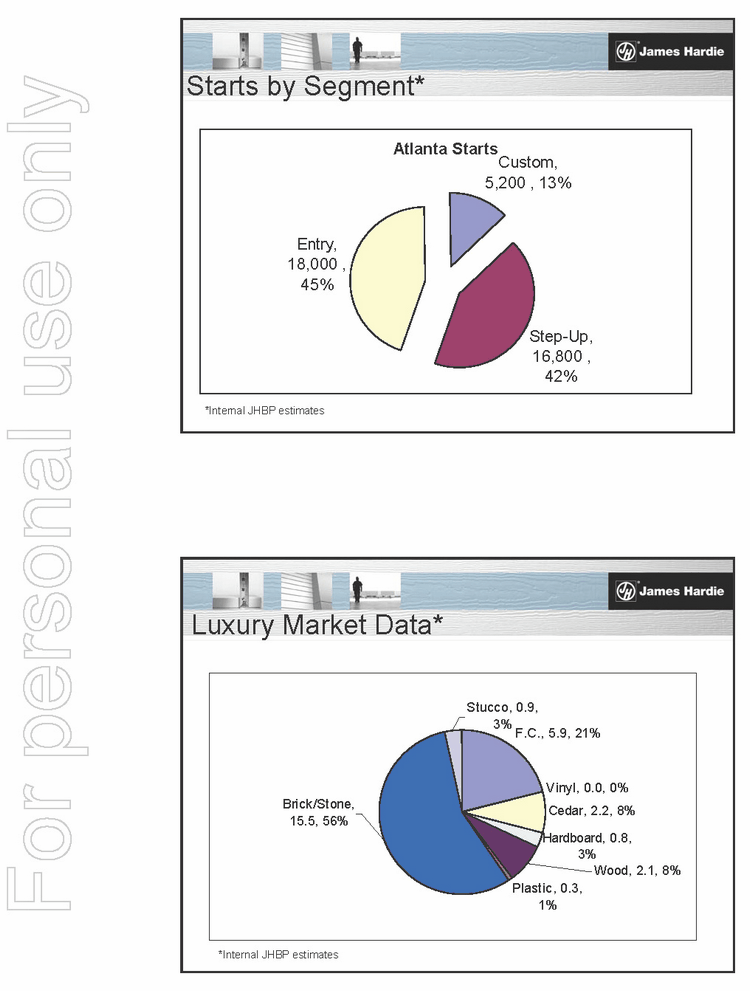
Starts by Segment* Atlanta Starts Custom, 5,200 , 13% Step-Up, 16,800 , 42% Entry, 18,000 , 45% *Internal JHBP estimates Luxury Market Data* F.C., 5.9, 21% Vinyl, 0.0, 0% Cedar, 2.2, 8% Hardboard, 0.8, 3% Plastic, 0.3, 1% Stucco, 0.9, 3% Brick/Stone, 15.5, 56% Wood, 2.1, 8% *Internal JHBP estimates


(PAGE)
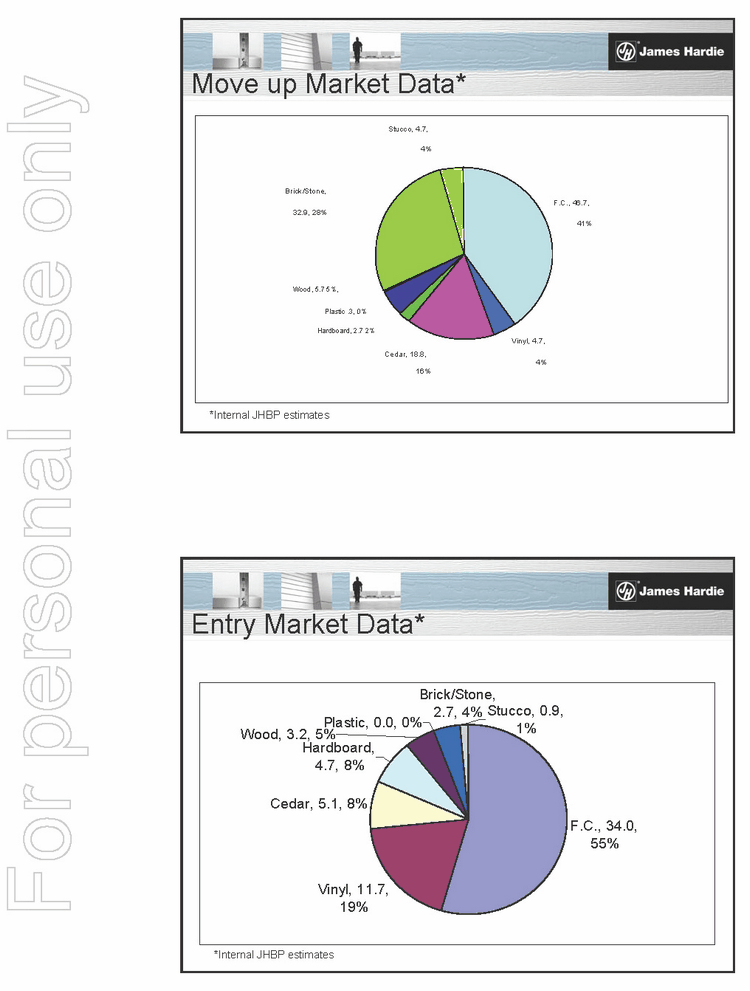
Move up Market Data* F.C., 46.7, 41% Vinyl, 4.7, 4% Cedar, 18.8, 16% Hardboard, 2.7 2% Wood, 5.7 5%, Plastic .3, 0% Brick/Stone, 32.9, 28% Stucco, 4.7, 4% *Internal JHBP estimates F.C., 34.0, 55% Vinyl, 11.7, 19% Cedar, 5.1, 8% Hardboard, 4.7, 8% Plastic, 0.0, 0% Wood, 3.2, 5% Brick/Stone, 2.7, 4% Stucco, 0.9, 1% Entry Market Data* *Internal JHBP estimates


(PAGE)
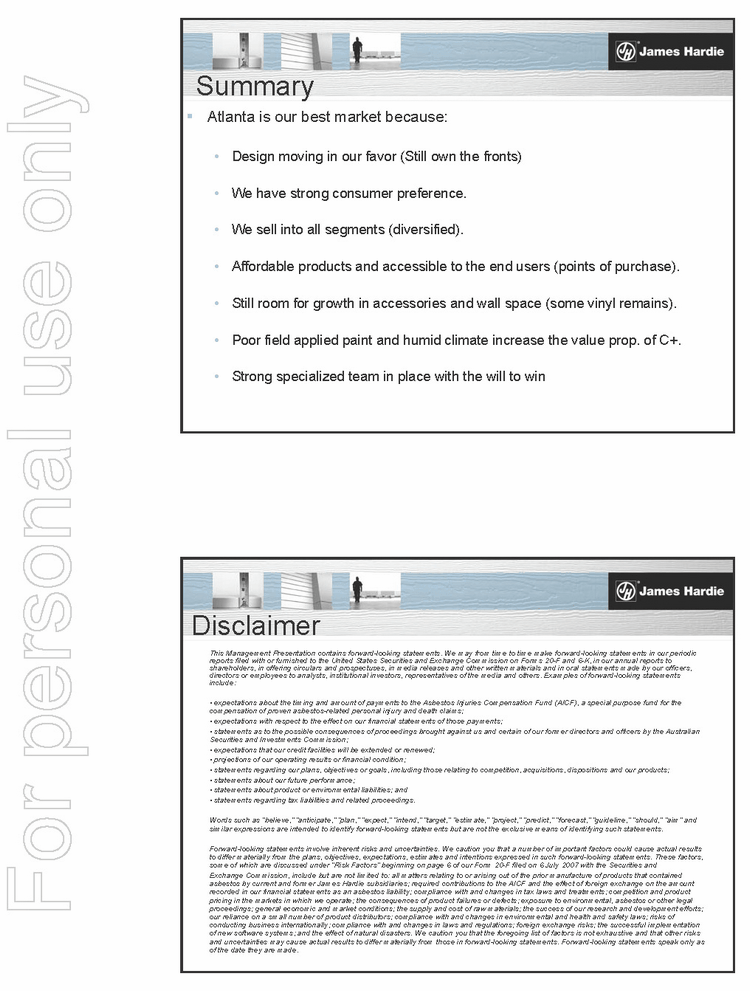
Summary .. Atlanta is our best market because: Design moving in our favor (Still own the fronts) We have strong consumer preference. We sell into all segments (diversified). Affordable products and accessible to the end users (points of purchase). Still room for growth in accessories and wall space (some vinyl remains). Poor field applied paint and humid climate increase the value prop. of C+. Strong specialized team in place with the will to win Disclaimer This Management Presentation contains forward-looking statements. We may from time to time make forward-looking statements in our periodic reports filed with or furnished to the United States Securities and Exchange Commission on Forms 20-F and 6-K, in our annual reports to shareholders, in offering circulars and prospectuses, in media releases and other written materials and in oral statements made by our officers, directors or employees to analysts, institutional investors, representatives of the media and others. Examples of forward-looking statements include: expectations about the timing and amount of payments to the Asbestos Injuries Compensation Fund (AICF), a special purpose fund for the compensation of proven asbestos-related personal injury and death claims; expectations with respect to the effect on our financial statements of those payments; statements as to the possible consequences of proceedings brought against us and certain of our former directors and officers by the Australian Securities and Investments Commission; expectations that our credit facilities will be extended or renewed; projections of our operating results or financial condition; statements regarding our plans, objectives or goals, including those relating to competition, acquisitions, dispositions and our products; statements about our future performance; statements about product or environmental liabilities; and statements regarding tax liabilities and related proceedings. Words such as “believe,” “anticipate,” “plan,” “expect,” “intend,” “target,” “estimate,” “project,” “predict,” “forecast,” “guideline,” “should,” “aim” and similar expressions are intended to identify forward-looking statements but are not the exclusive means of identifying such statements. Forward-looking statements involve inherent risks and uncertainties. We caution you that a number of important factors could cause actual results to differ materially from the plans, objectives, expectations, estimates and intentions expressed in such forward-looking statements. These factors, some of which are discussed under “Risk Factors” beginning on page 6 of our Form 20-F filed on 6 July 2007 with the Securities and Exchange Commission, include but are not limited to: all matters relating to or arising out of the prior manufacture of products that contained asbestos by current and former James Hardie subsidiaries; required contributions to the AICF and the effect of foreign exchange on the amount recorded in our financial statements as an asbestos liability; compliance with and changes in tax laws and treatments; competition and product pricing in the markets in which we operate; the consequences of product failures or defects; exposure to environmental, asbestos or other legal proceedings; general economic and market conditions; the supply and cost of raw materials; the success of our research and development efforts; our reliance on a small number of product distributors; compliance with and changes in environmental and health and safety laws; risks of conducting business internationally; compliance with and changes in laws and regulations; foreign exchange risks; the successful implementation of new software systems; and the effect of natural disasters. We caution you that the foregoing list of factors is not exhaustive and t hat other risks and uncertainties may cause actual results to differ materially from those in forward-looking statements. Forward-looking statements speak only as of the date they are made.


(PAGE)
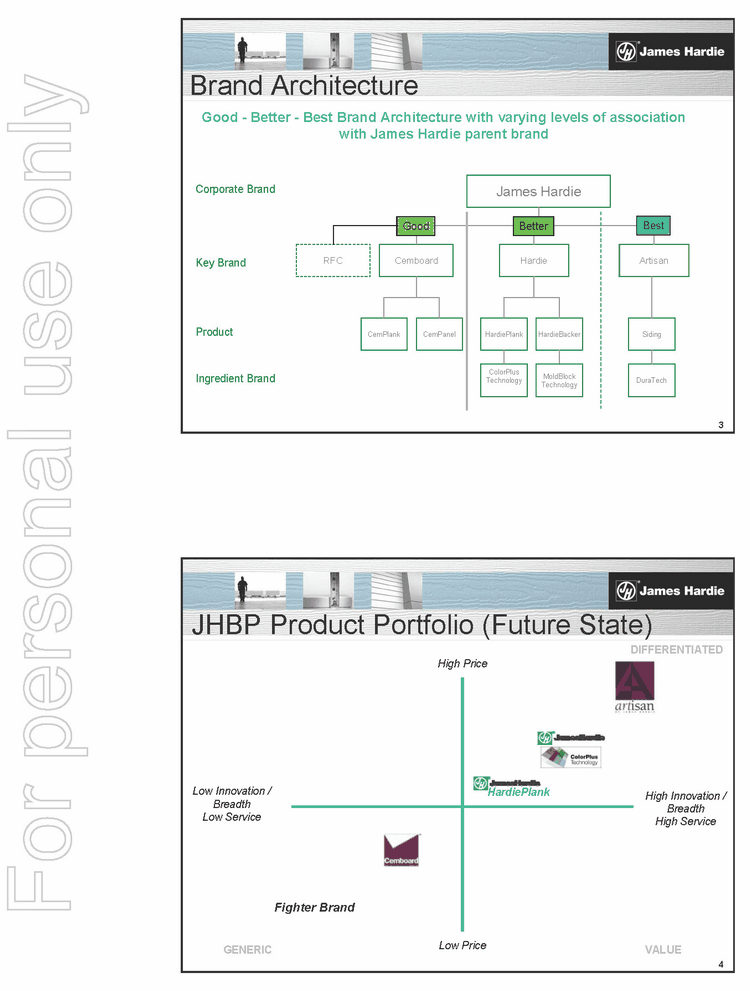
Jamie Chilcoff VP/GM International Business James Hardie Investor/Analyst Tour 4-5 December 2007 Product and Marketing Strategy 2 HardiePlank Colorplus Cemplank Next Gen Fighting Brand Cemplank Hardieplank/ ColorPlus Today Tomorrow .. Product mix will evolve significantly in the medium term to continue to drive revenue and leverage market position. Portfolio Strategy: Product Mix Shift


(PAGE)
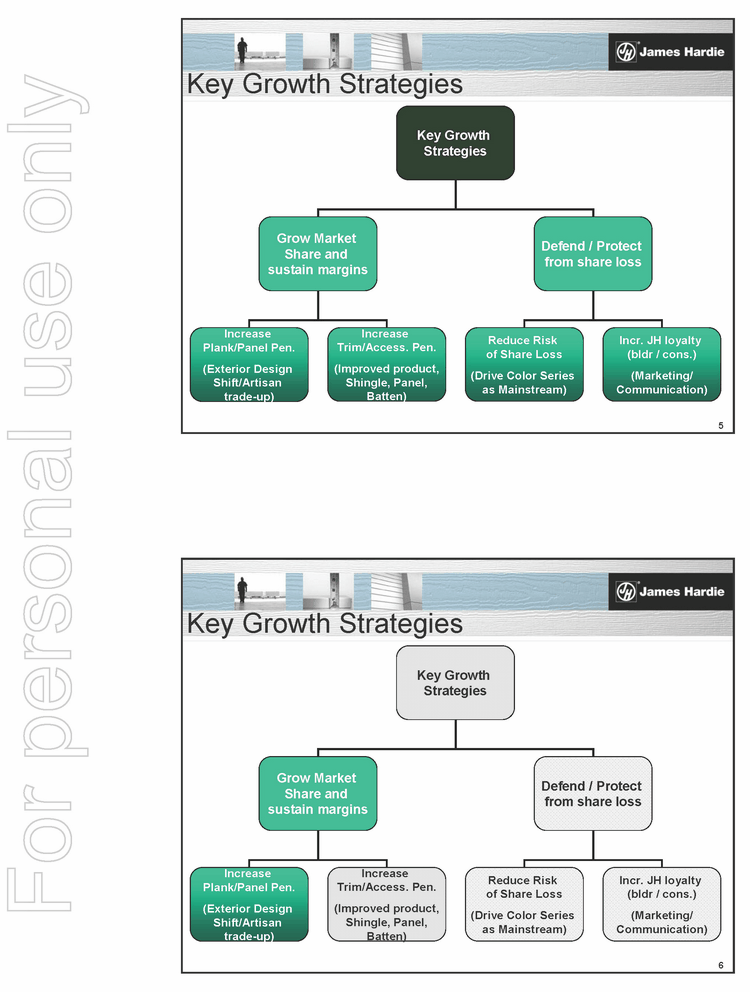
3 Brand Architecture James Hardie Cemboard CemPlank Hardie Artisan CemPanel HardiePlank HardieBacker Siding ColorPlus Technology MoldBlock Technology DuraTech Corporate Brand Key Brand Product Ingredient Brand Good — Better — Best Brand Architecture with varying levels of association with James Hardie parent brand Good Better Best RFC 4 JHBP Product Portfolio (Future State) Low Innovation / Breadth Low Service High Innovation / Breadth High Service High Price Low Price DIFFERENTIATED GENERIC VALUE Fighter Brand HardiePlank


(PAGE)
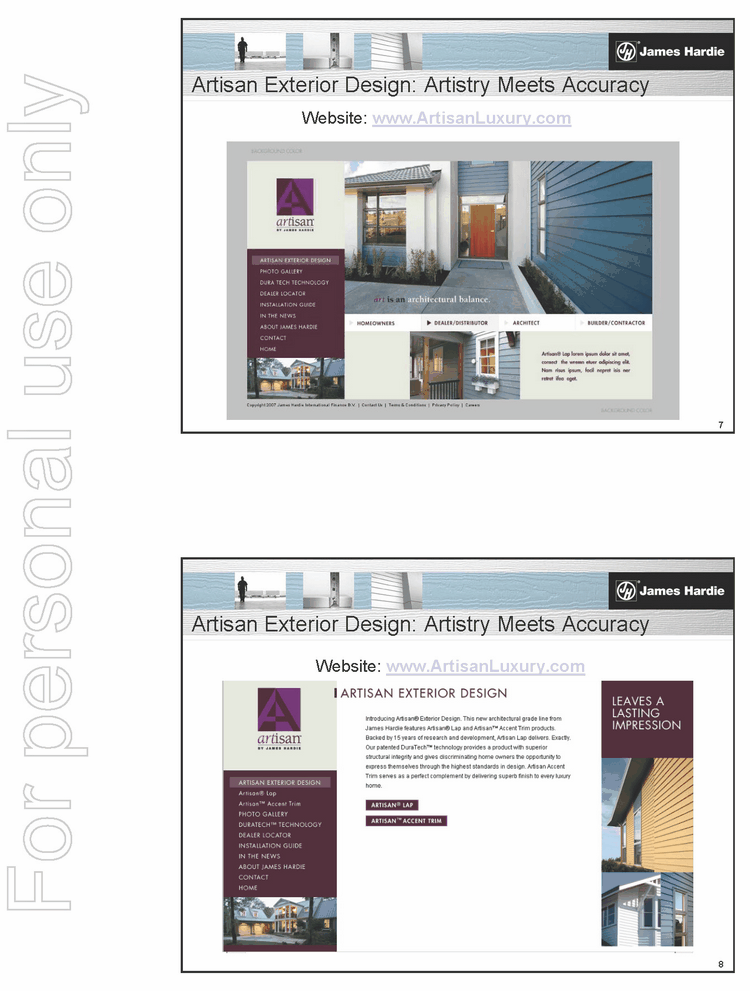
5 Key Growth Strategies Key Growth Strategies Grow Market Share and sustain margins Defend / Protect from share loss Increase Plank/Panel Pen. (Exterior Design Shift/Artisan trade-up) Increase Trim/Access. Pen. (Improved product, Shingle, Panel, Batten) Reduce Risk of Share Loss (Drive Color Series as Mainstream) Incr. JH loyalty (bldr / cons.) (Marketing/ Communication) 6 Key Growth Strategies Grow Market Share and sustain margins Defend / Protect from share loss Increase Plank/Panel Pen. (Exterior Design Shift/Artisan trade-up) Increase Trim/Access. Pen. (Improved product, Shingle, Panel, Batten) Reduce Risk of Share Loss (Drive Color Series as Mainstream) Incr. JH loyalty (bldr / cons.) (Marketing/ Communication) Key Growth Strategies


(PAGE)
7 Website: www.ArtisanLuxury.com Artisan Exterior Design: Artistry Meets Accuracy 8 Website: www.ArtisanLuxury.com Artisan Exterior Design: Artistry Meets Accuracy


(PAGE)
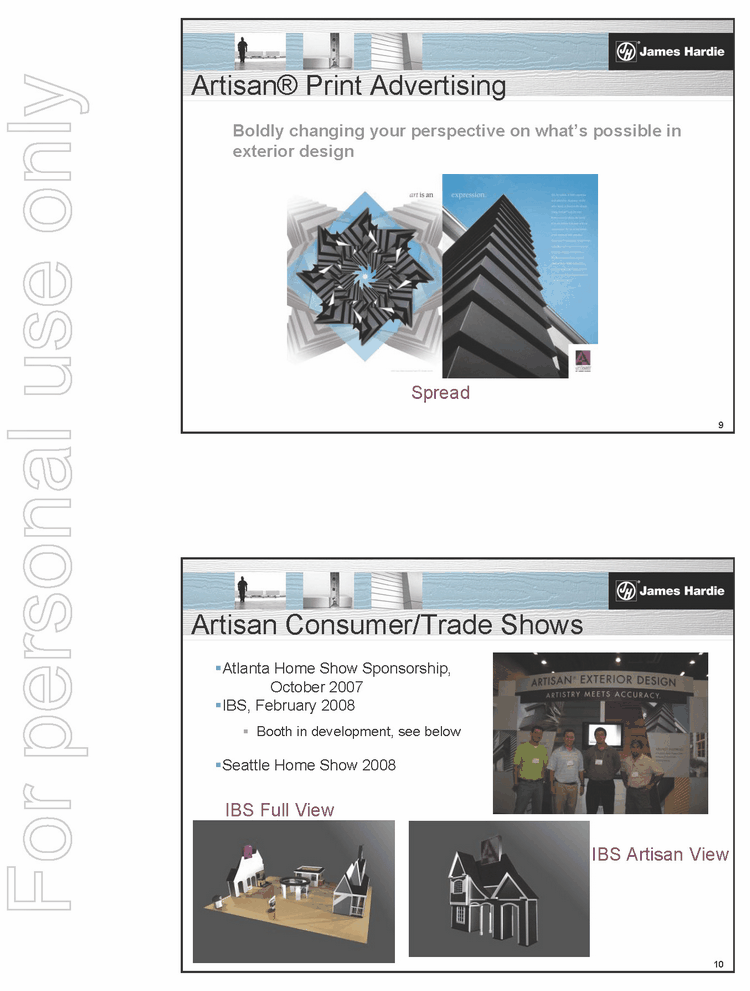
9 Artisan® Print Advertising Spread Boldly changing your perspective on what’s possible in exterior design 10 Artisan Consumer/Trade Shows ..Atlanta Home Show Sponsorship, October 2007         ..IBS, February 2008 .. Booth in development, see below ..Seattle Home Show 2008 IBS Full View IBS Artisan View


(PAGE)
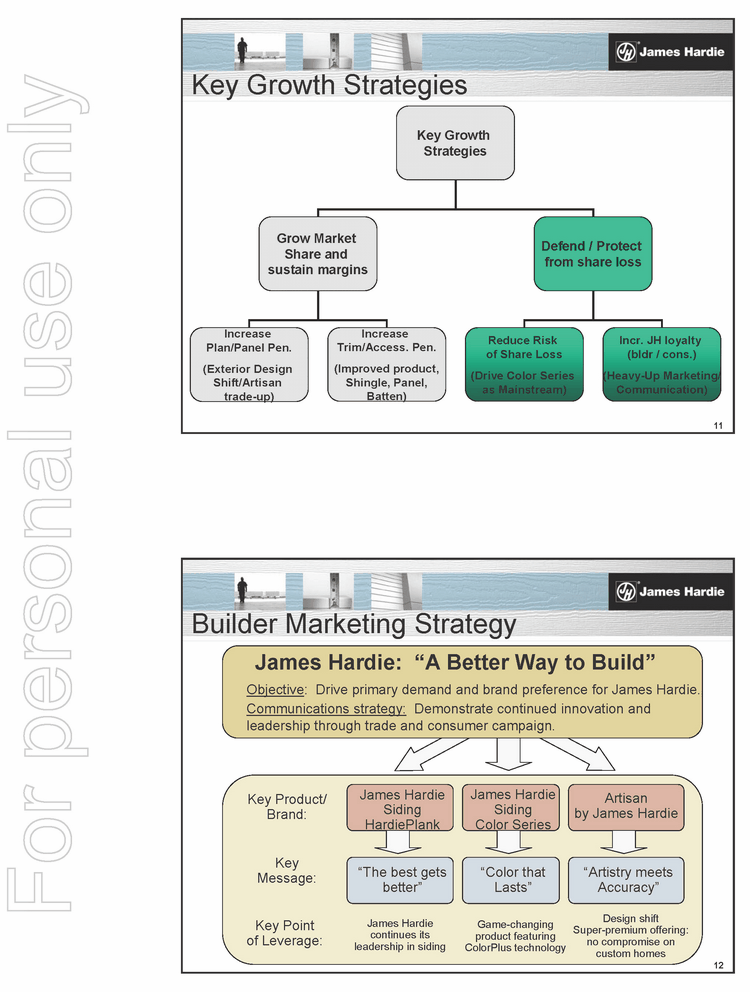
11 Key Growth Strategies Key Growth Strategies Grow Market Share and sustain margins Defend / Protect from share loss Increase Plan/Panel Pen. (Exterior Design Shift/Artisan trade-up) Increase Trim/Access. Pen. (Improved product, Shingle, Panel, Batten) Reduce Risk of Share Loss (Drive Color Series as Mainstream) Incr. JH loyalty (bldr / cons.) (Heavy-Up Marketing/ Communication) 12 James Hardie: “A Better Way to Build” Builder Marketing Strategy James Hardie Siding HardiePlank “The best gets better” James Hardie Siding Color Series “Color that Lasts” Artisan by James Hardie “Artistry meets Accuracy” Key Product/ Brand: Key Message: Key Point of Leverage: James Hardie continues its leadership in siding Game-changing product featuring ColorPlus technology Design shift Super-premium offering: no compromise on custom homes Objective: Drive primary demand and brand preference for James Hardie. Communications strategy: Demonstrate continued innovation and leadership through trade and consumer campaign.


(PAGE)
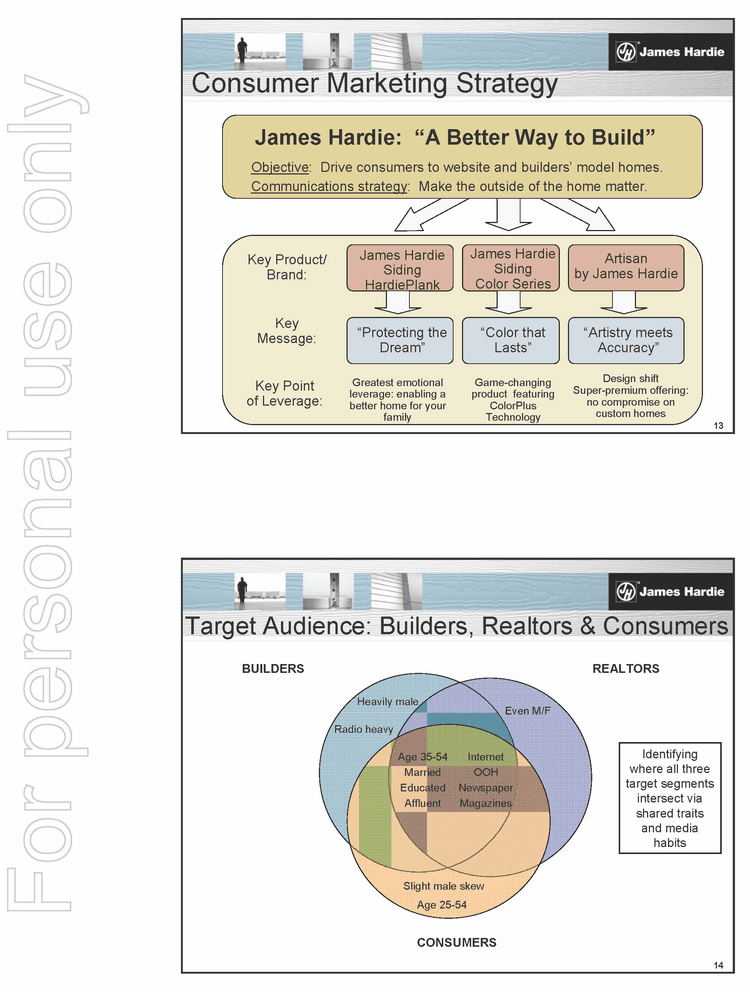
13 James Hardie: “A Better Way to Build” Objective: Drive consumers to website and builders’ model homes. Communications strategy: Make the outside of the home matter. Consumer Marketing Strategy “Protecting the Dream” James Hardie Siding Color Series “Color that Lasts” Artisan by James Hardie “Artistry meets Accuracy” Key Product/ Brand: Key Message: Key Point of Leverage: Greatest emotional leverage: enabling a better home for your family Game-changing product featuring ColorPlus Technology James Hardie Siding HardiePlank Design shift Super-premium offering: no compromise on custom homes 14 BUILDERS Married Age 35-54 Affluent REALTORS CONSUMERS Educated Heavily male Even M/F Slight male skew Internet OOH Newspaper Radio heavy Magazines Identifying where all three target segments intersect via shared traits and media habits Age 25-54 Target Audience: Builders, Realtors & Consumers


(PAGE)
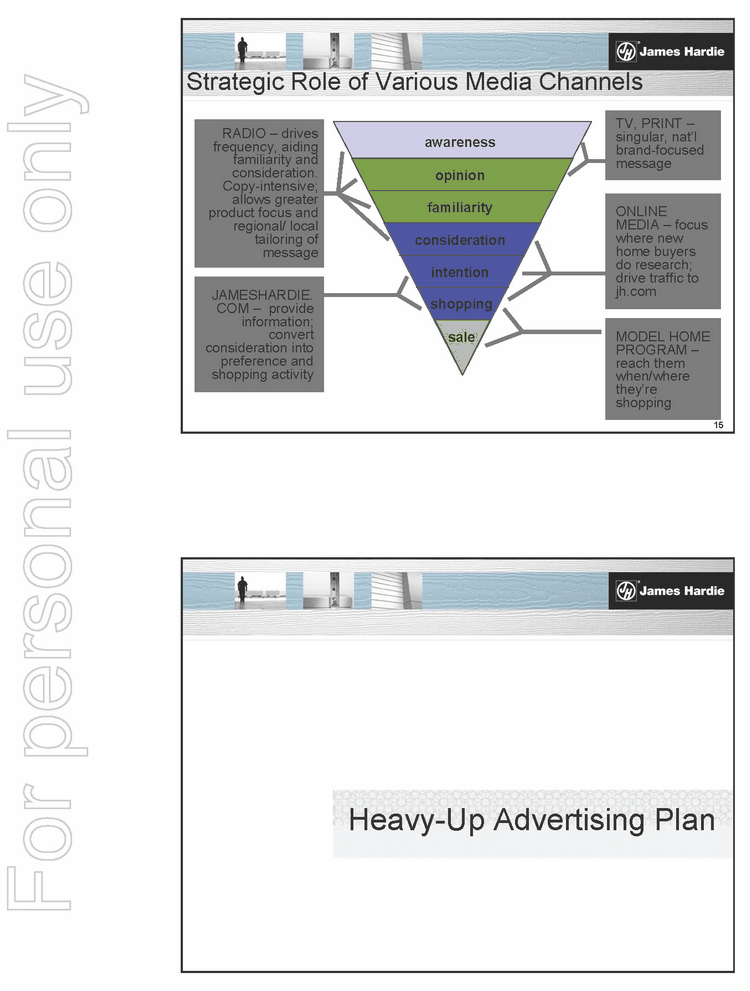
15 awareness intention consideration shopping opinion familiarity RADIO — drives frequency, aiding familiarity and consideration. Copy-intensive; allows greater product focus and regional/ local tailoring of message ONLINE MEDIA — focus where new home buyers do research; drive traffic to jh.com sale TV, PRINT — singular, nat’l brand-focused message Strategic Role of Various Media Channels MODEL HOME PROGRAM — reach them when/where they’re shopping JAMESHARDIE. COM — provide information; convert consideration into preference and shopping activity Heavy-Up Advertising Plan


(PAGE)
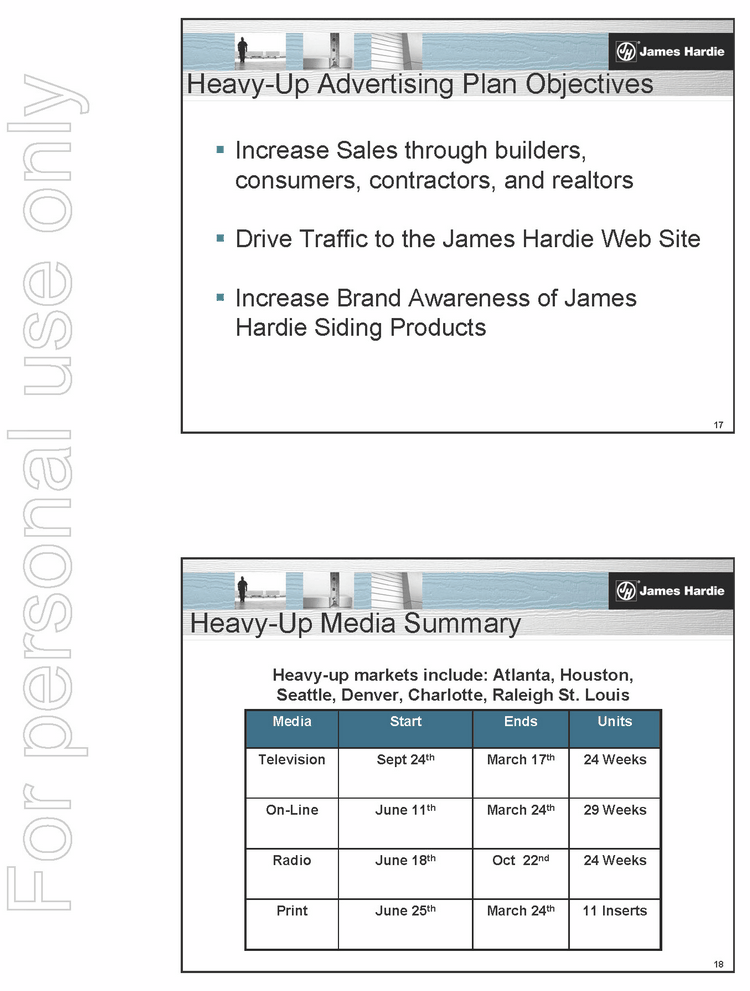
17 Heavy-Up Advertising Plan Objectives .. Increase Sales through builders, consumers, contractors, and realtors .. Drive Traffic to the James Hardie Web Site .. Increase Brand Awareness of James Hardie Siding Products 18 Heavy-Up Media Summary On-Line June 11th March 24th 29 Weeks Print June 25th March 24th 11 Inserts Radio June 18th Oct 22nd 24 Weeks Television Sept 24th March 17th 24 Weeks Media Start Ends Units Heavy-up markets include: Atlanta, Houston, Seattle, Denver, Charlotte, Raleigh St. Louis


(PAGE)
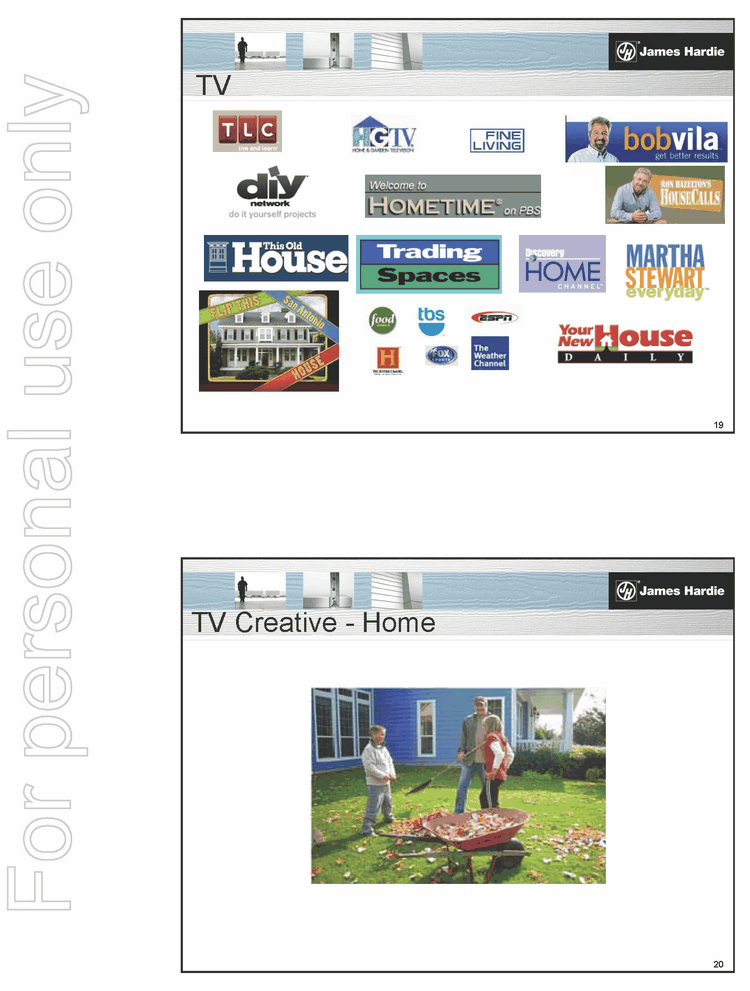
19 TV 20 TV Creative — Home


(PAGE)
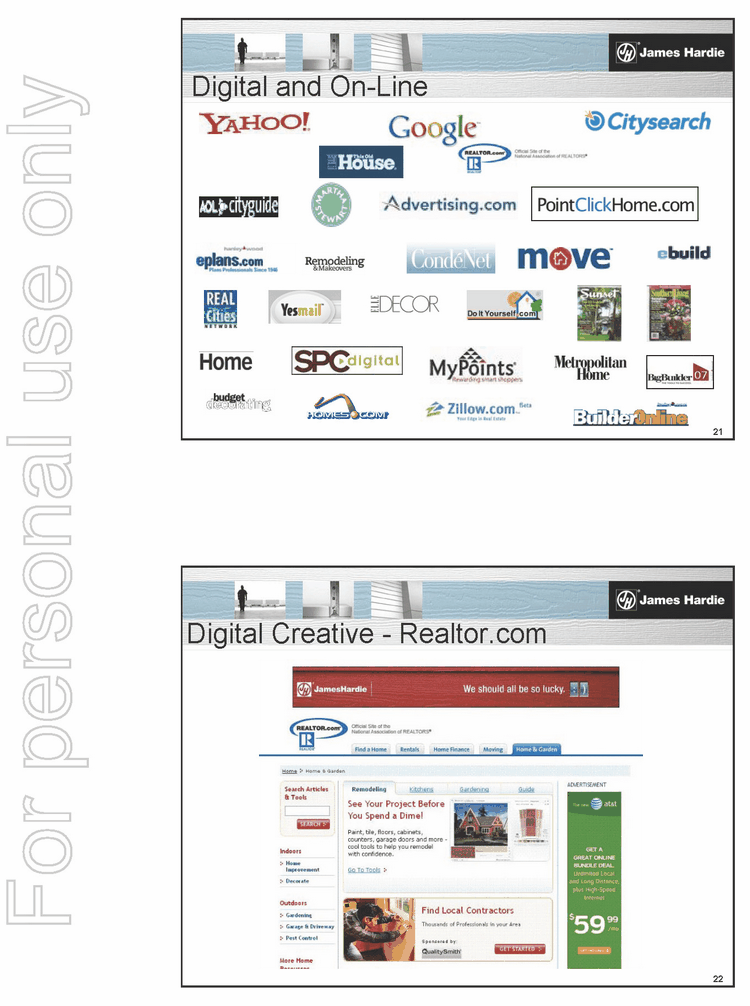
21 Digital and On-Line 22 Digital Creative — Realtor.com


(PAGE)
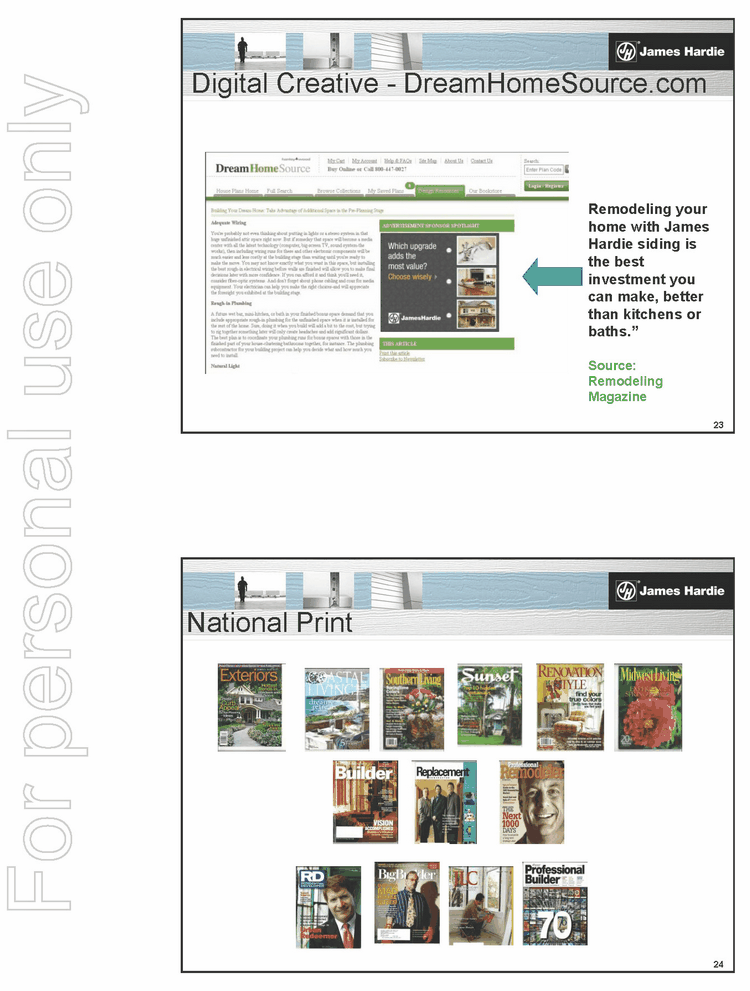
23 Digital Creative — DreamHomeSource.com Remodeling your home with James Hardie siding is the best investment you can make, better than kitchens or baths.” Source: Remodeling Magazine 24 National Print


(PAGE)
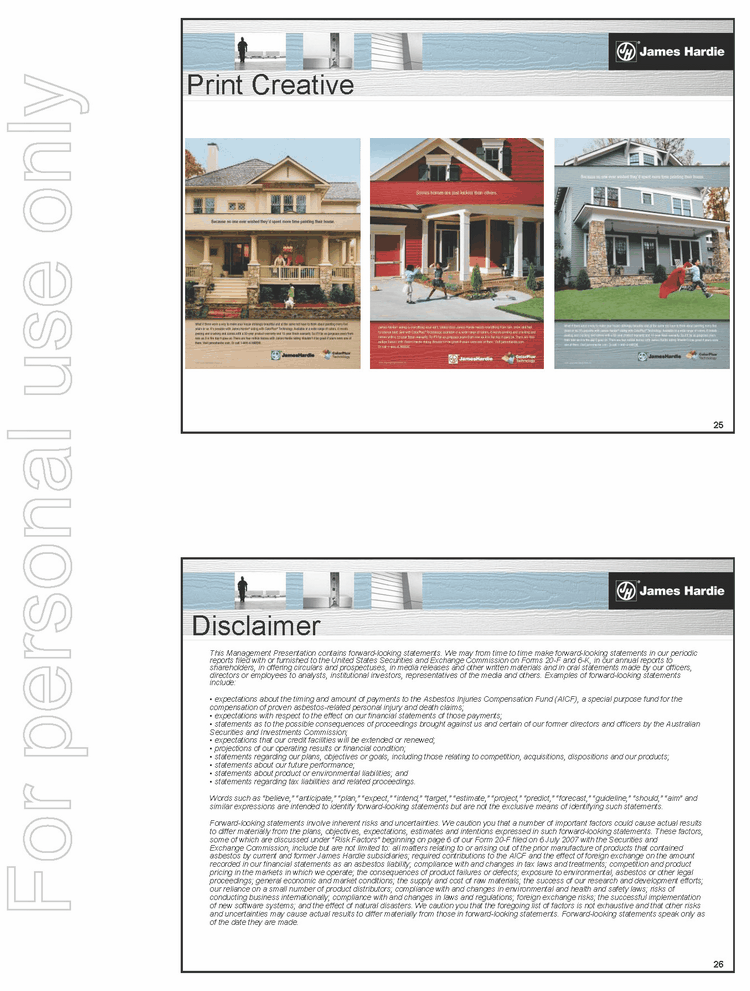
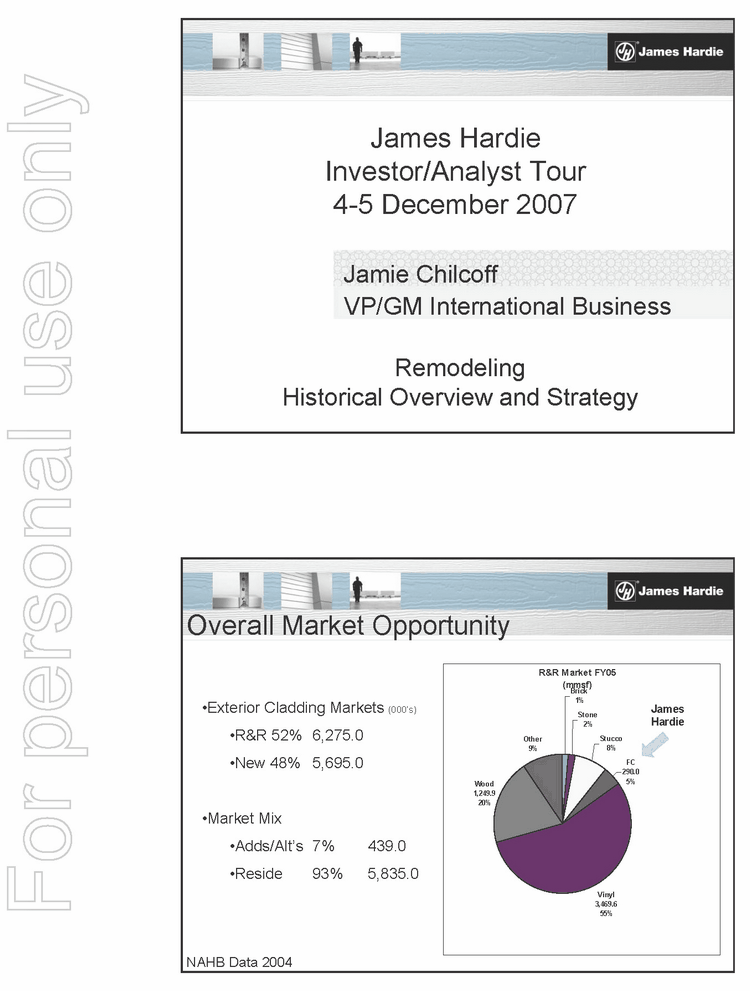
25 Print Creative .. 26 Disclaimer This Management Presentation contains forward-looking statements. We may from time to time make forward-looking statements in our periodic reports filed with or furnished to the United States Securities and Exchange Commission on Forms 20-F and 6-K, in our annual reports to shareholders, in offering circulars and prospectuses, in media releases and other written materials and in oral statements made by our officers, directors or employees to analysts, institutional investors, representatives of the media and others. Examples of forward-looking statements include: expectations about the timing and amount of payments to the Asbestos Injuries Compensation Fund (AICF), a special purpose fund for the compensation of proven asbestos-related personal injury and death claims; expectations with respect to the effect on our financial statements of those payments; statements as to the possible consequences of proceedings brought against us and certain of our former directors and officers by the Australian Securities and Investments Commission; expectations that our credit facilities will be extended or renewed; projections of our operating results or financial condition; statements regarding our plans, objectives or goals, including those relating to competition, acquisitions, dispositions and our products; statements about our future performance; statements about product or environmental liabilities; and statements regarding tax liabilities and related proceedings. Words such as “believe,” “anticipate,” “plan,” “expect,” “intend,” “target,” “estimate,” “project,” “predict,” “forecast,” “guideline,” “should,” “aim” and similar expressions are intended to identify forward-looking statements but are not the exclusive means of identifying such statements. Forward-looking statements involve inherent risks and uncertainties. We caution you that a number of important factors could cause actual results to differ materially from the plans, objectives, expectations, estimates and intentions expressed in such forward-looking statements. These factors, some of which are discussed under “Risk Factors” beginning on page 6 of our Form 20-F filed on 6 July 2007 with the Securities and Exchange Commission, include but are not limited to: all matters relating to or arising out of the prior manufacture of products that contained asbestos by current and former James Hardie subsidiaries; required contributions to the AICF and the effect of foreign exchange on the amount recorded in our financial statements as an asbestos liability; compliance with and changes in tax laws and treatments; competition and product pricing in the markets in which we operate; the consequences of product failures or defects; exposure to environmental, asbestos or other legal proceedings; general economic and market conditions; the supply and cost of raw materials; the success of our research and development efforts; our reliance on a small number of product distributors; compliance with and changes in environmental and health and safety laws; risks of conducting business internationally; compliance with and changes in laws and regulations; foreign exchange risks; the successful implementation of new software systems; and the effect of natural disasters. We caution you that the foregoing list of factors is not exhaustive and that other risks and uncertainties may cause actual results to differ materially from those in forward-looking statements. Forward-looking statements speak only as of the date they are made.


(PAGE)
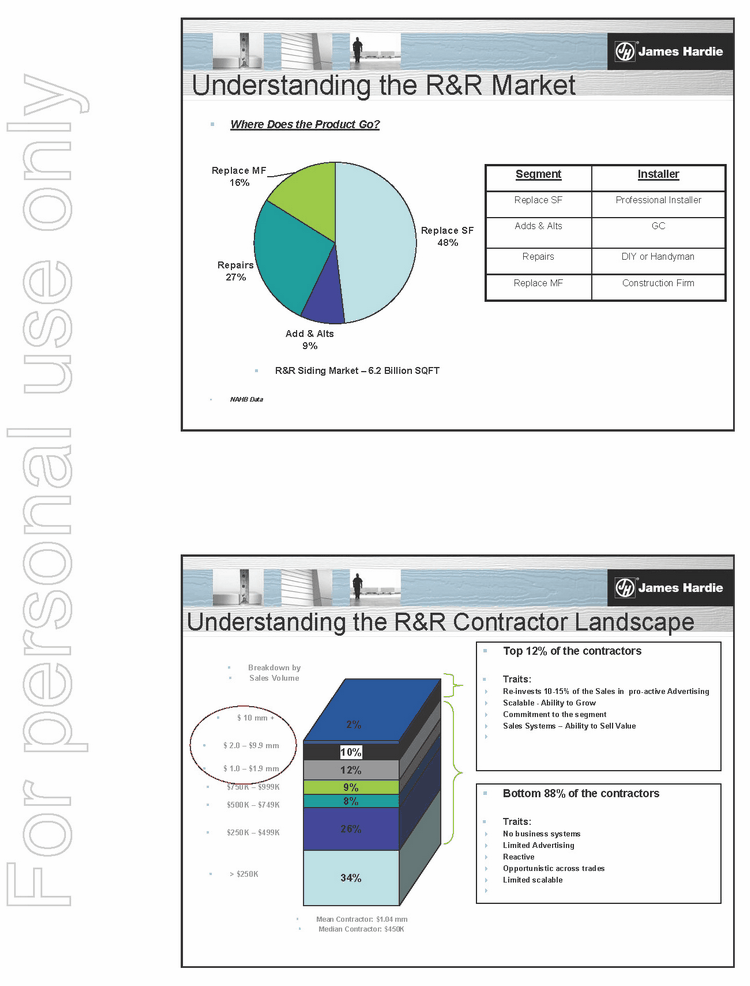
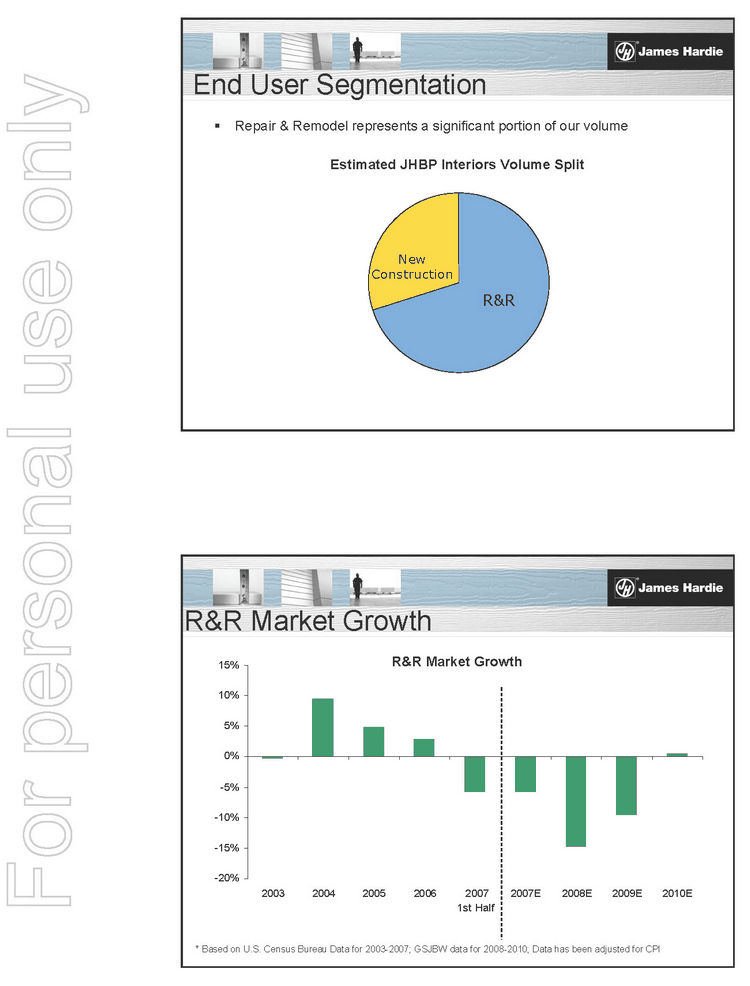
Jamie Chilcoff VP/GM International Business James Hardie Investor/Analyst Tour 4-5 December 2007 Remodeling Historical Overview and Strategy Overall Market Opportunity NAHB Data 2004 R&R Market FY05 (mmsf) FC 290.0 5% Vinyl 3,469.6 55% Wood 1,249.9 20% Stucco 8% Stone 2% Brick 1% Other 9% James Hardie Exterior Cladding Markets (000’s) R&R 52% 6,275.0 New 48% 5,695.0 Market Mix Adds/Alt’s 7% 439.0 Reside 93% 5,835.0


(PAGE)
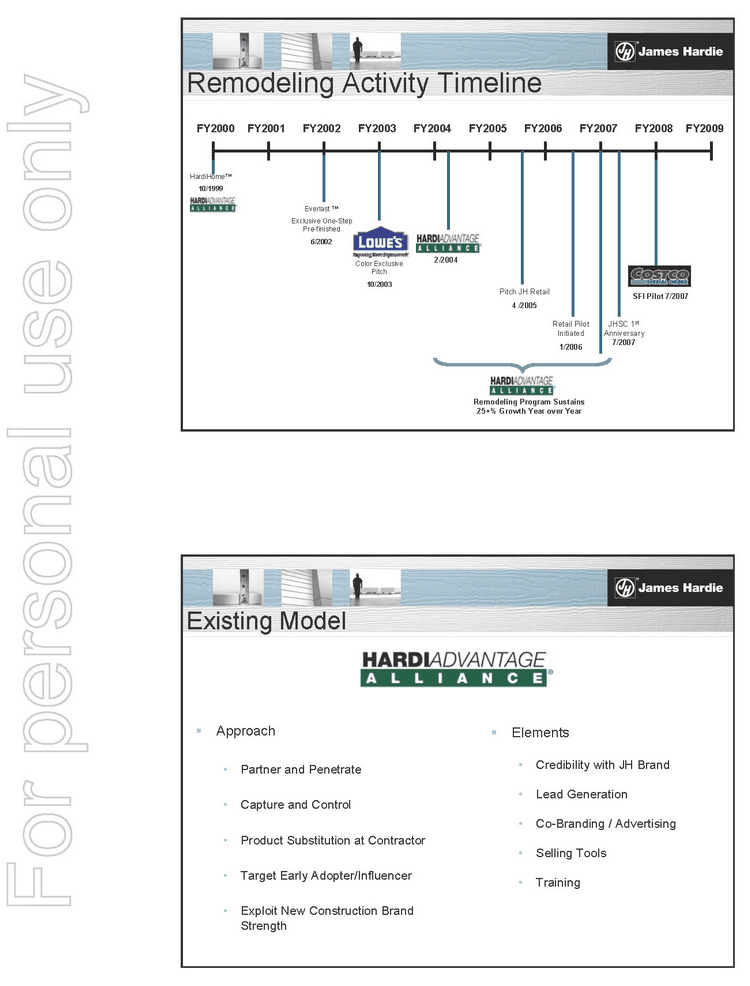
Understanding the R&R Market .. R&R Siding Market — 6.2 Billion SQFT Replace SF 48% Add & Alts 9% Repairs 27% Replace MF 16% .. NAHB Data .. Where Does the Product Go? Replace MF Construction Firm Repairs DIY or Handyman Adds & Alts GC Replace SF Professional Installer Segment Installer Understanding the R&R Contractor Landscape 34% 26% 8% 9% 12% 10% 2% .. $ 10 mm + .. $ 2.0 — $9.9 mm .. $ 1.0 — $1.9 mm .. $750K — $999K .. $500K — $749K .. $250K - $499K .. $250K .. Breakdown by .. Sales Volume .. Top 12% of the contractors .. Traits:         .. Re-invests 10-15% of the Sales in pro-active Advertising .. Scalable — Ability to Grow .. Commitment to the segment .. Sales Systems — Ability to Sell Value .. .. Mean Contractor: $1.04 mm .. Median Contractor: $450K .. Bottom 88% of the contractors .. Traits: .. No business systems .. Limited Advertising .. Reactive .. Opportunistic across trades .. Limited scalable         ..


(PAGE)
Remodeling Activity Timeline FY2000 FY2001 FY2002 FY2003 FY2004 FY2005 FY2006 FY2007 FY2008 FY2009 Everlast ™ Exclusive One-Step Pre-finished 6/2002 Color Exclusive Pitch 10/2003 2/2004 HardiHome™ 10/1999 Pitch JH Retail 4 /2005 Retail Pilot Initiated 1/2006 Remodeling Program Sustains 25+% Growth Year over Year JHSC 1st Anniversary 7/2007 SFI Pilot 7/2007 Existing Model .. Approach Partner and Penetrate Capture and Control Product Substitution at Contractor Target Early Adopter/Influencer Exploit New Construction Brand Strength .. Elements Credibility with JH Brand Lead Generation Co-Branding / Advertising Selling Tools Training


(PAGE)
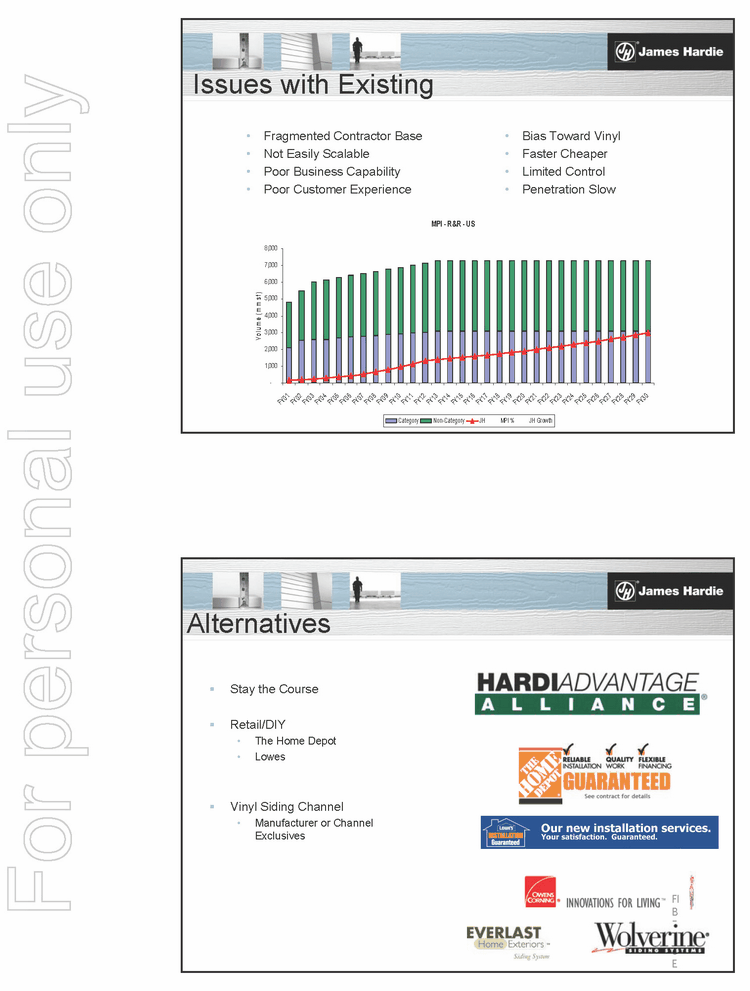
Issues with Existing Fragmented Contractor Base Not Easily Scalable Poor Business Capability Poor Customer Experience Bias Toward Vinyl Faster Cheaper Limited Control Penetration Slow MPI — R&R — US — 1,000 2,000 3,000 4,000 5,000 6,000 7,000 8,000 FY01 FY02 FY03 FY04 FY05 FY06 FY07 FY08 FY09 FY10 FY11 FY12 FY13 FY14 FY1 5 FY16 FY17 FY18 FY1 9 FY20 FY21 FY22 FY23 FY24 FY25 FY26 FY27 FY28 FY29 FY30 V o lum e (m m s f) Category Non-Category JH MPI % JH Growth Alternatives .. Stay the Course .. Retail/DIY The Home Depot Lowes .. Vinyl Siding Channel Manufacturer or Channel Exclusives FI BE R CE M


(PAGE)
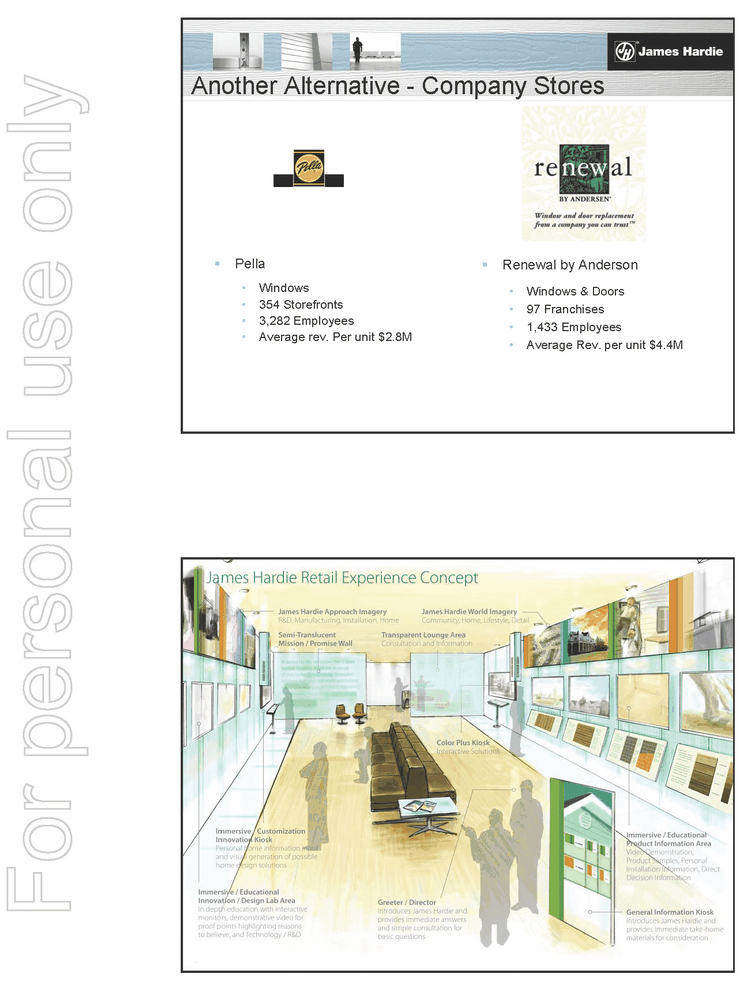
Another Alternative — Company Stores .. Pella Windows 354 Storefronts 3,282 Employees Average rev. Per unit $2.8M .. Renewal by Anderson Windows & Doors 97 Franchises 1,433 Employees Average Rev. per unit $4.4M


(PAGE)
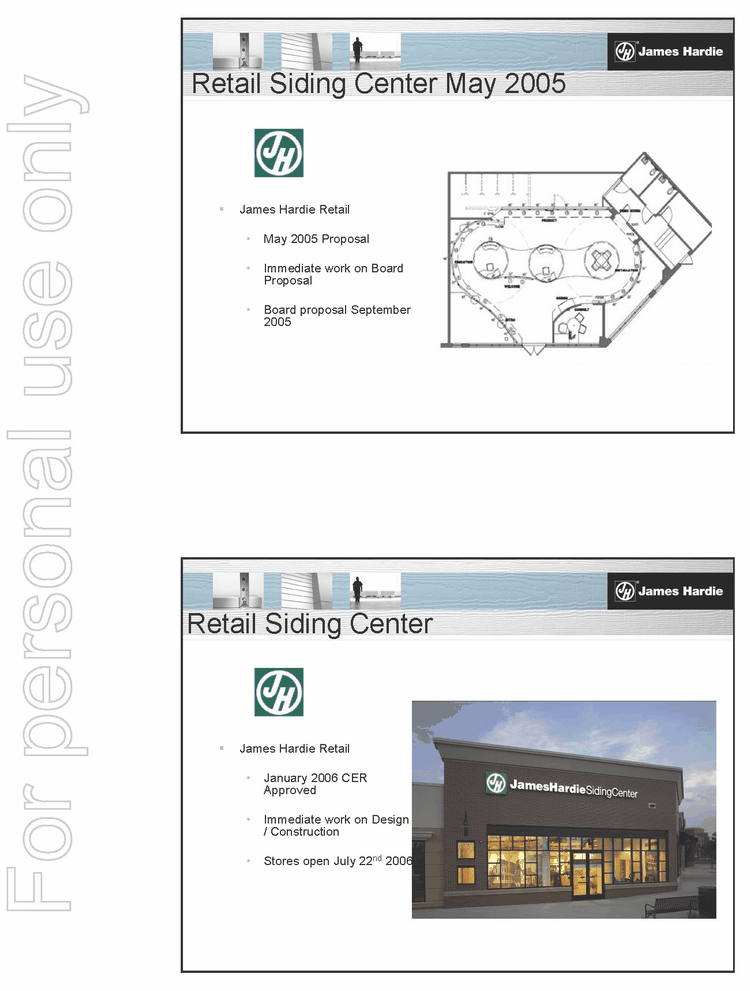
Retail Siding Center May 2005 .. James Hardie Retail May 2005 Proposal Immediate work on Board Proposal Board proposal September 2005 Retail Siding Center .. James Hardie Retail · January 2006 CER Approved Immediate work on Design / Construction Stores open July 22nd 2006


(PAGE)
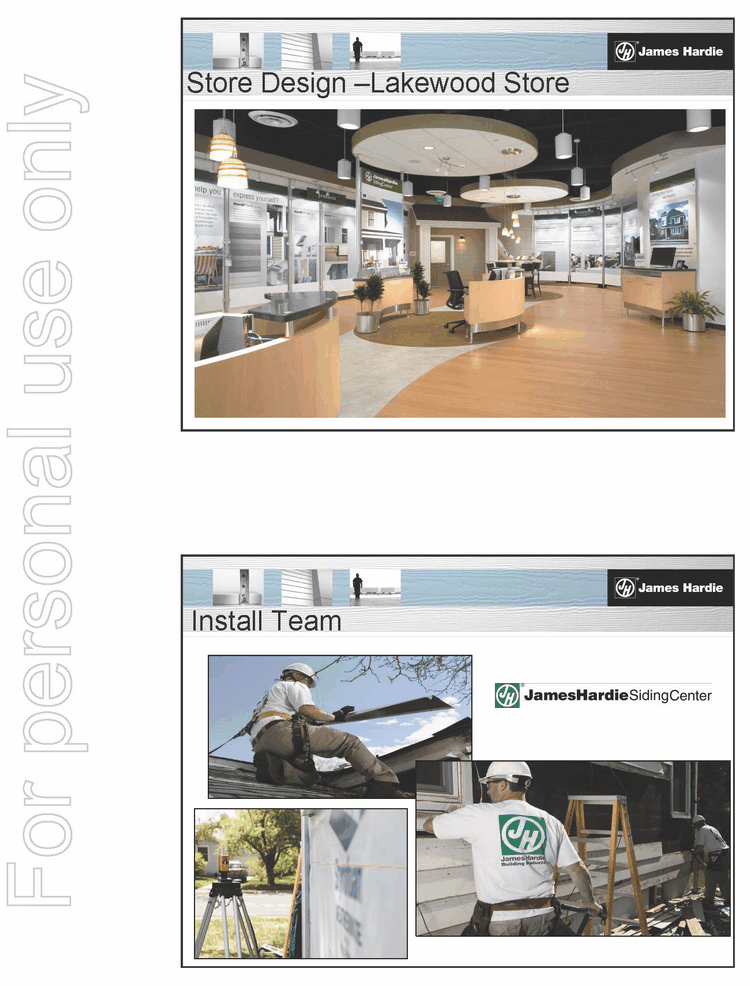
Store Design -Lakewood Store Install Team


(PAGE)
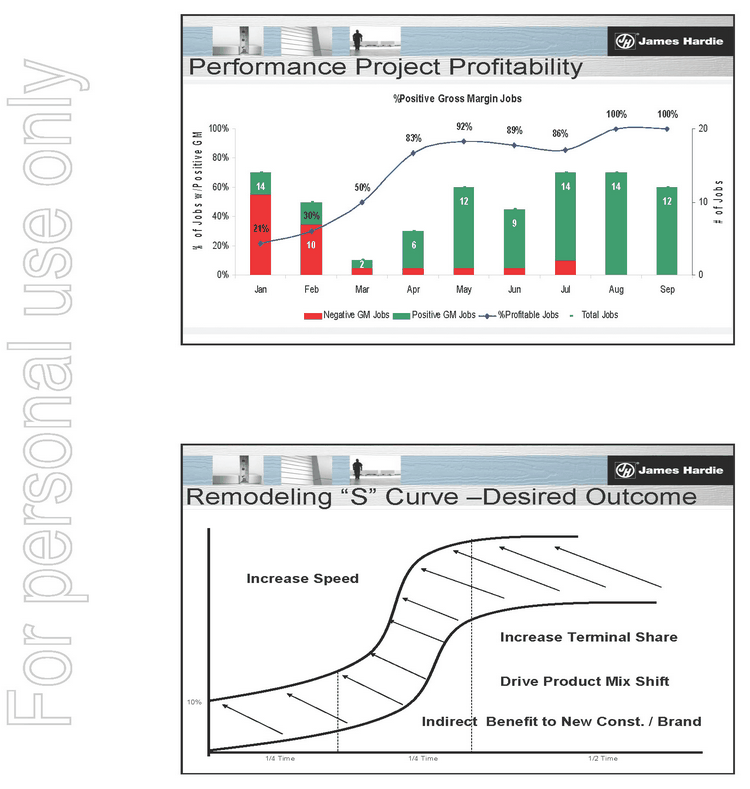
Performance Project Profitability      %Positive Gross Margin Jobs 21% 50% 83% 92% 89% 100% 100% 86% 30% 14 6 12 9 14 14 12 2 10 0% 20% 40% 60% 80% 100% Jan Feb Mar Apr May Jun Jul Aug Sep      % o f J o b s w /P o s i tiv e G M 0 10 20 # o f J o b s Negative GM Jobs Positive GM Jobs %Profitable Jobs Total Jobs 1/4 Time 1/4 Time 1/2 Time 10% Increase Terminal Share Drive Product Mix Shift Remodeling “S” Curve -Desired Outcome Increase Speed Indirect Benefit to New Const. / Brand


(PAGE)
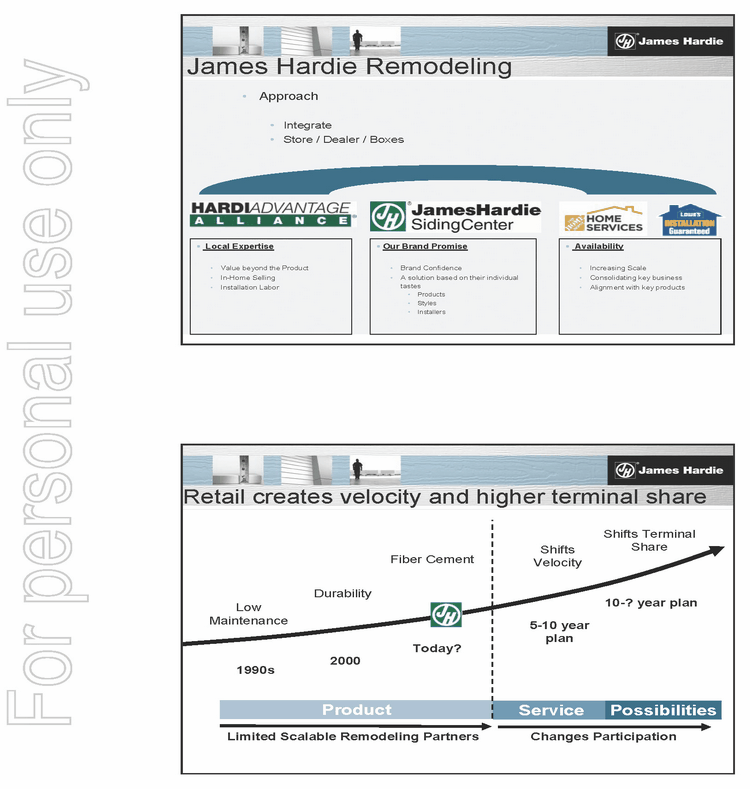
James Hardie Remodeling Approach Integrate Store / Dealer / Boxes .. Local Expertise · Value beyond the Product In-Home Selling Installation Labor .. Our Brand Promise Brand Confidence A solution based on their individual tastes Products Styles Installers .. Availability Increasing Scale Consolidating key business Alignment with key products Retail creates velocity and higher terminal share Low Maintenance 1990s Durability 2000 Fiber Cement Today? Shifts Velocity 5-10 year plan Shifts Terminal Share 10-? year plan Product Service Possibilities Limited Scalable Remodeling Partners Changes Participation


(PAGE)
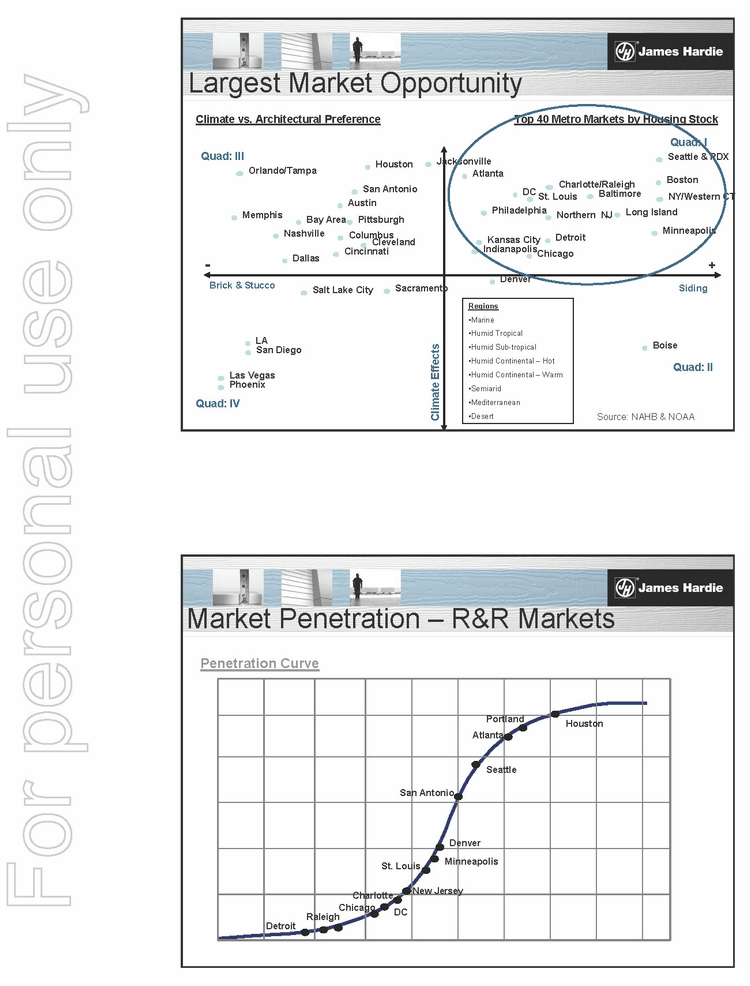
Largest Market Opportunity Brick & Stucco Climate Effects — + Houston Seattle & PDX Dallas Atlanta Minneapolis Detroit Sacramento Bay Area LA Denver Boise Austin San Antonio Kansas City St. Louis Chicago Boston Northern NJ DC Philadelphia Pittsburgh Nashville Columbus Memphis Salt Lake City Charlotte/Raleigh Cincinnati Quad: III Las Vegas Phoenix Jacksonville Orlando/Tampa Cleveland Indianapolis Top 40 Metro Markets by Housing Stock San Diego Long Island NY/Western CT Climate vs. Architectural Preference Quad: IV Quad: I Quad: II Siding Source: NAHB & NOAA Regions Marine Humid Tropical Humid Sub-tropical Humid Continental — Hot Humid Continental — Warm Semiarid Mediterranean Desert Baltimore Market Penetration — R&R Markets Penetration Curve Portland Houston Atlanta Seattle Raleigh San Antonio Charlotte St. Louis Minneapolis Detroit New Jersey Chicago Denver DC


(PAGE)
Disclaimer This Management Presentation contains forward-looking statements. We may from time to time make forward-looking statements in our periodic reports filed with or furnished to the United States Securities and Exchange Commission on Forms 20-F and 6-K, in our annual reports to shareholders, in offering circulars and prospectuses, in media releases and other written materials and in oral statements made by our officers, directors or employees to analysts, institutional investors, representatives of the media and others. Examples of forward-looking statements include: expectations about the timing and amount of payments to the Asbestos Injuries Compensation Fund (AICF), a special purpose fund for the compensation of proven asbestos-related personal injury and death claims; expectations with respect to the effect on our financial statements of those payments; statements as to the possible consequences of proceedings brought against us and certain of our former directors and officers by the Australian Securities and Investments Commission; expectations that our credit facilities will be extended or renewed; projections of our operating results or financial condition; statements regarding our plans, objectives or goals, including those relating to competition, acquisitions, dispositions and our products; statements about our future performance; statements about product or environmental liabilities; and statements regarding tax liabilities and related proceedings. Words such as “believe,” “anticipate,” “plan,” “expect,” “intend,” “target,” “estimate,” “project,” “predict,” “forecast,” “guideline,” “should,” “aim” and similar expressions are intended to identify forward-looking statements but are not the exclusive means of identifying such statements. Forward-looking statements involve inherent risks and uncertainties. We caution you that a number of important factors could cause actual results to differ materially from the plans, objectives, expectations, estimates and intentions expressed in such forward-looking statements. These factors, some of which are discussed under “Risk Factors” beginning on page 6 of our Form 20-F filed on 6 July 2007 with the Securities and Exchange Commission, include but are not limited to: all matters relating to or arising out of the prior manufacture of products that contained asbestos by current and former James Hardie subsidiaries; required contributions to the AICF and the effect of foreign exchange on the amount recorded in our financial statements as an asbestos liability; compliance with and changes in tax laws and treatments; competition and product pricing in the markets in which we operate; the consequences of product failures or defects; exposure to environmental, asbestos or other legal proceedings; general economic and market conditions; the supply and cost of raw materials; the success of our research and development efforts; our reliance on a small number of product distributors; compliance with and changes in environmental and health and safety laws; risks of conducting business internationally; compliance with and changes in laws and regulations; foreign exchange risks; the successful implementation of new software systems; and the effect of natural disasters. We caution you that the foregoing list of factors is not exhaustive and that other risks and uncertainties may cause actual results to differ materially from those in forward-looking statements. Forward-looking statements speak only as of the date they are made.


(PAGE)
Robert Russell VP Engineering and Process Development James Hardie Investor/Analyst Tour 4-5 December 2007 Manufacturing JH’s Business Strategy and Strategic Goals .. Strategic Driver: Product Leadership .. Strategic Goals: Primary Demand Category Share Differentiated Products


(PAGE)
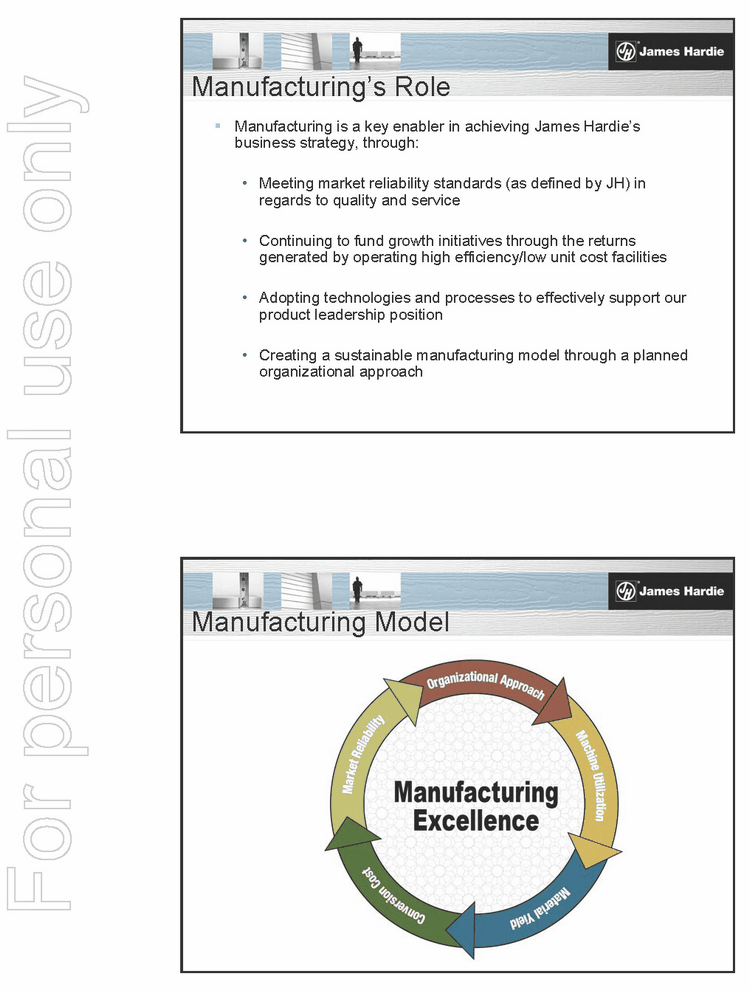
Manufacturing’s Role .. Manufacturing is a key enabler in achieving James Hardie’s business strategy, through: Meeting market reliability standards (as defined by JH) in regards to quality and service Continuing to fund growth initiatives through the returns generated by operating high efficiency/low unit cost facilities Adopting technologies and processes to effectively support our product leadership position Creating a sustainable manufacturing model through a planned organizational approach Manufacturing Model


(PAGE)
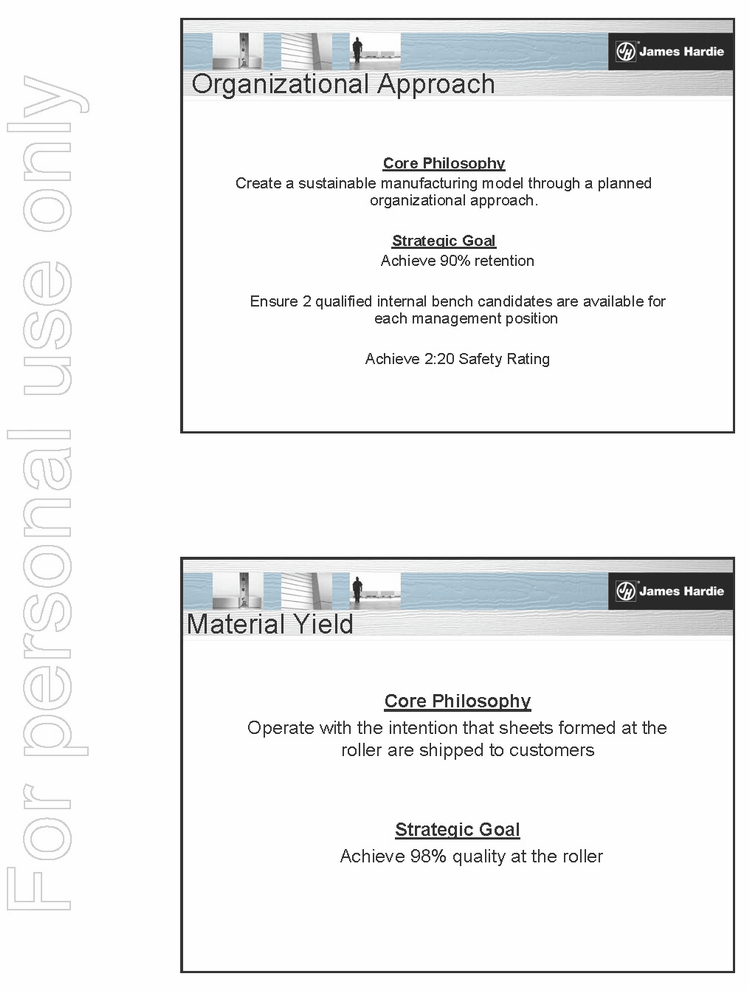
Core Philosophy Create a sustainable manufacturing model through a planned organizational approach. Strategic Goal Achieve 90% retention Ensure 2 qualified internal bench candidates are available for each management position Achieve 2:20 Safety Rating Organizational Approach Core Philosophy Operate with the intention that sheets formed at the roller are shipped to customers Strategic Goal Achieve 98% quality at the roller Material Yield


(PAGE)
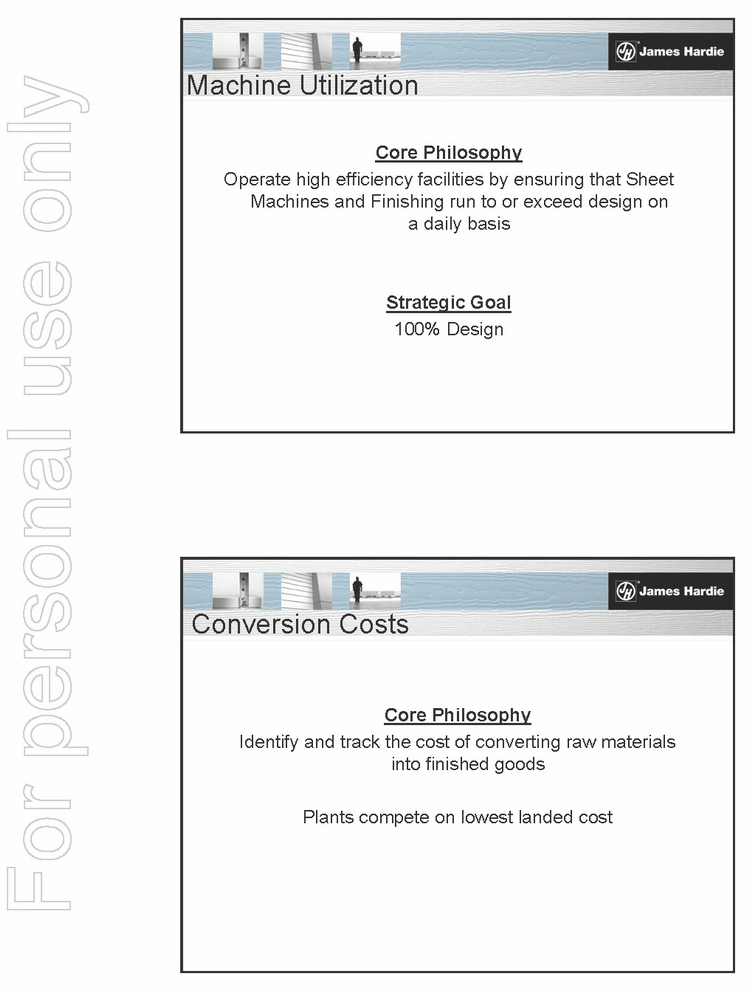
Core Philosophy Operate high efficiency facilities by ensuring that Sheet Machines and Finishing run to or exceed design on a daily basis Strategic Goal 100% Design Machine Utilization Core Philosophy Identify and track the cost of converting raw materials into finished goods Plants compete on lowest landed cost Conversion Costs


(PAGE)
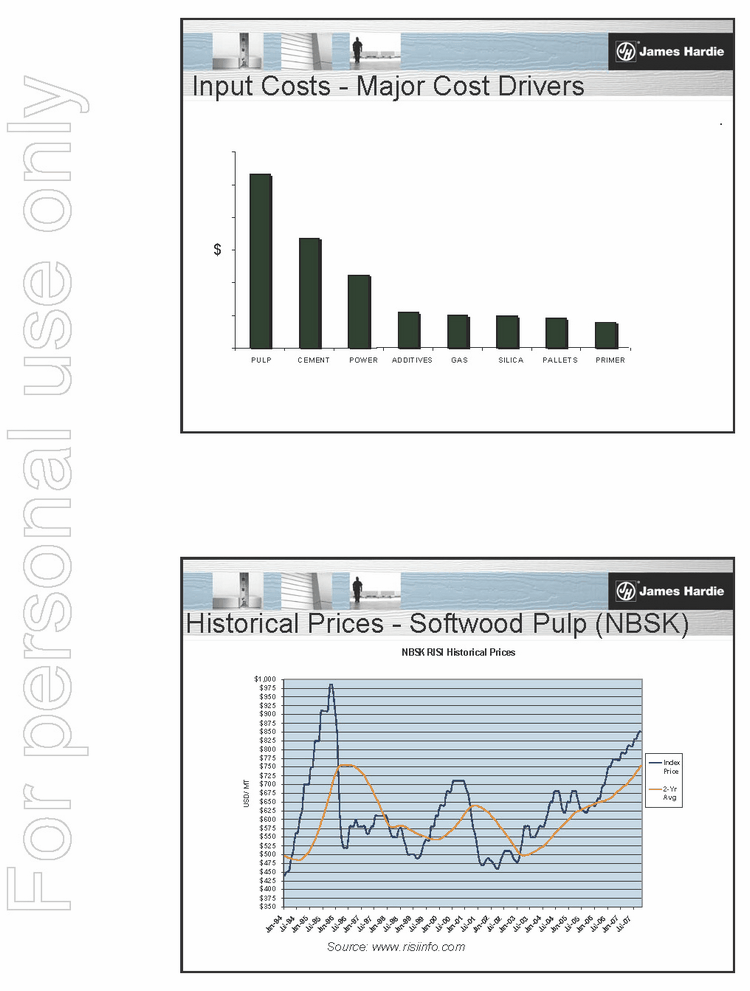
Input Costs — Major Cost Drivers $ PULP CEMENT POWER ADDITIVES GAS SILICA PALLETS PRIMER Historical Prices — Softwood Pulp (NBSK) Source: www.risiinfo.com NBSK RISI Historical Prices $350 $375 $400 $425 $450 $475 $500 $525 $550 $575 $600 $625 $650 $675 $700 $725 $750 $775 $800 $825 $850 $875 $900 $925 $950 $975 $1,000 Jan-94 Jul-94 Jan-95 Jul-95 Jan-96 Jul-96 Jan-97 Jul-97 Jan-98 Jul-98 Jan-99 Jul-99 Jan-00 Jul-00 Jan-01 Jul-01 Jan-02 Jul-02 Jan-03 Jul-03 Jan-04 Jul-04 Jan-05 Jul-05 Jan-06 Jul-06 Jan-07 Jul-07 USD/ MT Index Price 2-Yr Avg


(PAGE)
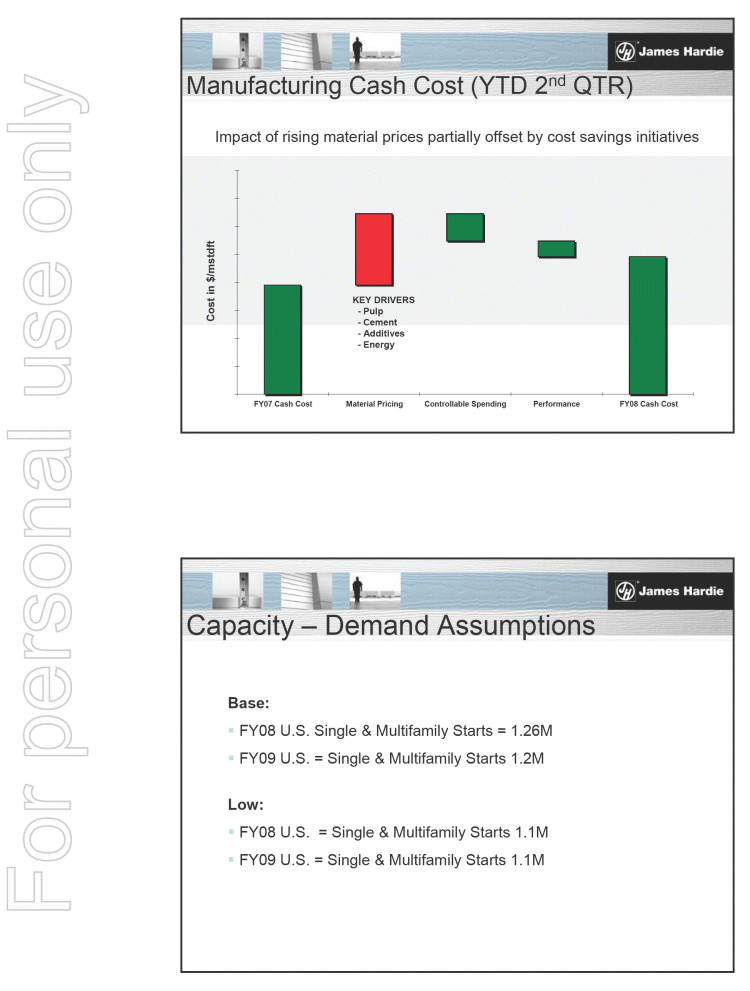
Manufacturing Cash Cost (YTD 2nd QTR) KEY DRIVERS — Pulp — Cement — Additives — Energy Impact of rising material prices partially offset by cost savings initiatives FY07 Cash Cost Material Pricing Controllable Spending Performance FY08 Cash Cost Cost in $/mstdft Capacity - Demand Assumptions Base: .. FY08 U.S. Single & Multifamily Starts = 1.26M .. FY09 U.S. = Single & Multifamily Starts 1.2M Low: .. FY08 U.S. = Single & Multifamily Starts 1.1M .. FY09 U.S. = Single & Multifamily Starts 1.1M


(PAGE)
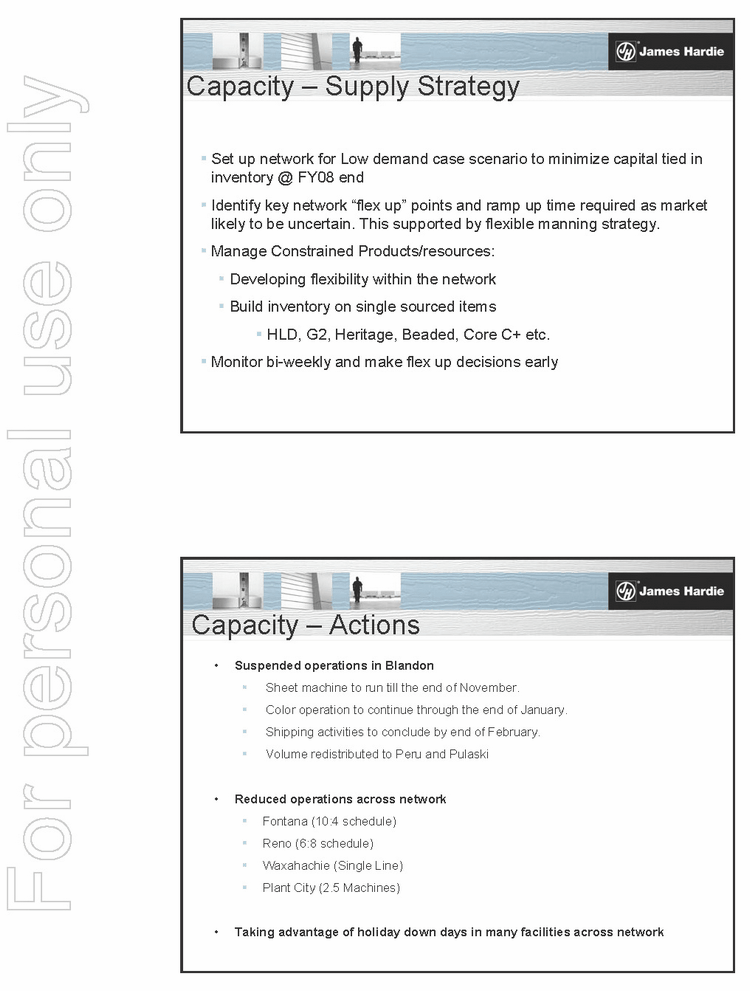
Capacity — Supply Strategy .. Set up network for Low demand case scenario to minimize capital tied in inventory @ FY08 end .. Identify key network “flex up” points and ramp up time required as market likely to be uncertain. This supported by flexible manning strategy. .. Manage Constrained Products/resources: .. Developing flexibility within the network .. Build inventory on single sourced items .. HLD, G2, Heritage, Beaded, Core C+ etc. .. Monitor bi-weekly and make flex up decisions early Capacity — Actions Suspended operations in Blandon .. Sheet machine to run till the end of November. .. Color operation to continue through the end of January. .. Shipping activities to conclude by end of February. .. Volume redistributed to Peru and Pulaski Reduced operations across network .. Fontana (10:4 schedule) .. Reno (6:8 schedule) .. Waxahachie (Single Line) .. Plant City (2.5 Machines) Taking advantage of holiday down days in many facilities across network


(PAGE)
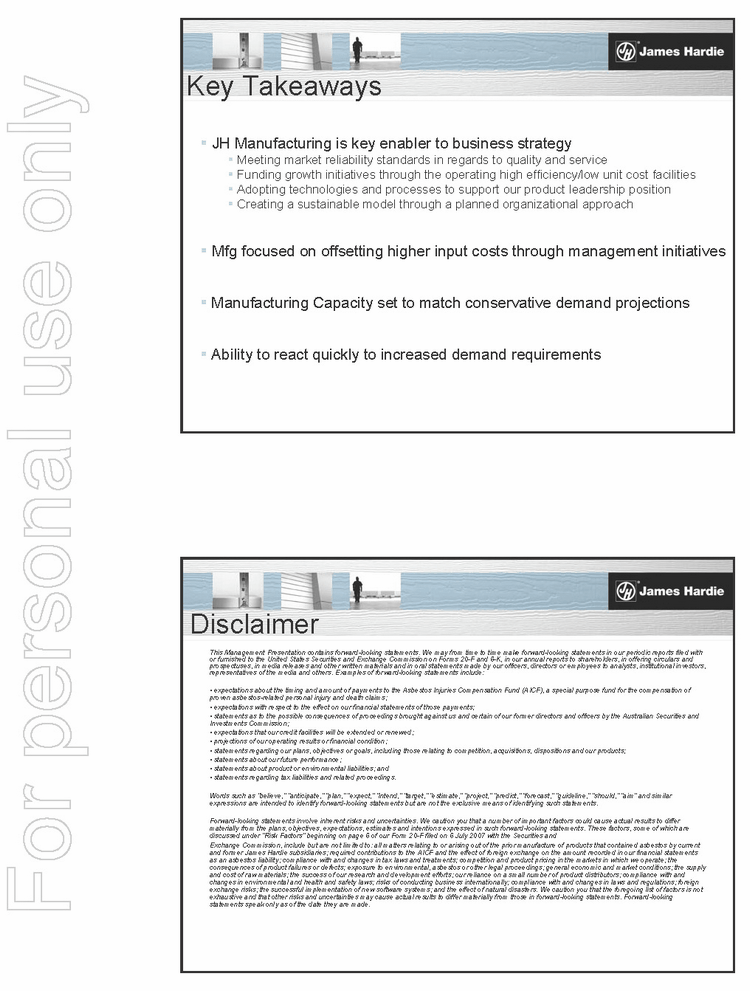
Key Takeaways .. JH Manufacturing is key enabler to business strategy .. Meeting market reliability standards in regards to quality and service .. Funding growth initiatives through the operating high efficiency/low unit cost facilities .. Adopting technologies and processes to support our product leadership position .. Creating a sustainable model through a planned organizational approach .. Mfg focused on offsetting higher input costs through management initiatives .. Manufacturing Capacity set to match conservative demand projections .. Ability to react quickly to increased demand requirements Disclaimer This Management Presentation contains forward-looking statements. We may from time to time make forward-looking statements in our periodic reports filed with or furnished to the United States Securities and Exchange Commission on Forms 20-F and 6-K, in our annual reports to shareholders, in offering circulars and prospectuses, in media releases and other written materials and in oral statements made by our officers, directors or employees to analysts, institutional investors, representatives of the media and others. Examples of forward-looking statements include: expectations about the timing and amount of payments to the Asbestos Injuries Compensation Fund (AICF), a special purpose fund for the compensation of proven asbestos-related personal injury and death claims; expectations with respect to the effect on our financial statements of those payments; statements as to the possible consequences of proceedings brought against us and certain of our former directors and officers by the Australian Securities and Investments Commission; expectations that our credit facilities will be extended or renewed; projections of our operating results or financial condition; statements regarding our plans, objectives or goals, including those relating to competition, acquisitions, dispositions and our products; statements about our future performance; statements about product or environmental liabilities; and statements regarding tax liabilities and related proceedings. Words such as “believe,” “anticipate,” “plan,” “expect,” “intend,” “target,” “estimate,” “project,” “predict,” “forecast,” “guideline,” “should,” “aim” and similar expressions are intended to identify forward-looking statements but are not the exclusive means of identifying such statements. Forward-looking statements involve inherent risks and uncertainties. We caution you that a number of important factors could cause actual results to differ materially from the plans, objectives, expectations, estimates and intentions expressed in such forward-looking statements. These factors, some of which are discussed under “Risk Factors” beginning on page 6 of our Form 20-F filed on 6 July 2007 with the Securities and Exchange Commission, include but are not limited to: all matters relating to or arising out of the prior manufacture of products that contained asbestos by current and former James Hardie subsidiaries; required contributions to the AICF and the effect of foreign exchange on the amount recorded in our financial statements as an asbestos liability; compliance with and changes in tax laws and treatments; competition and product pricing in the markets in which we operate; the consequences of product failures or defects; exposure to environmental, asbestos or other legal proceedings; general economic and market conditions; the supply and cost of raw materials; the success of our research and development efforts; our reliance on a small number of product distributors; compliance with and changes in environmental and health and safety laws; risks of conducting business internationally; compliance with and changes in laws and regulations; foreign exchange risks; the successful implementation of new software systems; and the effect of natural disasters. We caution you that the foregoing list of factors is not exhaustive and that other risks and uncertainties may cause actual results to differ materially from those in forward-looking statements. Forward-looking statements speak only as of the date they are made.


(PAGE)
Mark Fisher VP Research & Development James Hardie Investor/Analyst Tour 4-5 December 2007 Research & Development Technology Strategy Enable JH product leadership strategy Provide sustainable advantage Balance between Research and Development Integration with business units Use IP to protect competitive advantage


(PAGE)
Organization Two research centers — Australia and US Development — focused organization around implementing technologies Research — core understanding of materials and the science behind them Resources Knowledge management and innovation focused Over 15 nationalities with 70% with advanced degrees Diverse organization Building science Material science Chemistry Civil and Mechanical Engineering Enable JH product leadership strategy Differentiated products New products Enhance current portfolio Technology enablers Platforms Competitive Intelligence


(PAGE)
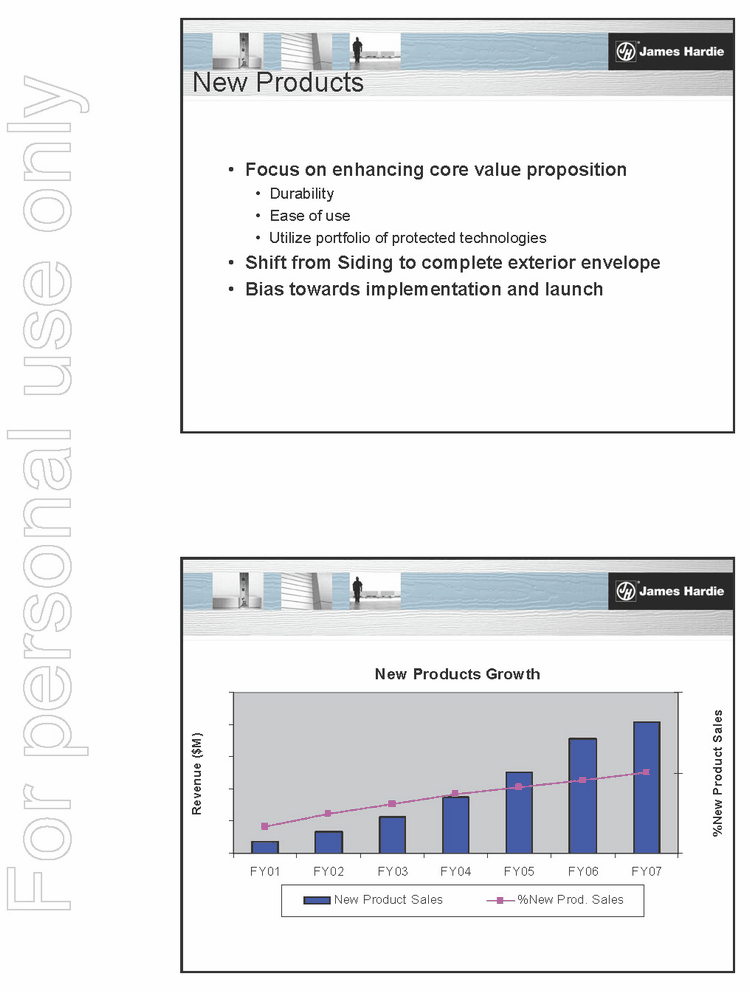
New Products Focus on enhancing core value proposition Durability Ease of use Utilize portfolio of protected technologies Shift from Siding to complete exterior envelope Bias towards implementation and launch New Products Growth $0 $100 $200 $300 $400 $500 FY01 FY02 FY03 FY04 FY05 FY06 FY07 Revenue ($M) 0% 30% 60% %New Product Sales New Product Sales %New Prod. Sales


(PAGE)
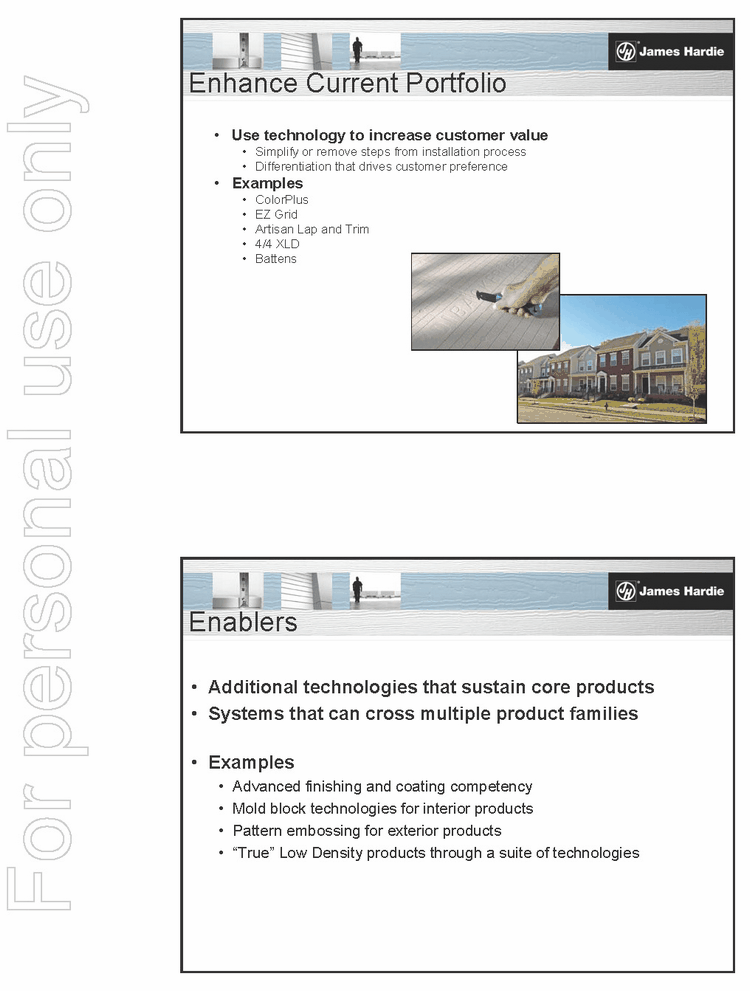
Enhance Current Portfolio Use technology to increase customer value Simplify or remove steps from installation process Differentiation that drives customer preference Examples ColorPlus EZ Grid Artisan Lap and Trim 4/4 XLD Battens Enablers Additional technologies that sustain core products Systems that can cross multiple product families Examples Advanced finishing and coating competency Mold block technologies for interior products Pattern embossing for exterior products “True” Low Density products through a suite of technologies


(PAGE)
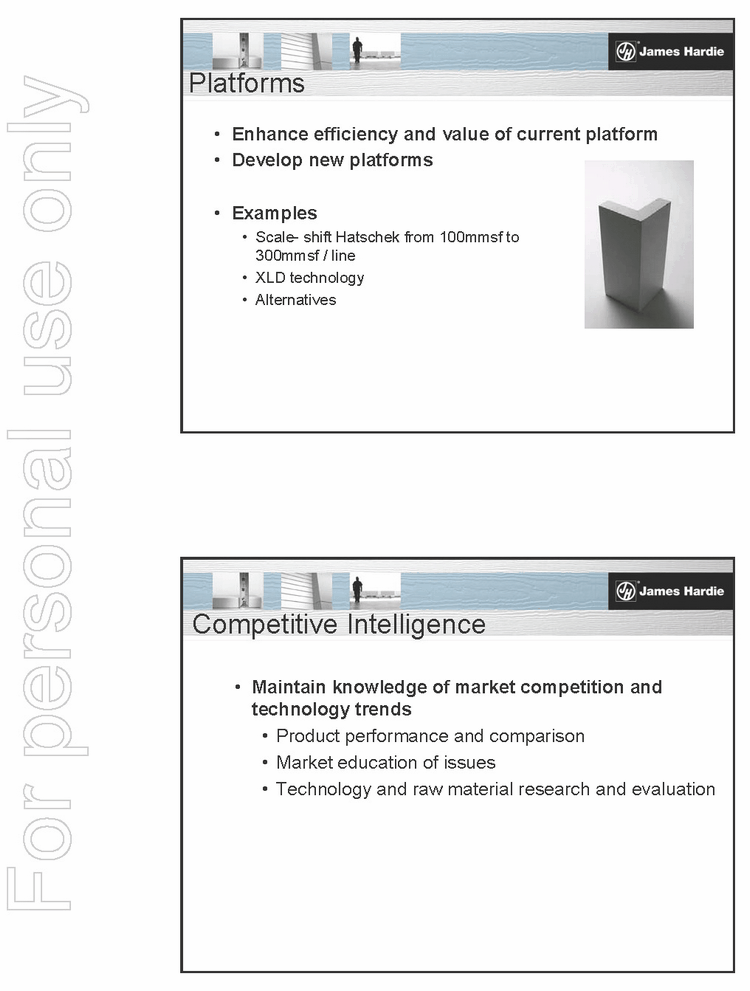
Platforms Enhance efficiency and value of current platform Develop new platforms Examples Scale- shift Hatschek from 100mmsf to 300mmsf / line XLD technology Alternatives Competitive Intelligence Maintain knowledge of market competition and technology trends Product performance and comparison Market education of issues Technology and raw material research and evaluation


(PAGE)
Intellectual Property Create sustainable advantage by Developing clear strategies Patent and trade secret Aggressively defend against infringement Focus on Formulations Additives Process Vertical Integration Forward Vision Sustain business growth via product leadership strategy Organization aligned to deliver Technology shifts .. Product .. Process         .. Platform Technologies Products


(PAGE)
..Sales Volumes ..mmsf — million square feet ..msf — thousand square feet Definitions Disclaimer This Management Presentation contains forward-looking statements. We may from time to time make forward-looking statements in our periodic reports filed with or furnished to the United States Securities and Exchange Commission on Forms 20-F and 6-K, in our annual reports to shareholders, in offering circulars and prospectuses, in media releases and other written materials and in oral statements made by our officers, directors or employees to analysts, institutional investors, representatives of the media and others. Examples of forward-looking statements include: expectations about the timing and amount of payments to the Asbestos Injuries Compensation Fund (AICF), a special purpose fund for the compensation of proven asbestos-related personal injury and death claims; expectations with respect to the effect on our financial statements of those payments; statements as to the possible consequences of proceedings brought against us and certain of our former directors and officers by the Australian Securities and Investments Commission; expectations that our credit facilities will be extended or renewed; projections of our operating results or financial condition; statements regarding our plans, objectives or goals, including those relating to competition, acquisitions, dispositions and our products; statements about our future performance; statements about product or environmental liabilities; and statements regarding tax liabilities and related proceedings. Words such as “believe,” “anticipate,” “plan,” “expect,” “intend,” “target,” “estimate,” “project,” “predict,” “forecast,” “guideline,” “should,” “aim” and similar expressions are intended to identify forward-looking statements but are not the exclusive means of identifying such statements. Forward-looking statements involve inherent risks and uncertainties. We caution you that a number of important factors could cause actual results to differ materially from the plans, objectives, expectations, estimates and intentions expressed in such forward-looking statements. These factors, some of which are discussed under “Risk Factors” beginning on page 6 of our Form 20-F filed on 6 July 2007 with the Securities and Exchange Commission, include but are not limited to: all matters relating to or arising out of the prior manufacture of products that contained asbestos by current and former James Hardie subsidiaries; required contributions to the AICF and the effect of foreign exchange on the amount recorded in our financial statements as an asbestos liability; compliance with and changes in tax laws and treatments; competition and product pricing in the markets in which we operate; the consequences of product failures or defects; exposure to environmental, asbestos or other legal proceedings; general economic and market conditions; the supply and cost of raw materials; the success of our research and development efforts; our reliance on a small number of product distributors; compliance with and changes in environmental and health and safety laws; risks of conducting business internationally; compliance with and changes in laws and regulations; foreign exchange risks; the successful implementation of new software systems; and the effect of natural disasters. We caution you that the foregoing list of factors is not exhaustive and that other risks and uncertainties may cause actual results to differ materially from those in forward-looking statements. Forward-looking statements speak only as of the date they are made.


(PAGE)
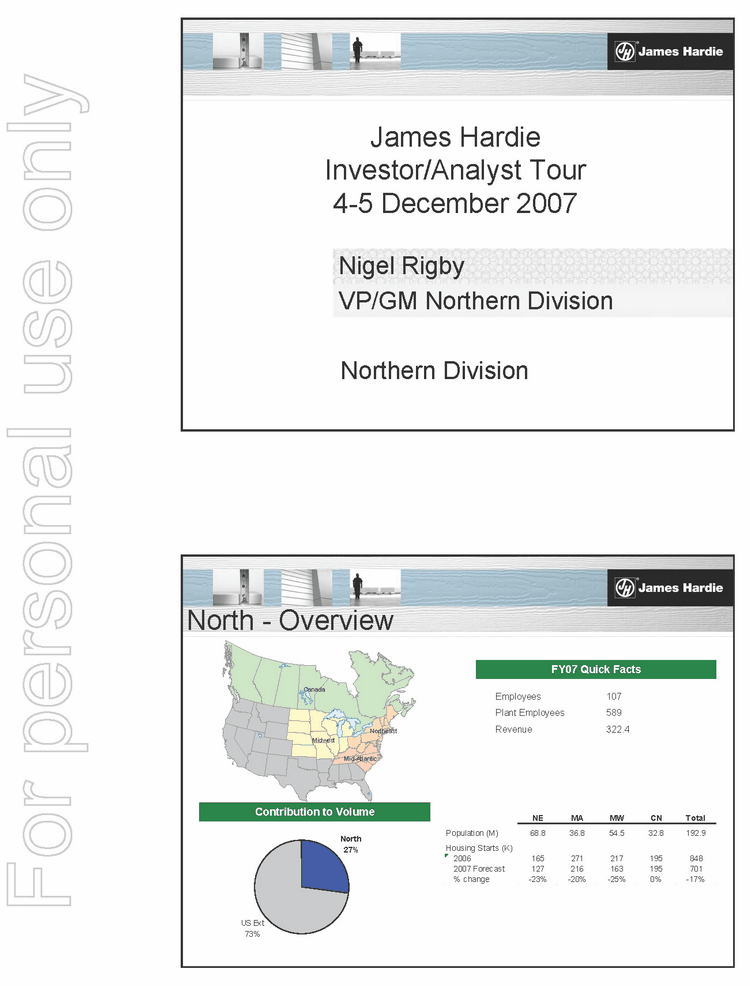
James Hardie Investor/Analyst Tour 4-5 December 2007 Northern Division Nigel Rigby VP/GM Northern Division North — Overview FY07 Quick Facts Contribution to Volume North 27% US Ext 73% Midwest Canada Northeast Mid-Atlantic NE MA MW CN Total Population (M) 68.8 36.8 54.5 32.8 192.9 Housing Starts (K) 2006 165 271 217 195 848 2007 Forecast 127 216 163 195 701 % change -23% -20% -25% 0% -17% Employees 107 Plant Employees 589 Revenue 322.4


(PAGE)
Color Strategy Strategy .. Higher value strategy increasing revenue per home by 90% ($1287 / 2500 sf home primed vs. $ 2450 C+ and XLD) .. Reduce siding on the wall cost — closing the gap between Hardie and Vinyl — increasing available market opportunity Increasing the value proposition to the builder, lower Hardie on the wall cost by $0.40 — 0.60sf through eliminating the site painter and re-engineering the supply chain Durability, maintenance and the look of wood value proposition to the consumer .. Market will demand a majority pre-finished “ColorPlus” product


(PAGE)
Strategy .. Value proposition to the builder Lower otwc / simple supply chain through color execution and install efficiency eliminating switching barriers / cost Professionally developed system of colors enabling exterior design Hardie superior substrate + durable high performance quality Color is the ultimate siding Best Practice installation management .. Re-engineer the Supply Chain JIT / made to order business — 10 day delivered High turn / minimum inventory / acceptable margin Exclusive dealer direct / distribution rural access Limited critical mass configuration Geographical / Customer access .. Manufacturing - Technology High throughput JIT / made to order model On line protect packaging to the builder · High quality durable coating system Protection to the wall through on line laminating Flexible line design — short run / low volume lines .. Full wrap Hardie exterior eliminating the site painter+ Color project packaging to the site Color/product range/differentiating the front Strategy


(PAGE)
North Current State vs. Future State Current Year 1 C+ HardiePlank C+ HardiePlank Cemboard Future C+ HardiePlank Cemboard Artisan ColorPlus Technology Advantage


(PAGE)
Color Supply Chain ColorPlus Growth .. Continue to execute Primary Demand Color growth .. Focus on Primed to Color base business cannibalization ColorPlus — 20 40 60 80 100 Q1 Q2 Q3 Q4 Q1 Q2 Q3 Q4 Q1 Q2 Q3est. Q4est. (mmsf) 0% 10% 20% 30% 40% 50% TOTAL C+ Volume %North Penetration FY06 FY07 FY08


(PAGE)
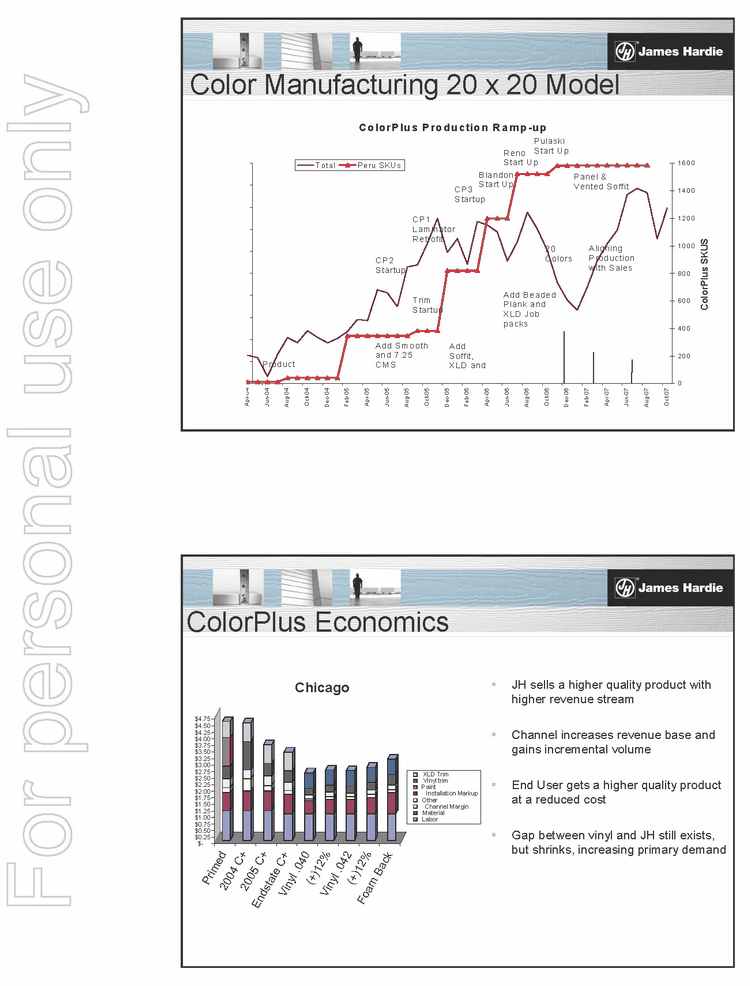
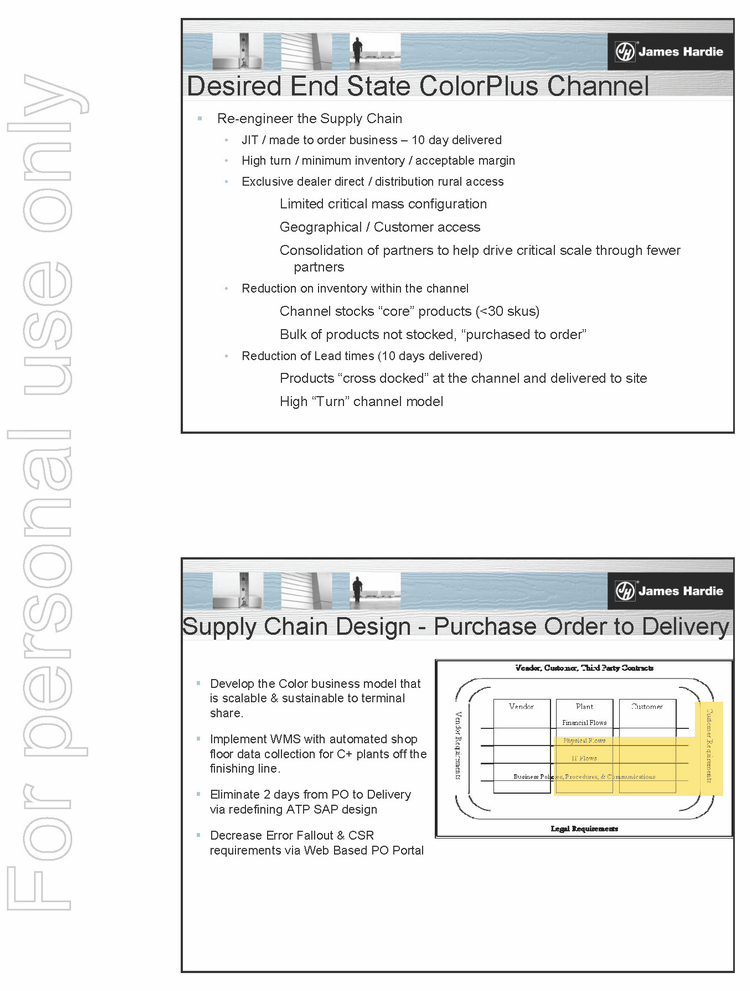
Color Manufacturing 20 x 20 Model ColorPlus Production Ramp-up 0 2,000 4,000 6,000 8,000 10,000 12,000 14,000 16,000 18,000 20,000 Apr-04 Jun-04 Aug-04 Oct-04 Dec-04 Feb-05 Apr-05 Jun-05 Aug-05 Oct-05 Dec-05 Feb-06 Apr-06 Jun-06 Aug-06 Oct-06 Dec-06 Feb-07 Apr-07 Jun-07 Aug-07 Oct-07 Thousands SF Production 0 200 400 600 800 1000 1200 1400 1600 ColorPlus SKUS Total Peru SKUs Product CP1 Laminator Retrofit Add Smooth and 7.25 CMS Add Beaded Plank and XLD Job packs Add Soffit, XLD and CP2 Startup CP3 Startup 20 Colors Trim Startup Aligning Production with Sales Reno Start Up Blandon Start Up Pulaski Start Up Panel & Vented Soffit ColorPlus Economics .. JH sells a higher quality product with higher revenue stream .. Channel increases revenue base and gains incremental volume .. End User gets a higher quality product at a reduced cost .. Gap between vinyl and JH still exists, but shrinks, increasing primary demand $- $0.25 $0.50 $0.75 $1.00 $1.25 $1.50 $1.75 $2.00 $2.25 $2.50 $2.75 $3.00 $3.25 $3.50 $3.75 $4.00 $4.25 $4.50 $4.75 Primed 2004 C+ 2005 C+ Endstate C+ Vinyl .040 (+)12% Vinyl .042 (+)12% Foam Back Chicago XLD Trim Vinyl trim Paint Installation Markup Other Channel Margin Material Labor


(PAGE)
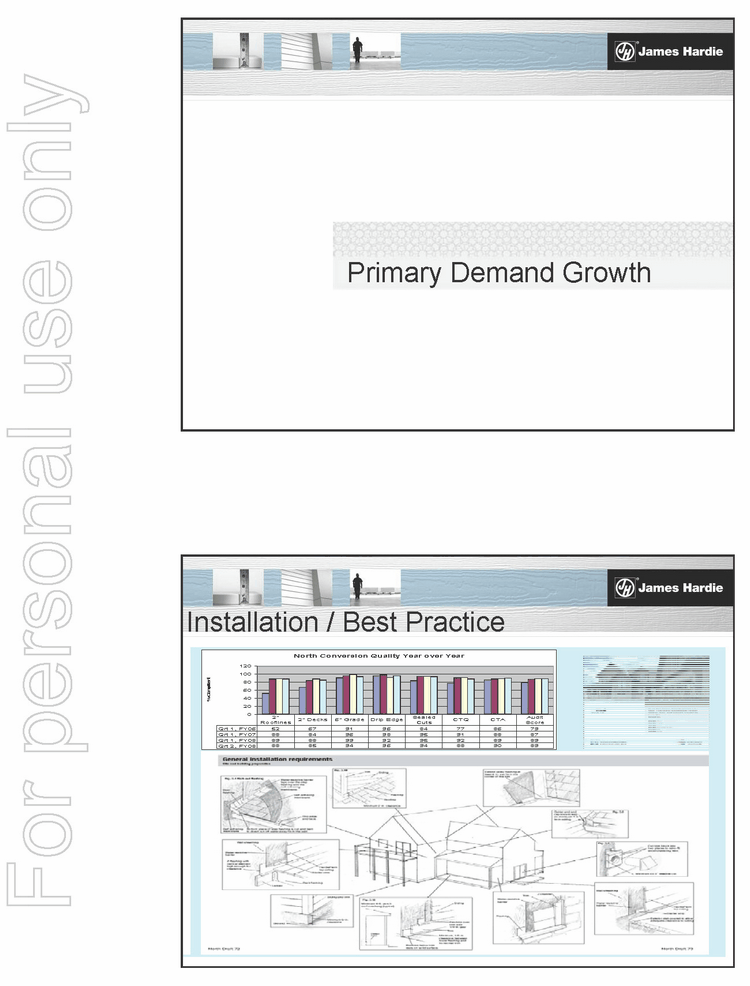
Desired End State ColorPlus Channel .. Re-engineer the Supply Chain JIT / made to order business — 10 day delivered High turn / minimum inventory / acceptable margin Exclusive dealer direct / distribution rural access Limited critical mass configuration Geographical / Customer access Consolidation of partners to help drive critical scale through fewer partners Reduction on inventory within the channel Channel stocks “core” products (30 skus) Bulk of products not stocked, “purchased to order” Reduction of Lead times (10 days delivered) Products “cross docked” at the channel and delivered to site High “Turn” channel model Supply Chain Design - - Purchase Order to Delivery .. Develop the Color business model that is scalable & sustainable to terminal share. .. Implement WMS with automated shop floor data collection for C+ plants off the finishing line. .. Eliminate 2 days from PO to Delivery via redefining ATP SAP design .. Decrease Error Fallout & CSR requirements via Web Based PO Portal


(PAGE)
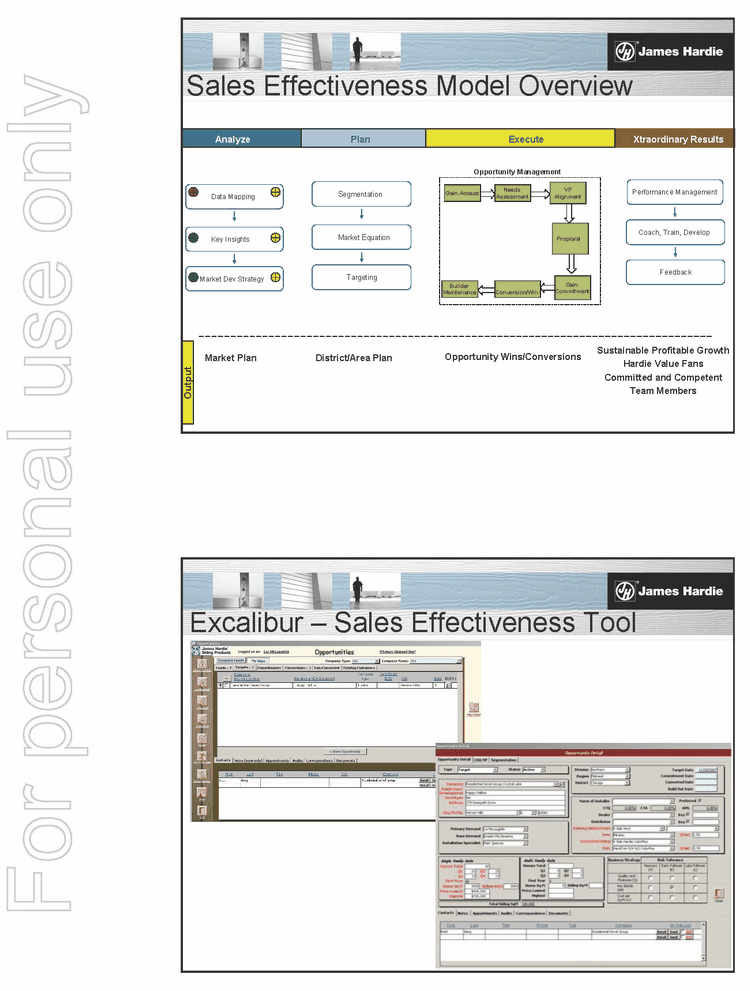
Primary Demand Growth Installation / Best Practice 3 ns North Conversion Quality Year over Year 0 20 40 60 80 100 120 % Compliant Qrt 1, FY06 52 67 91 96 84 77 86 79 Qrt 1, FY07 88 84 96 98 95 91 88 87 Qrt 1, FY08 89 88 99 92 95 92 89 89 Qrt 2, FY08 88 85 94 96 94 88 90 89 2” Rooflines 2” Decks 6” Grade Drip Edge Sealed Cuts CTQ CTA Audit Score


(PAGE)
Sales Effectiveness Model Overview Analyze District/Area Plan Output Plan Execute Xtraordinary Results Sustainable Profitable Growth Hardie Value Fans Committed and Competent Team Members Market Plan Opportunity Wins/Conversions Data Mapping Key Insights Market Dev.Strategy Data Mapping Key Insights Market Dev.Strategy Segmentation Market Equation Targeting Segmentation Market Equation Targeting Proposal Needs Assessment Conversion/Win Gain Commitment Builder Maintenance Gain Access VP Alignment Opportunity Management Proposal Needs Assessment Conversion/Win Gain Commitment Builder Maintenance Gain Access VP Alignment Opportunity Management Feedback Performance Management Coach, Train, Develop Feedback Performance Management Coach, Train, Develop Excalibur — Sales Effectiveness Tool


(PAGE)
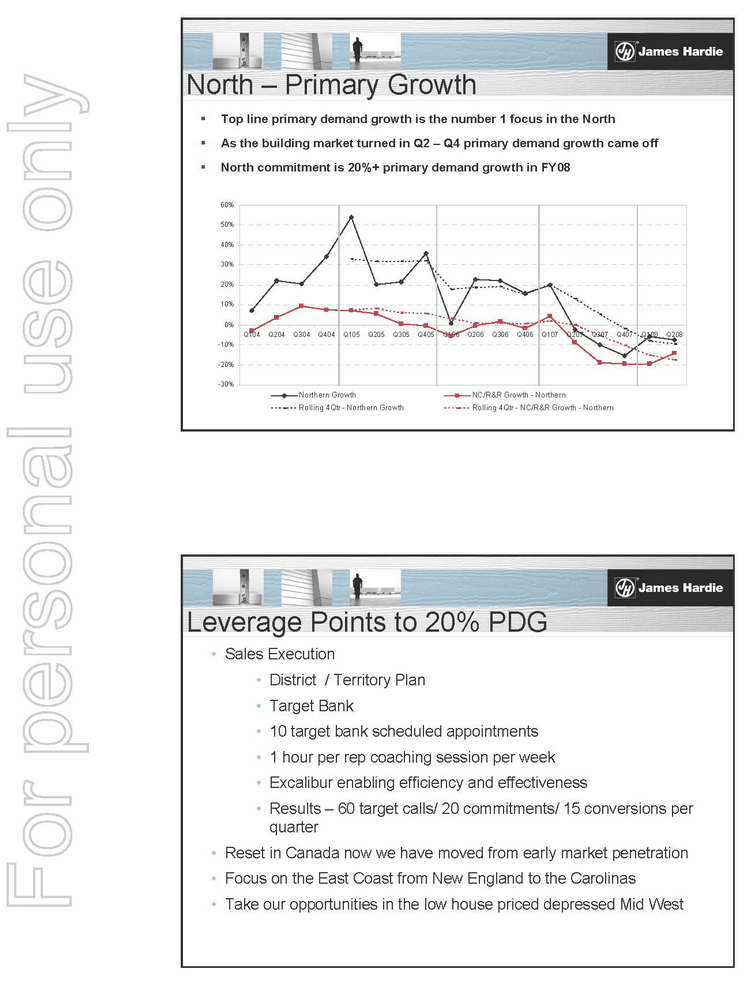
North — Primary Growth .. Top line primary demand growth is the number 1 focus in the North         .. As the building market turned in Q2 — Q4 primary demand growth came off .. North commitment is 20%+ primary demand growth in FY08 -30% -20% -10% 0% 10% 20% 30% 40% 50% 60% Q104 Q204 Q304 Q404 Q105 Q205 Q305 Q405 Q106 Q206 Q306 Q406 Q107 Q207 Q307 Q407 Q108 Q208 Northern Growth NC/R&R Growth — Northern Rolling 4Qtr — Northern Growth Rolling 4Qtr — NC/R&R Growth — Northern Leverage Points to 20% PDG Sales Execution District / Territory Plan Target Bank 10 target bank scheduled appointments 1 hour per rep coaching session per week Excalibur enabling efficiency and effectiveness Results — 60 target calls/ 20 commitments/ 15 conversions per quarter Reset in Canada now we have moved from early market penetration Focus on the East Coast from New England to the Carolinas Take our opportunities in the low house priced depressed Mid West


(PAGE)
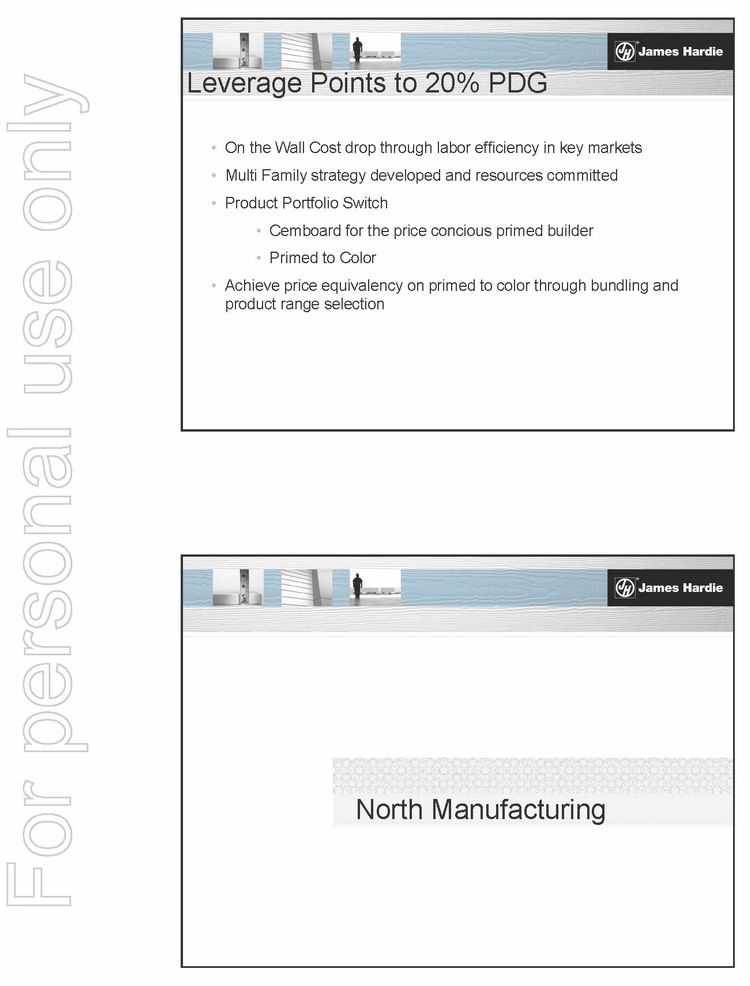
Leverage Points to 20% PDG On the Wall Cost drop through labor efficiency in key markets Multi Family strategy developed and resources committed Product Portfolio Switch Cemboard for the price concious primed builder Primed to Color Achieve price equivalency on primed to color through bundling and product range selection North Manufacturing


(PAGE)
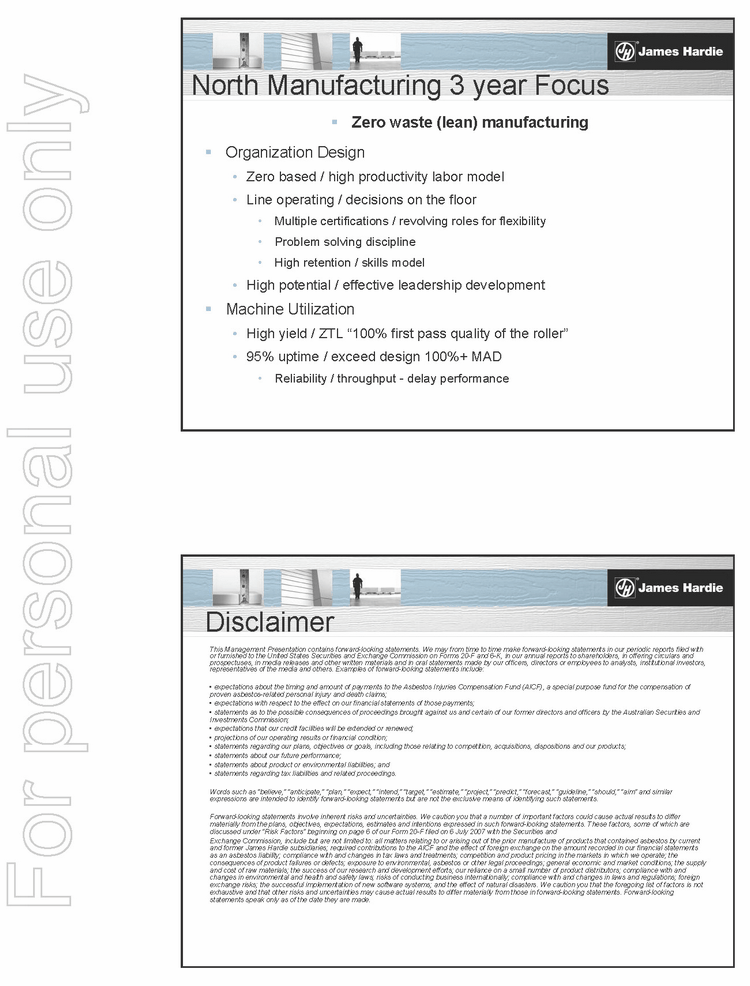
North Manufacturing 3 year Focus .. Zero waste (lean) manufacturing .. Organization Design · Zero based / high productivity labor model Line operating / decisions on the floor Multiple certifications / revolving roles for flexibility Problem solving discipline High retention / skills model High potential / effective leadership development .. Machine Utilization High yield / ZTL “100% first pass quality of the roller” 95% uptime / exceed design 100%+ MAD Reliability / throughput — delay performance Disclaimer This Management Presentation contains forward-looking statements. We may from time to time make forward-looking statements in our periodic reports filed with or furnished to the United States Securities and Exchange Commission on Forms 20-F and 6-K, in our annual reports to shareholders, in offering circulars and prospectuses, in media releases and other written materials and in oral statements made by our officers, directors or employees to analysts, institutional investors, representatives of the media and others. Examples of forward-looking statements include: expectations about the timing and amount of payments to the Asbestos Injuries Compensation Fund (AICF), a special purpose fund for the compensation of proven asbestos-related personal injury and death claims; expectations with respect to the effect on our financial statements of those payments; statements as to the possible consequences of proceedings brought against us and certain of our former directors and officers by the Australian Securities and Investments Commission; expectations that our credit facilities will be extended or renewed; projections of our operating results or financial condition; statements regarding our plans, objectives or goals, including those relating to competition, acquisitions, dispositions and our products; statements about our future performance; statements about product or environmental liabilities; and statements regarding tax liabilities and related proceedings. Words such as “believe,” “anticipate,” “plan,” “expect,” “intend,” “target,” “estimate,” “project,” “predict,” “forecast,” “guideline,” “should,” “aim” and similar expressions are intended to identify forward-looking statements but are not the exclusive means of identifying such statements. Forward-looking statements involve inherent risks and uncertainties. We caution you that a number of important factors could cause actual results to differ materially from the plans, objectives, expectations, estimates and intentions expressed in such forward-looking statements. These factors, some of which are discussed under “Risk Factors” beginning on page 6 of our Form 20-F filed on 6 July 2007 with the Securities and Exchange Commission, include but are not limited to: all matters relating to or arising out of the prior manufacture of products that contained asbestos by current and former James Hardie subsidiaries; required contributions to the AICF and the effect of foreign exchange on the amount recorded in our financial statements as an asbestos liability; compliance with and changes in tax laws and treatments; competition and product pricing in the markets in which we operate; the consequences of product failures or defects; exposure to environmental, asbestos or other legal proceedings; general economic and market conditions; the supply and cost of raw materials; the success of our research and development efforts; our reliance on a small number of product distributors; compliance with and changes in environmental and health and safety laws; risks of conducting business internationally; compliance with and changes in laws and regulations; foreign exchange risks; the successful implementation of new software systems; and the effect of natural disaster s. We caution you that the foregoing list of factors is not exhaustive and that other risks and uncertainties may cause actual results to differ materially from those in forward-looking statements. Forward-looking statements speak only as of the date they are made.


(PAGE)
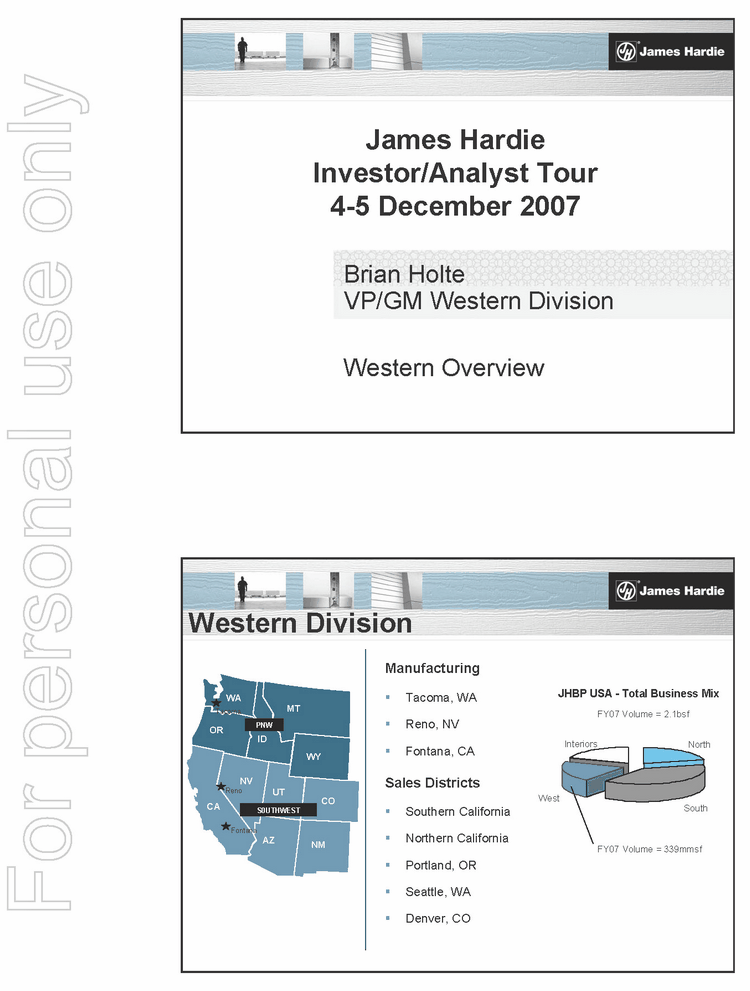
Brian Holte VP/GM Western Division James Hardie Investor/Analyst Tour 4-5 December 2007 Western Overview Western Division CA NV AZ UT NM CO OR WA ID MT WY PNW CA S0UTHWEST Fontana Tacoma Reno CA NV AZ UT NM CO OR WA ID MT WY PNW CA S0UTHWEST Fontana Tacoma Reno CA NV AZ UT NM CO OR WA ID MT WY PNW CA S0UTHWEST Fontana Tacoma Reno CA NV AZ UT NM CO OR WA ID MT WY PNW CA S0UTHWEST Fontana Tacoma Reno Manufacturing .. Tacoma, WA .. Reno, NV .. Fontana, CA Sales Districts .. Southern California .. Northern California .. Portland, OR .. Seattle, WA .. Denver, CO West JHBP USA — Total Business Mix FY07 Volume = 2.1bsf North South Interiors FY07 Volume = 339mmsf


(PAGE)
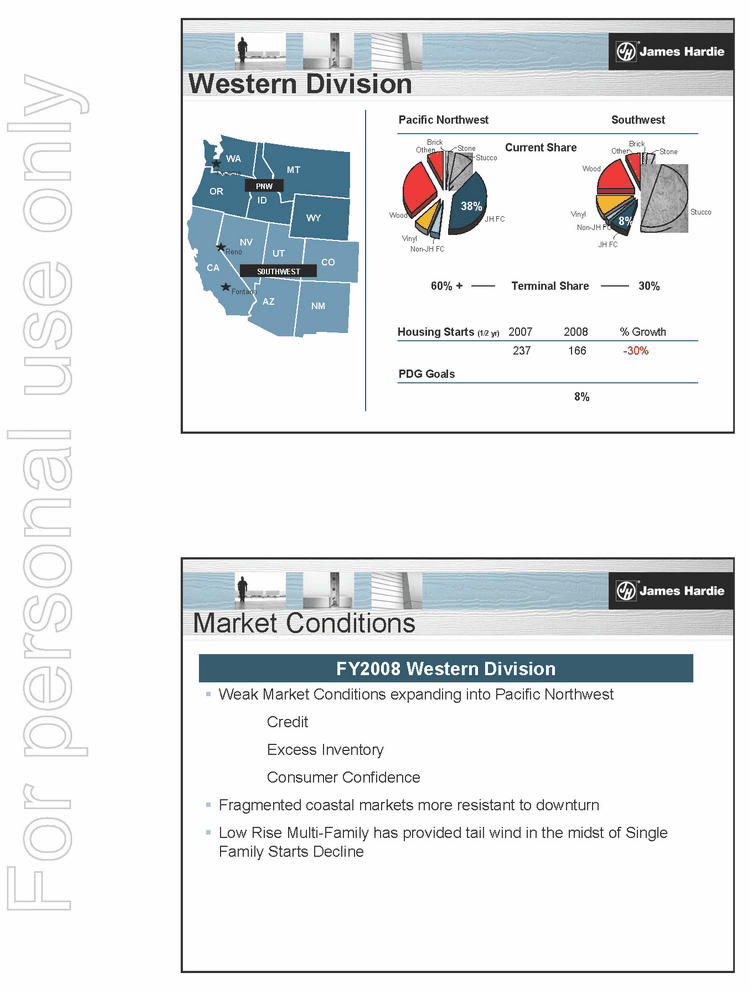
Western Division Housing Starts (1/2 yr) 2007 2008 % Growth 237 166 -30% PDG Goals 8% Pacific Northwest Southwest JH FC Vinyl Wood Non-JH FC Stucco Stone Brick Other Current Share 38% Vinyl Stucco Wood Brick Other Stone JH FC Non-JH FC 8% 60% + Terminal Share 30% CA NV AZ UT NM CO OR WA ID MT WY PNW CA S0UTHWEST Fontana Tacoma Reno CA NV AZ UT NM CO OR WA ID MT WY PNW CA S0UTHWEST Fontana Tacoma Reno CA NV AZ UT NM CO OR WA ID MT WY PNW CA S0UTHWEST Fontana Tacoma Reno CA NV AZ UT NM CO OR WA ID MT WY PNW CA S0UTHWEST Fontana Tacoma Reno Market Conditions FY2008 Western Division .. Weak Market Conditions expanding into Pacific Northwest Credit Excess Inventory Consumer Confidence .. Fragmented coastal markets more resistant to downturn .. Low Rise Multi-Family has provided tail wind in the midst of Single Family Starts Decline


(PAGE)
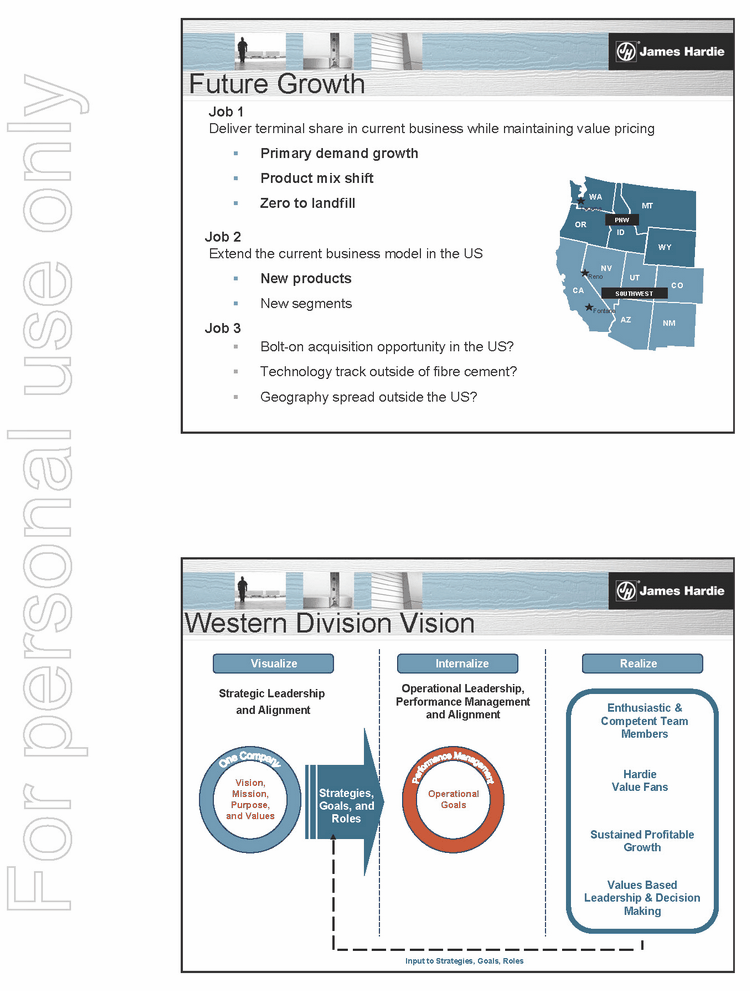
Future Growth Job 1 Deliver terminal share in current business while maintaining value pricing .. Primary demand growth .. Product mix shift .. Zero to landfill Job 2 Extend the current business model in the US .. New products .. New segments Job 3 .. Bolt-on acquisition opportunity in the US? .. Technology track outside of fibre cement? .. Geography spread outside the US? CA NV AZ UT NM CO OR WA ID MT WY PNW CA S0UTHWEST Fontana Tacoma Reno CA NV AZ UT NM CO OR WA ID MT WY PNW CA S0UTHWEST Fontana Tacoma Reno CA NV AZ UT NM CO OR WA ID MT WY PNW CA S0UTHWEST Fontana Tacoma Reno CA NV AZ UT NM CO OR WA ID MT WY PNW CA S0UTHWEST Fontana Tacoma Reno Western Division Vision Strategic Leadership and Alignment Vision, Mission, Purpose, and Values Strategies, Goals, and Roles Operational Leadership, Performance Management and Alignment Operational Goals Visualize Internalize Realize Enthusiastic & Competent Team Members Hardie Value Fans Sustained Profitable Growth Values Based Leadership & Decision Making Input to Strategies, Goals, Roles


(PAGE)
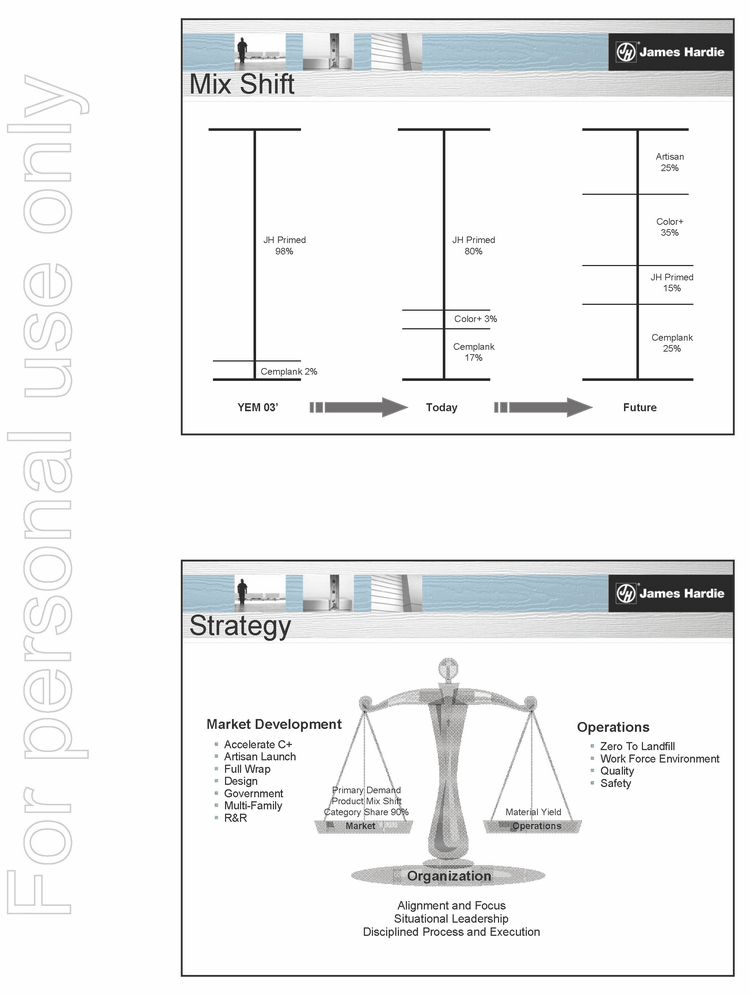
Mix Shift Cemplank 2% JH Primed 98% Artisan 25% Color+ 35% JH Primed 15% Cemplank 25% Today Future Cemplank 17% JH Primed 80% YEM 03’ Color+ 3% Strategy .. Accelerate C+         .. Artisan Launch .. Full Wrap .. Design .. Government .. Multi-Family .. R&R .. Zero To Landfill .. Work Force Environment .. Quality .. Safety Market Development Operations Operations Organization Alignment and Focus Situational Leadership Disciplined Process and Execution Market Primary Demand Product Mix Shift Category Share 90% Material Yield


(PAGE)
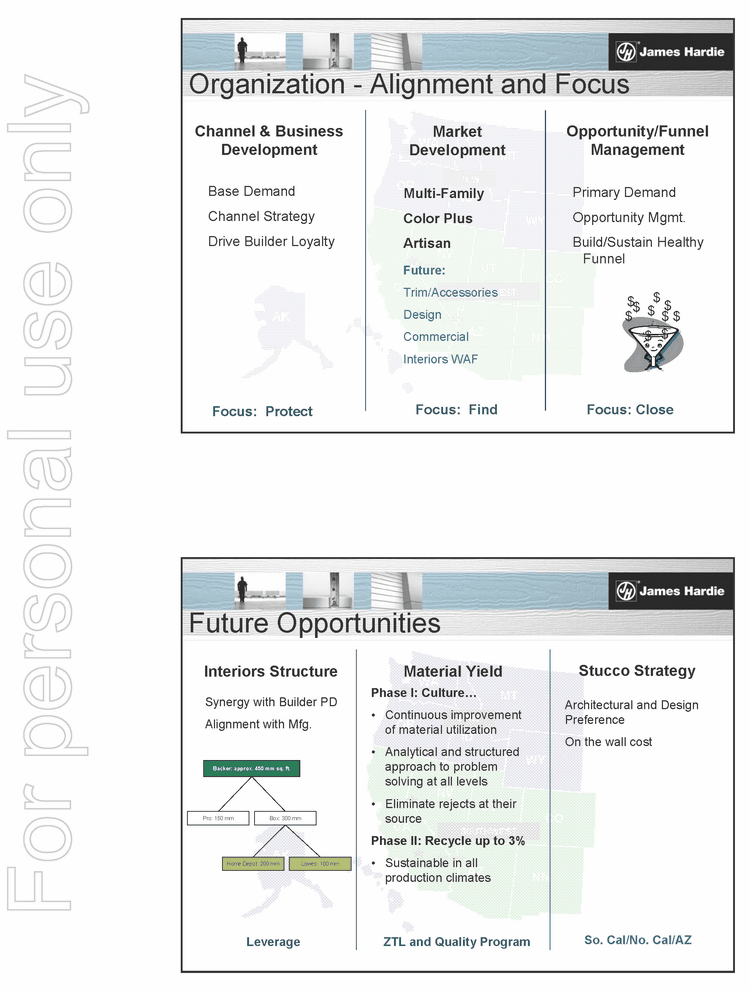
Organization — Alignment and Focus CA CA NV AZ UT NM CO OR WA ID MT WY PNW AK HI CA S0UTHWEST Fontana Tacoma Reno Market Development Channel & Business Development Opportunity/Funnel Management Primary Demand Opportunity Mgmt. Build/Sustain Healthy Funnel Multi-Family Color Plus Artisan Future: Trim/Accessories Design Commercial Interiors WAF Base Demand Channel Strategy Drive Builder Loyalty $ $ $ $ $ $ $ $ $ $ Focus: Protect Focus: Find Focus: Close Future Opportunities CA CA NV AZ UT NM CO OR WA ID MT WY PNW AK HI CA S0UTHWEST Fontana Tacoma Reno Interiors Structure Material Yield Stucco Strategy Synergy with Builder PD Alignment with Mfg. Architectural and Design Preference On the wall cost Phase I: Culture... Continuous improvement of material utilization Analytical and structured approach to problem solving at all levels Eliminate rejects at their source Phase II: Recycle up to 3% Sustainable in all production climates Leverage ZTL and Quality Program So. Cal/No. Cal/AZ Backer: approx. 450 mm sq. ft. Pro: 150 mm Box: 300 mm Home Depot: 200 mm Lowes: 100 mm Backer: approx. 450 mm sq. ft. Pro: 150 mm Box: 300 mm Home Depot: 200 mm Lowes: 100 mm


(PAGE)
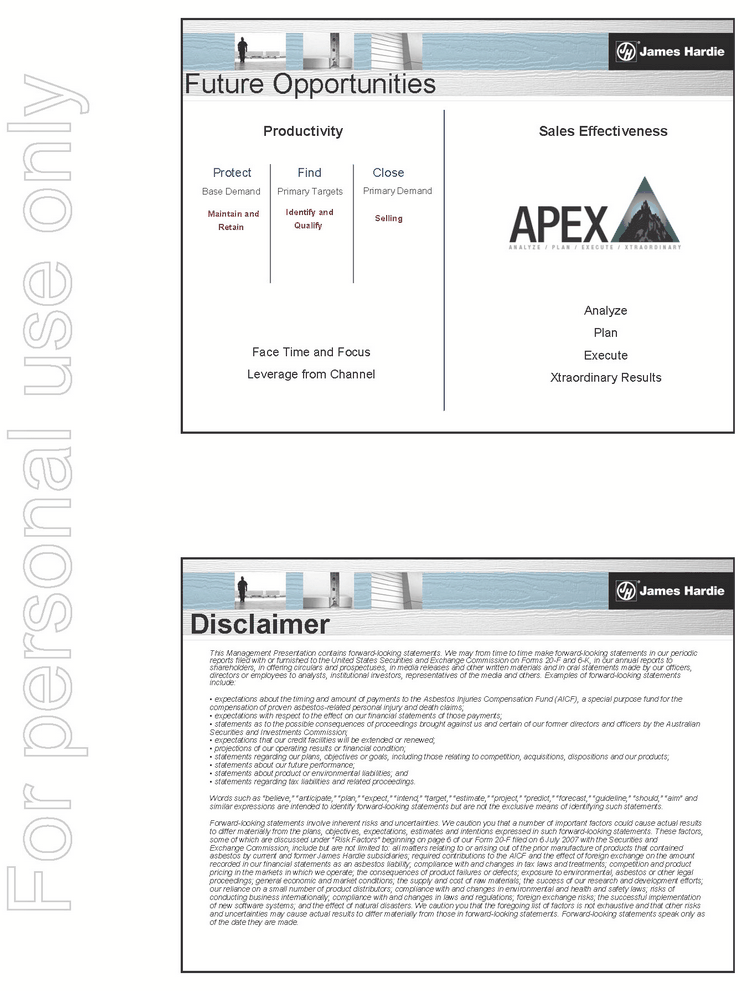
Future Opportunities Productivity Sales Effectiveness Face Time and Focus Leverage from Channel Analyze Plan Execute Xtraordinary Results Protect Find Base Demand Close Primary Targets Primary Demand Maintain and Retain Identify and Qualify Selling Disclaimer This Management Presentation contains forward-looking statements. We may from time to time make forward-looking statements in our periodic reports filed with or furnished to the United States Securities and Exchange Commission on Forms 20-F and 6-K, in our annual reports to shareholders, in offering circulars and prospectuses, in media releases and other written materials and in oral statements made by our officers, directors or employees to analysts, institutional investors, representatives of the media and others. Examples of forward-looking statements include: expectations about the timing and amount of payments to the Asbestos Injuries Compensation Fund (AICF), a special purpose fund for the compensation of proven asbestos-related personal injury and death claims; expectations with respect to the effect on our financial statements of those payments; statements as to the possible consequences of proceedings brought against us and certain of our former directors and officers by the Australian Securities and Investments Commission; expectations that our credit facilities will be extended or renewed; projections of our operating results or financial condition; statements regarding our plans, objectives or goals, including those relating to competition, acquisitions, dispositions and our products; statements about our future performance; statements about product or environmental liabilities; and statements regarding tax liabilities and related proceedings. Words such as “believe,” “anticipate,” “plan,” “expect,” “intend,” “target,” “estimate,” “project,” “predict,” “forecast,” “guideline,” “should,” “aim” and similar expressions are intended to identify forward-looking statements but are not the exclusive means of identifying such statements. Forward-looking statements involve inherent risks and uncertainties. We caution you that a number of important factors could cause actual results to differ materially from the plans, objectives, expectations, estimates and intentions expressed in such forward-looking statements. These factors, some of which are discussed under “Risk Factors” beginning on page 6 of our Form 20-F filed on 6 July 2007 with the Securities and Exchange Commission, include but are not limited to: all matters relating to or arising out of the prior manufacture of products that contained asbestos by current and former James Hardie subsidiaries; required contributions to the AICF and the effect of foreign exchange on the amount recorded in our financial statements as an asbestos liability; compliance with and changes in tax laws and treatments; competition and product pricing in the markets in which we operate; the consequences of product failures or defects; exposure to environmental, asbestos or other legal proceedings; general economic and market conditions; the supply and cost of raw materials; the success of our research and development efforts; our reliance on a small number of product distributors; compliance with and changes in environmental and health and safety laws; risks of conducting business internationally; compliance with and changes in laws and regulations; foreign exchange risks; the successful implementation of new software systems; and the effect of natural disasters. We caution you that the foregoing list of factors is not exhaustive and that other risks and uncertainties may cause actual results to differ materially from those in forward-looking statements. Forward-looking statements speak only as of the date they are made.


(PAGE)
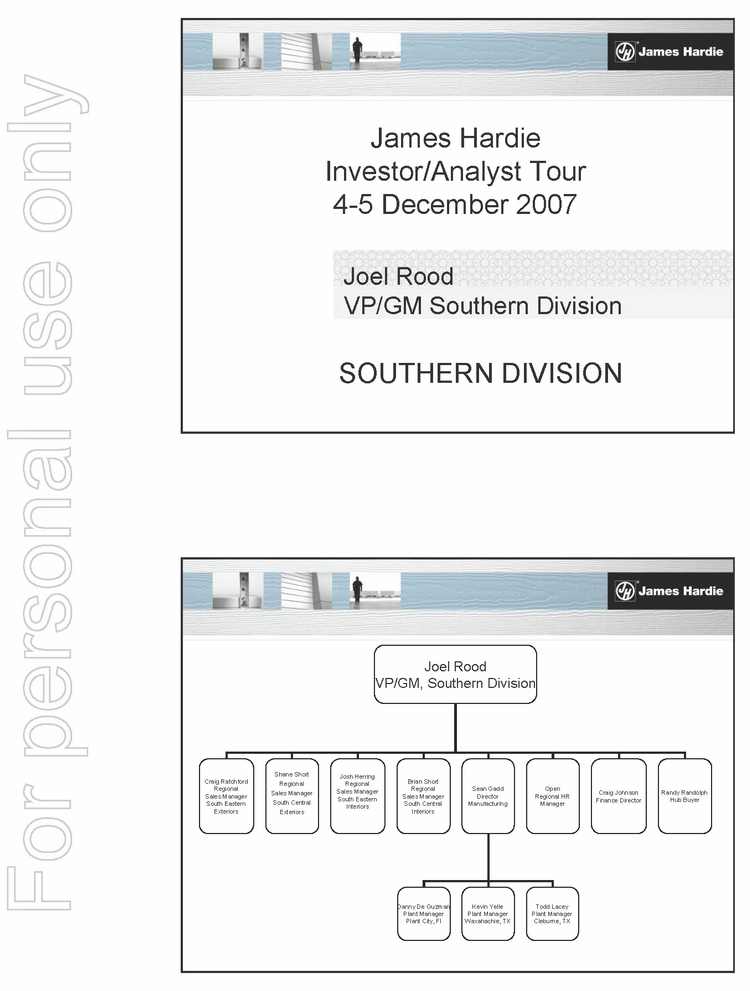
Joel Rood VP/GM Southern Division James Hardie Investor/Analyst Tour 4-5 December 2007 SOUTHERN DIVISION Joel Rood VP/GM, Southern Division Craig Ratchford Regional Sales Manager South Eastern Exteriors Shane Short Regional Sales Manager South Central Exteriors Josh Herring Regional Sales Manager South Eastern Interiors Open Regional HR Manager Craig Johnson Finance Director Sean Gadd Director Manufacturing Brian Short Regional Sales Manager South Central Interiors Randy Randolph Hub Buyer Danny De Guzman Plant Manager Plant City, Fl Kevin Yelle Plant Manager Waxahachie, TX Todd Lacey Plant Manager Cleburne, TX


(PAGE)
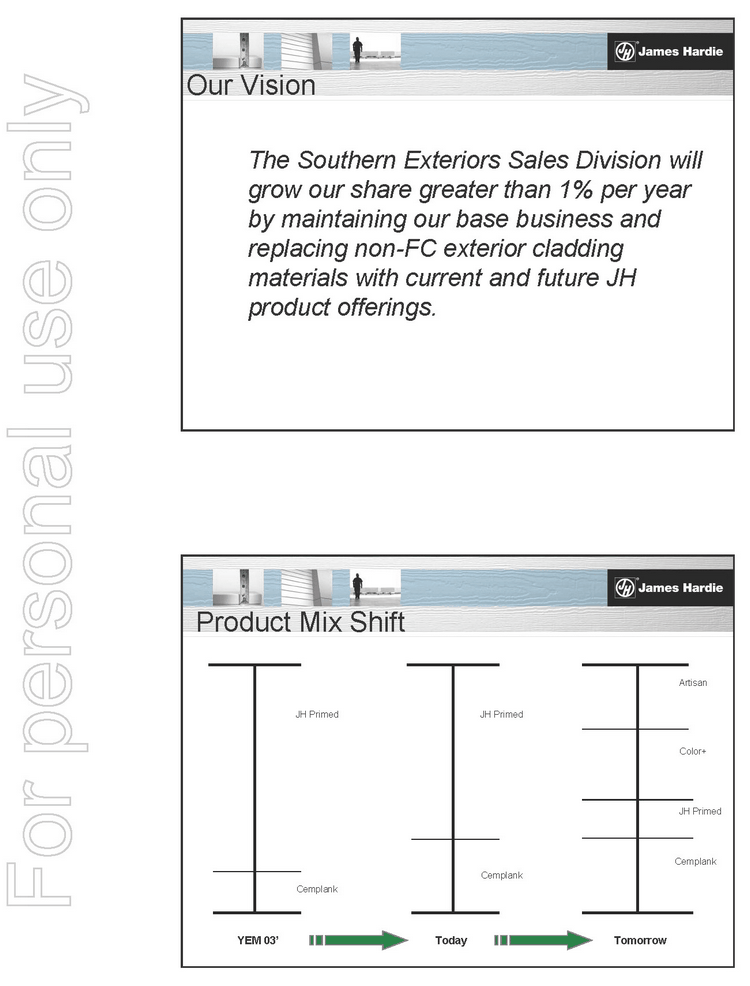
Our Vision The Southern Exteriors Sales Division will grow our share greater than 1% per year by maintaining our base business and replacing non-FC exterior cladding materials with current and future JH product offerings. Product Mix Shift Cemplank JH Primed Artisan Color+ JH Primed Cemplank Today Tomorrow Cemplank JH Primed YEM 03’


(PAGE)
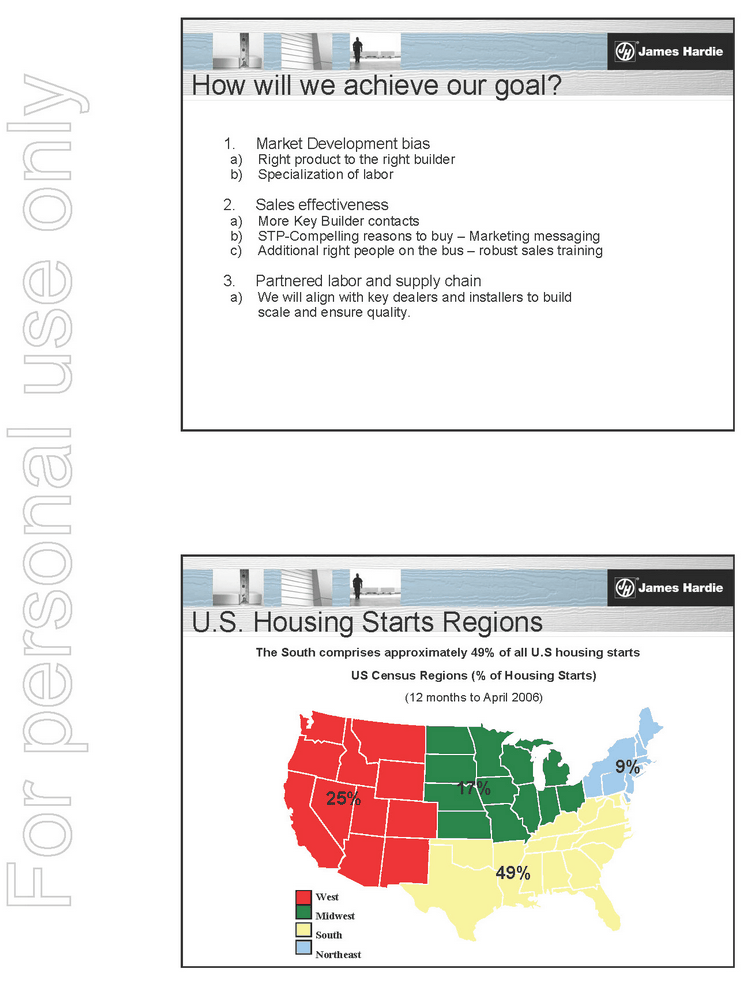
How will we achieve our goal? 1. Market Development bias a) Right product to the right builder b) Specialization of labor 2. Sales effectiveness a) More Key Builder contacts b) STP-Compelling reasons to buy — Marketing messaging c) Additional right people on the bus — robust sales training 3. Partnered labor and supply chain a) We will align with key dealers and installers to build scale and ensure quality. 17% 49% 25% NY West Midwest South Northeast 9% US Census Regions (% of Housing Starts) (12 months to April 2006) U.S. Housing Starts Regions The South comprises approximately 49% of all U.S housing starts


(PAGE)
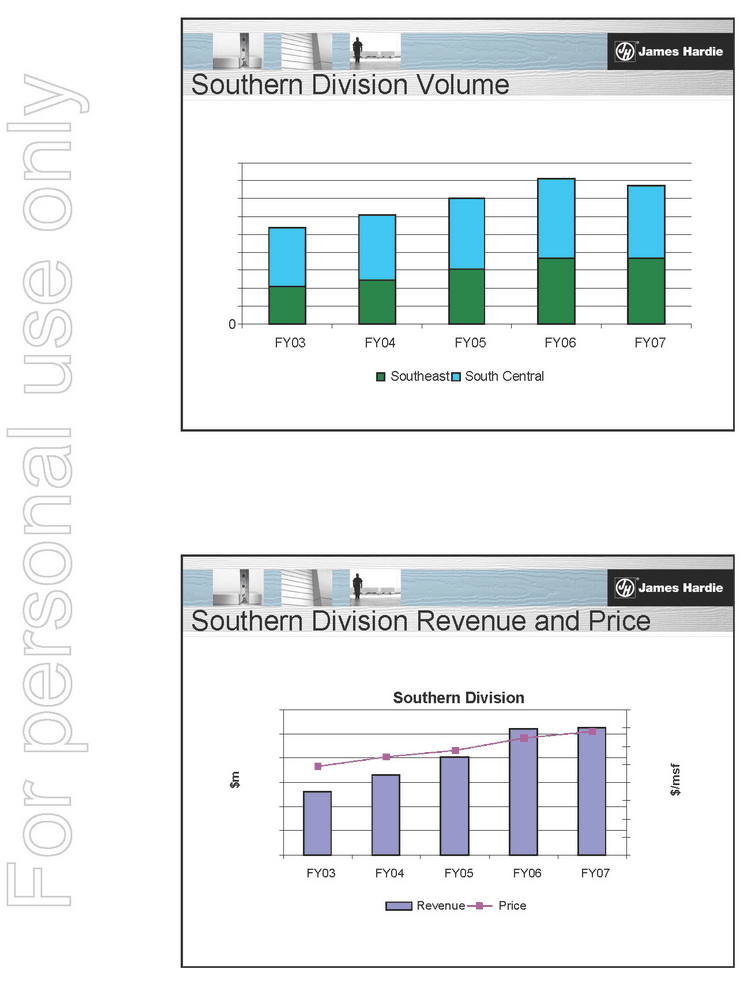
Southern Division Volume 0 FY03 FY04 FY05 FY06 FY07 Southeast South Central Southern Division Revenue and Price Southern Division FY03 FY04 FY05 FY06 FY07 $m $/msf Revenue Price


(PAGE)
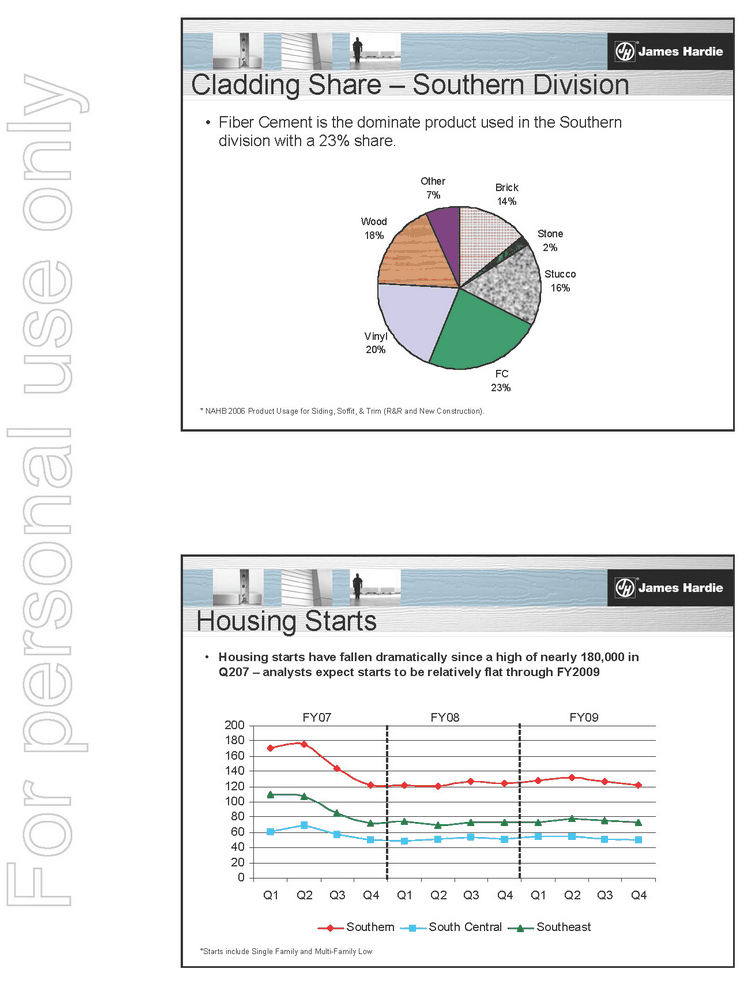
Cladding Share — Southern Division Fiber Cement is the dominate product used in the Southern division with a 23% share. Brick 14% Stucco 16% FC 23% Vinyl 20% Wood 18% Other 7% Stone 2% * NAHB 2006 Product Usage for Siding, Soffit, & Trim (R&R and New Construction). Housing Starts Housing starts have fallen dramatically since a high of nearly 180,000 in Q207 — analysts expect starts to be relatively flat through FY2009 *Starts include Single Family and Multi-Family Low 0 20 40 60 80 100 120 140 160 180 200 Q1 Q2 Q3 Q4 Q1 Q2 Q3 Q4 Q1 Q2 Q3 Q4 Southern South Central Southeast FY07 FY08 FY09


(PAGE)
Primary Demand Growth — South Southern Division -30% -20% -10% 0% 10% 20% 30% Q106 Q206 Q306 Q406 Q107 Q207 Q307 Q407 Q108 Q208 JHBP Growth NC/R&R Growth Southern Division — Medium Term Outlook Emerging Opportunities Strategies Be the low cost provider in the marketplace Secure our base business Offer choices to match needs 2. Cemboard — Right product to the right builder and grab low hanging fruit. Engage the Custom segment Provide a premium product to differentiate Consumer Research to help change builder preference for exterior design 3. Artisan — position Artisan at the top of the market to accelerate design change Enhance the value delivered to the builder....The question is not: do you buy JH products, but which JH product do you buy? Shift business to Color+ in SF / R&R / MF SF — target Step Up segment builders and key production partners Maximize marketing spend to influence decision makers 1. Primed to Color+ — provide C+ to existing customers to improve performance and protect existing market share


(PAGE)
Southeast Region District Breakdown District Strategies and Performance Georgia .. High S-Curve .. Moderate PDG growth .. Higher Cemplank share .. C+, Artisan, accessory growth .. Brick and vinyl opportunities .. Rural market development plan Mid-South .. Mid S-Curve .. Strong PDG growth .. Moderate Cemplank Share .. Strong C+ and accessory growth .. Artisan launch pending .. Brick and vinyl opportunity inland .. Rural market development plan .. Katrina Rebuild slow .. Municipal focus Florida .. Low S-Curve .. Strong PDG growth .. Low Cemplank Share .. C+ early development .. Multi-Family presence .. Direct-to-block helping penetration Florida Mid-South Georgia Market Maturity


(PAGE)
SC Region District Breakdown District Strategies and Performance South Texas .. High S-Curve .. Low to moderate PDG growth .. High accessory % of sales .. Moderate Cemplank share         .. Color+ early stages (SF / R&R) .. Artisan Launched Nov North Texas .. Mid to High S-Curve .. Moderate PDG growth .. Up market opportunity (brick) .. Design change for further growth .. Moderate Cemplank Share .. Color+ early stages .. Artisan Launched Nov South Plains .. Low S-Curve .. Moderate PDG growth .. Up market opportunity (brick) .. C+ early stages .. Rural market development S. Plains North TX South TX Market Maturity


(PAGE)
Competitor Overview MAXI Overview .. Largest share of cement bonded particle board in Japan         .. Specialty siding products and trim accents .. Shake, brick and stone textures .. U.S. distribution through Nichiha USA Inc., Atlanta GA and PPW .. Sells through loose dealer network.         .. Macon plant now running .. Division of Saint Gobain — Multinational mfr. building materials, glass, highperformance materials; No.1 bldg. materials distributor in Europe; HQ France .. Construction Products Business Sector includes Insulation, Pipe, Industrial Mortars, Gypsum products, Exterior Products including vinyl & FC siding .. Two fiber cement siding plants in Roaring River, NC and White City, OR .. Third FC plant in Terre haute, IN; under construction .. Mexalit — manufacturer of Maxi products in Mexico, including siding & pipe .. New plant in Nuevo Laredo, Mexico. .. History of sales into Texas up to PNW (est.1% share) Summary 1. Market Development bias a) Right product to the right builder b) Specialization of labor 2. Sales effectiveness a) More Key Builder contacts b) STP-Compelling reasons to buy — Marketing messaging c) Additional right people on the bus — robust sales training 3. Partnered labor and supply chain a) We will align with key dealers and installers to build scale and ensure quality.


(PAGE)
Disclaimer This Management Presentation contains forward-looking statements. We may from time to time make forward-looking statements in our periodic reports filed with or furnished to the United States Securities and Exchange Commission on Forms 20-F and 6-K, in our annual reports to shareholders, in offering circulars and prospectuses, in media releases and other written materials and in oral statements made by our officers, directors or employees to analysts, institutional investors, representatives of the media and others. Examples of forward-looking statements include: expectations about the timing and amount of payments to the Asbestos Injuries Compensation Fund (AICF), a special purpose fund for the compensation of proven asbestos-related personal injury and death claims; expectations with respect to the effect on our financial statements of those payments; statements as to the possible consequences of proceedings brought against us and certain of our former directors and officers by the Australian Securities and Investments Commission; expectations that our credit facilities will be extended or renewed; projections of our operating results or financial condition; statements regarding our plans, objectives or goals, including those relating to competition, acquisitions, dispositions and our products; statements about our future performance; statements about product or environmental liabilities; and statements regarding tax liabilities and related proceedings. Words such as “believe,” “anticipate,” “plan,” “expect,” “intend,” “target,” “estimate,” “project,” “predict,” “forecast,” “guideline,” “should,” “aim” and similar expressions are intended to identify forward-looking statements but are not the exclusive means of identifying such statements. Forward-looking statements involve inherent risks and uncertainties. We caution you that a number of important factors could cause actual results to differ materially from the plans, objectives, expectations, estimates and intentions expressed in such forward-looking statements. These factors, some of which are discussed under “Risk Factors” beginning on page 6 of our Form 20-F filed on 6 July 2007 with the Securities and Exchange Commission, include but are not limited to: all matters relating to or arising out of the prior manufacture of products that contained asbestos by current and former James Hardie subsidiaries; required contributions to the AICF and the effect of foreign exchange on the amount recorded in our financial statements as an asbestos liability; compliance with and changes in tax laws and treatments; competition and product pricing in the markets in which we operate; the consequences of product failures or defects; exposure to environmental, asbestos or other legal proceedings; general economic and market conditions; the supply and cost of raw materials; the success of our research and development


(PAGE)
Grant Gustafson VP/GM Interiors and Business Development James Hardie Investor/Analyst Tour 4-5 December 2007 Interiors Overview James Hardie Interiors: Track Record of Growth FY97 FY98 FY99 FY00 FY01 FY02 FY03 FY04 FY05 FY06 FY07 mmsf .. Decade of solid, uninterrupted growth


(PAGE)
.. Primary product (1/4”) still growing at healthy pace .. 1/2” product growing even faster Growth By Product Product Life Cycle FY98 FY99 FY00 FY01 FY02 FY03 FY04 FY05 FY06 FY07 1/4” Volume Growth FY98 FY99 FY00 FY01 FY02 FY03 FY04 FY05 FY06 FY07 1/2” Volume Growth Market Share .. Growth fuelled by strong market and JHBP market share gain U.S. BackerBoard Market * Other JHBP Other JHBP Other JHBP Other JHBP 2003 2004 2005 2006 0.88 BSF 0.96 BSF 1.07 BSF 1.14 BSF 2003E 2004E 2005E 2006E U.S. BackerBoard Market * * All Figures are Calendar Year, estimated based on 3rd party study


(PAGE)
End User Segmentation .. Repair & Remodel represents a significant portion of our volume New Construction R&R Estimated JHBP Interiors Volume Split R&R Market Growth * Based on U.S. Census Bureau Data for 2003-2007; GSJBW data for 2008-2010; Data has been adjusted for CPI -20% - -15% -10% -5% 0% 5% 10% 15% 2003 2004 2005 2006 2007 1st Half 2007E 2008E 2009E 2010E R&R Market Growth


(PAGE)
Share Driver: Product Features 1/4” Product (substrate for tile floors, especially in wet areas) .. Leading market share .. Greater compressive & flexural strength .. Cement, but lighter & easier to handle than traditional cement boards .. EZ Grid recessed fastener pattern .. Moldblock™ technology 1/2” Product (wet area tile substrate designed for wall use) .. Also used on floors where height truly needed .. Six lbs lighter vs. glass mesh 3’ x 5’ cement sheets .. Smooth surface can be painted or papered .. Moldblock technology .. Superior workability — cuts cleanly and easily Share Driver: Advantages vs. Competitive Products All Other Cement Based All Products 100% The Market Prefers Cement Backerboard Other Cement Based (Primarily Glass Mesh) James Hardie Cement Products Only 100% Cement Competition is Primarily Glass Mesh .. “All Other” is primarily Gypsumbased product .. Market prefers cement over gypsum for wet area use .. HardieBacker more user friendly vs. glass mesh


(PAGE)
.. Most innovative brand in the business HardieBacker is the next generation cement board · Industry innovator (first 1/4” cement board, Moldblock, EZ Grid) .. Leadership position Brand strength and market acceptance as the leader Multiple plants manufacturing backerboard; scale/learning curve plus logistics cost advantages .. Only dedicated sales force in the industry · Focused sales approach that competitors do not possess Share Driver: Company-Level Competitive Advantages Strategic Direction .. Aligned our Big Box and Pro Interiors sales forces under united regional management Superior coordination Leverage higher level selling skills of pro reps with select big box R&R contractors .. Shifted our sales coverage toward large volume metro areas where our share lags our national average .. Implemented new sales and sales management approach Customer targeting through sales execution .. Focused on our highest potential market/product opportunities Converting traditional product holdouts (especially 1/2” glass mesh on floors) Exploiting greenboard opportunity in light of IRC code change Cost structure improvements JHBP Sales Channels Big Box Pro Tile Lumber Gypsum


(PAGE)
Organization Change Going Forward Field Sales Divisional Structure — Sales/manufacturing under one roof — Exterior/Interiors customer sharing — Staff development Product Management, Marketing, Big Box Account Management Remain Centralized Key Challenges/ Opportunities .. Building share in down, relatively price sensitive, market .. Managing Big Box relationships in same .. Next generation floor product


(PAGE)
ARTISAN Artisan Launch Overview .. Artisan Plank is manufactured at Reno plant .. Launched product in Atlanta in September .. Over 20 homes installed today (mostly in Southeast), including 5 model homes .. Quality feedback ~Very Positive .. Geographic Expansion Pacific Northwest ~ First shipment in October Texas ~ First shipment in October


(PAGE)
Artisan Product Summary 4"/ 6” width, 10’ length 1.5” thickness Also Launched Artisan Accent Trim Price 2x x Nil T&G ends Beveled Back Nail line Features Textures Smooth, Texture Various Thickness 5/8” (16mm) 5/16” Length 12’ 12’ Width 51/4”, 71/4” 81/4” 51/4”, 61/4”, 71/4”, 81/4”, 12” Artisan™ Hardiplank™ Disclaimer This Management Presentation contains forward-looking statements. We may from time to time make forward-looking statements in our periodic reports filed with or furnished to the United States Securities and Exchange Commission on Forms 20-F and 6-K, in our annual reports to shareholders, in offering circulars and prospectuses, in media releases and other written materials and in oral statements made by our officers, directors or employees to analysts, institutional investors, representatives of the media and others. Examples of forward-looking statements include: expectations about the timing and amount of payments to the Asbestos Injuries Compensation Fund (AICF), a special purpose fund for the compensation of proven asbestos-related personal injury and death claims; expectations with respect to the effect on our financial statements of those payments; statements as to the possible consequences of proceedings brought against us and certain of our former directors and officers by the Australian Securities and Investments Commission; expectations that our credit facilities will be extended or renewed; projections of our operating results or financial condition; statements regarding our plans, objectives or goals, including those relating to competition, acquisitions, dispositions and our products; statements about our future performance; statements about product or environmental liabilities; and statements regarding tax liabilities and related proceedings. Words such as “believe,” “anticipate,” “plan,” “expect,” “intend,” “target,” “estimate,” “project,” “predict,” “forecast,” “guideline,” “should,” “aim” and similar expressions are intended to identify forward-looking statements but are not the exclusive means of identifying such statements. Forward-looking statements involve inherent risks and uncertainties. We caution you that a number of important factors could cause actual results to differ materially from the plans, objectives, expectations, estimates and intentions expressed in such forward-looking statements. These factors, some of which are discussed under “Risk Factors” beginning on page 6 of our Form 20-F filed on 6 July 2007 with the Securities and Exchange Commission, include but are not limited to: all matters relating to or arising out of the prior manufacture of products that contained asbestos by current and former James Hardie subsidiaries; required contributions to the AICF and the effect of foreign exchange on the amount recorded in our financial statements as an asbestos liability; compliance with and changes in tax laws and treatments; competition and product pricing in the markets in which we operate; the consequences of product failures or defects; exposure to environmental, asbestos or other legal proceedings; general economic and market conditions; the supply and cost of raw materials; the success of our research and development efforts; our reliance on a small number of product distributors; compliance with and changes in environmental and health and safety laws; risks of conducting business internationally; compliance with and changes in laws and regulations; foreign exchange risks; the successful implementation of new software systems; and the effect of natural disasters. We caution you that the foregoing list of factors is not exhaustive and that other risks and uncertainties may cause actual results to differ materially from those i n forward-looking statements. Forward-looking statements speak only as of the date they are made.