Exhibit 99.6 James Hardie Philippines Jon Cook, Finance Director - APAC Asia Pacific Investor & Analyst Tour Sunshine Coast, Australia June 25-26, 2018
CAUTIONARY NOTE ON FORWARD-LOOKING STATEMENTS This Management Presentation contains forward-looking statements. James Hardie Industries plc (the “Company”) may from time to time make forward-looking statements in its periodic reports filed with or furnished to the Securities and Exchange Commission, on Forms 20-F and 6-K, in its annual reports to shareholders, in offering circulars, invitation memoranda and prospectuses, in media releases and other written materials and in oral statements made by the Company’s officers, directors or employees to analysts, institutional investors, existing and potential lenders, representatives of the media and others. Statements that are not historical facts are forward-looking statements and such forward-looking statements are statements made pursuant to the Safe Harbor Provisions of the Private Securities Litigation Reform Act of 1995. Examples of forward-looking statements include: • statements about the Company’s future performance; • projections of the Company’s results of operations or financial condition; • statements regarding the Company’s plans, objectives or goals, including those relating to strategies, initiatives, competition, acquisitions, dispositions and/or its products; • expectations concerning the costs associated with the suspension or closure of operations at any of the Company’s plants and future plans with respect to any such plants; • expectations concerning the costs associated with the significant capital expenditure projects at any of the Company’s plants and future plans with respect to any such projects; • expectations regarding the extension or renewal of the Company’s credit facilities including changes to terms, covenants or ratios; • expectations concerning dividend payments and share buy-backs; • statements concerning the Company’s corporate and tax domiciles and structures and potential changes to them, including potential tax charges; • statements regarding tax liabilities and related audits, reviews and proceedings; • statements regarding the possible consequences and/or potential outcome of legal proceedings brought against us and the potential liabilities, if any, associated with such proceedings; • expectations about the timing and amount of contributions to Asbestos Injuries Compensation Fund (AICF), a special purpose fund for the compensation of proven Australian asbestos-related personal injury and death claims; • expectations concerning the adequacy of the Company’s warranty provisions and estimates for future warranty-related costs; • statements regarding the Company’s ability to manage legal and regulatory matters (including but not limited to product liability, environmental, intellectual property and competition law matters) and to resolve any such pending legal and regulatory matters within current estimates and in anticipation of certain third-party recoveries; and • statements about economic conditions, such as changes in the US economic or housing recovery or changes in the market conditions in the Asia Pacific region, the levels of new home construction and home renovations, unemployment levels, changes in consumer income, changes or stability in housing values, the availability of mortgages and other financing, mortgage and other interest rates, housing affordability and supply, the levels of foreclosures and home resales, currency exchange rates, and builder and consumer confidence. PAGE 2
CAUTIONARY NOTE ON FORWARD-LOOKING STATEMENTS (continued) Words such as “believe,” “anticipate,” “plan,” “expect,” “intend,” “target,” “estimate,” “project,” “predict,” “forecast,” “guideline,” “aim,” “will,” “should,” “likely,” “continue,” “may,” “objective,” “outlook” and similar expressions are intended to identify forward-looking statements but are not the exclusive means of identifying such statements. Readers are cautioned not to place undue reliance on these forward-looking statements and all such forward-looking statements are qualified in their entirety by reference to the following cautionary statements. Forward-looking statements are based on the Company’s current expectations, estimates and assumptions and because forward-looking statements address future results, events and conditions, they, by their very nature, involve inherent risks and uncertainties, many of which are unforeseeable and beyond the Company’s control. Such known and unknown risks, uncertainties and other factors may cause actual results, performance or other achievements to differ materially from the anticipated results, performance or achievements expressed, projected or implied by these forward-looking statements. These factors, some of which are discussed under “Risk Factors” in Section 3 of the Form 20-F filed with the Securities and Exchange Commission on 22 May 2018, include, but are not limited to: all matters relating to or arising out of the prior manufacture of products that contained asbestos by current and former Company subsidiaries; required contributions to AICF, any shortfall in AICF and the effect of currency exchange rate movements on the amount recorded in the Company’s financial statements as an asbestos liability; the continuation or termination of the governmental loan facility to AICF; compliance with and changes in tax laws and treatments; competition and product pricing in the markets in which the Company operates; the consequences of product failures or defects; exposure to environmental, asbestos, putative consumer class action or other legal proceedings; general economic and market conditions; the supply and cost of raw materials; possible increases in competition and the potential that competitors could copy the Company’s products; reliance on a small number of customers; a customer’s inability to pay; compliance with and changes in environmental and health and safety laws; risks of conducting business internationally; compliance with and changes in laws and regulations; currency exchange risks; dependence on customer preference and the concentration of the Company’s customer base on large format retail customers, distributors and dealers; dependence on residential and commercial construction markets; the effect of adverse changes in climate or weather patterns; possible inability to renew credit facilities on terms favorable to the Company, or at all; acquisition or sale of businesses and business segments; changes in the Company’s key management personnel; inherent limitations on internal controls; use of accounting estimates; the integration of Fermacell into our business; and all other risks identified in the Company’s reports filed with Australian, Irish and US securities regulatory agencies and exchanges (as appropriate). The Company cautions you that the foregoing list of factors is not exhaustive and that other risks and uncertainties may cause actual results to differ materially from those referenced in the Company’s forward-looking statements. Forward-looking statements speak only as of the date they are made and are statements of the Company’s current expectations concerning future results, events and conditions. The Company assumes no obligation to update any forward-looking statements or information except as required by law. PAGE 3
Agenda 1. JH Strategy, country and economic overview 2. Market performance 3. Where do we play? 4. JH performance 5. What strategies & actions drive our success? PAGE 4
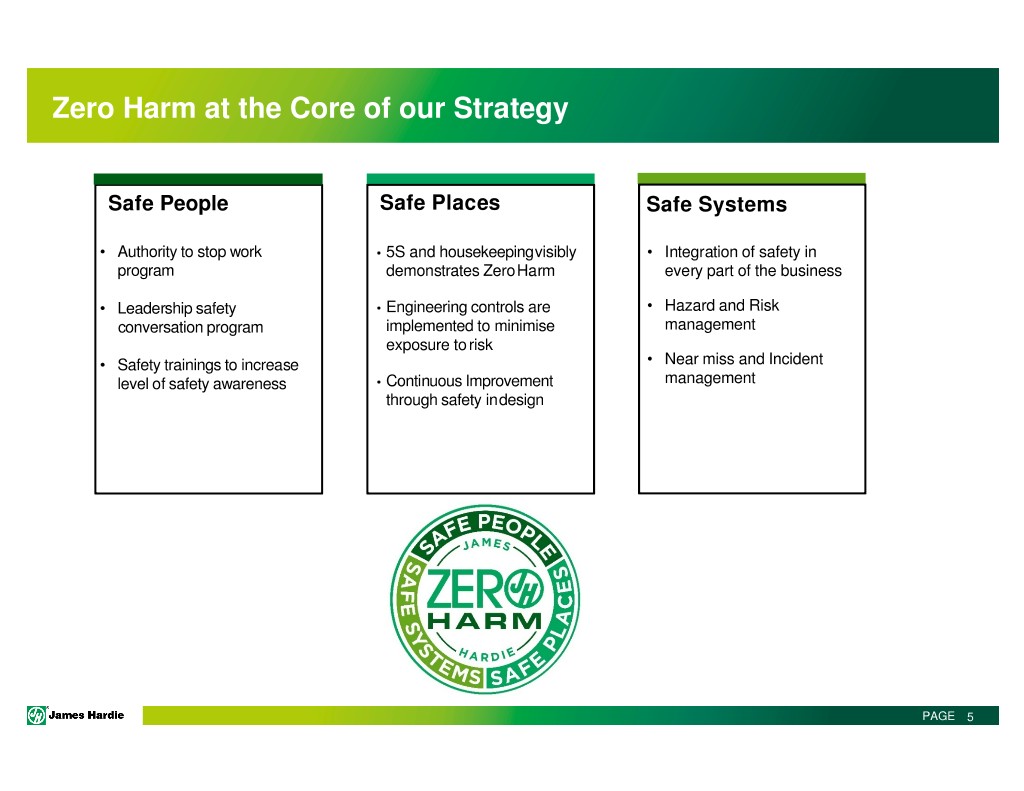
Zero Harm at the Core of our Strategy Safe People Safe Places Safe Systems • Authority to stop work • 5S and housekeepingvisibly • Integration of safety in program demonstrates ZeroHarm every part of the business • Leadership safety • Engineering controls are • Hazard and Risk conversation program implemented to minimise management exposure to risk • Safety trainings to increase • Near miss and Incident level of safety awareness • Continuous Improvement management through safety indesign PAGE 5
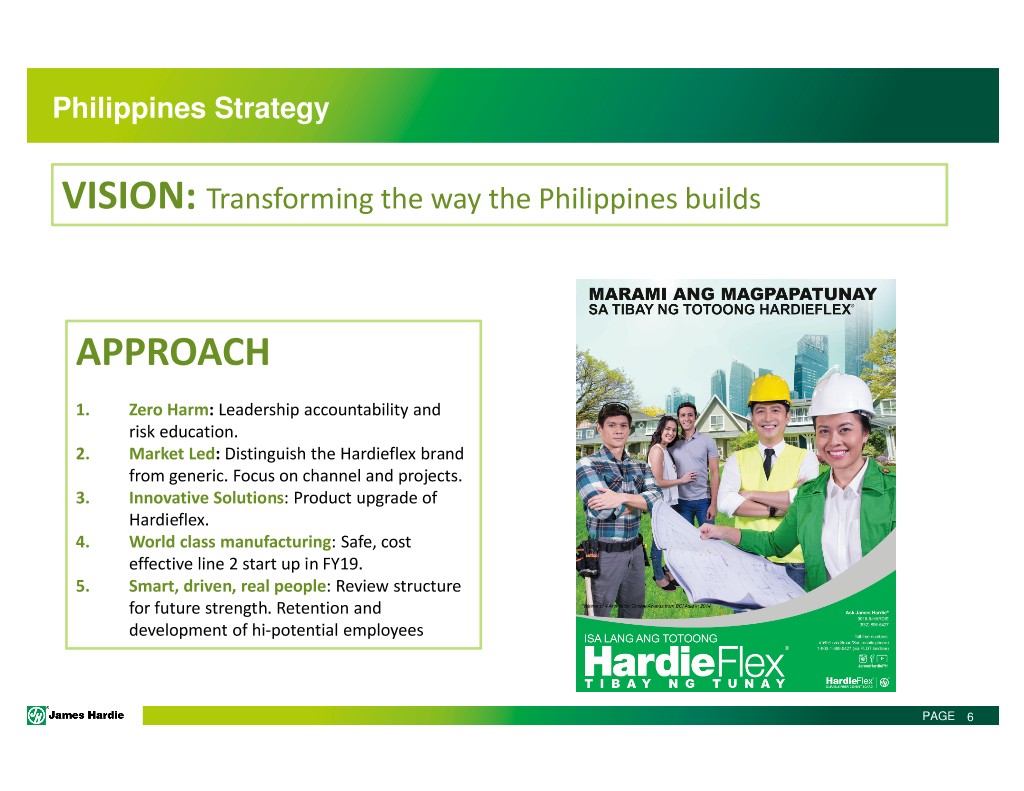
Philippines Strategy VISION: Transforming the way the Philippines builds APPROACH 1. Zero Harm : Leadership accountability and risk education. 2. Market Led : Distinguish the Hardieflex brand from generic. Focus on channel and projects. 3. Innovative Solutions : Product upgrade of Hardieflex. 4. World class manufacturing : Safe, cost effective line 2 start up in FY19. 5. Smart, driven, real people : Review structure for future strength. Retention and development of hi-potential employees PAGE 6
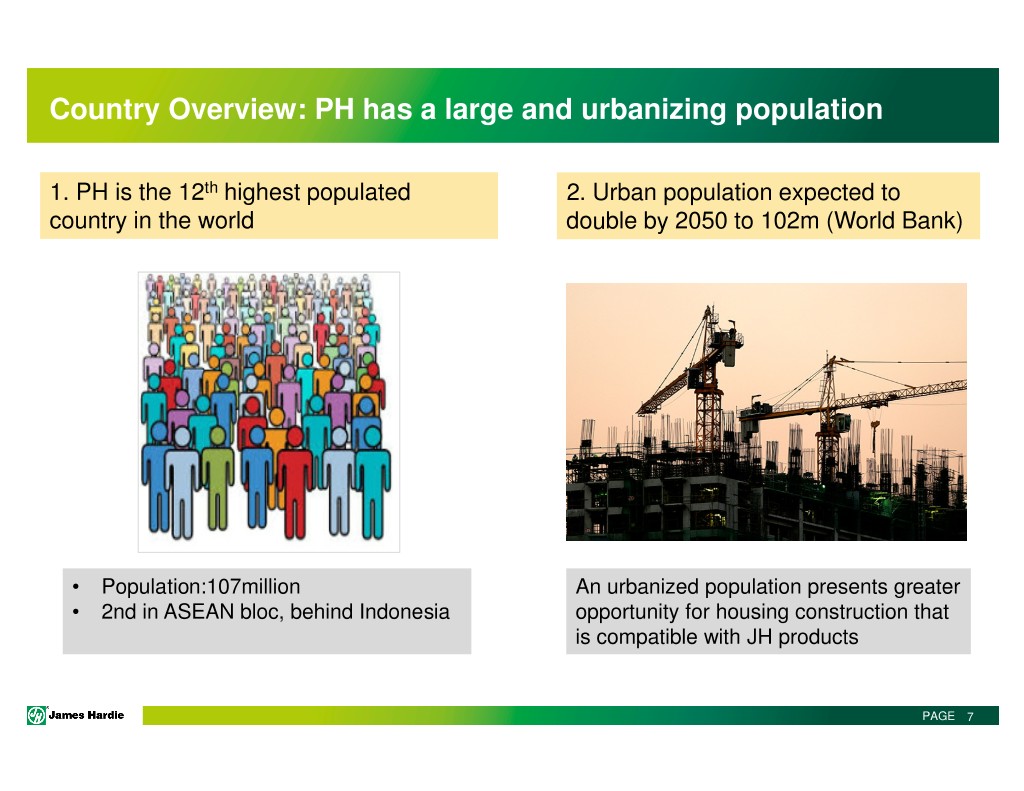
Country Overview: PH has a large and urbanizing population 1. PH is the 12 th highest populated 2. Urban population expected to country in the world double by 2050 to 102m (World Bank) • Population:107million An urbanized population presents greater • 2nd in ASEAN bloc, behind Indonesia opportunity for housing construction that is compatible with JH products PAGE 7
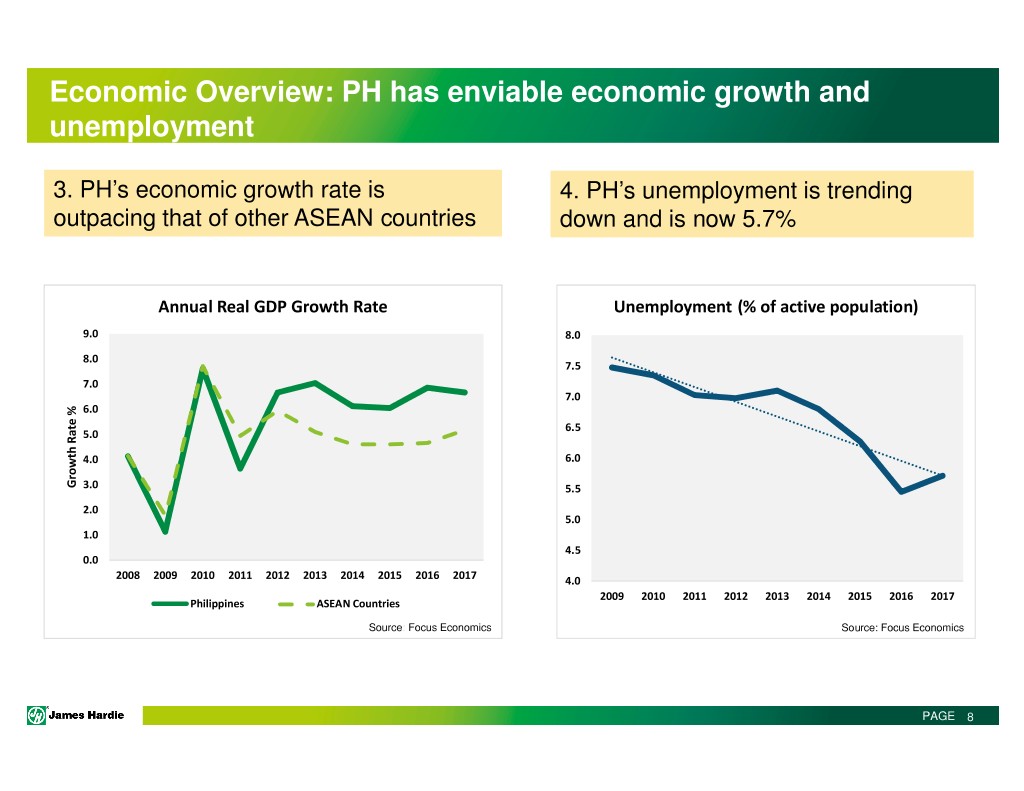
Economic Overview: PH has enviable economic growth and unemployment 3. PH’s economic growth rate is 4. PH’s unemployment is trending outpacing that of other ASEAN countries down and is now 5.7% Annual Real GDP Growth Rate Unemployment (% of active population) 9.0 8.0 8.0 7.5 7.0 7.0 6.0 6.5 5.0 4.0 6.0 Growth Rate % Rate Growth 3.0 5.5 2.0 5.0 1.0 4.5 0.0 2008 2009 2010 2011 2012 2013 2014 2015 2016 2017 4.0 2009 2010 2011 2012 2013 2014 2015 2016 2017 Philippines ASEAN Countries Source : Focus Economics Source: Focus Economics PAGE 8
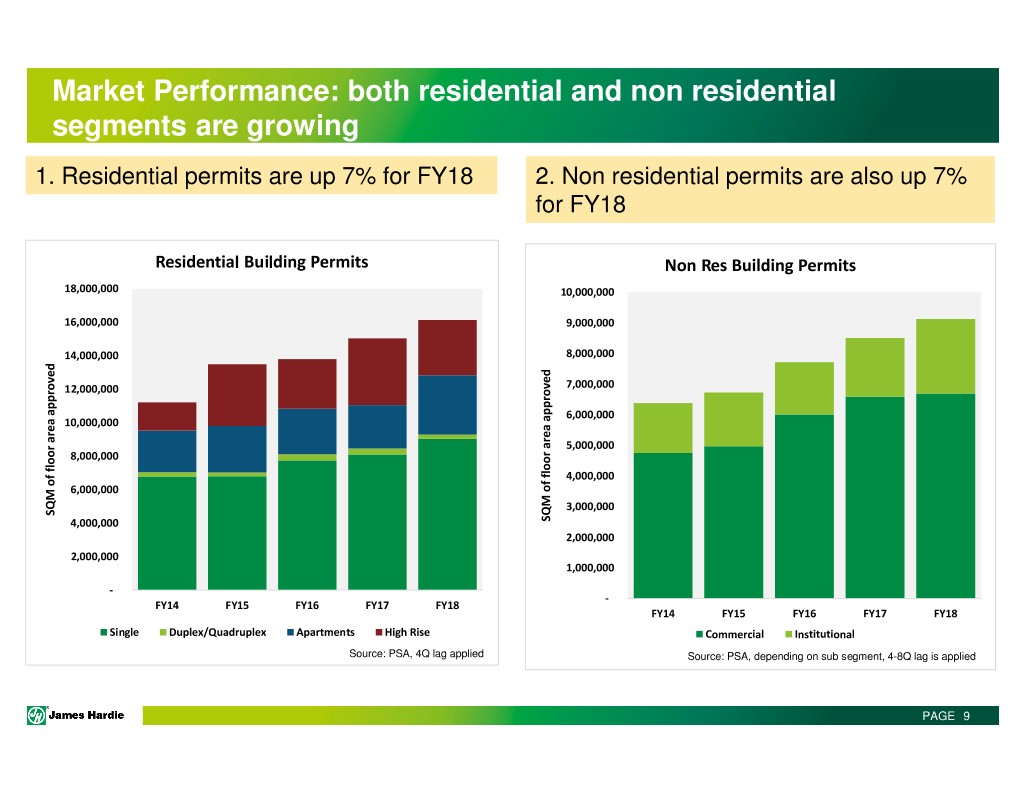
Market Performance: both residential and non residential segments are growing 1. Residential permits are up 7% for FY18 2. Non residential permits are also up 7% for FY18 Residential Building Permits Non Res Building Permits 18,000,000 10,000,000 16,000,000 9,000,000 14,000,000 8,000,000 12,000,000 7,000,000 6,000,000 10,000,000 5,000,000 8,000,000 4,000,000 6,000,000 3,000,000 SQM of floor area approved area floor of SQM 4,000,000 approved area floor of SQM 2,000,000 2,000,000 1,000,000 - - FY14 FY15 FY16 FY17 FY18 FY14 FY15 FY16 FY17 FY18 Single Duplex/Quadruplex Apartments High Rise Commercial Institutional Source: PSA, 4Q lag applied Source: PSA, depending on sub segment, 4-8Q lag is applied PAGE 9
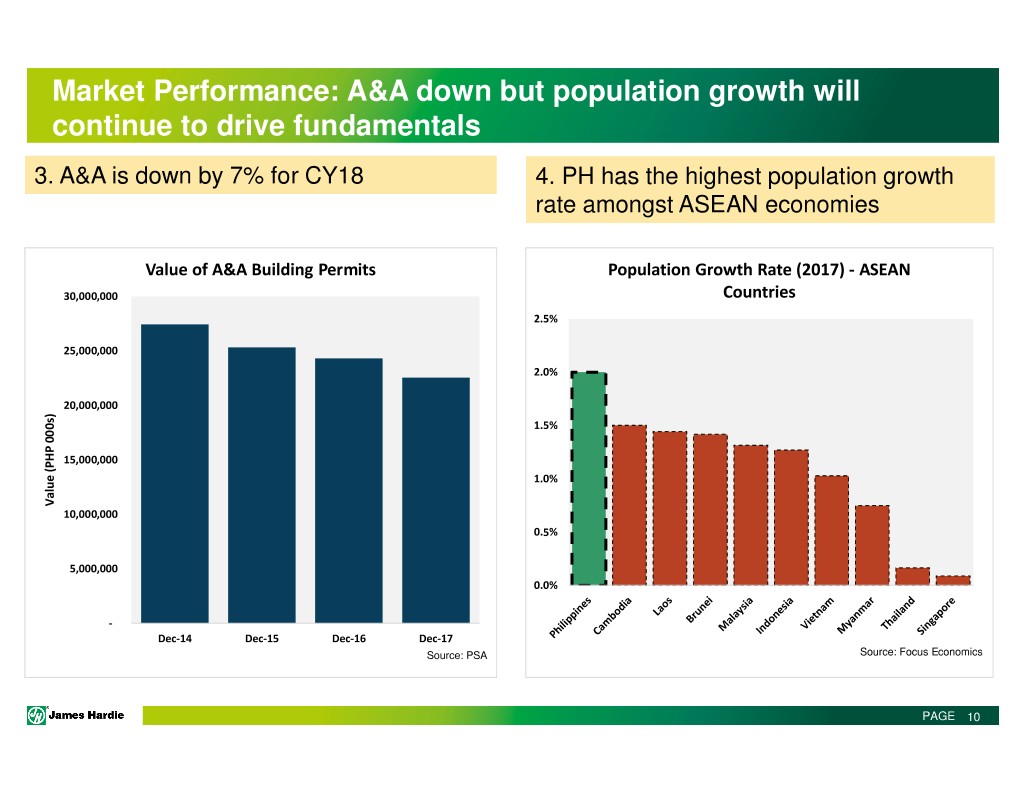
Market Performance: A&A down but population growth will continue to drive fundamentals 3. A&A is down by 7% for CY18 4. PH has the highest population growth rate amongst ASEAN economies Value of A&A Building Permits Population Growth Rate (2017) - ASEAN 30,000,000 Countries 2.5% 25,000,000 2.0% 20,000,000 1.5% 15,000,000 1.0% Value (PHP 000s) (PHP Value 10,000,000 0.5% 5,000,000 0.0% - Dec-14 Dec-15 Dec-16 Dec-17 Source: PSA Source: Focus Economics PAGE 10
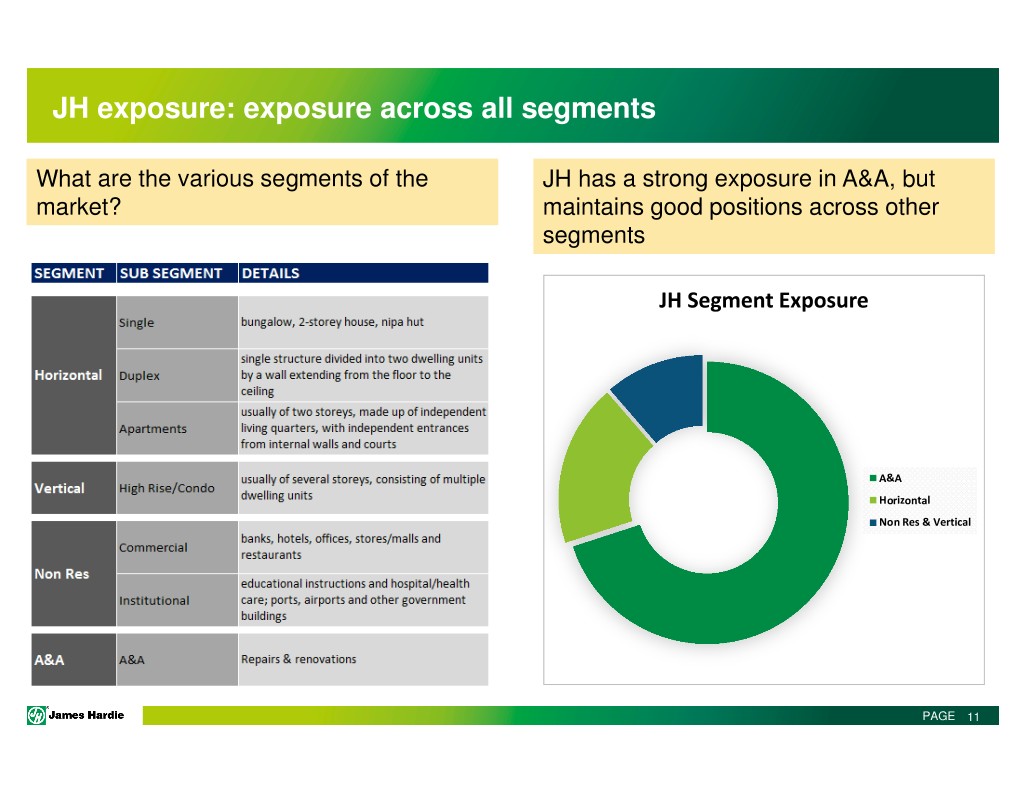
JH exposure: exposure across all segments What are the various segments of the JH has a strong exposure in A&A, but market? maintains good positions across other segments JH Segment Exposure A&A Horizontal Non Res & Vertical PAGE 11
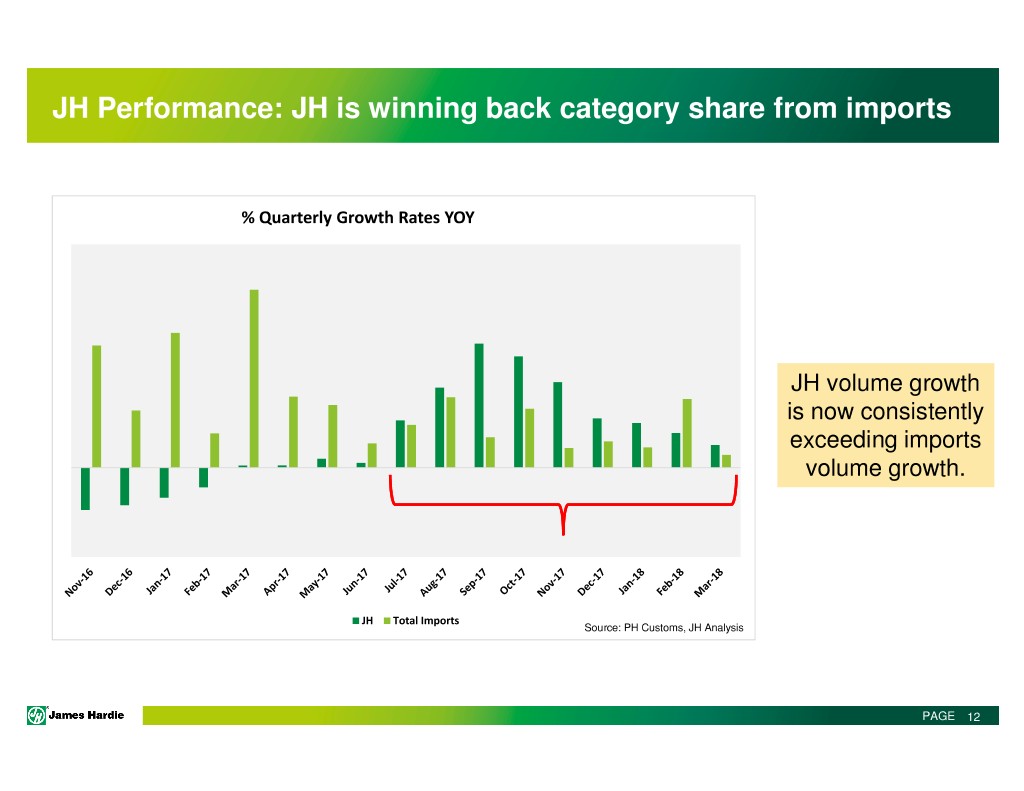
JH Performance: JH is winning back category share from imports % Quarterly Growth Rates YOY JH volume growth is now consistently exceeding imports volume growth. JH Total Imports Source: PH Customs, JH Analysis PAGE 12
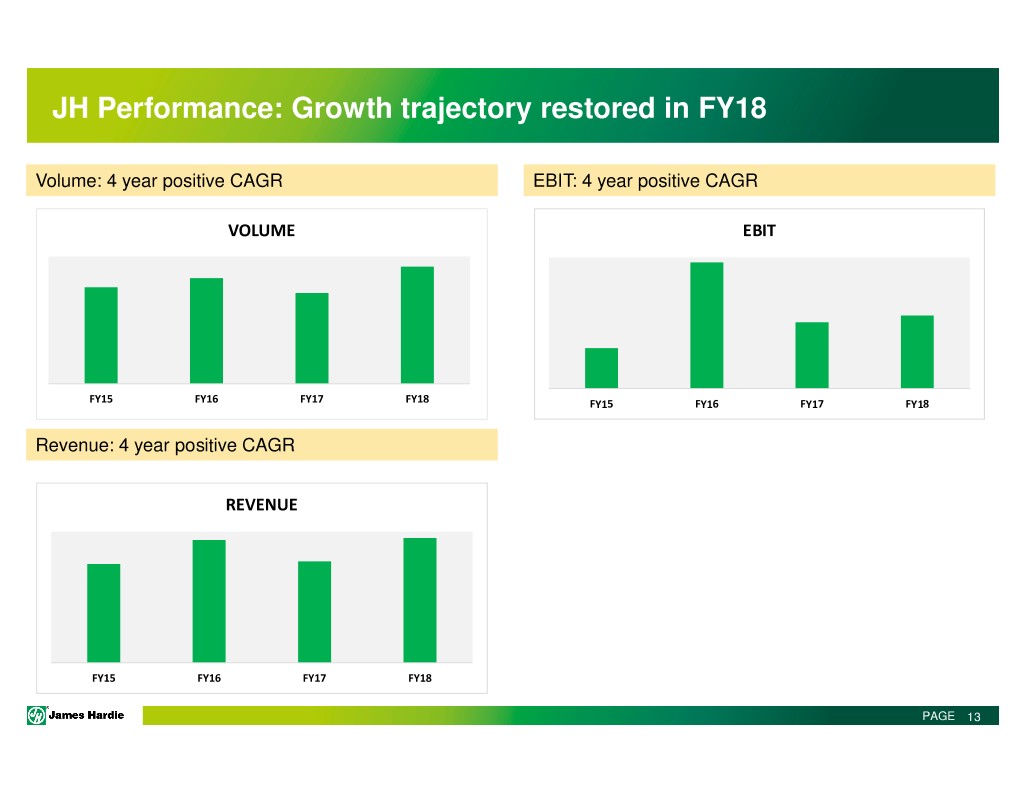
JH Performance: Growth trajectory restored in FY18 Volume: 4 year positive CAGR EBIT: 4 year positive CAGR VOLUME EBIT FY15 FY16 FY17 FY18 FY15 FY16 FY17 FY18 Revenue: 4 year positive CAGR REVENUE FY15 FY16 FY17 FY18 PAGE 13
What are the strategies & actions that drive our success? 1. Insights 2. Quality Products 3. Demand Generation 4. Channel Distribution Network 5. World Class Manufacturing 6. Driven People PAGE 14
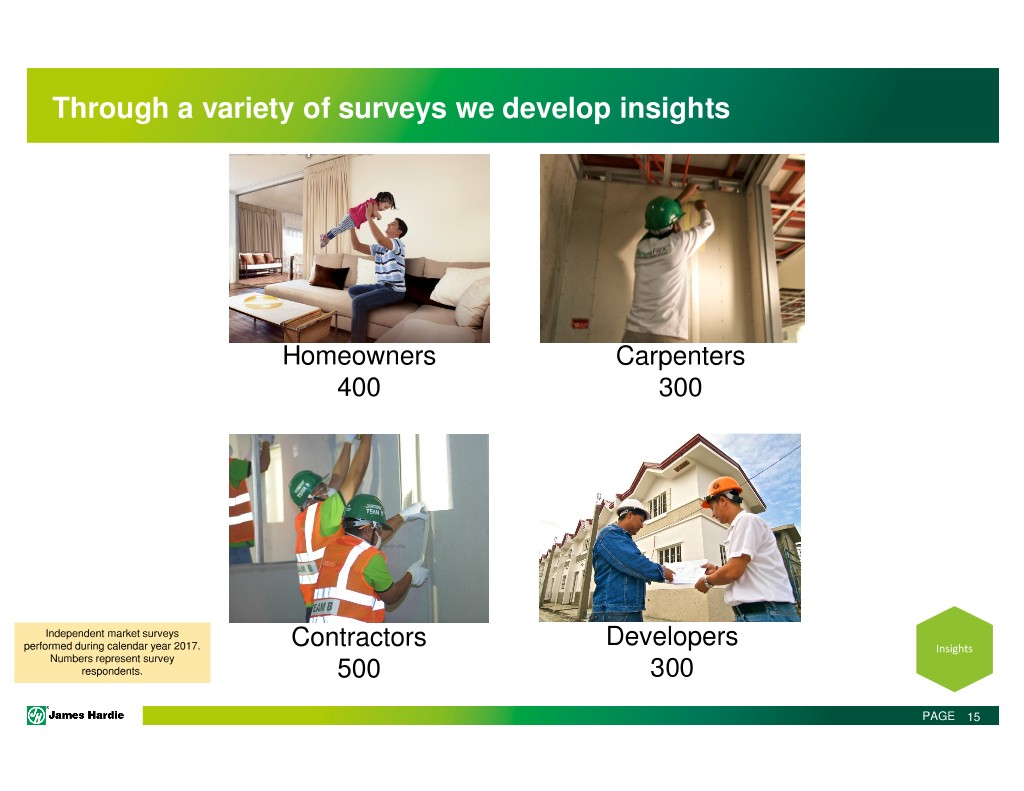
Through a variety of surveys we develop insights Homeowners Carpenters 400 300 Independent market surveys performed during calendar year 2017. Contractors Developers Insights Numbers represent survey respondents. 500 300 PAGE 15
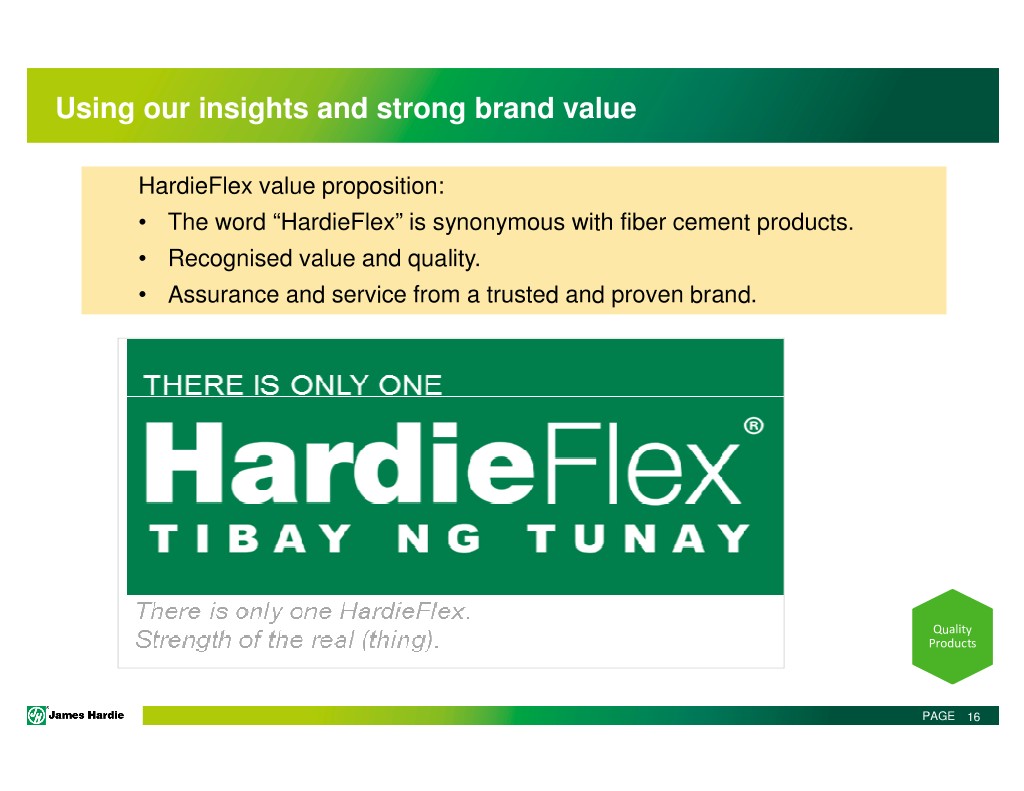
Using our insights and strong brand value HardieFlex value proposition: • The word “HardieFlex” is synonymous with fiber cement products. • Recognised value and quality. • Assurance and service from a trusted and proven brand. Quality Products PAGE 16
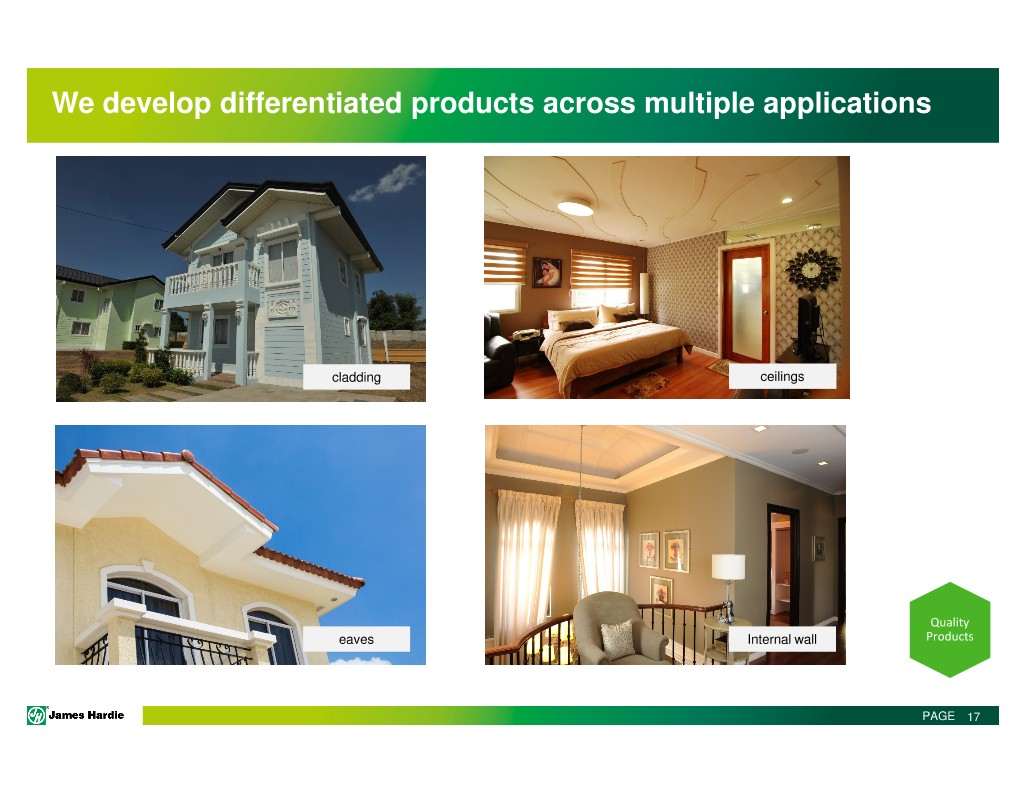
We develop differentiated products across multiple applications cladding ceilings Quality eaves Internal wall Products PAGE 17
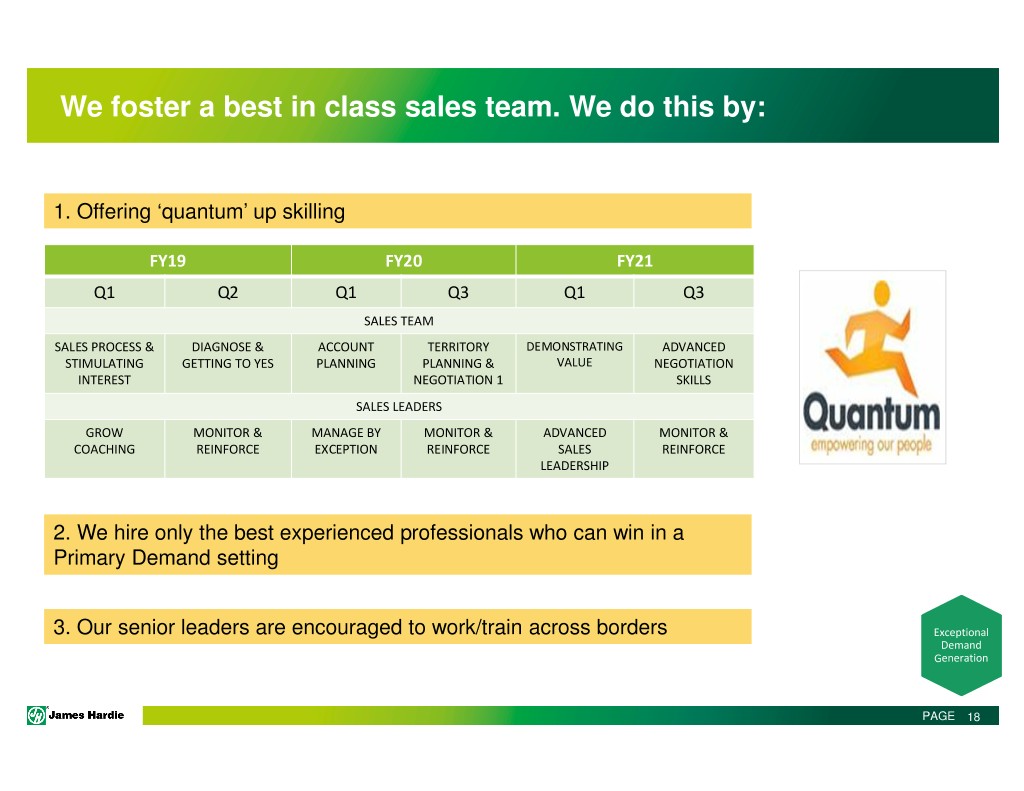
We foster a best in class sales team. We do this by: 1. Offering ‘quantum’ up skilling FY19 FY20 FY21 Q1 Q2 Q1 Q3 Q1 Q3 SALES TEAM SALES PROCESS & DIAGNOSE & ACCOUNT TERRITORY DEMONSTRATING ADVANCED STIMULATING GETTING TO YES PLANNING PLANNING & VALUE NEGOTIATION INTEREST NEGOTIATION 1 SKILLS SALES LEADERS GROW MONITOR & MANAGE BY MONITOR & ADVANCED MONITOR & COACHING REINFORCE EXCEPTION REINFORCE SALES REINFORCE LEADERSHIP 2. We hire only the best experienced professionals who can win in a Primary Demand setting 3. Our senior leaders are encouraged to work/train across borders Exceptional Demand Generation PAGE 18
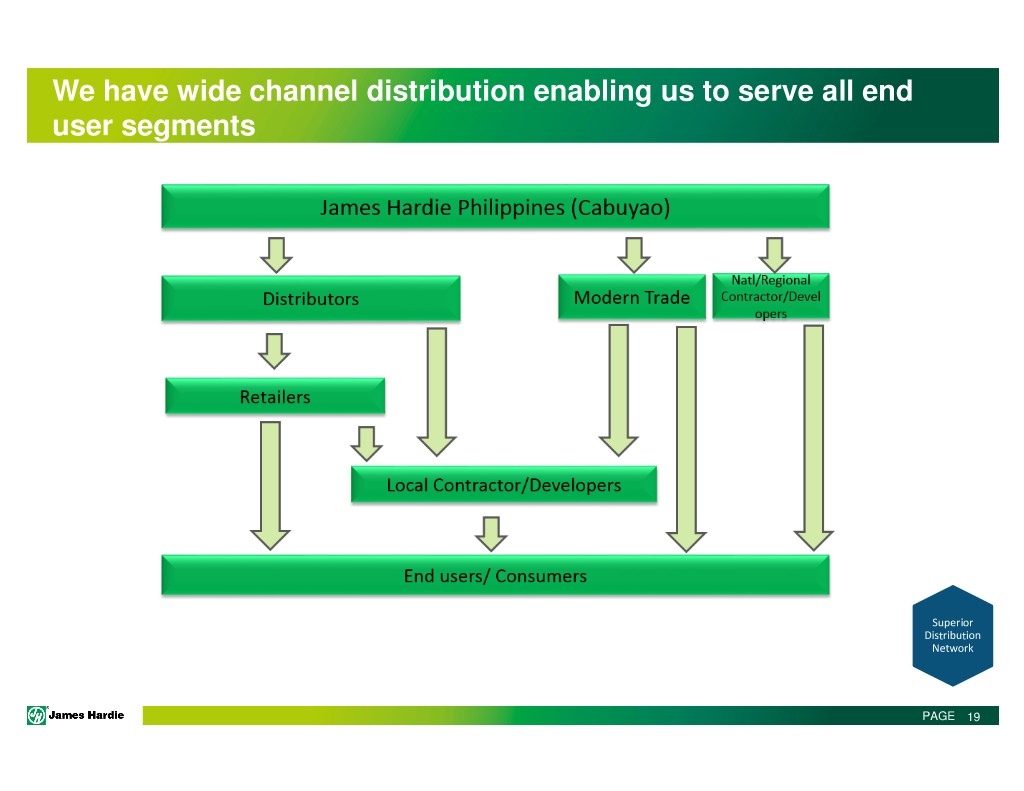
We have wide channel distribution enabling us to serve all end user segments Superior Distribution Network PAGE 19
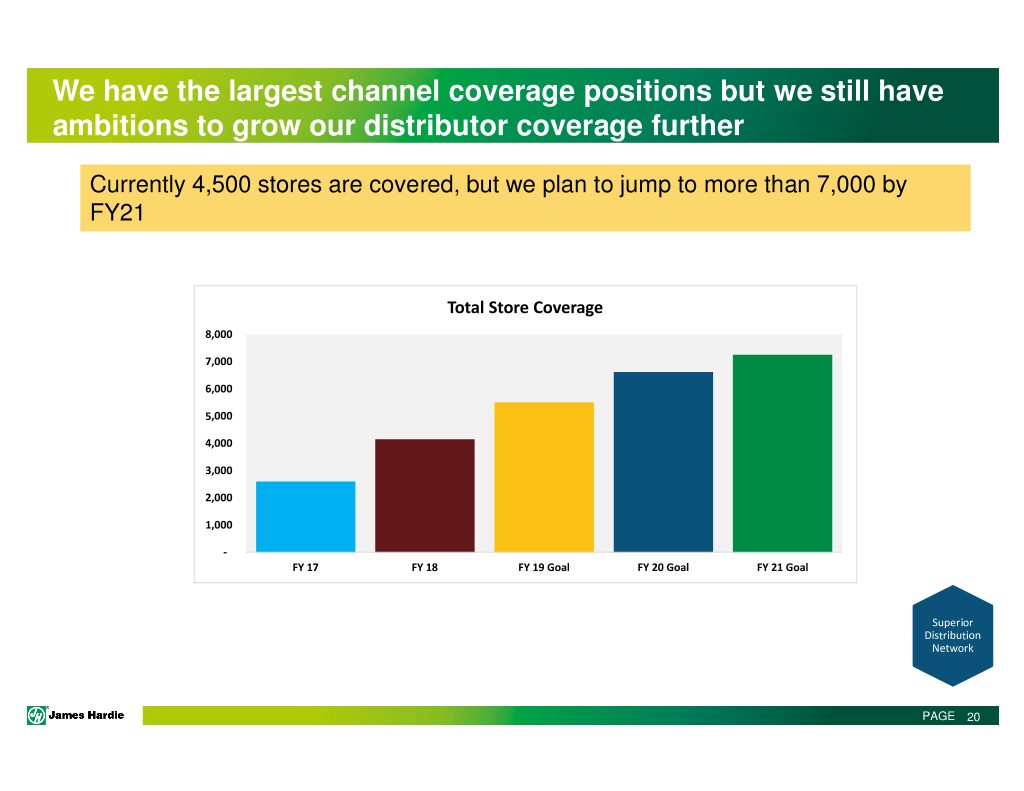
We have the largest channel coverage positions but we still have ambitions to grow our distributor coverage further Currently 4,500 stores are covered, but we plan to jump to more than 7,000 by FY21 Total Store Coverage 8,000 7,000 6,000 5,000 4,000 3,000 2,000 1,000 - FY 17 FY 18 FY 19 Goal FY 20 Goal FY 21 Goal Superior Distribution Network PAGE 20
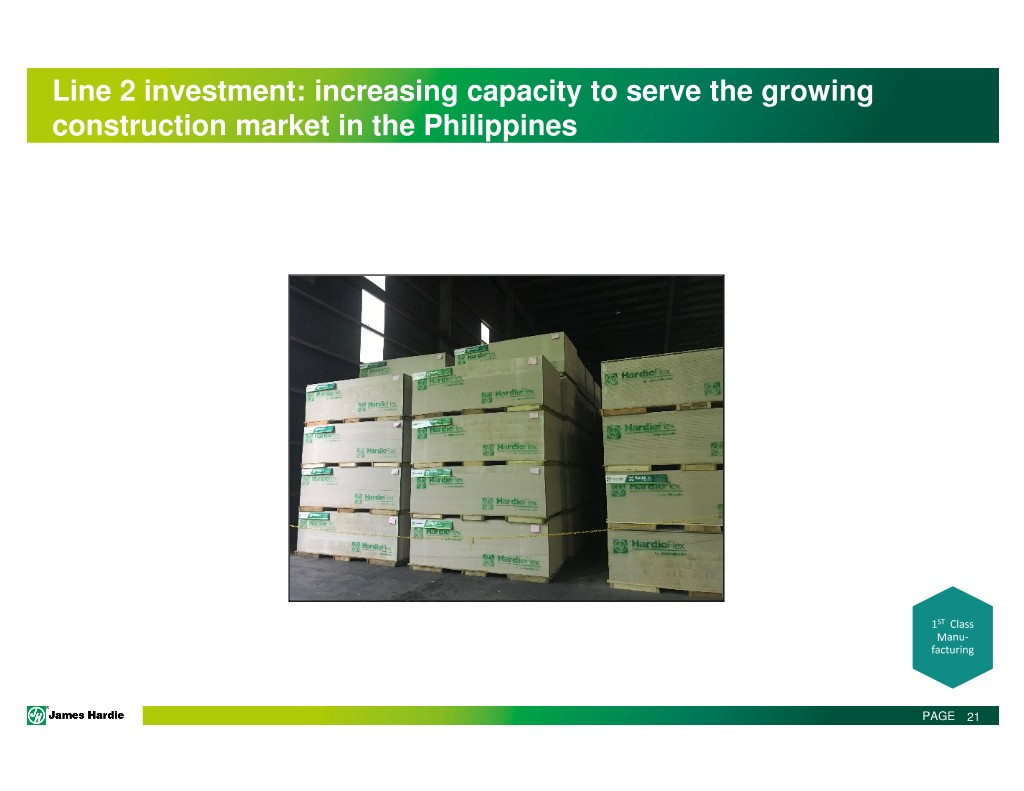
Line 2 investment: increasing capacity to serve the growing construction market in the Philippines 1ST Class Manu- facturing PAGE 21
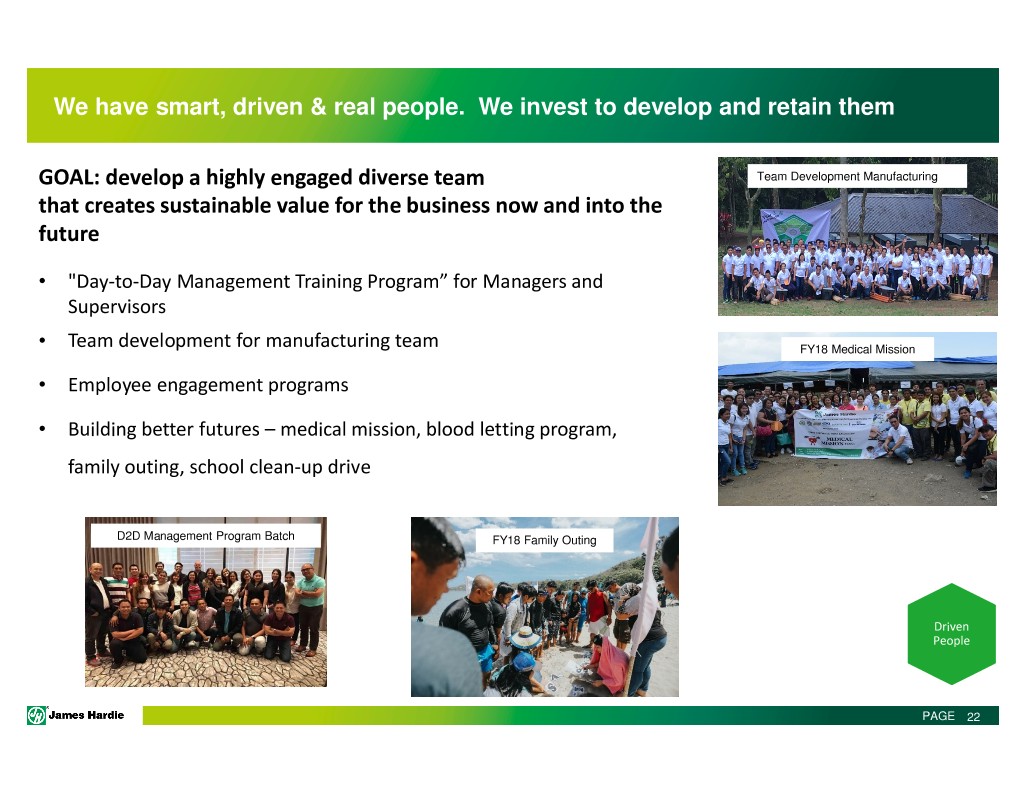
We have smart, driven & real people. We invest to develop and retain them GOAL: develop a highly engaged diverse team Team Development Manufacturing that creates sustainable value for the business now and into the future • "Day-to-Day Management Training Program” for Managers and Supervisors • Team development for manufacturing team FY18 Medical Mission • Employee engagement programs • Building better futures – medical mission, blood letting program, family outing, school clean-up drive D2D Management Program Batch FY18 Family Outing Driven People PAGE 22
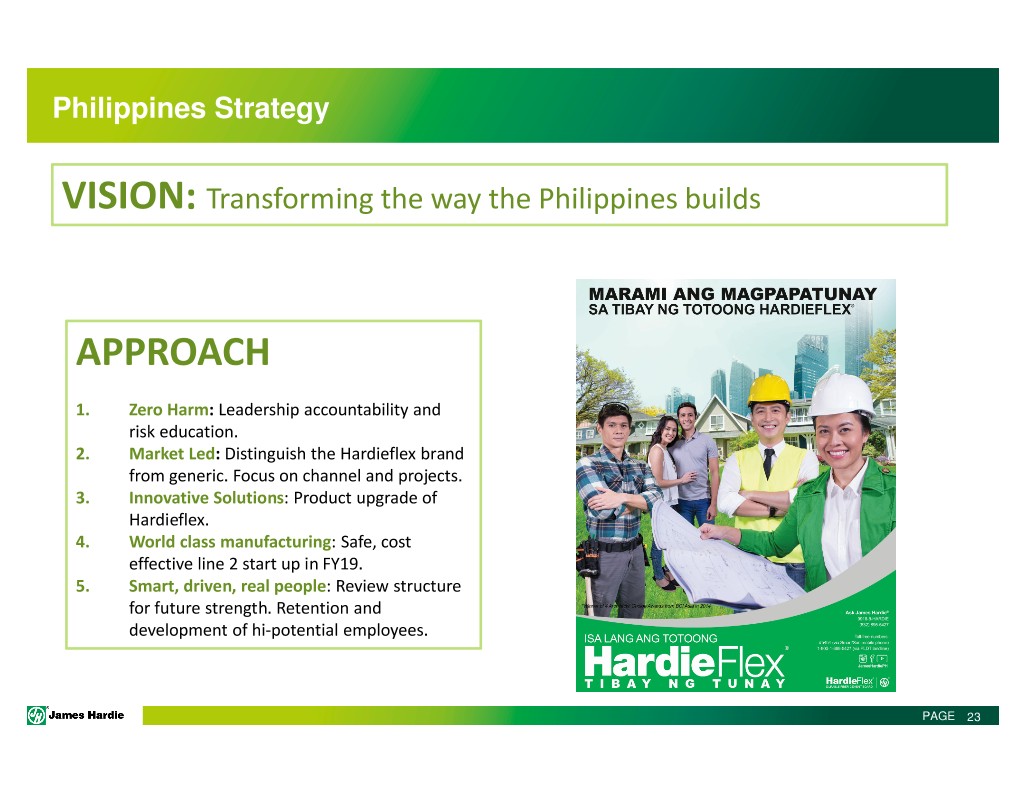
Philippines Strategy VISION: Transforming the way the Philippines builds APPROACH 1. Zero Harm : Leadership accountability and risk education. 2. Market Led : Distinguish the Hardieflex brand from generic. Focus on channel and projects. 3. Innovative Solutions : Product upgrade of Hardieflex. 4. World class manufacturing : Safe, cost effective line 2 start up in FY19. 5. Smart, driven, real people : Review structure for future strength. Retention and development of hi-potential employees. PAGE 23

QUESTIONS