Exhibit 99.4 James Hardie Industries plc Europa House 2nd Floor, Harcourt Centre 24 August 2020 Harcourt Street, Dublin 2, D02 WR20, Ireland T: +353 (0) 1 411 6924 The Manager F: +353 (0) 1 479 1128 Company Announcements Office Australian Securities Exchange Limited 20 Bridge Street SYDNEY NSW 2000 Dear Sir/Madam Remuneration Report for Fiscal Year 2020 James Hardie announced today that it has filed the Remuneration Report relating to fiscal year 2020 with the ASX. James Hardie is not required to produce a Remuneration Report, but prepares one on a voluntary basis for the benefit of shareholders. Copies of this document are available on James Hardie’s investor relations website at www.ir.jameshardie.com.au. Shareholders who wish to receive a hard copy of the Remuneration Report free of charge should contact the company’s investor relations office on +61 2 8845 3356. Alternatively, shareholders can forward their request by email, including their mailing details to: [email protected] Yours faithfully Joseph C. Blasko General Counsel, Chief Compliance Officer and Company Secretary This announcement has been authorised for release by the General Counsel, Chief Compliance Officer and Company Secretary, Mr Joseph C. Blasko. James Hardie Industries plc is a limited liability company incorporated in Ireland with its registered office at Europa House 2nd Floor, Harcourt Centre, Harcourt Street, Dublin 2, D02 WR20, Ireland. Directors: Michael Hammes (Chairman, USA), Brian Anderson (USA), Russell Chenu (Australia), Andrea Gisle Joosen (Sweden), David Harrison (USA), Persio Lisboa (USA), Anne Lloyd (USA), Moe Nozari (USA), Rada Rodriguez (Sweden), Nigel Stein (UK), Harold Wiens (USA). Chief Executive Officer and Director: Jack Truong (USA) Company number: 485719 ARBN: 097 829 895
Table of Contents James Hardie 2020 Remuneration Report 1 Remuneration Report This Remuneration Report describes the executive remuneration philosophy, programs and objectives of the Remuneration Committee and the Board of Directors (the “Board”), as well as the executive remuneration plans and programs implemented by James Hardie. We are not required to produce a remuneration report under applicable Irish, Australian or US rules or regulations. However, taking into consideration our significant Australian and US shareholder bases and our primary listing on the Australian Securities Exchange (“ASX”), we have voluntarily produced a remuneration report consistent with those provided by similarly situated companies for non-binding shareholder approval since 2005. This Remuneration Report outlines the key remuneration plans and programs and share ownership information for our Board of Directors and certain of our senior executive officers (Chief Executive Officer (“CEO”), Chief Financial Officer (“CFO”) and the other three highest paid executive officers based on total compensation that was earned or accrued for fiscal year 2020) (“Senior Executive Officers”) in fiscal year 2020, and also includes an outline of the key changes for fiscal year 2021. Further details of these changes are set out in the 2020 Notice of Annual General Meeting (“AGM”). For fiscal year 2020, our senior executive officers (Chief Executive Officer (“CEO”), Chief Financial Officer (“CFO”) and the other three highest paid executive officers based on total compensation that was earned or accrued for fiscal year 2020) (“Senior Executive Officers”) are: • Dr Jack Truong, CEO; • Jason Miele, CFO (from 25 February 2020); • Sean Gadd, Executive Vice President, North America Commercial; • Joe Blasko, General Counsel and Chief Compliance Officer; • Ryan Kilcullen, Executive Vice President – Operations; and • Matthew Marsh, Former CFO (through August 2019). In addition to Messrs Miele and Marsh, Ms Anne Lloyd, a member of the Company's Board of Directors, served as the Company's Interim CFO from August 2019 to February 2020. Ms Lloyd served in the Interim CFO position following Mr Marsh's departure while the Company sought to retain a new CFO. Remuneration paid to Ms Lloyd for her service as Interim CFO is set forth in the remuneration for non- executive directors section of this Remuneration Report. This Remuneration Report has been adopted by our Board on the recommendation of the Remuneration Committee.
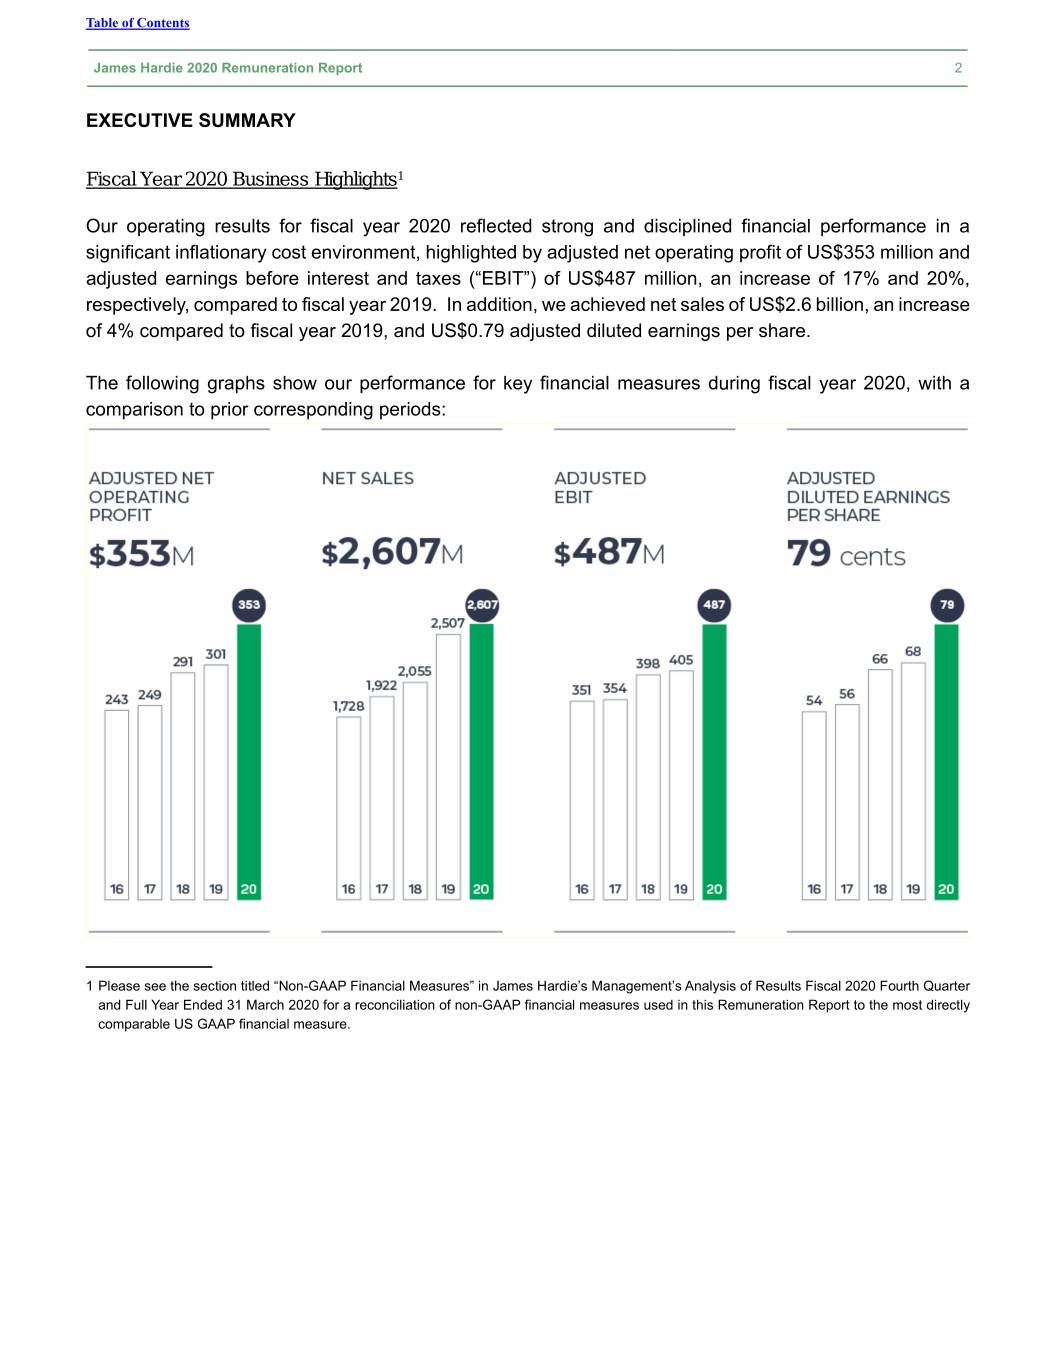
Table of Contents James Hardie 2020 Remuneration Report 2 EXECUTIVE SUMMARY Fiscal Year 2020 Business Highlights1 Our operating results for fiscal year 2020 reflected strong and disciplined financial performance in a significant inflationary cost environment, highlighted by adjusted net operating profit of US$353 million and adjusted earnings before interest and taxes (“EBIT”) of US$487 million, an increase of 17% and 20%, respectively, compared to fiscal year 2019. In addition, we achieved net sales of US$2.6 billion, an increase of 4% compared to fiscal year 2019, and US$0.79 adjusted diluted earnings per share. The following graphs show our performance for key financial measures during fiscal year 2020, with a comparison to prior corresponding periods: ____________ 1 Please see the section titled “Non-GAAP Financial Measures” in James Hardie’s Management’s Analysis of Results Fiscal 2020 Fourth Quarter and Full Year Ended 31 March 2020 for a reconciliation of non-GAAP financial measures used in this Remuneration Report to the most directly comparable US GAAP financial measure.
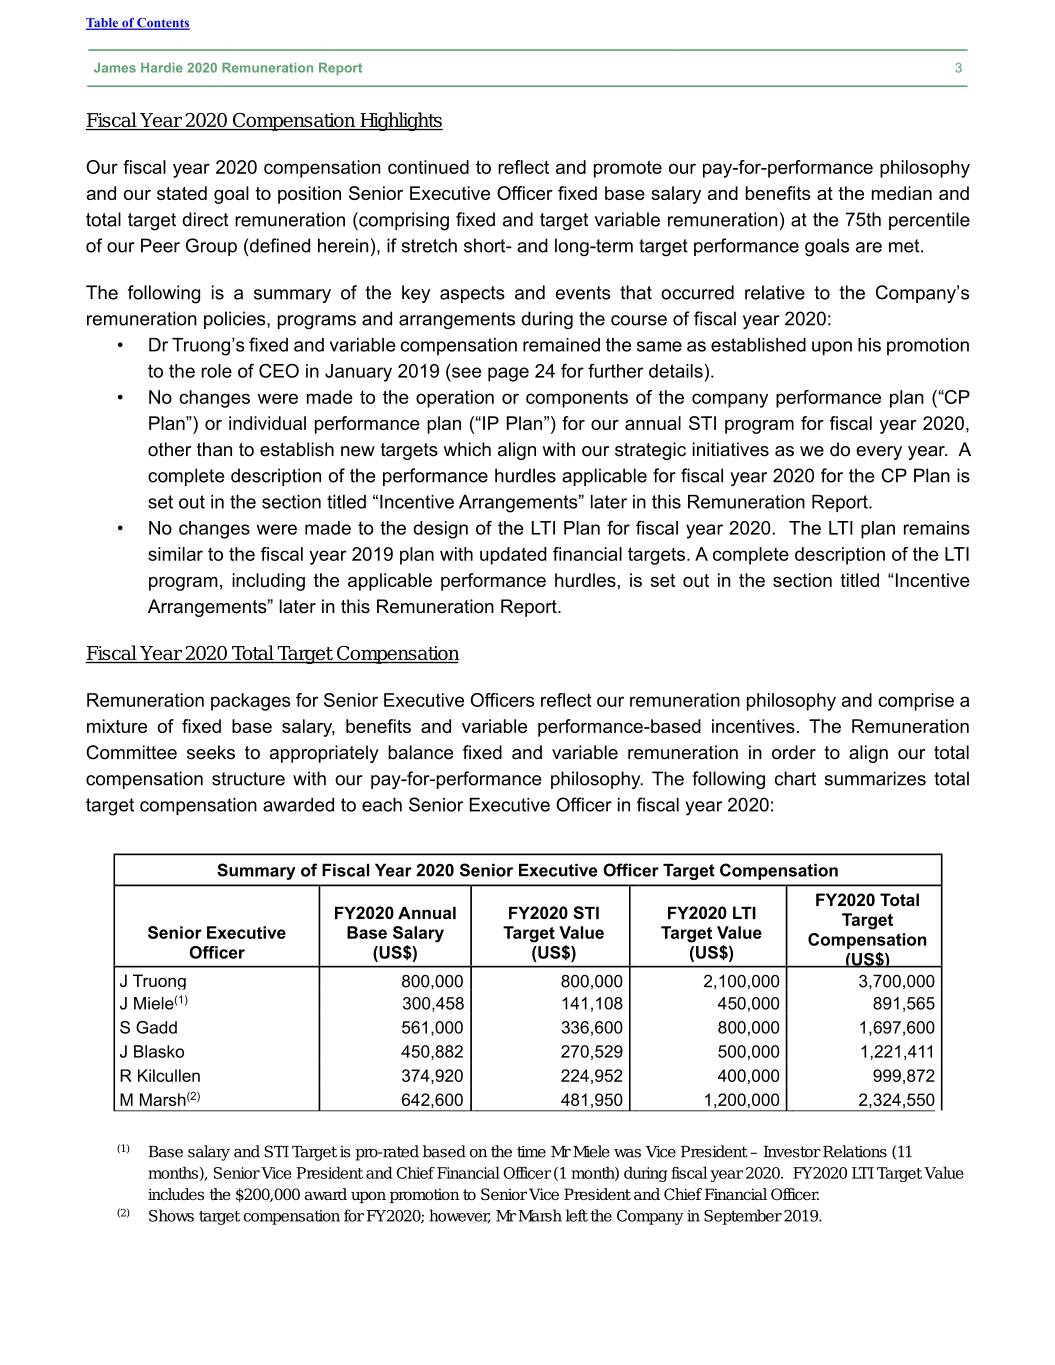
Table of Contents James Hardie 2020 Remuneration Report 3 Fiscal Year 2020 Compensation Highlights Our fiscal year 2020 compensation continued to reflect and promote our pay-for-performance philosophy and our stated goal to position Senior Executive Officer fixed base salary and benefits at the median and total target direct remuneration (comprising fixed and target variable remuneration) at the 75th percentile of our Peer Group (defined herein), if stretch short- and long-term target performance goals are met. The following is a summary of the key aspects and events that occurred relative to the Company’s remuneration policies, programs and arrangements during the course of fiscal year 2020: • Dr Truong’s fixed and variable compensation remained the same as established upon his promotion to the role of CEO in January 2019 (see page 24 for further details). • No changes were made to the operation or components of the company performance plan (“CP Plan”) or individual performance plan (“IP Plan”) for our annual STI program for fiscal year 2020, other than to establish new targets which align with our strategic initiatives as we do every year. A complete description of the performance hurdles applicable for fiscal year 2020 for the CP Plan is set out in the section titled “Incentive Arrangements” later in this Remuneration Report. • No changes were made to the design of the LTI Plan for fiscal year 2020. The LTI plan remains similar to the fiscal year 2019 plan with updated financial targets. A complete description of the LTI program, including the applicable performance hurdles, is set out in the section titled “Incentive Arrangements” later in this Remuneration Report. Fiscal Year 2020 Total Target Compensation Remuneration packages for Senior Executive Officers reflect our remuneration philosophy and comprise a mixture of fixed base salary, benefits and variable performance-based incentives. The Remuneration Committee seeks to appropriately balance fixed and variable remuneration in order to align our total compensation structure with our pay-for-performance philosophy. The following chart summarizes total target compensation awarded to each Senior Executive Officer in fiscal year 2020: Summary of Fiscal Year 2020 Senior Executive Officer Target Compensation FY2020 Total FY2020 Annual FY2020 STI FY2020 LTI Target Senior Executive Base Salary Target Value Target Value Compensation Officer (US$) (US$) (US$) (US$) J Truong 800,000 800,000 2,100,000 3,700,000 J Miele(1) 300,458 141,108 450,000 891,565 S Gadd 561,000 336,600 800,000 1,697,600 J Blasko 450,882 270,529 500,000 1,221,411 R Kilcullen 374,920 224,952 400,000 999,872 M Marsh(2) 642,600 481,950 1,200,000 2,324,550 (1) Base salary and STI Target is pro-rated based on the time Mr Miele was Vice President – Investor Relations (11 months), Senior Vice President and Chief Financial Officer (1 month) during fiscal year 2020. FY2020 LTI Target Value includes the $200,000 award upon promotion to Senior Vice President and Chief Financial Officer. (2) Shows target compensation for FY2020; however, Mr Marsh left the Company in September 2019.
Table of Contents James Hardie 2020 Remuneration Report 4 Results of 2019 Remuneration Report Vote In August 2019, our shareholders were asked to cast a non-binding advisory vote on our remuneration report for the fiscal year ended 31 March 2019. Although we are not required under applicable Irish, Australian or US laws or regulations to provide a shareholder vote on our executive remuneration practices, the Board believes that it is important to engage shareholders on this important issue and we have voluntarily submitted our remuneration report for non-binding shareholder approval on an annual basis since 2005 and currently intend to continue to do so. At our 2019 Annual General Meeting, our shareholders approved our remuneration report, with 98.7% of the votes cast in support of our remuneration program. The Remuneration Committee considered the results of this advisory vote, together with investor feedback and other factors and data associated with strategic priorities discussed in this Remuneration Report, in determining our executive remuneration policies, objectives and decisions and related shareholder engagement efforts for fiscal year 2020. APPROACH TO SENIOR EXECUTIVE REMUNERATION Remuneration Philosophy As our main business and all of our Senior Executive Officers are located in the US, our remuneration philosophy is to provide our Senior Executive Officers with an overall package that is competitive with Peer Group companies exposed to the US housing market. Within this philosophy, the executive remuneration framework emphasizes operational excellence and shareholder value creation through incentives that link executive remuneration with the interests of shareholders. Our remuneration plans and programs are structured to enable us to: (i) attract and retain talented executives; (ii) reward outstanding individual and corporate performance; and (iii) align the interests of our executives to the interests of our shareholders, with the ultimate goal of improving long-term value for our shareholders. This pay-for-performance system continues to serve as the framework for executive remuneration, aligning the remuneration received with the performance achieved. Composition of Remuneration Packages In line with our remuneration philosophy, our goal is to position Senior Executive Officer fixed base salary and benefits at the median and total target direct remuneration (comprising fixed and target variable remuneration) at the 75th percentile of our Peer Group, if stretch short- and long-term target performance goals are met. Performance goals for target variable performance-based incentive remuneration are set with the expectation that we will deliver results in the top quartile of our Peer Group. Performance below this level will result in variable remuneration payments below target (and potentially zero for poor performance). Performance above this level will result in variable remuneration payments above target.
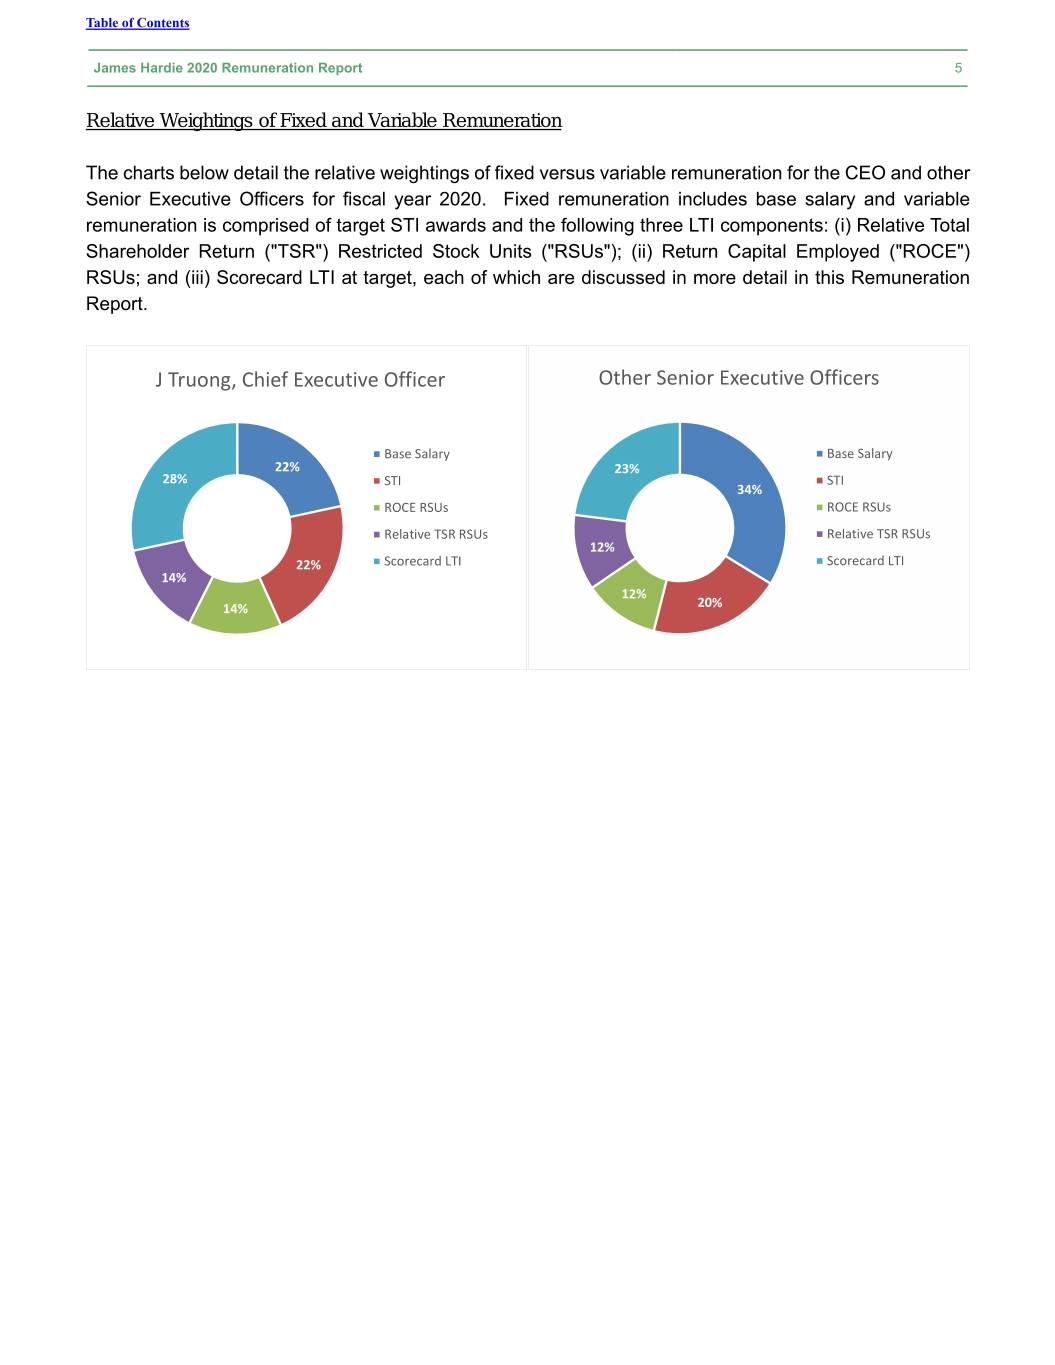
Table of Contents James Hardie 2020 Remuneration Report 5 Relative Weightings of Fixed and Variable Remuneration The charts below detail the relative weightings of fixed versus variable remuneration for the CEO and other Senior Executive Officers for fiscal year 2020. Fixed remuneration includes base salary and variable remuneration is comprised of target STI awards and the following three LTI components: (i) Relative Total Shareholder Return ("TSR") Restricted Stock Units ("RSUs"); (ii) Return Capital Employed ("ROCE") RSUs; and (iii) Scorecard LTI at target, each of which are discussed in more detail in this Remuneration Report. J Truong, Chief Executive Officer Other Senior Executive Officers Base Salary Base Salary 22% 23% 28% STI STI 34% ROCE RSUs ROCE RSUs Relative TSR RSUs Relative TSR RSUs 12% 22% Scorecard LTI Scorecard LTI 14% 12% 14% 20%
Table of Contents James Hardie 2020 Remuneration Report 6 Setting Remuneration Packages Remuneration decisions are based on the executive remuneration philosophy and framework described in this Remuneration Report. The Remuneration Committee reviews and the Board approves this framework each year. Remuneration packages for Senior Executive Officers are evaluated each year to make sure that they continue to align with our compensation philosophy, are competitive with our Peer Group and developments in the market, and continue to support our business structure and objectives. In making decisions regarding individual Senior Executive Officers, the Remuneration Committee takes into account both the results of an annual remuneration positioning review provided by the Remuneration Committee’s independent advisers and the Senior Executive Officer’s responsibilities and performance. All aspects of the remuneration package for our CEO and CFO are determined by the Remuneration Committee and ratified by the Board. All aspects of the remuneration package for the remaining Senior Executive Officers are determined by the Remuneration Committee on the recommendation of the CEO. Remuneration Committee Governance The remuneration program for our Senior Executive Officers is overseen by our Remuneration Committee, the members of which are appointed by the Board. As prescribed by the Remuneration Committee Charter, the duties of the Remuneration Committee include, among other things: (i) administering and making recommendations on our incentive compensation and equity-based remuneration plans; (ii) reviewing the remuneration of directors; (iii) reviewing the remuneration framework for the Company; and (iv) making recommendations to the Board on recruitment, retention and termination policies and procedures for senior management. The current members of the Remuneration Committee are Persio Lisboa (Chairman), Brian Anderson, Russell Chenu, Michael Hammes and Moe Nozari, all of whom are independent non-executive directors. A more complete description of these and other Remuneration Committee functions is contained in the Remuneration Committee’s Charter, a copy of which is available in the Corporate Governance section of the Investor Relations page on our website (www.ir.jameshardie.com.au).
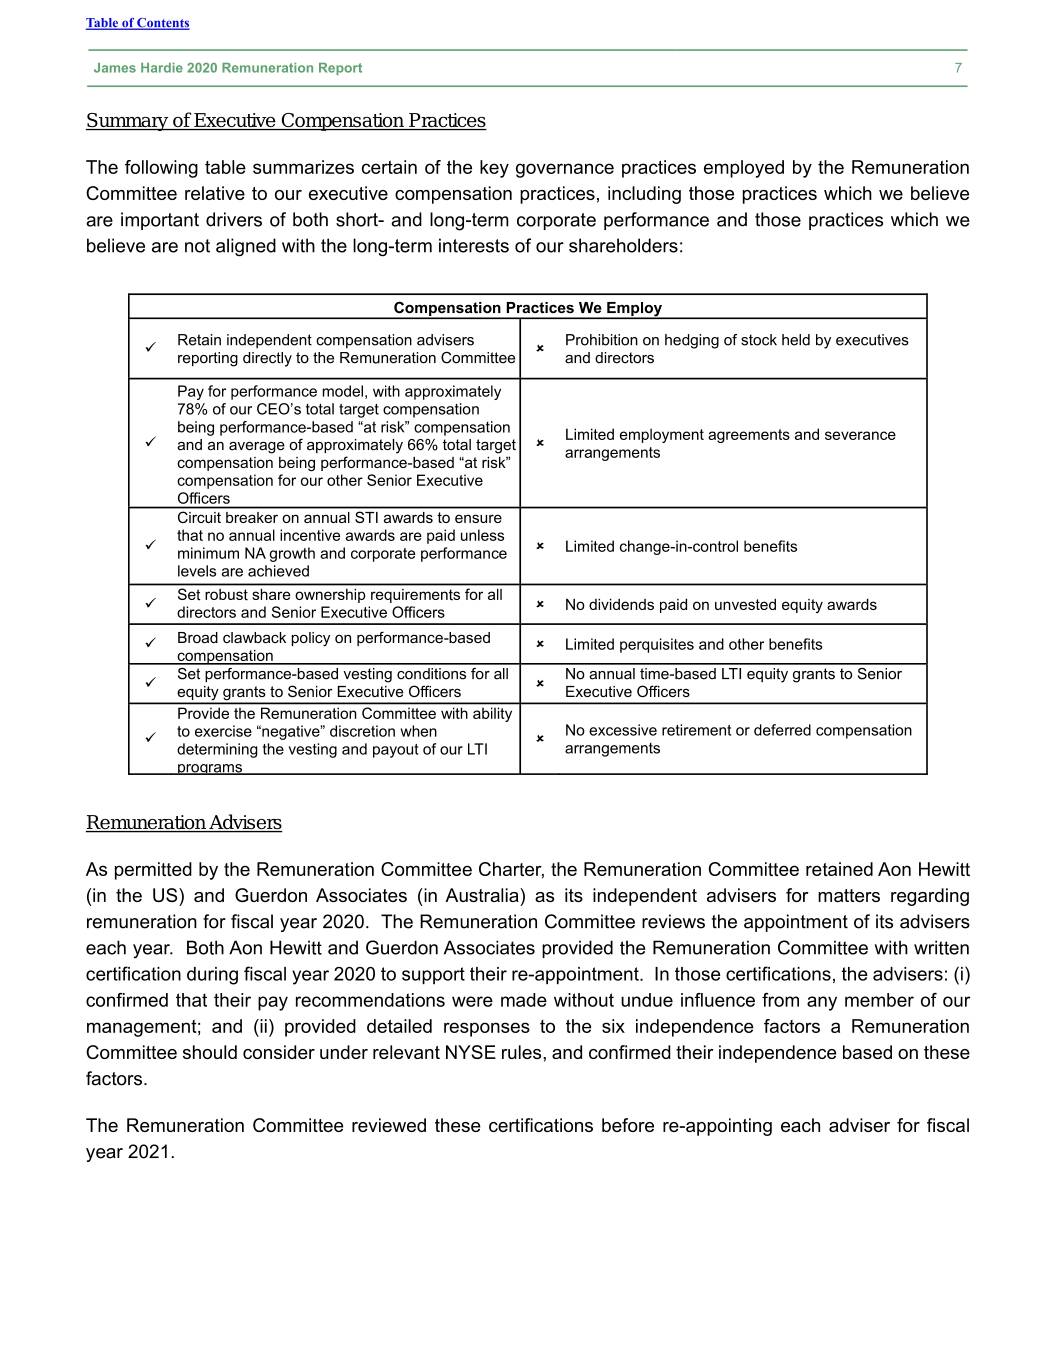
Table of Contents James Hardie 2020 Remuneration Report 7 Summary of Executive Compensation Practices The following table summarizes certain of the key governance practices employed by the Remuneration Committee relative to our executive compensation practices, including those practices which we believe are important drivers of both short- and long-term corporate performance and those practices which we believe are not aligned with the long-term interests of our shareholders: Compensation Practices We Employ Retain independent compensation advisers Prohibition on hedging of stock held by executives reporting directly to the Remuneration Committee and directors Pay for performance model, with approximately 78% of our CEO’s total target compensation being performance-based “at risk” compensation Limited employment agreements and severance and an average of approximately 66% total target arrangements compensation being performance-based “at risk” compensation for our other Senior Executive Officers Circuit breaker on annual STI awards to ensure that no annual incentive awards are paid unless minimum NA growth and corporate performance Limited change-in-control benefits levels are achieved Set robust share ownership requirements for all directors and Senior Executive Officers No dividends paid on unvested equity awards Broad clawback policy on performance-based Limited perquisites and other benefits compensation Set performance-based vesting conditions for all No annual time-based LTI equity grants to Senior equity grants to Senior Executive Officers Executive Officers Provide the Remuneration Committee with ability No excessive retirement or deferred compensation to exercise “negative” discretion when determining the vesting and payout of our LTI arrangements programs Remuneration Advisers As permitted by the Remuneration Committee Charter, the Remuneration Committee retained Aon Hewitt (in the US) and Guerdon Associates (in Australia) as its independent advisers for matters regarding remuneration for fiscal year 2020. The Remuneration Committee reviews the appointment of its advisers each year. Both Aon Hewitt and Guerdon Associates provided the Remuneration Committee with written certification during fiscal year 2020 to support their re-appointment. In those certifications, the advisers: (i) confirmed that their pay recommendations were made without undue influence from any member of our management; and (ii) provided detailed responses to the six independence factors a Remuneration Committee should consider under relevant NYSE rules, and confirmed their independence based on these factors. The Remuneration Committee reviewed these certifications before re-appointing each adviser for fiscal year 2021.
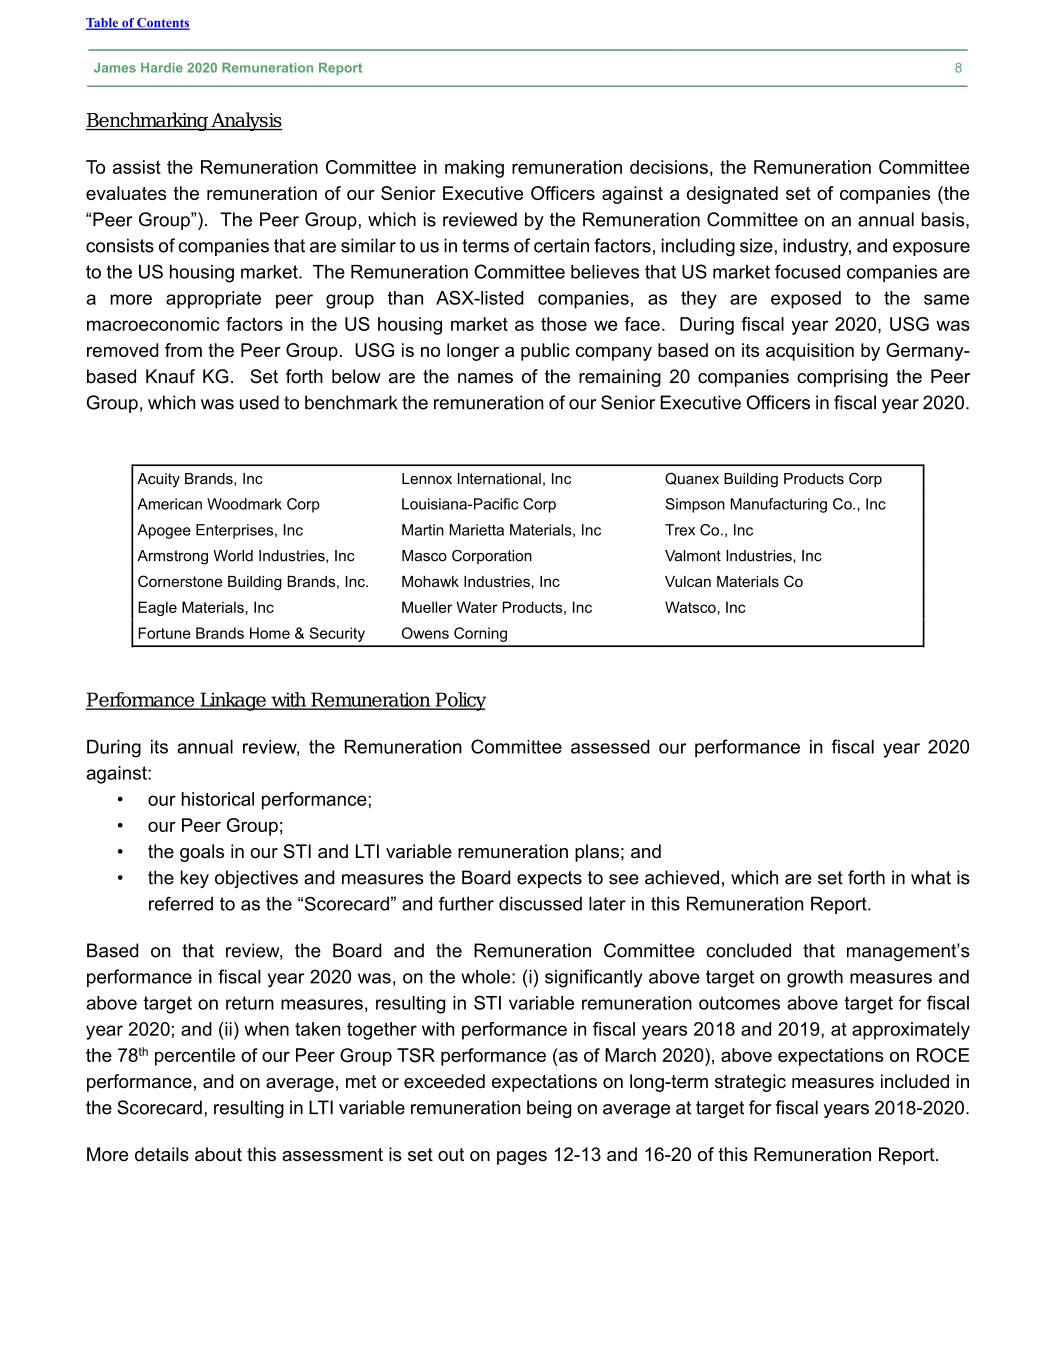
Table of Contents James Hardie 2020 Remuneration Report 8 Benchmarking Analysis To assist the Remuneration Committee in making remuneration decisions, the Remuneration Committee evaluates the remuneration of our Senior Executive Officers against a designated set of companies (the “Peer Group”). The Peer Group, which is reviewed by the Remuneration Committee on an annual basis, consists of companies that are similar to us in terms of certain factors, including size, industry, and exposure to the US housing market. The Remuneration Committee believes that US market focused companies are a more appropriate peer group than ASX-listed companies, as they are exposed to the same macroeconomic factors in the US housing market as those we face. During fiscal year 2020, USG was removed from the Peer Group. USG is no longer a public company based on its acquisition by Germany- based Knauf KG. Set forth below are the names of the remaining 20 companies comprising the Peer Group, which was used to benchmark the remuneration of our Senior Executive Officers in fiscal year 2020. Acuity Brands, Inc Lennox International, Inc Quanex Building Products Corp American Woodmark Corp Louisiana-Pacific Corp Simpson Manufacturing Co., Inc Apogee Enterprises, Inc Martin Marietta Materials, Inc Trex Co., Inc Armstrong World Industries, Inc Masco Corporation Valmont Industries, Inc Cornerstone Building Brands, Inc. Mohawk Industries, Inc Vulcan Materials Co Eagle Materials, Inc Mueller Water Products, Inc Watsco, Inc Fortune Brands Home & Security Owens Corning Performance Linkage with Remuneration Policy During its annual review, the Remuneration Committee assessed our performance in fiscal year 2020 against: • our historical performance; • our Peer Group; • the goals in our STI and LTI variable remuneration plans; and • the key objectives and measures the Board expects to see achieved, which are set forth in what is referred to as the “Scorecard” and further discussed later in this Remuneration Report. Based on that review, the Board and the Remuneration Committee concluded that management’s performance in fiscal year 2020 was, on the whole: (i) significantly above target on growth measures and above target on return measures, resulting in STI variable remuneration outcomes above target for fiscal year 2020; and (ii) when taken together with performance in fiscal years 2018 and 2019, at approximately the 78th percentile of our Peer Group TSR performance (as of March 2020), above expectations on ROCE performance, and on average, met or exceeded expectations on long-term strategic measures included in the Scorecard, resulting in LTI variable remuneration being on average at target for fiscal years 2018-2020. More details about this assessment is set out on pages 12-13 and 16-20 of this Remuneration Report.
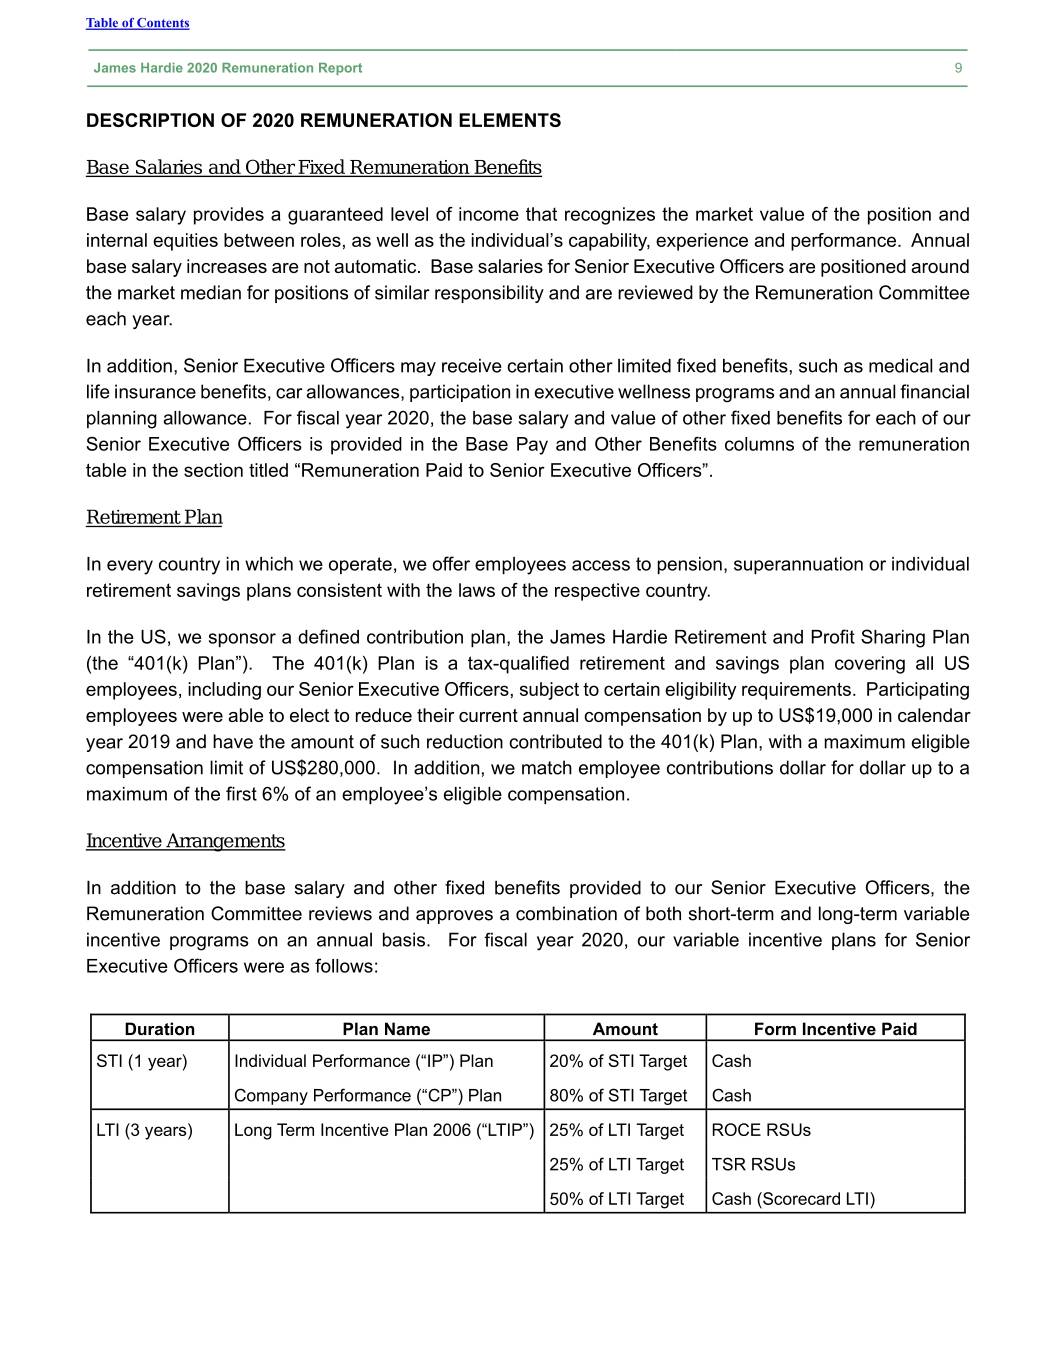
Table of Contents James Hardie 2020 Remuneration Report 9 DESCRIPTION OF 2020 REMUNERATION ELEMENTS Base Salaries and Other Fixed Remuneration Benefits Base salary provides a guaranteed level of income that recognizes the market value of the position and internal equities between roles, as well as the individual’s capability, experience and performance. Annual base salary increases are not automatic. Base salaries for Senior Executive Officers are positioned around the market median for positions of similar responsibility and are reviewed by the Remuneration Committee each year. In addition, Senior Executive Officers may receive certain other limited fixed benefits, such as medical and life insurance benefits, car allowances, participation in executive wellness programs and an annual financial planning allowance. For fiscal year 2020, the base salary and value of other fixed benefits for each of our Senior Executive Officers is provided in the Base Pay and Other Benefits columns of the remuneration table in the section titled “Remuneration Paid to Senior Executive Officers”. Retirement Plan In every country in which we operate, we offer employees access to pension, superannuation or individual retirement savings plans consistent with the laws of the respective country. In the US, we sponsor a defined contribution plan, the James Hardie Retirement and Profit Sharing Plan (the “401(k) Plan”). The 401(k) Plan is a tax-qualified retirement and savings plan covering all US employees, including our Senior Executive Officers, subject to certain eligibility requirements. Participating employees were able to elect to reduce their current annual compensation by up to US$19,000 in calendar year 2019 and have the amount of such reduction contributed to the 401(k) Plan, with a maximum eligible compensation limit of US$280,000. In addition, we match employee contributions dollar for dollar up to a maximum of the first 6% of an employee’s eligible compensation. Incentive Arrangements In addition to the base salary and other fixed benefits provided to our Senior Executive Officers, the Remuneration Committee reviews and approves a combination of both short-term and long-term variable incentive programs on an annual basis. For fiscal year 2020, our variable incentive plans for Senior Executive Officers were as follows: Duration Plan Name Amount Form Incentive Paid STI (1 year) Individual Performance (“IP”) Plan 20% of STI Target Cash Company Performance (“CP”) Plan 80% of STI Target Cash LTI (3 years) Long Term Incentive Plan 2006 (“LTIP”) 25% of LTI Target ROCE RSUs 25% of LTI Target TSR RSUs 50% of LTI Target Cash (Scorecard LTI)
Table of Contents James Hardie 2020 Remuneration Report 10 STI Plans On an annual basis, the Remuneration Committee approves an STI target for all Senior Executive Officers, expressed as a percentage of base salary, which is allocated between individual goals and Company goals under the IP and CP Plans, respectively. For fiscal year 2020, the STI target percentage for Dr Truong was 100% of base salary, for Mr Miele a pro-rated target of 47% based on various positions he held during the year, 75% for Mr Marsh and 60% for Messrs Gadd, Blasko and Kilcullen, with 80% allocated to the CP Plan and 20% allocated to the IP Plan for all Senior Executive Officers. Since fiscal year 2014, the Remuneration Committee has applied a ‘circuit breaker’ to the STI plans, which for Senior Executive Officers will prevent payment of any STI under the CP Plan unless our performance exceeds a level approved by the Remuneration Committee each year. For fiscal year 2020, the ‘circuit breaker’ for participants tied to the NA plan was set at Primary Demand Growth ("PDG") achievement of greater than -2%. In the event the NA business did not achieve PDG greater than -2% for fiscal year 2020, the NA Achieved Multiple used in the calculation of any composite multiple would also be zero. CP Plan The CP Plan is based on a series of payout matrices for the North America and Asia Pacific businesses, which provide a range of possible payouts depending on our performance against hurdles which assess volume growth relative to, and above, market (“Growth Measure”), earnings (“Return Measure”), and for the NA business, performance of the interiors business. In addition for fiscal year 2020, for the NA business, volume growth against the vinyl market was introduced as a metric in replacement of growth against the "wood look" competitors. Given the acquisition of Fermacell in April 2018, a CP Plan for James Hardie Europe ("JHEU") was developed based on revenue and returns similar in nature to the NA and Asia Pacific plans. Each Senior Executive Officer can receive between 0.0x and 3.0x of their STI target allocated to the CP Plan based on the results of the plan of which the Senior Executive Officer is tied. All Senior Executive Officers are tied to either the NA multiple (Messrs Gadd and Kilcullen) or a composite multiple derived from the metrics for the NA, Asia Pacific and Europe businesses combined (70% NA, 20% Asia Pacific and 10% Europe for Dr Truong, and Messrs Blasko, Miele and Marsh). IP Plan Under the IP Plan, the Remuneration Committee approves a series of one-year individual performance goals which, along with our leadership behaviors, are used to assess the performance of our Senior Executive Officers. The IP Plan links financial rewards to the Senior Executive Officer’s achievement of specific objectives aligned with the strategic plan and contributed to shareholder value, but are not captured directly by financial measures in the CP Plan. Each Senior Executive Officer can receive between 0% and 150% of their STI target allocated to the IP Plan. Payout Matrices We use both performance measures (Growth Measure and Return Measure) in the payout matrices for our NA and Asia Pacific businesses in order to ensure that as management increases its top line market growth
Table of Contents James Hardie 2020 Remuneration Report 11 focus, it does not do so at the expense of short- to medium-term earnings. Management is encouraged to balance market growth and earnings returns since achievement of a higher reward requires management to generate both strong earnings and growth relative to and above market. Higher returns on one measure at the expense of the other measure may result in a lower reward or no reward at all. To ensure that the payout matrices represent genuinely challenging targets aligned with our executive remuneration philosophy, the Growth Measure is indexed to take into account changes in new housing starts in both NA and Asia Pacific and the NA repair and remodel market, while the Return Measure is indexed to take into account changes in pulp prices. The targets for the Return Measure exclude costs related to legacy issues. For our business in Europe, our performance is based on Revenues and a Return Measure. The plan for Europe is based on three components: Total Revenues - Europe, Fiber Cement Revenue - Europe and EBIT - Europe. The Remuneration Committee has reserved for itself discretion to change the STI paid. An example of when the Remuneration Committee would consider exercising this discretion includes external factors outside of management’s control, such as, a general shift in the housing market that is considered to have a sufficiently material impact on results. The Remuneration Committee will disclose the reasons for any such exercise of its discretion. The Remuneration Committee believes that the payout matrices are appropriate because they provide management with an incentive to achieve overall corporate goals, balance growth with returns in our primary markets, recognize the need to flexibly respond to strategic opportunities, incorporate indexing relative to market growth to account for factors beyond management’s control, and incorporate Remuneration Committee discretion to ensure appropriate outcomes. Payouts under the NA matrix may range from 0 to 200% of target, while payouts under the Asia Pacific matrix may range from 0 to 300% of target. We do not disclose the volume Growth Measure and earnings Return Measure targets for our NA or Asia Pacific businesses since these are commercial-in-confidence. However, achieving a target payment for the Return Measure under either the NA or Asia Pacific payout matrix for fiscal year 2020 would have required performance equal to the average of performance for the previous three years and the fiscal year 2020 plan. Achieving a target payout for the Growth Measure would have required growth substantially above market growth.
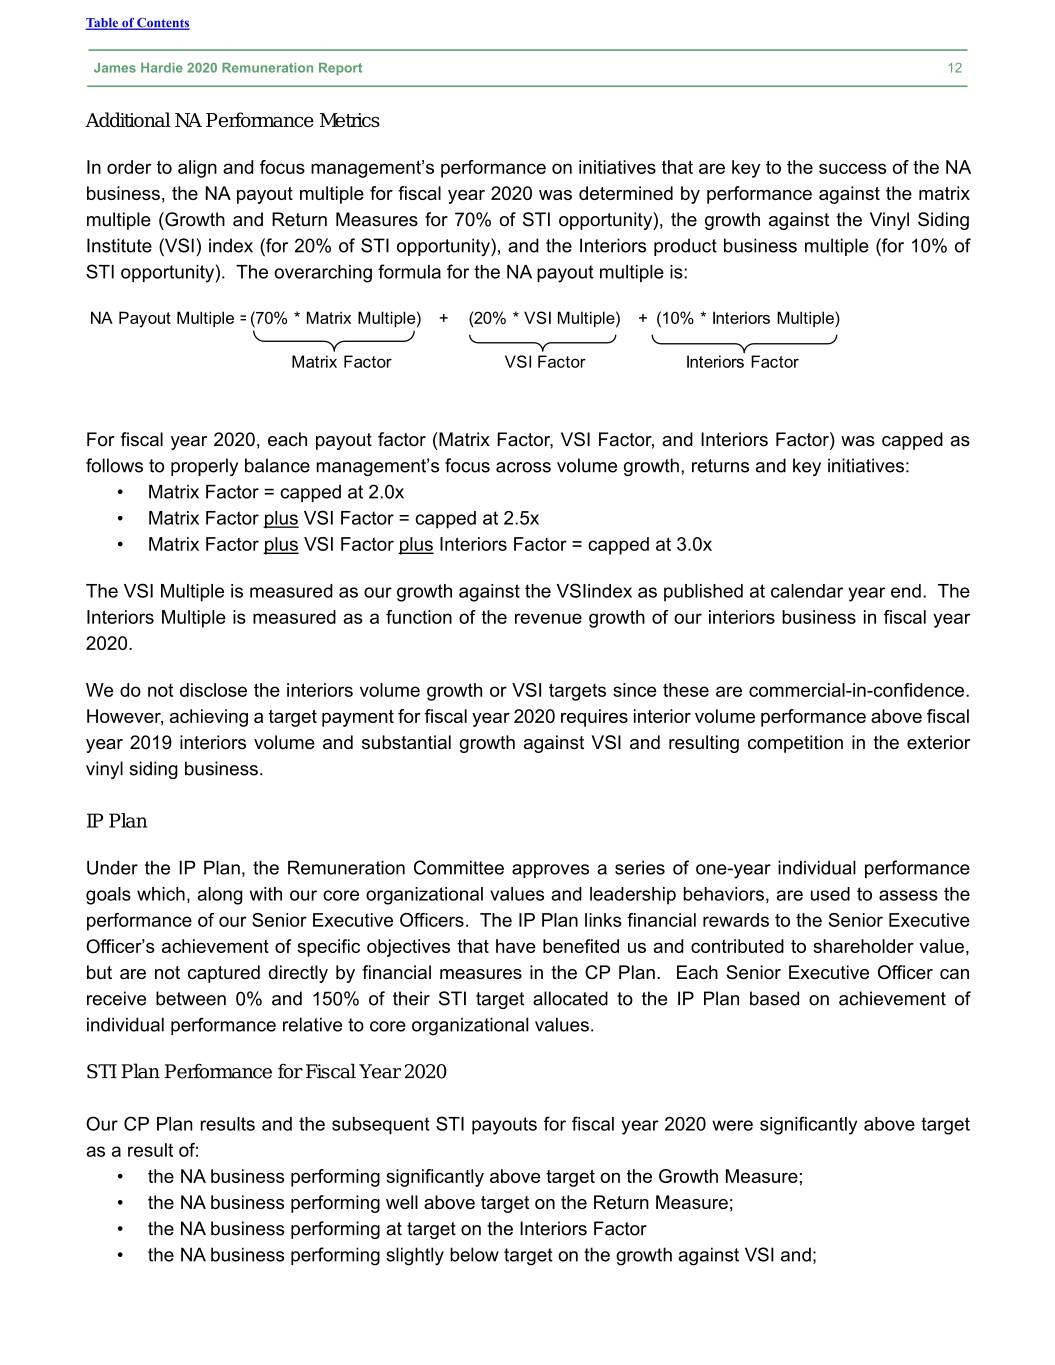
Table of Contents James Hardie 2020 Remuneration Report 12 Additional NA Performance Metrics In order to align and focus management’s performance on initiatives that are key to the success of the NA business, the NA payout multiple for fiscal year 2020 was determined by performance against the matrix multiple (Growth and Return Measures for 70% of STI opportunity), the growth against the Vinyl Siding Institute (VSI) index (for 20% of STI opportunity), and the Interiors product business multiple (for 10% of STI opportunity). The overarching formula for the NA payout multiple is: NA Payout Multiple =(70% * Matrix Multiple) + (20% * VSI Multiple) + (10% * Interiors Multiple) Matrix Factor VSI Factor Interiors Factor For fiscal year 2020, each payout factor (Matrix Factor, VSI Factor, and Interiors Factor) was capped as follows to properly balance management’s focus across volume growth, returns and key initiatives: • Matrix Factor = capped at 2.0x • Matrix Factor plus VSI Factor = capped at 2.5x • Matrix Factor plus VSI Factor plus Interiors Factor = capped at 3.0x The VSI Multiple is measured as our growth against the VSIindex as published at calendar year end. The Interiors Multiple is measured as a function of the revenue growth of our interiors business in fiscal year 2020. We do not disclose the interiors volume growth or VSI targets since these are commercial-in-confidence. However, achieving a target payment for fiscal year 2020 requires interior volume performance above fiscal year 2019 interiors volume and substantial growth against VSI and resulting competition in the exterior vinyl siding business. IP Plan Under the IP Plan, the Remuneration Committee approves a series of one-year individual performance goals which, along with our core organizational values and leadership behaviors, are used to assess the performance of our Senior Executive Officers. The IP Plan links financial rewards to the Senior Executive Officer’s achievement of specific objectives that have benefited us and contributed to shareholder value, but are not captured directly by financial measures in the CP Plan. Each Senior Executive Officer can receive between 0% and 150% of their STI target allocated to the IP Plan based on achievement of individual performance relative to core organizational values. STI Plan Performance for Fiscal Year 2020 Our CP Plan results and the subsequent STI payouts for fiscal year 2020 were significantly above target as a result of: • the NA business performing significantly above target on the Growth Measure; • the NA business performing well above target on the Return Measure; • the NA business performing at target on the Interiors Factor • the NA business performing slightly below target on the growth against VSI and;
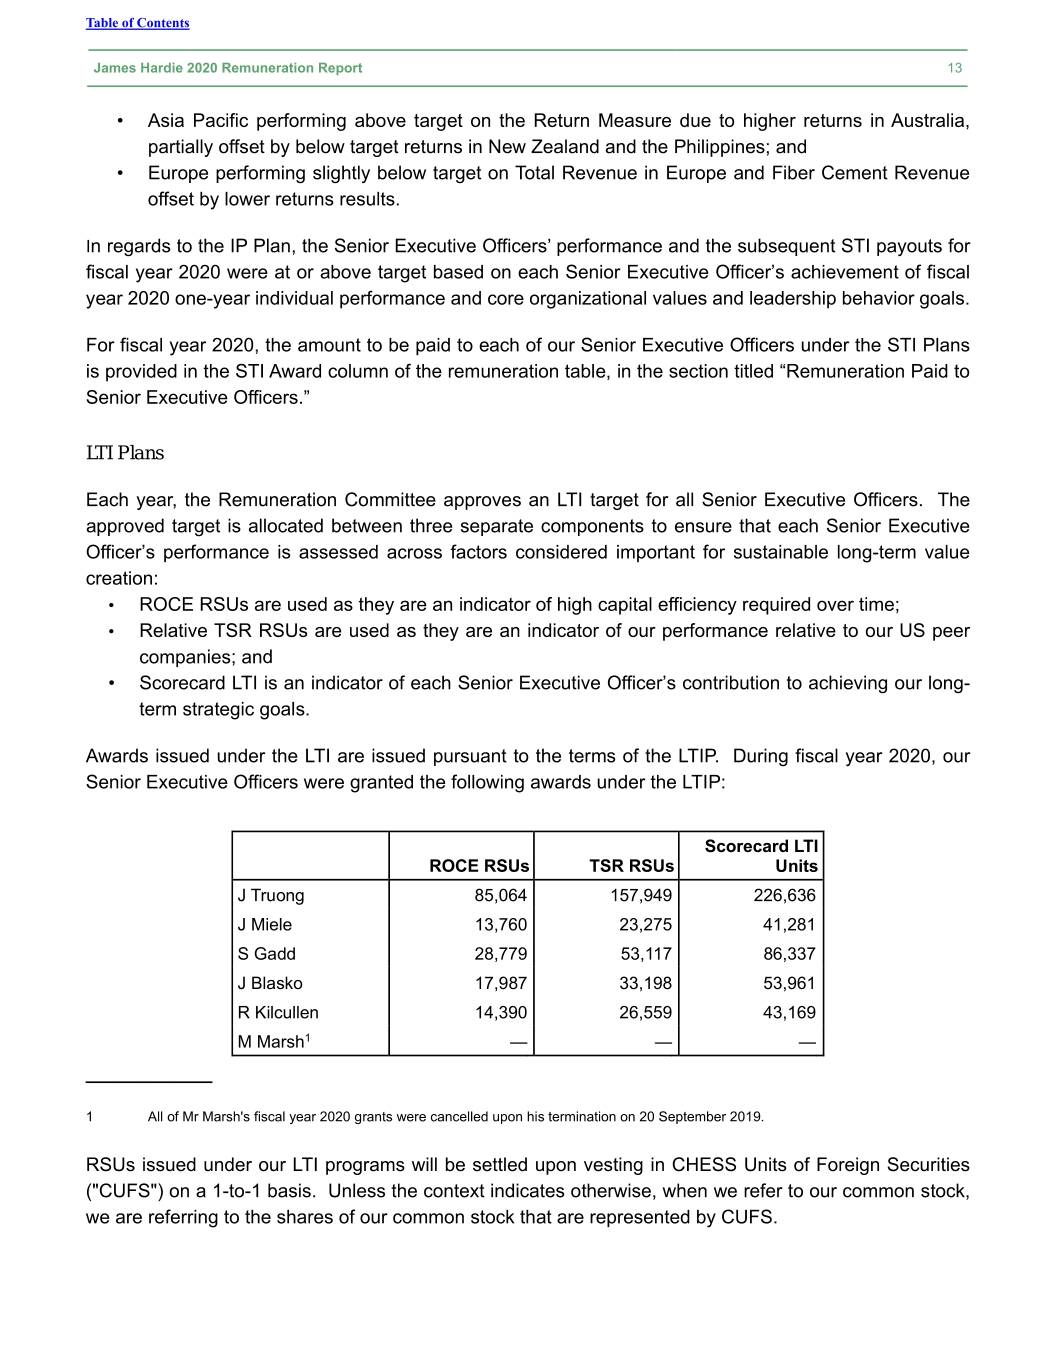
Table of Contents James Hardie 2020 Remuneration Report 13 • Asia Pacific performing above target on the Return Measure due to higher returns in Australia, partially offset by below target returns in New Zealand and the Philippines; and • Europe performing slightly below target on Total Revenue in Europe and Fiber Cement Revenue offset by lower returns results. In regards to the IP Plan, the Senior Executive Officers’ performance and the subsequent STI payouts for fiscal year 2020 were at or above target based on each Senior Executive Officer’s achievement of fiscal year 2020 one-year individual performance and core organizational values and leadership behavior goals. For fiscal year 2020, the amount to be paid to each of our Senior Executive Officers under the STI Plans is provided in the STI Award column of the remuneration table, in the section titled “Remuneration Paid to Senior Executive Officers.” LTI Plans Each year, the Remuneration Committee approves an LTI target for all Senior Executive Officers. The approved target is allocated between three separate components to ensure that each Senior Executive Officer’s performance is assessed across factors considered important for sustainable long-term value creation: • ROCE RSUs are used as they are an indicator of high capital efficiency required over time; • Relative TSR RSUs are used as they are an indicator of our performance relative to our US peer companies; and • Scorecard LTI is an indicator of each Senior Executive Officer’s contribution to achieving our long- term strategic goals. Awards issued under the LTI are issued pursuant to the terms of the LTIP. During fiscal year 2020, our Senior Executive Officers were granted the following awards under the LTIP: Scorecard LTI ROCE RSUs TSR RSUs Units J Truong 85,064 157,949 226,636 J Miele 13,760 23,275 41,281 S Gadd 28,779 53,117 86,337 J Blasko 17,987 33,198 53,961 R Kilcullen 14,390 26,559 43,169 M Marsh1 — — — ____________ 1 All of Mr Marsh's fiscal year 2020 grants were cancelled upon his termination on 20 September 2019. RSUs issued under our LTI programs will be settled upon vesting in CHESS Units of Foreign Securities ("CUFS") on a 1-to-1 basis. Unless the context indicates otherwise, when we refer to our common stock, we are referring to the shares of our common stock that are represented by CUFS.
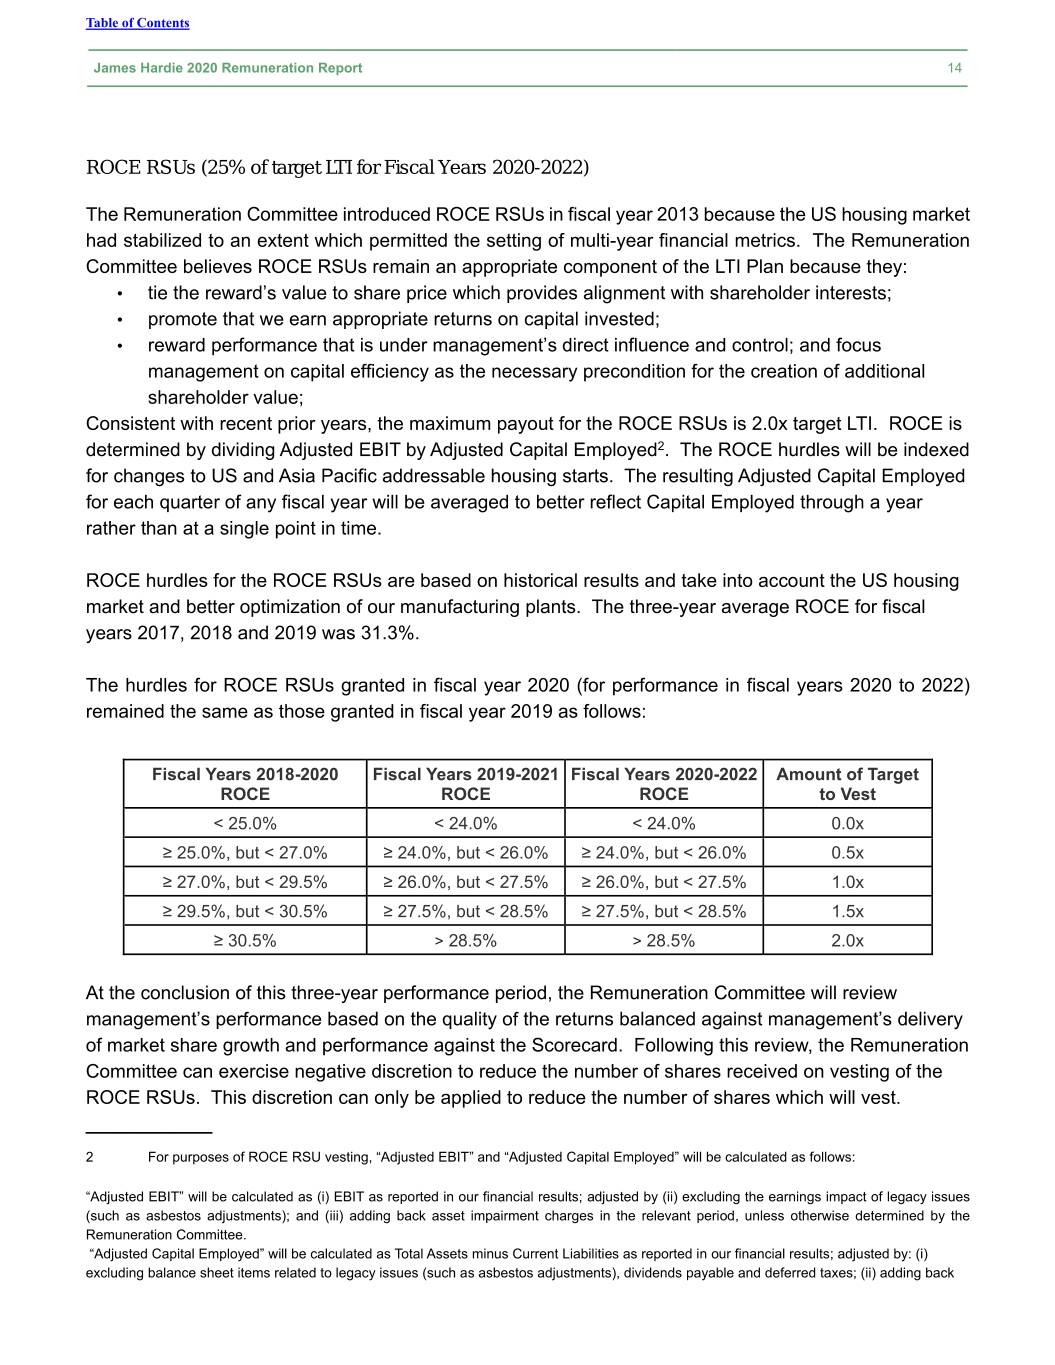
Table of Contents James Hardie 2020 Remuneration Report 14 ROCE RSUs (25% of target LTI for Fiscal Years 2020-2022) The Remuneration Committee introduced ROCE RSUs in fiscal year 2013 because the US housing market had stabilized to an extent which permitted the setting of multi-year financial metrics. The Remuneration Committee believes ROCE RSUs remain an appropriate component of the LTI Plan because they: • tie the reward’s value to share price which provides alignment with shareholder interests; • promote that we earn appropriate returns on capital invested; • reward performance that is under management’s direct influence and control; and focus management on capital efficiency as the necessary precondition for the creation of additional shareholder value; Consistent with recent prior years, the maximum payout for the ROCE RSUs is 2.0x target LTI. ROCE is determined by dividing Adjusted EBIT by Adjusted Capital Employed2. The ROCE hurdles will be indexed for changes to US and Asia Pacific addressable housing starts. The resulting Adjusted Capital Employed for each quarter of any fiscal year will be averaged to better reflect Capital Employed through a year rather than at a single point in time. ROCE hurdles for the ROCE RSUs are based on historical results and take into account the US housing market and better optimization of our manufacturing plants. The three-year average ROCE for fiscal years 2017, 2018 and 2019 was 31.3%. The hurdles for ROCE RSUs granted in fiscal year 2020 (for performance in fiscal years 2020 to 2022) remained the same as those granted in fiscal year 2019 as follows: Fiscal Years 2018-2020 Fiscal Years 2019-2021 Fiscal Years 2020-2022 Amount of Target ROCE ROCE ROCE to Vest < 25.0% < 24.0% < 24.0% 0.0x ≥ 25.0%, but < 27.0% ≥ 24.0%, but < 26.0% ≥ 24.0%, but < 26.0% 0.5x ≥ 27.0%, but < 29.5% ≥ 26.0%, but < 27.5% ≥ 26.0%, but < 27.5% 1.0x ≥ 29.5%, but < 30.5% ≥ 27.5%, but < 28.5% ≥ 27.5%, but < 28.5% 1.5x ≥ 30.5% > 28.5% > 28.5% 2.0x At the conclusion of this three-year performance period, the Remuneration Committee will review management’s performance based on the quality of the returns balanced against management’s delivery of market share growth and performance against the Scorecard. Following this review, the Remuneration Committee can exercise negative discretion to reduce the number of shares received on vesting of the ROCE RSUs. This discretion can only be applied to reduce the number of shares which will vest. ____________ 2 For purposes of ROCE RSU vesting, “Adjusted EBIT” and “Adjusted Capital Employed” will be calculated as follows: “Adjusted EBIT” will be calculated as (i) EBIT as reported in our financial results; adjusted by (ii) excluding the earnings impact of legacy issues (such as asbestos adjustments); and (iii) adding back asset impairment charges in the relevant period, unless otherwise determined by the Remuneration Committee. “Adjusted Capital Employed” will be calculated as Total Assets minus Current Liabilities as reported in our financial results; adjusted by: (i) excluding balance sheet items related to legacy issues (such as asbestos adjustments), dividends payable and deferred taxes; (ii) adding back
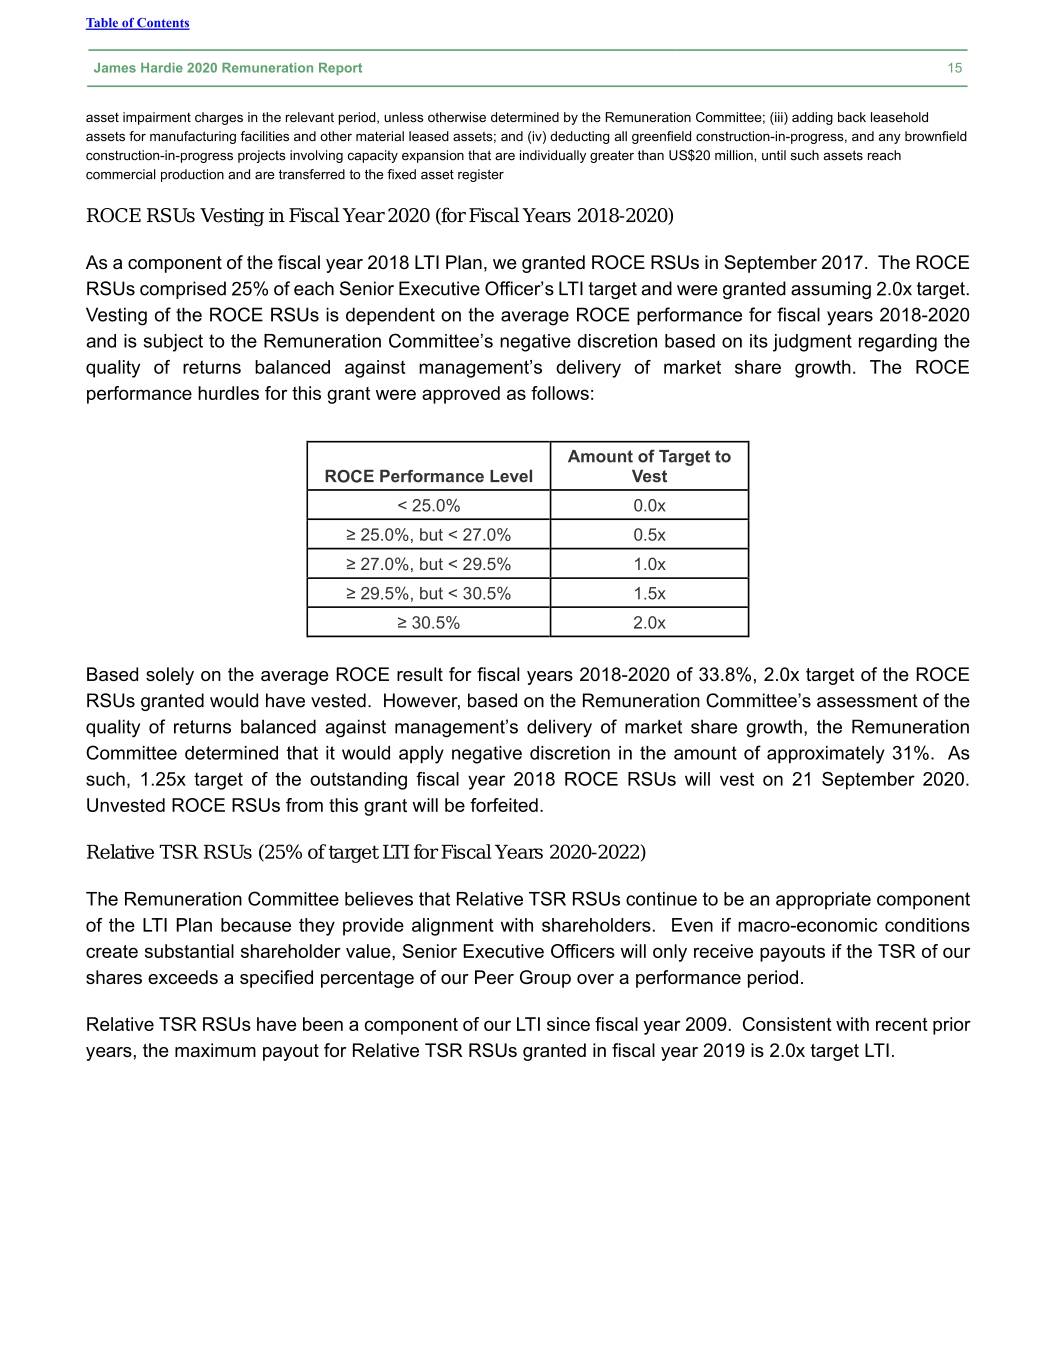
Table of Contents James Hardie 2020 Remuneration Report 15 asset impairment charges in the relevant period, unless otherwise determined by the Remuneration Committee; (iii) adding back leasehold assets for manufacturing facilities and other material leased assets; and (iv) deducting all greenfield construction-in-progress, and any brownfield construction-in-progress projects involving capacity expansion that are individually greater than US$20 million, until such assets reach commercial production and are transferred to the fixed asset register ROCE RSUs Vesting in Fiscal Year 2020 (for Fiscal Years 2018-2020) As a component of the fiscal year 2018 LTI Plan, we granted ROCE RSUs in September 2017. The ROCE RSUs comprised 25% of each Senior Executive Officer’s LTI target and were granted assuming 2.0x target. Vesting of the ROCE RSUs is dependent on the average ROCE performance for fiscal years 2018-2020 and is subject to the Remuneration Committee’s negative discretion based on its judgment regarding the quality of returns balanced against management’s delivery of market share growth. The ROCE performance hurdles for this grant were approved as follows: Amount of Target to ROCE Performance Level Vest < 25.0% 0.0x ≥ 25.0%, but < 27.0% 0.5x ≥ 27.0%, but < 29.5% 1.0x ≥ 29.5%, but < 30.5% 1.5x ≥ 30.5% 2.0x Based solely on the average ROCE result for fiscal years 2018-2020 of 33.8%, 2.0x target of the ROCE RSUs granted would have vested. However, based on the Remuneration Committee’s assessment of the quality of returns balanced against management’s delivery of market share growth, the Remuneration Committee determined that it would apply negative discretion in the amount of approximately 31%. As such, 1.25x target of the outstanding fiscal year 2018 ROCE RSUs will vest on 21 September 2020. Unvested ROCE RSUs from this grant will be forfeited. Relative TSR RSUs (25% of target LTI for Fiscal Years 2020-2022) The Remuneration Committee believes that Relative TSR RSUs continue to be an appropriate component of the LTI Plan because they provide alignment with shareholders. Even if macro-economic conditions create substantial shareholder value, Senior Executive Officers will only receive payouts if the TSR of our shares exceeds a specified percentage of our Peer Group over a performance period. Relative TSR RSUs have been a component of our LTI since fiscal year 2009. Consistent with recent prior years, the maximum payout for Relative TSR RSUs granted in fiscal year 2019 is 2.0x target LTI.
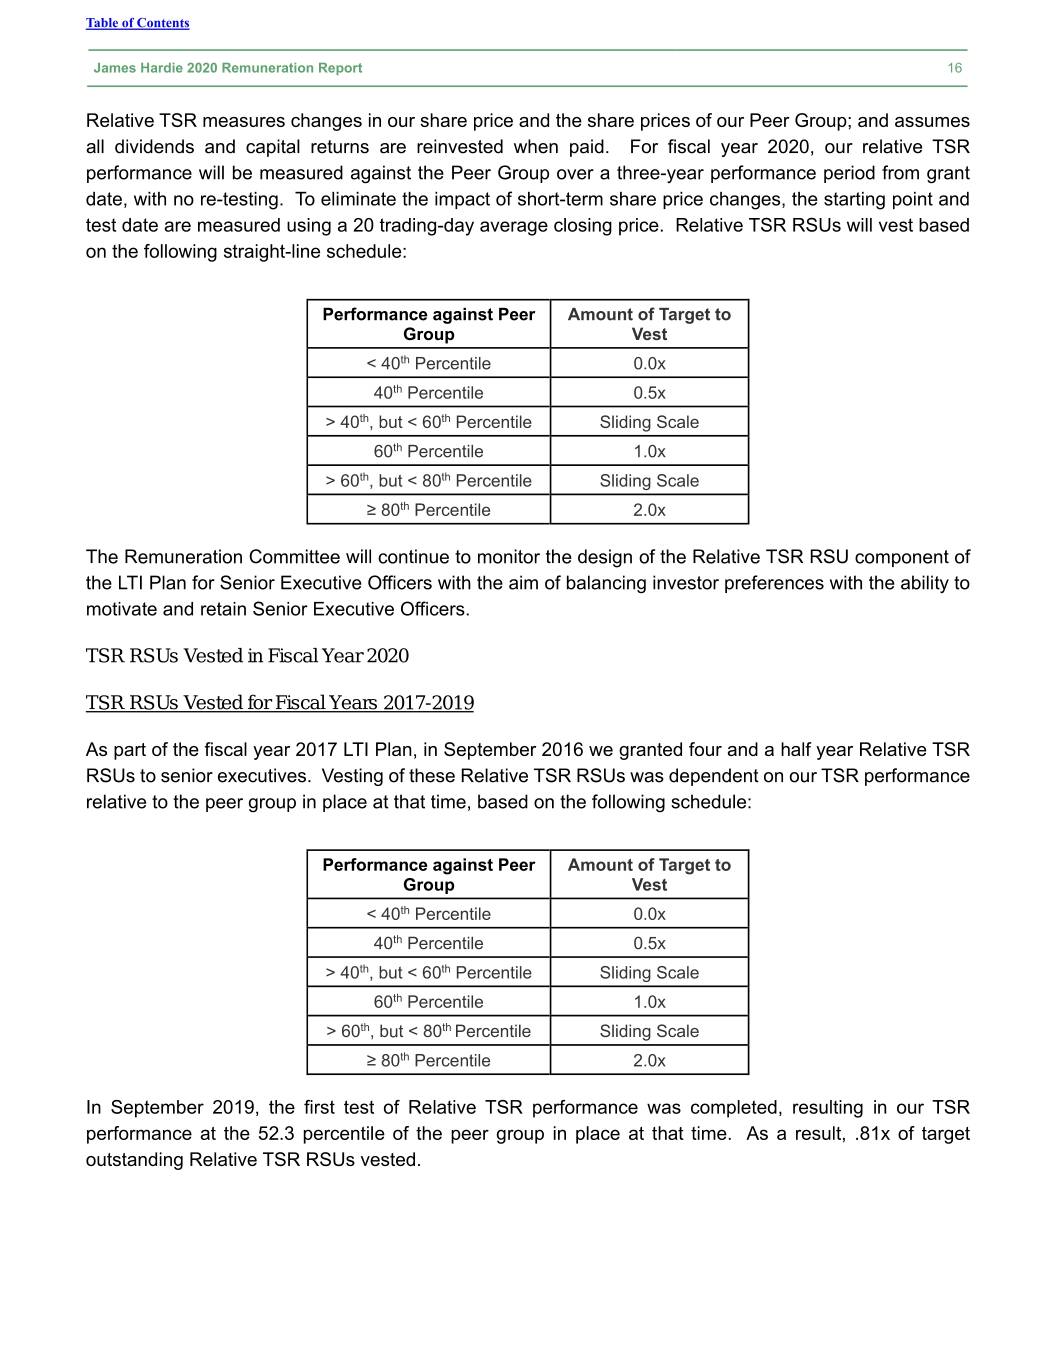
Table of Contents James Hardie 2020 Remuneration Report 16 Relative TSR measures changes in our share price and the share prices of our Peer Group; and assumes all dividends and capital returns are reinvested when paid. For fiscal year 2020, our relative TSR performance will be measured against the Peer Group over a three-year performance period from grant date, with no re-testing. To eliminate the impact of short-term share price changes, the starting point and test date are measured using a 20 trading-day average closing price. Relative TSR RSUs will vest based on the following straight-line schedule: Performance against Peer Amount of Target to Group Vest < 40th Percentile 0.0x 40th Percentile 0.5x > 40th, but < 60th Percentile Sliding Scale 60th Percentile 1.0x > 60th, but < 80th Percentile Sliding Scale ≥ 80th Percentile 2.0x The Remuneration Committee will continue to monitor the design of the Relative TSR RSU component of the LTI Plan for Senior Executive Officers with the aim of balancing investor preferences with the ability to motivate and retain Senior Executive Officers. TSR RSUs Vested in Fiscal Year 2020 TSR RSUs Vested for Fiscal Years 2017-2019 As part of the fiscal year 2017 LTI Plan, in September 2016 we granted four and a half year Relative TSR RSUs to senior executives. Vesting of these Relative TSR RSUs was dependent on our TSR performance relative to the peer group in place at that time, based on the following schedule: Performance against Peer Amount of Target to Group Vest < 40th Percentile 0.0x 40th Percentile 0.5x > 40th, but < 60th Percentile Sliding Scale 60th Percentile 1.0x > 60th, but < 80th Percentile Sliding Scale ≥ 80th Percentile 2.0x In September 2019, the first test of Relative TSR performance was completed, resulting in our TSR performance at the 52.3 percentile of the peer group in place at that time. As a result, .81x of target outstanding Relative TSR RSUs vested.
Table of Contents James Hardie 2020 Remuneration Report 17 TSR RSUs Vested for Fiscal Years 2016-2018 In addition, the second test of the FY16 TSR RSUs was completed, resulting in our TSR performance at the 52.3 percentile of the peer group and as a result an additional .285x of target vested. On March 16, 2020, the final test was completed resulting in TSR performance at the 71.4 percentile of the peer group and as a result .763x of target vested and the balance were cancelled. Scorecard LTI (50% of target LTI for Fiscal Years 2020-2022) Scorecard LTI has been a component of our LTI Plan since fiscal year 2010. Each year, the Remuneration Committee approves a number of key management objectives and the results it expects to see achieved in relation to these objectives. These objectives are incorporated into that year’s grant of Scorecard LTI. At the end of the three-year performance period, the Remuneration Committee assesses our Senior Executive Officers’ collective performance on each key objective and each individual Senior Executive Officer’s contribution to those achievements and the Board reviews this assessment. Senior Executive Officers may receive different ratings depending on the contribution they have made during the three-year performance period. Although most of the objectives in the Scorecard have quantitative targets, we consider some of the targets to be commercial-in-confidence. Consistent since fiscal year 2010, the maximum payout for Scorecard LTI is 3.0x target LTI. The Remuneration Committee believes that the Scorecard LTI continues to be an appropriate component of its LTI Plan because it: • allows the Remuneration Committee to set targets for and reward executives on a balance of longer-term financial, strategic, business, customer and organizational development goals which it believes are important contributors to long-term creation of shareholder value; • ties the reward’s value to our share price over the medium-term; and • allows flexibility to apply rewards across different countries, while providing Senior Executive Officers with liquidity to pay tax or other material commitments at a time that coincides with vesting of shares (via the other components of the LTI Plan) as payment is in cash. No specific weighting is applied to any single objective and the final Scorecard assessment reflects an element of judgment by the Board. The Board may only exercise negative discretion (i.e., to reduce the amount of Scorecard LTI that will ultimately vest). It cannot enhance the maximum reward that can be received. The amount received by Senior Executive Officers is based on both our share price performance over the three-year performance period and the Senior Executive Officer’s Scorecard rating. At the start of the three-year performance period, we calculate the number of units each Senior Executive Officer could have acquired if they received a maximum payout on the Scorecard LTI at that time (based on a 20 trading-day average closing price). Depending on the Senior Executive Officer’s performance, between 0.0x and 3.0x of the Senior Executive Officer’s Scorecard LTI awards will vest at the end of the three-year performance period. Each Senior Executive Officer will receive a cash payment based on our share price at the end of the period (based on a 20 trading-day average closing price) multiplied by the number of units they could have acquired at the start of the performance period, adjusted downward in accordance with their Scorecard rating.
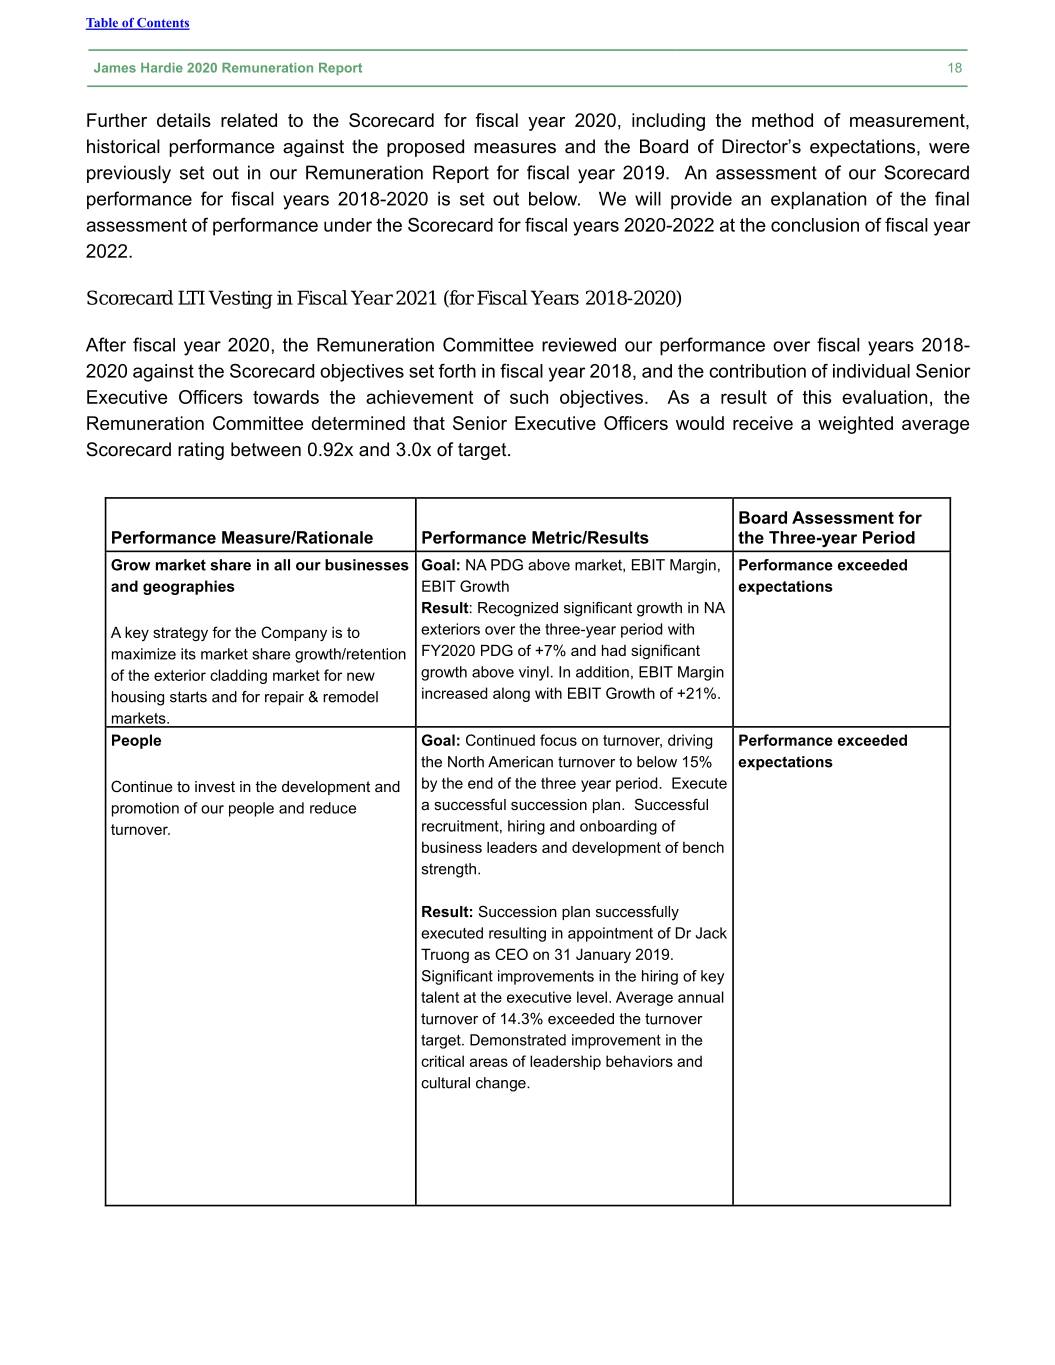
Table of Contents James Hardie 2020 Remuneration Report 18 Further details related to the Scorecard for fiscal year 2020, including the method of measurement, historical performance against the proposed measures and the Board of Director’s expectations, were previously set out in our Remuneration Report for fiscal year 2019. An assessment of our Scorecard performance for fiscal years 2018-2020 is set out below. We will provide an explanation of the final assessment of performance under the Scorecard for fiscal years 2020-2022 at the conclusion of fiscal year 2022. Scorecard LTI Vesting in Fiscal Year 2021 (for Fiscal Years 2018-2020) After fiscal year 2020, the Remuneration Committee reviewed our performance over fiscal years 2018- 2020 against the Scorecard objectives set forth in fiscal year 2018, and the contribution of individual Senior Executive Officers towards the achievement of such objectives. As a result of this evaluation, the Remuneration Committee determined that Senior Executive Officers would receive a weighted average Scorecard rating between 0.92x and 3.0x of target. Board Assessment for Performance Measure/Rationale Performance Metric/Results the Three-year Period Grow market share in all our businesses Goal: NA PDG above market, EBIT Margin, Performance exceeded and geographies EBIT Growth expectations Result: Recognized significant growth in NA A key strategy for the Company is to exteriors over the three-year period with maximize its market share growth/retention FY2020 PDG of +7% and had significant of the exterior cladding market for new growth above vinyl. In addition, EBIT Margin housing starts and for repair & remodel increased along with EBIT Growth of +21%. markets. People Goal: Continued focus on turnover, driving Performance exceeded the North American turnover to below 15% expectations Continue to invest in the development and by the end of the three year period. Execute promotion of our people and reduce a successful succession plan. Successful turnover. recruitment, hiring and onboarding of business leaders and development of bench strength. Result: Succession plan successfully executed resulting in appointment of Dr Jack Truong as CEO on 31 January 2019. Significant improvements in the hiring of key talent at the executive level. Average annual turnover of 14.3% exceeded the turnover target. Demonstrated improvement in the critical areas of leadership behaviors and cultural change.
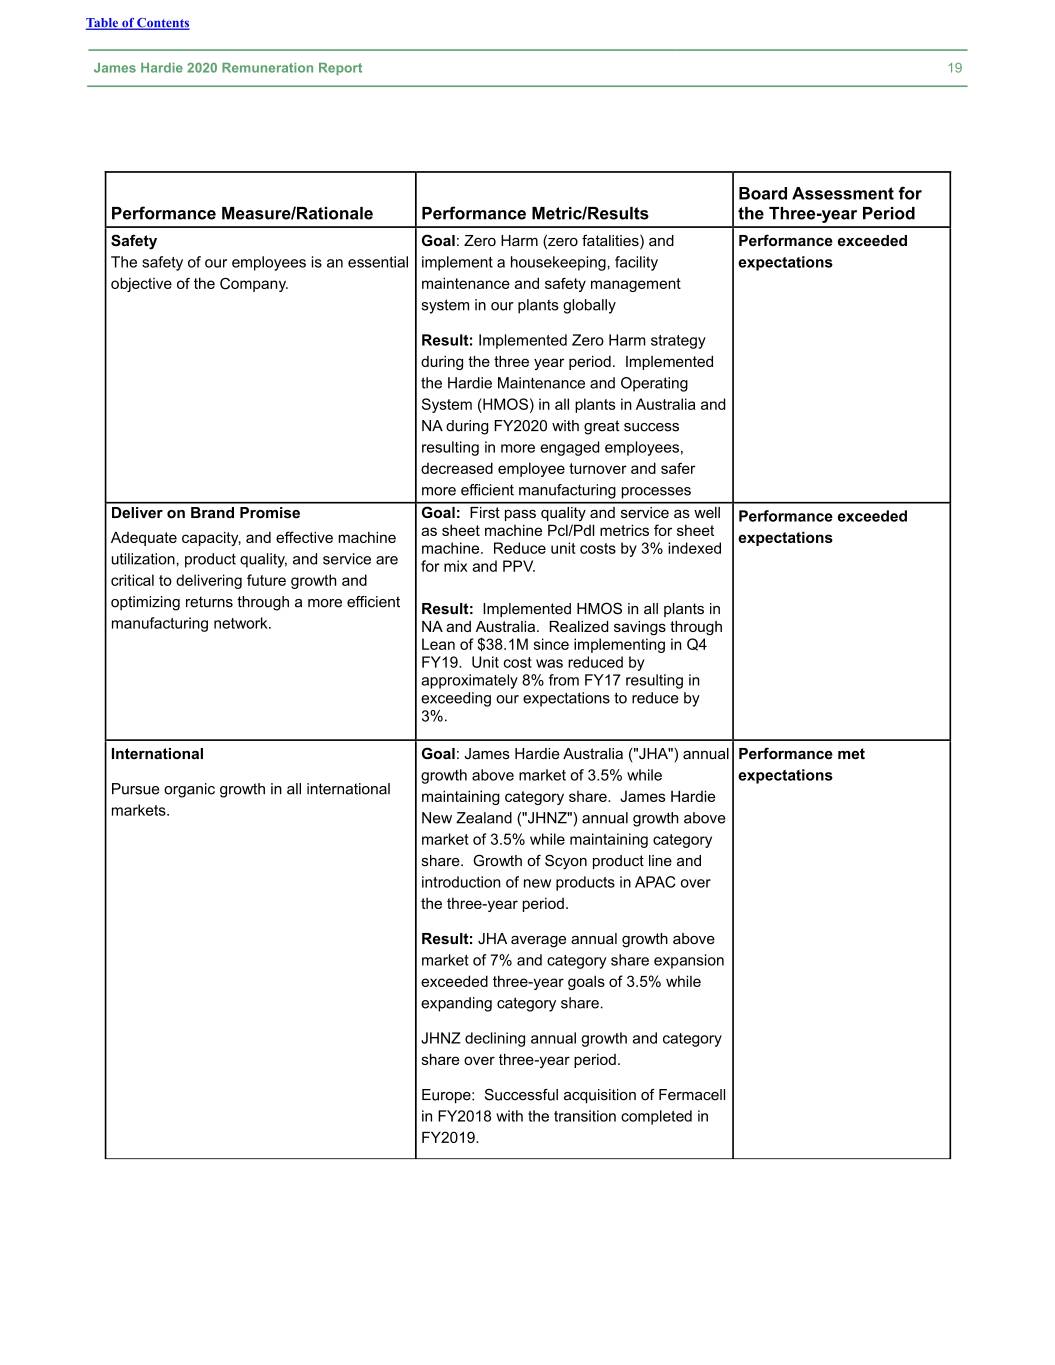
Table of Contents James Hardie 2020 Remuneration Report 19 Board Assessment for Performance Measure/Rationale Performance Metric/Results the Three-year Period Safety Goal: Zero Harm (zero fatalities) and Performance exceeded The safety of our employees is an essential implement a housekeeping, facility expectations objective of the Company. maintenance and safety management system in our plants globally Result: Implemented Zero Harm strategy during the three year period. Implemented the Hardie Maintenance and Operating System (HMOS) in all plants in Australia and NA during FY2020 with great success resulting in more engaged employees, decreased employee turnover and safer more efficient manufacturing processes Deliver on Brand Promise Goal: First pass quality and service as well Performance exceeded Adequate capacity, and effective machine as sheet machine Pcl/Pdl metrics for sheet expectations machine. Reduce unit costs by 3% indexed utilization, product quality, and service are for mix and PPV. critical to delivering future growth and optimizing returns through a more efficient Result: Implemented HMOS in all plants in manufacturing network. NA and Australia. Realized savings through Lean of $38.1M since implementing in Q4 FY19. Unit cost was reduced by approximately 8% from FY17 resulting in exceeding our expectations to reduce by 3%. International Goal: James Hardie Australia ("JHA") annual Performance met growth above market of 3.5% while expectations Pursue organic growth in all international maintaining category share. James Hardie markets. New Zealand ("JHNZ") annual growth above market of 3.5% while maintaining category share. Growth of Scyon product line and introduction of new products in APAC over the three-year period. Result: JHA average annual growth above market of 7% and category share expansion exceeded three-year goals of 3.5% while expanding category share. JHNZ declining annual growth and category share over three-year period. Europe: Successful acquisition of Fermacell in FY2018 with the transition completed in FY2019.
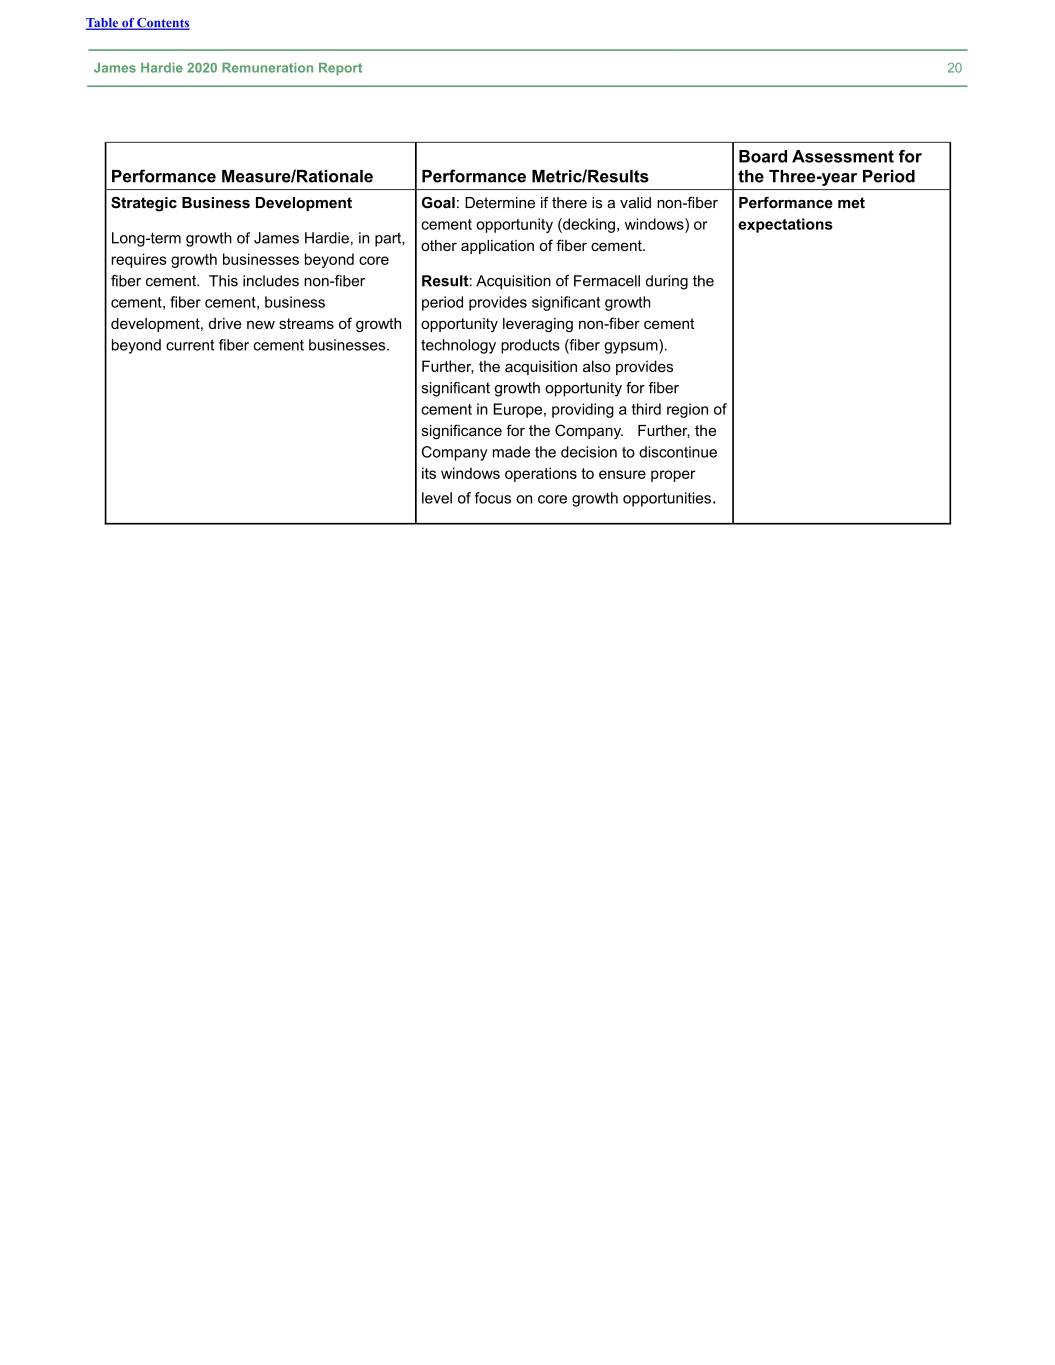
Table of Contents James Hardie 2020 Remuneration Report 20 Board Assessment for Performance Measure/Rationale Performance Metric/Results the Three-year Period Strategic Business Development Goal: Determine if there is a valid non-fiber Performance met cement opportunity (decking, windows) or expectations Long-term growth of James Hardie, in part, other application of fiber cement. requires growth businesses beyond core fiber cement. This includes non-fiber Result: Acquisition of Fermacell during the cement, fiber cement, business period provides significant growth development, drive new streams of growth opportunity leveraging non-fiber cement beyond current fiber cement businesses. technology products (fiber gypsum). Further, the acquisition also provides significant growth opportunity for fiber cement in Europe, providing a third region of significance for the Company. Further, the Company made the decision to discontinue its windows operations to ensure proper level of focus on core growth opportunities.
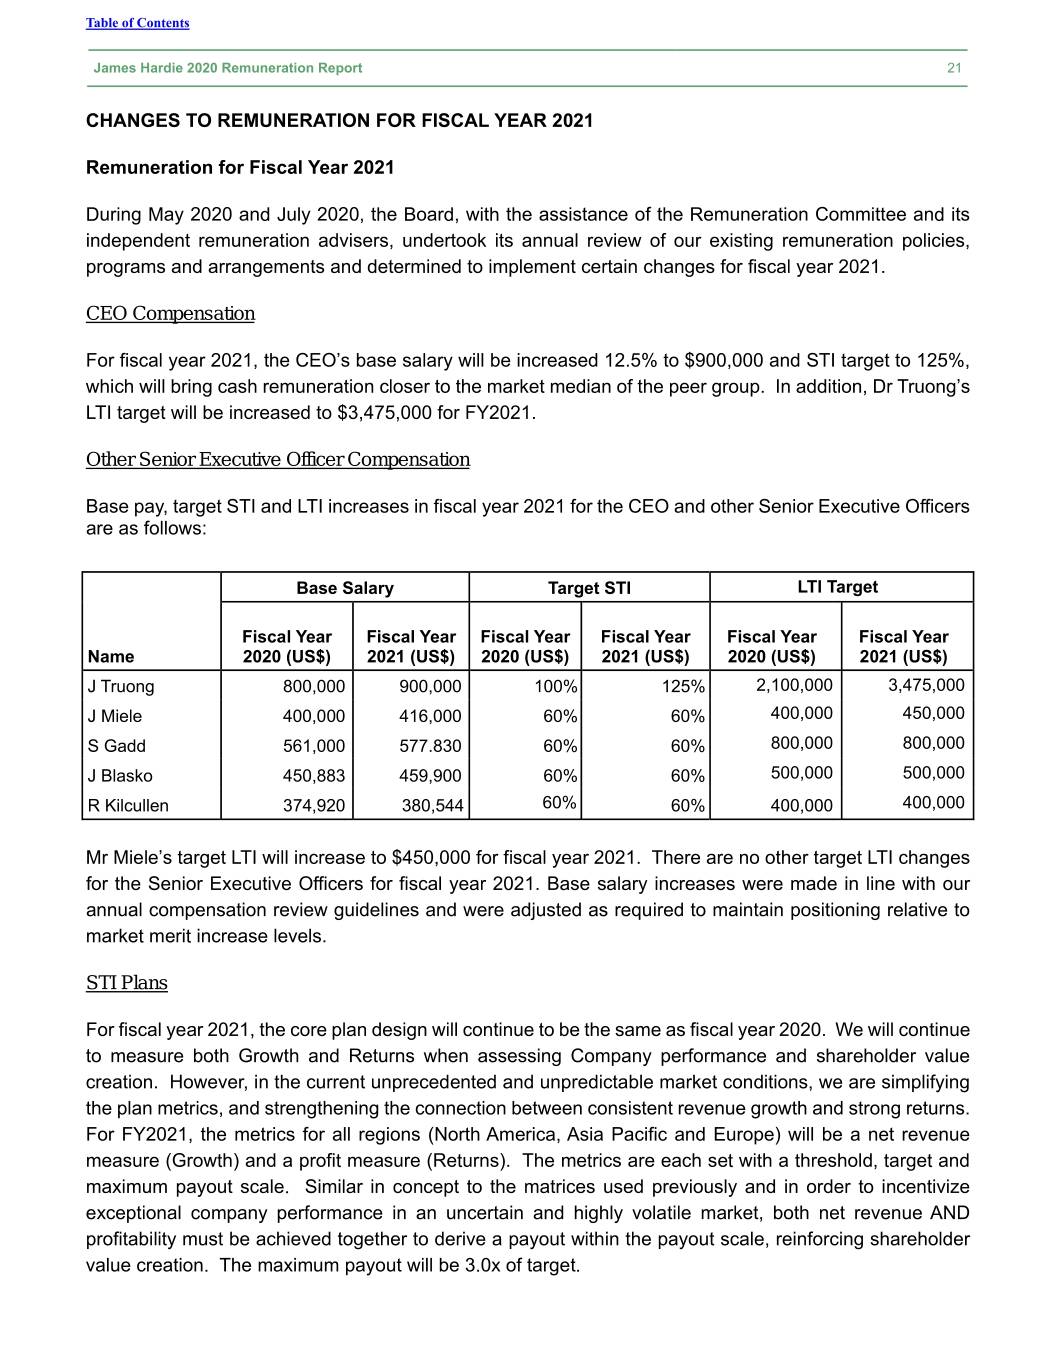
Table of Contents James Hardie 2020 Remuneration Report 21 CHANGES TO REMUNERATION FOR FISCAL YEAR 2021 Remuneration for Fiscal Year 2021 During May 2020 and July 2020, the Board, with the assistance of the Remuneration Committee and its independent remuneration advisers, undertook its annual review of our existing remuneration policies, programs and arrangements and determined to implement certain changes for fiscal year 2021. CEO Compensation For fiscal year 2021, the CEO’s base salary will be increased 12.5% to $900,000 and STI target to 125%, which will bring cash remuneration closer to the market median of the peer group. In addition, Dr Truong’s LTI target will be increased to $3,475,000 for FY2021. Other Senior Executive Officer Compensation Base pay, target STI and LTI increases in fiscal year 2021 for the CEO and other Senior Executive Officers are as follows: Base Salary Target STI LTI Target Fiscal Year Fiscal Year Fiscal Year Fiscal Year Fiscal Year Fiscal Year Name 2020 (US$) 2021 (US$) 2020 (US$) 2021 (US$) 2020 (US$) 2021 (US$) J Truong 800,000 900,000 100% 125% 2,100,000 3,475,000 J Miele 400,000 416,000 60% 60% 400,000 450,000 S Gadd 561,000 577.830 60% 60% 800,000 800,000 J Blasko 450,883 459,900 60% 60% 500,000 500,000 R Kilcullen 374,920 380,544 60% 60% 400,000 400,000 Mr Miele’s target LTI will increase to $450,000 for fiscal year 2021. There are no other target LTI changes for the Senior Executive Officers for fiscal year 2021. Base salary increases were made in line with our annual compensation review guidelines and were adjusted as required to maintain positioning relative to market merit increase levels. STI Plans For fiscal year 2021, the core plan design will continue to be the same as fiscal year 2020. We will continue to measure both Growth and Returns when assessing Company performance and shareholder value creation. However, in the current unprecedented and unpredictable market conditions, we are simplifying the plan metrics, and strengthening the connection between consistent revenue growth and strong returns. For FY2021, the metrics for all regions (North America, Asia Pacific and Europe) will be a net revenue measure (Growth) and a profit measure (Returns). The metrics are each set with a threshold, target and maximum payout scale. Similar in concept to the matrices used previously and in order to incentivize exceptional company performance in an uncertain and highly volatile market, both net revenue AND profitability must be achieved together to derive a payout within the payout scale, reinforcing shareholder value creation. The maximum payout will be 3.0x of target.
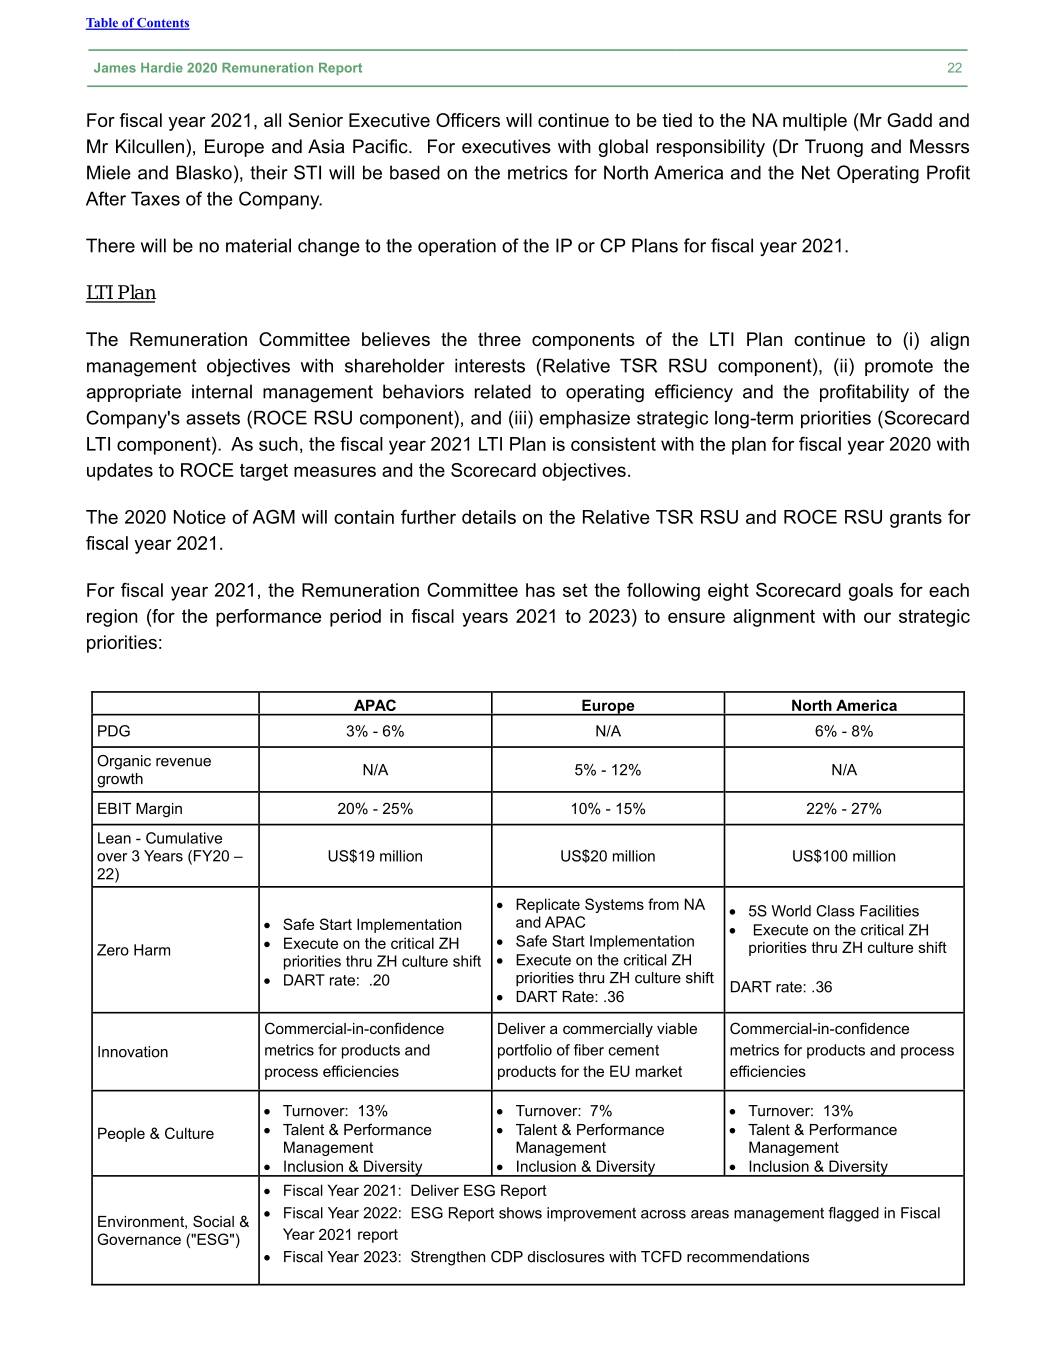
Table of Contents James Hardie 2020 Remuneration Report 22 For fiscal year 2021, all Senior Executive Officers will continue to be tied to the NA multiple (Mr Gadd and Mr Kilcullen), Europe and Asia Pacific. For executives with global responsibility (Dr Truong and Messrs Miele and Blasko), their STI will be based on the metrics for North America and the Net Operating Profit After Taxes of the Company. There will be no material change to the operation of the IP or CP Plans for fiscal year 2021. LTI Plan The Remuneration Committee believes the three components of the LTI Plan continue to (i) align management objectives with shareholder interests (Relative TSR RSU component), (ii) promote the appropriate internal management behaviors related to operating efficiency and the profitability of the Company's assets (ROCE RSU component), and (iii) emphasize strategic long-term priorities (Scorecard LTI component). As such, the fiscal year 2021 LTI Plan is consistent with the plan for fiscal year 2020 with updates to ROCE target measures and the Scorecard objectives. The 2020 Notice of AGM will contain further details on the Relative TSR RSU and ROCE RSU grants for fiscal year 2021. For fiscal year 2021, the Remuneration Committee has set the following eight Scorecard goals for each region (for the performance period in fiscal years 2021 to 2023) to ensure alignment with our strategic priorities: APAC Europe North America PDG 3% - 6% N/A 6% - 8% Organic revenue N/A 5% - 12% N/A growth EBIT Margin 20% - 25% 10% - 15% 22% - 27% Lean - Cumulative over 3 Years (FY20 – US$19 million US$20 million US$100 million 22) Replicate Systems from NA 5S World Class Facilities Safe Start Implementation and APAC Execute on the critical ZH Safe Start Implementation Zero Harm Execute on the critical ZH priorities thru ZH culture shift Execute on the critical ZH priorities thru ZH culture shift priorities thru ZH culture shift DART rate: .20 DART rate: .36 DART Rate: .36 Commercial-in-confidence Deliver a commercially viable Commercial-in-confidence Innovation metrics for products and portfolio of fiber cement metrics for products and process process efficiencies products for the EU market efficiencies Turnover: 13% Turnover: 7% Turnover: 13% People & Culture Talent & Performance Talent & Performance Talent & Performance Management Management Management Inclusion & Diversity Inclusion & Diversity Inclusion & Diversity Fiscal Year 2021: Deliver ESG Report Fiscal Year 2022: ESG Report shows improvement across areas management flagged in Fiscal Environment, Social & Governance ("ESG") Year 2021 report Fiscal Year 2023: Strengthen CDP disclosures with TCFD recommendations
Table of Contents James Hardie 2020 Remuneration Report 23 OTHER EXECUTIVE COMPENSATION PRACTICES Clawback Provisions The Remuneration Committee has established an executive performance-based compensation clawback policy in connection with performance-based compensation paid or awarded to certain executives. The clawback policy provides that the Board may, in all appropriate circumstances, recover from any current or former executive regardless of fault, that portion of any performance-based compensation erroneously awarded: (i) based on financial information required to be reported under applicable US or Australian securities laws or applicable exchange listing standards that would not have been paid in the three completed fiscal years preceding the year(s) in which an accounting restatement is required to correct a material error; or (ii) during the previous three completed fiscal years as a result of any errors or omissions in objective, calculable performance measures contained in formal papers presented to and relied upon by the Board for purposes of determining compensation to be paid or awarded, where the absence of such errors or omissions would have resulted in there being a material negative impact on the amount of performance-based compensation paid or awarded. The clawback policy applies to any person designated as a participant by the Board in the annual LTI Plan and applies to any compensation that is granted, earned or vested based wholly or in part upon the attainment of any financial or other objective, calculable performance measure under any incentive, bonus, retirement or equity compensation plan maintained by the Company, including, without limitation, the STI Plan and LTI Plan. Salaries, discretionary bonuses, time-based equity awards and bonuses or equity awards based on subjective, non-financial measures, including strategic or personal performance metrics, are excluded. The excess compensation requiring recovery shall be the amount of performance-based compensation that an executive received, based on the erroneous data, less the amount that would have been paid to the executive based on the restated or corrected data. All recoverable amounts shall be calculated on a pre-tax basis. For equity awards still held at the time of the recovery, the recoverable amount shall be the amount vested in excess of the number that should have vested under the restated or corrected financial reporting measure. For vested equity awards which have already been sold, the recoverable amount shall be the sale proceeds the executive received with respect to the excess number of shares. In addition, all fiscal year 2020 LTI grants made to Dr Truong and Messrs Miele, Gadd, Blasko and Kilcullen are subject to a specific clawback provision for violation of a limited non-compete provision that specifically prohibits executives from working for designated competitors or for any company that may enter the fiber cement market within two years of departure. For fiscal year 2021, all LTI grants made to Senior Executive Officers will be subject to the clawback provision. Stock Ownership Guidelines The Remuneration Committee believes that Senior Executive Officers should hold a meaningful level of our stock to further align their interests with those of our shareholders. We have adopted stock ownership guidelines for the CEO and other Senior Executive Officers, respectively, which require them to accumulate holdings of three times and one times their base salary, respectively, in our stock over a period of five years
Table of Contents James Hardie 2020 Remuneration Report 24 from the effective date of the guidelines (1 April 2009) or the date the Senior Executive Officer first becomes subject to the applicable guideline. Until the stock ownership guidelines have been met, Senior Executive Officers are required to retain at least 75% of shares obtained under our LTI Plans (net of taxes and other costs). Once Senior Executive Officers have met or exceeded their stock ownership guidelines, they are required to retain at least 25% of shares issued under our LTI Plans through the vesting of RSUs (net of taxes and other costs) for a period of two years (by way of a holding lock), after which time those shares can be sold (provided the Senior Executive Officer remains at or above the stock ownership guideline). As of 31 March 2020, all Senior Executive Officers have either achieved the minimum share ownership threshold or are within the initial five year accumulation period. Equity Award Practices The FY2021 annual equity awards under the LTI Plan are were approved by the Remuneration Committee in August 2020 with awards generally issued in August of each year. We do not time the granting of equity awards to the disclosure of material information. For details of the application of our insider-trading policy for equity award grant participants, including our prohibition on employee hedging transactions, see the “Insider Trading” section of our Annual Report on Form 20-F for the fiscal year ended 31 March 2020 (the “2020 Annual Report”). Loans We did not grant loans to Senior Executive Officers during fiscal year 2020. There are no loans outstanding to Senior Executive Officers. Employment and Severance Arrangements During fiscal year 2020, we maintained employment or severance agreements with Dr Truong and each of Messrs Gadd and Marsh. In addition, Mr Miele entered into an offer of employment agreement upon his acceptance as Chief Financial Officer on 25 February 2020. Matthew Marsh entered into a severance agreement upon his separation on 20 September 2019. Other than as provided under the terms of their respective employment agreements, no other termination payments are payable, except as required under the terms of the applicable STI or LTI plans. Employment Agreement with Dr Jack Truong Below is a summary of the key terms of Dr Truong’s current employment agreement: • The Employment Agreement is effective 31 January 2019 providing for service as CEO. • Dr Truong is an employee-at-will and either he or the Company may terminate his employment at any time or for any reason. • Base salary at an initial annual rate of US$800,000, subject to annual review and approval by the Remuneration Committee. • Participation in the Company’s annual STI and LTI Plans, with a minimum STI target of 100% of his annual base salary, as established by the Company’s Board.
Table of Contents James Hardie 2020 Remuneration Report 25 • Participation in the Company’s benefit, health and welfare plans and certain fringe benefits made generally available to Senior Executive Officers in accordance with his agreement and Company policies. • In the event that Dr Truong’s employment is terminated by the Company for any reason other than for “Cause”, or if Dr Truong voluntarily terminates his employment for “Good Reason”, in addition to those benefits that would be considered standard for any employee at termination (i.e., unpaid base salary, accrued vacation, unreimbursed business expenses and the payment of any earned but unpaid annual incentive award) Dr Truong will be entitled to receive the following benefits: An aggregate amount equal to the sum of: (i) two times Dr Truong’s base salary plus (ii) two times Dr Truong’s target annual incentive, payable in substantially equal periodic installments over the two year period following the date of termination; An amount, if any, with respect to the annual incentive award opportunity for the fiscal year in which termination of employment occurs, as determined under the terms and conditions of annual incentive program(s) then in-effect; All outstanding equity awards will be subject to the terms and conditions of the applicable equity incentive plan and any corresponding award agreement(s); provided, however, that (i) if the date of termination occurs prior to 21 August 2022, any service-based vesting criteria on the long-term incentive awards granted to Dr Truong on 21 August 2017 that were designated as retention awards will be deemed satisfied in full (but any performance criteria then still applicable to those awards will remain in effect); Monthly payments for a period of up to 24 months following the date of termination equal to the premium Dr Truong would be required to pay for continuing coverage under the Company’s health benefit plans; and Reasonable professional outplacement services for a period of up to 24 months following the date of termination. Offer of Employment with Jason Miele Below is a summary of the key terms provided in Mr Miele's Offer of Employment, which was entered into in conjunction with his promotion to Senior Vice President, Chief Financial Officer effective 25 February 2020: • Mr Miele is an employee-at-will and either he or the Company may terminate his employment at any time or any reason. • Base salary at an initial annual rate of US$400,000, subject to annual review and approval by the Remuneration Committee. • Participation in the Company’s annual STI and LTI Plans, with a STI target of 60% of his annual base salary. • Participation in the Company’s benefit, health and welfare plans and certain fringe benefits made generally available to Senior Executive Officers in accordance with his agreement and Company policies. • In the event that Mr Miele is terminated by the Company without "Cause" or terminated by Mr Miele for "Good Reason", in addition to those benefits that would be considered standard for any employee at termination (i.e., unpaid base salary, accrued vacation, unreimbursed business expenses and the payment of any earned but unpaid annual incentive award) Mr Miele will be entitled to receive the following benefits:
Table of Contents James Hardie 2020 Remuneration Report 26 ◦ Salary continuation for the one year period following the date of termination, provided the aggregate amount of such continuation payments shall be equal to the sum of (i) one times the base salary plus (ii) one times the annual incentive award opportunity, as then in-effect; ◦ All outstanding equity awards under the Company's equity incentive plans will be subject to the terms and conditions of the applicable plan and any corresponding award agreement(s); ◦ Monthly payments for a period of 12 months following the date of termination equal to the premium Mr Miele would be required to pay for continuing coverage under the Company’s health benefit plans; and ◦ Reasonable professional outplacement services for a period of up to 12 months following the date of termination. Severance Agreement with Matthew Marsh Effective 20 September 2019, we entered into a severance agreement with Mr Marsh. In consideration for the severance and other benefits described below, Mr Marsh executed a general release of claims against the Company. Mr Marsh's severance agreement provided for severance in the form of salary continuation payments totaling approximately US$321,000 over a six month period and an amount equal to the COBRA premiums for up to six months following separation or until Mr Marsh obtains new employment, whichever comes first. All outstanding equity awards were subject to the terms and conditions of the applicable award agreements and plan documentation. Severance Agreement with Sean Gadd During fiscal year 2019, we entered into a severance agreement with Mr Gadd in order to provide him with certain severance benefits under various termination scenarios. In the event of termination by the Company without cause or by the executive for good reason or death and disability, these benefits would be in addition to what would be considered standard for any employee at termination (i.e., lump sum unpaid base salary, accrued vacation, unreimbursed business expenses and the payment of any earned but unpaid annual incentive award) and would include: (i) salary continuation for one and one-half years provided the aggregate amount of such payments is equal to the sum of (a) one and one-half times the executive’s base salary, plus (b) one times the executive’s annual incentive opportunity, as then in effect; (ii) monthly payments for a period of 18 months following termination equal to the premium the executive would be required to pay for COBRA continuation coverage under the Company’s health benefit plans based on the level of coverage the executive has immediately prior to termination. Executive is not required to purchase COBRA continuation coverage or use these payments towards any payment of applicable premiums for COBRA continuation coverage; and (iii) reasonable outplacement services through a provider of the Company’s choice. Services terminate when the executive finds other employment and may not continue for more than 12 months following termination.
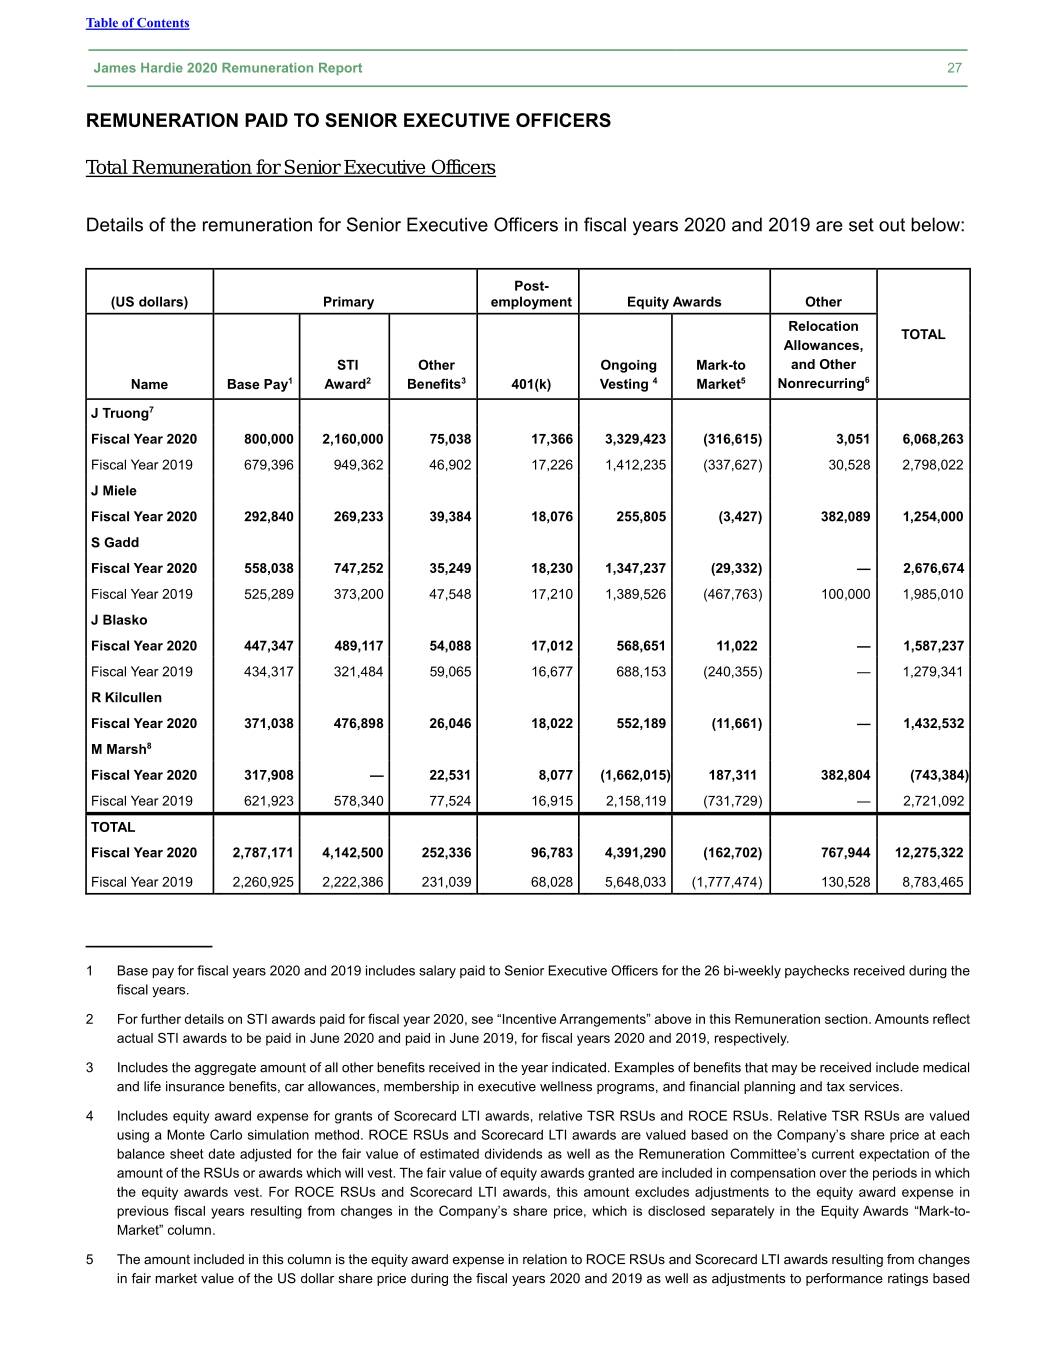
Table of Contents James Hardie 2020 Remuneration Report 27 REMUNERATION PAID TO SENIOR EXECUTIVE OFFICERS Total Remuneration for Senior Executive Officers Details of the remuneration for Senior Executive Officers in fiscal years 2020 and 2019 are set out below: Post- (US dollars) Primary employment Equity Awards Other Relocation TOTAL Allowances, STI Other Ongoing Mark-to and Other Name Base Pay1 Award2 Benefits3 401(k) Vesting 4 Market5 Nonrecurring6 J Truong7 Fiscal Year 2020 800,000 2,160,000 75,038 17,366 3,329,423 (316,615 ) 3,051 6,068,263 Fiscal Year 2019 679,396 949,362 46,902 17,226 1,412,235 (337,627 ) 30,528 2,798,022 J Miele Fiscal Year 2020 292,840 269,233 39,384 18,076 255,805 (3,427 ) 382,089 1,254,000 S Gadd Fiscal Year 2020 558,038 747,252 35,249 18,230 1,347,237 (29,332 ) — 2,676,674 Fiscal Year 2019 525,289 373,200 47,548 17,210 1,389,526 (467,763 ) 100,000 1,985,010 J Blasko Fiscal Year 2020 447,347 489,117 54,088 17,012 568,651 11,022 — 1,587,237 Fiscal Year 2019 434,317 321,484 59,065 16,677 688,153 (240,355 ) — 1,279,341 R Kilcullen Fiscal Year 2020 371,038 476,898 26,046 18,022 552,189 (11,661 ) — 1,432,532 M Marsh8 Fiscal Year 2020 317,908 — 22,531 8,077 (1,662,015) 187,311 382,804 (743,384 ) Fiscal Year 2019 621,923 578,340 77,524 16,915 2,158,119 (731,729 ) — 2,721,092 TOTAL Fiscal Year 2020 2,787,171 4,142,500 252,336 96,783 4,391,290 (162,702 ) 767,944 12,275,322 Fiscal Year 2019 2,260,925 2,222,386 231,039 68,028 5,648,033 (1,777,474 ) 130,528 8,783,465 ____________ 1 Base pay for fiscal years 2020 and 2019 includes salary paid to Senior Executive Officers for the 26 bi-weekly paychecks received during the fiscal years. 2 For further details on STI awards paid for fiscal year 2020, see “Incentive Arrangements” above in this Remuneration section. Amounts reflect actual STI awards to be paid in June 2020 and paid in June 2019, for fiscal years 2020 and 2019, respectively. 3 Includes the aggregate amount of all other benefits received in the year indicated. Examples of benefits that may be received include medical and life insurance benefits, car allowances, membership in executive wellness programs, and financial planning and tax services. 4 Includes equity award expense for grants of Scorecard LTI awards, relative TSR RSUs and ROCE RSUs. Relative TSR RSUs are valued using a Monte Carlo simulation method. ROCE RSUs and Scorecard LTI awards are valued based on the Company’s share price at each balance sheet date adjusted for the fair value of estimated dividends as well as the Remuneration Committee’s current expectation of the amount of the RSUs or awards which will vest. The fair value of equity awards granted are included in compensation over the periods in which the equity awards vest. For ROCE RSUs and Scorecard LTI awards, this amount excludes adjustments to the equity award expense in previous fiscal years resulting from changes in the Company’s share price, which is disclosed separately in the Equity Awards “Mark-to- Market” column. 5 The amount included in this column is the equity award expense in relation to ROCE RSUs and Scorecard LTI awards resulting from changes in fair market value of the US dollar share price during the fiscal years 2020 and 2019 as well as adjustments to performance ratings based
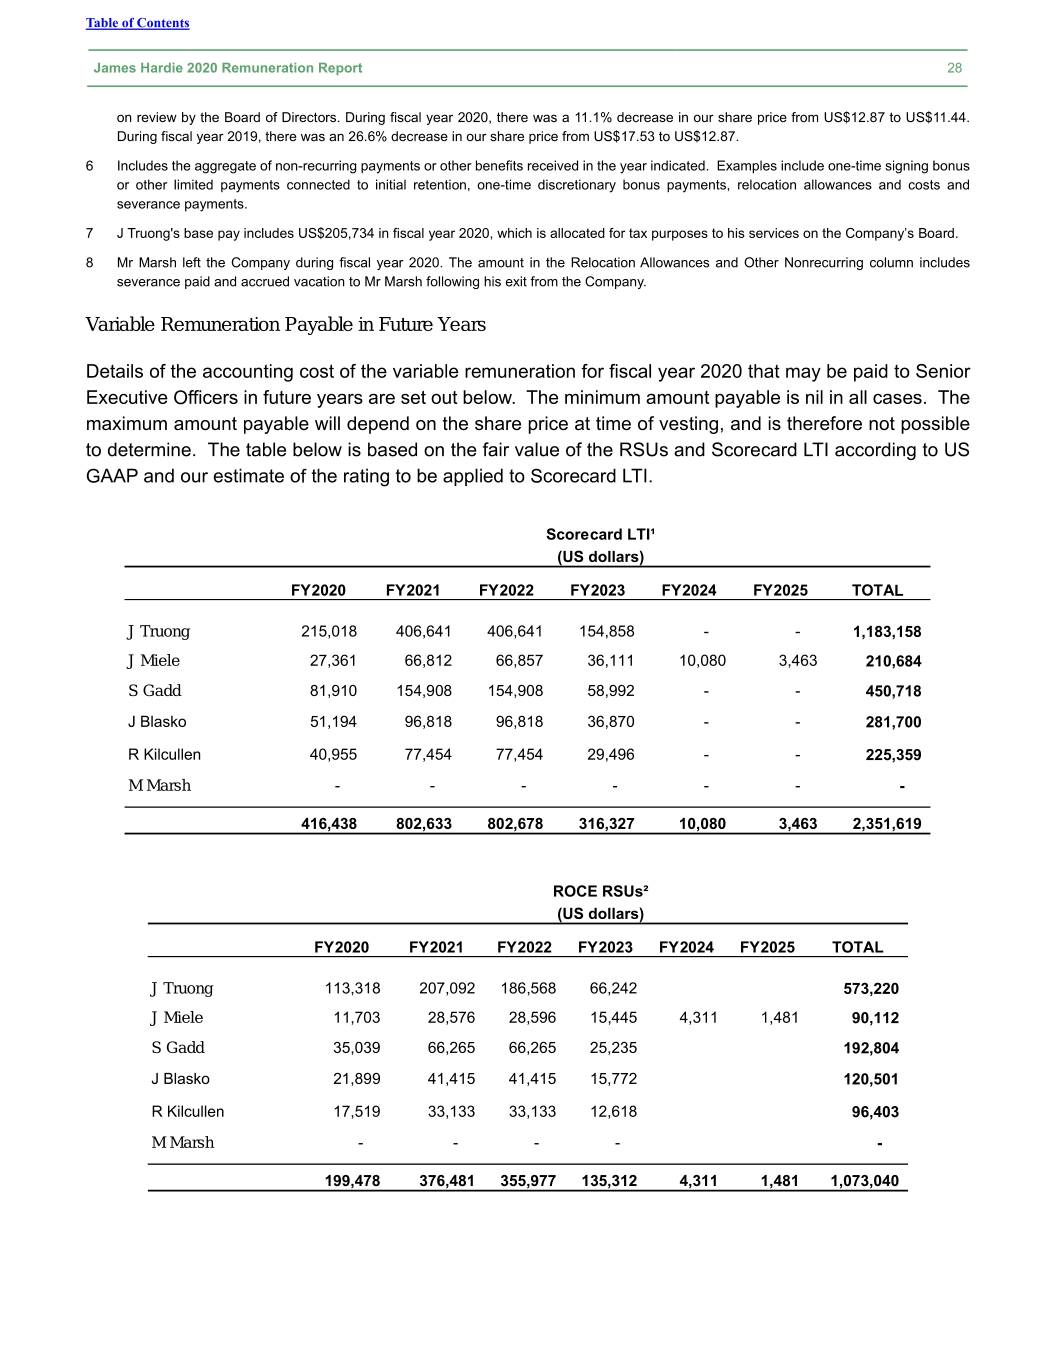
Table of Contents James Hardie 2020 Remuneration Report 28 on review by the Board of Directors. During fiscal year 2020, there was a 11.1% decrease in our share price from US$12.87 to US$11.44. During fiscal year 2019, there was an 26.6% decrease in our share price from US$17.53 to US$12.87. 6 Includes the aggregate of non-recurring payments or other benefits received in the year indicated. Examples include one-time signing bonus or other limited payments connected to initial retention, one-time discretionary bonus payments, relocation allowances and costs and severance payments. 7 J Truong's base pay includes US$205,734 in fiscal year 2020, which is allocated for tax purposes to his services on the Company’s Board. 8 Mr Marsh left the Company during fiscal year 2020. The amount in the Relocation Allowances and Other Nonrecurring column includes severance paid and accrued vacation to Mr Marsh following his exit from the Company. Variable Remuneration Payable in Future Years Details of the accounting cost of the variable remuneration for fiscal year 2020 that may be paid to Senior Executive Officers in future years are set out below. The minimum amount payable is nil in all cases. The maximum amount payable will depend on the share price at time of vesting, and is therefore not possible to determine. The table below is based on the fair value of the RSUs and Scorecard LTI according to US GAAP and our estimate of the rating to be applied to Scorecard LTI. Scorecard LTI¹ (US dollars) FY2020 FY2021 FY2022 FY2023 FY2024 FY2025 TOTAL J Truong 215,018 406,641 406,641 154,858 - - 1,183,158 J Miele 27,361 66,812 66,857 36,111 10,080 3,463 210,684 S Gadd 81,910 154,908 154,908 58,992 - - 450,718 J Blasko 51,194 96,818 96,818 36,870 - - 281,700 R Kilcullen 40,955 77,454 77,454 29,496 - - 225,359 M Marsh - - - - - - - 416,438 802,633 802,678 316,327 10,080 3,463 2,351,619 ROCE RSUs² (US dollars) FY2020 FY2021 FY2022 FY2023 FY2024 FY2025 TOTAL J Truong 113,318 207,092 186,568 66,242 573,220 J Miele 11,703 28,576 28,596 15,445 4,311 1,481 90,112 S Gadd 35,039 66,265 66,265 25,235 192,804 J Blasko 21,899 41,415 41,415 15,772 120,501 R Kilcullen 17,519 33,133 33,133 12,618 96,403 M Marsh - - - - - 199,478 376,481 355,977 135,312 4,311 1,481 1,073,040
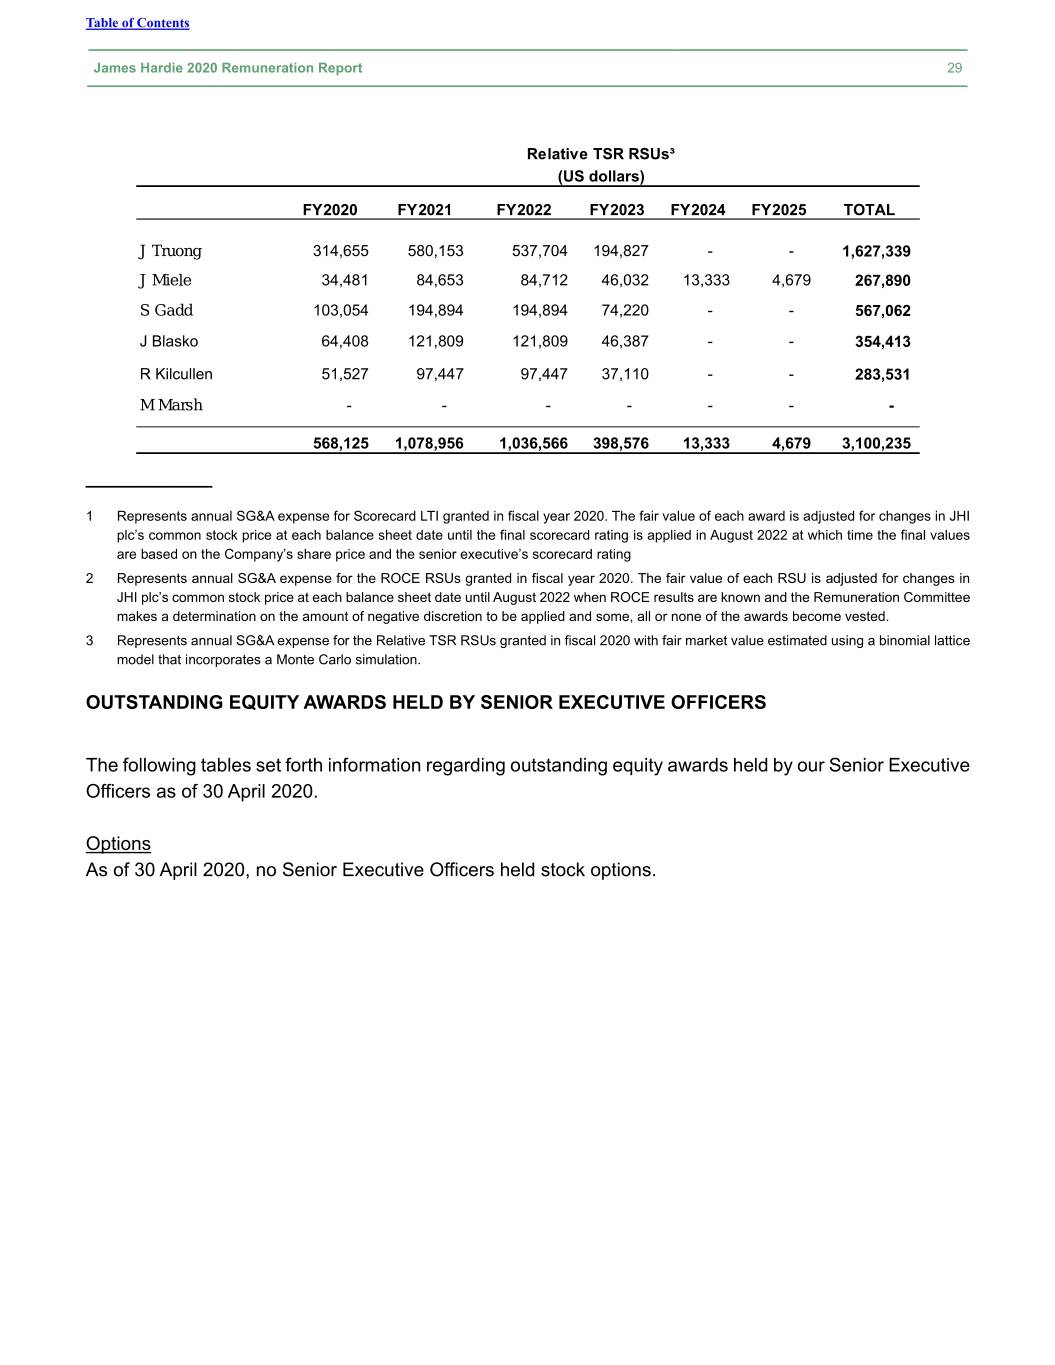
Table of Contents James Hardie 2020 Remuneration Report 29 Relative TSR RSUs³ (US dollars) FY2020 FY2021 FY2022 FY2023 FY2024 FY2025 TOTAL J Truong 314,655 580,153 537,704 194,827 - - 1,627,339 J Miele 34,481 84,653 84,712 46,032 13,333 4,679 267,890 S Gadd 103,054 194,894 194,894 74,220 - - 567,062 J Blasko 64,408 121,809 121,809 46,387 - - 354,413 R Kilcullen 51,527 97,447 97,447 37,110 - - 283,531 M Marsh - - - - - - - 568,125 1,078,956 1,036,566 398,576 13,333 4,679 3,100,235 ____________ 1 Represents annual SG&A expense for Scorecard LTI granted in fiscal year 2020. The fair value of each award is adjusted for changes in JHI plc’s common stock price at each balance sheet date until the final scorecard rating is applied in August 2022 at which time the final values are based on the Company’s share price and the senior executive’s scorecard rating 2 Represents annual SG&A expense for the ROCE RSUs granted in fiscal year 2020. The fair value of each RSU is adjusted for changes in JHI plc’s common stock price at each balance sheet date until August 2022 when ROCE results are known and the Remuneration Committee makes a determination on the amount of negative discretion to be applied and some, all or none of the awards become vested. 3 Represents annual SG&A expense for the Relative TSR RSUs granted in fiscal 2020 with fair market value estimated using a binomial lattice model that incorporates a Monte Carlo simulation. OUTSTANDING EQUITY AWARDS HELD BY SENIOR EXECUTIVE OFFICERS The following tables set forth information regarding outstanding equity awards held by our Senior Executive Officers as of 30 April 2020. Options As of 30 April 2020, no Senior Executive Officers held stock options.
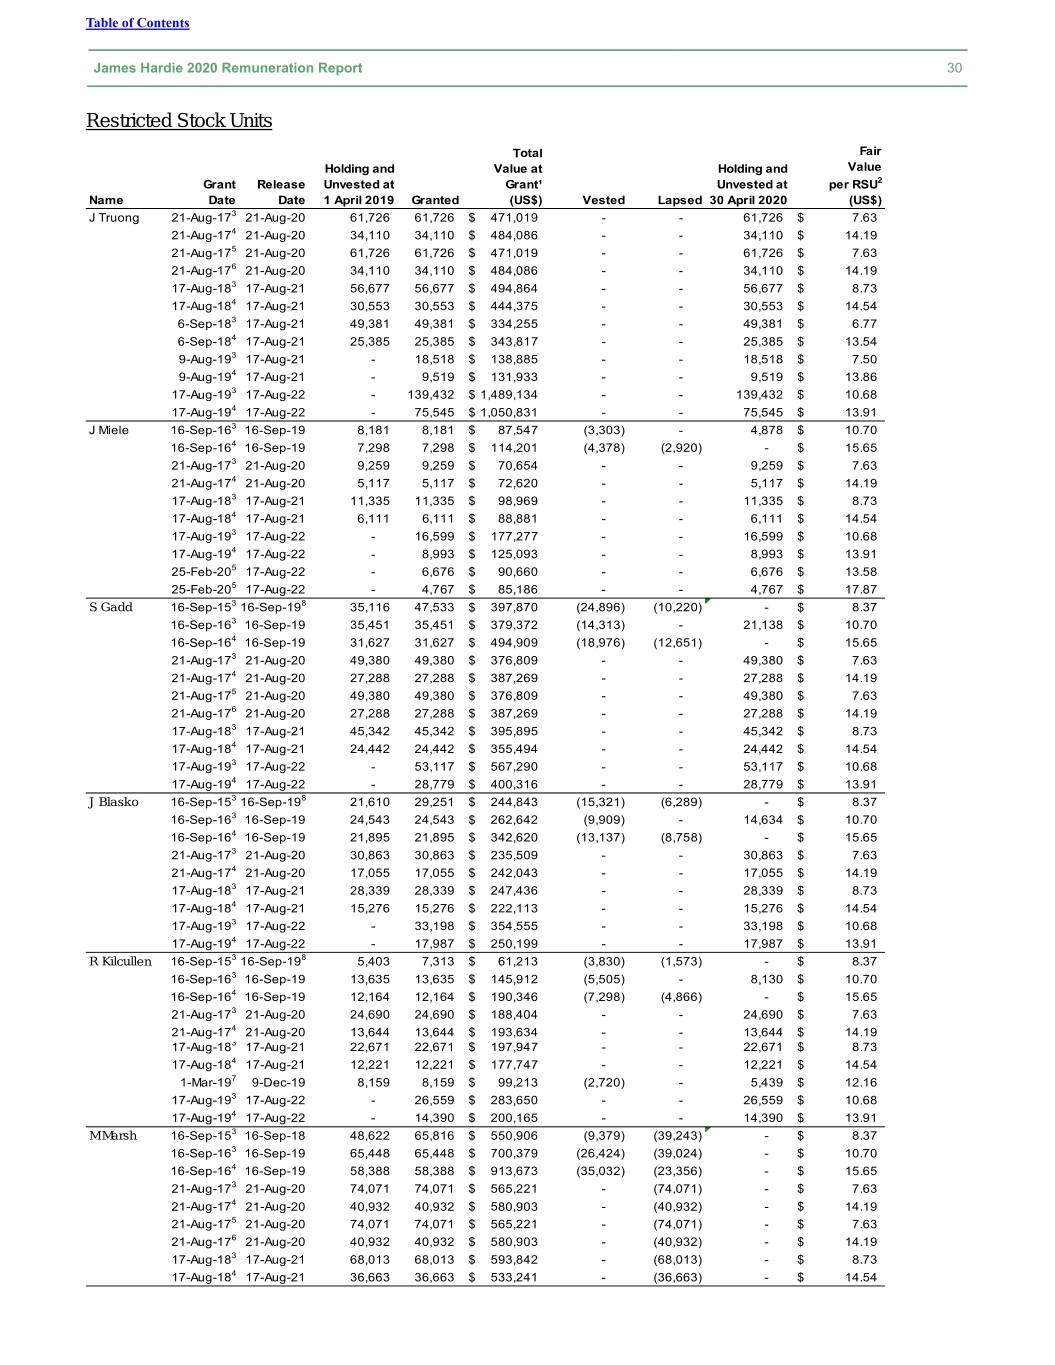
Table of Contents James Hardie 2020 Remuneration Report 30 Restricted Stock Units Total Fa ir Holding and Value at Holding and Value Gr a nt Release Unvested at Gr a nt¹ Unvested at per RSU2 Name Date Date 1 April 2019 Granted (US$) Vested Lapsed 30 April 2020 (US$) J Truong 21-Aug-173 21-Aug-20 61,726 61,726 $ 471,019 - - 61,726 $ 7.63 21-Aug-174 21-Aug-20 34,110 34,110 $ 484,086 - - 34,110 $ 14.19 21-Aug-175 21-Aug-20 61,726 61,726 $ 471,019 - - 61,726 $ 7.63 21-Aug-176 21-Aug-20 34,110 34,110 $ 484,086 - - 34,110 $ 14.19 17-Aug-183 17-Aug-21 56,677 56,677 $ 494,864 - - 56,677 $ 8.73 17-Aug-184 17-Aug-21 30,553 30,553 $ 444,375 - - 30,553 $ 14.54 6-Sep-183 17-Aug-21 49,381 49,381 $ 334,255 - - 49,381 $ 6.77 6-Sep-184 17-Aug-21 25,385 25,385 $ 343,817 - - 25,385 $ 13.54 9-Aug-193 17-Aug-21 - 18,518 $ 138,885 - - 18,518 $ 7.50 9-Aug-194 17-Aug-21 - 9,519 $ 131,933 - - 9,519 $ 13.86 17-Aug-193 17-Aug-22 - 139,432 $ 1,489,134 - - 139,432 $ 10.68 17-Aug-194 17-Aug-22 - 75,545 $ 1,050,831 - - 75,545 $ 13.91 J Miele 16-Sep-163 16-Sep-19 8,181 8,181 $ 87,547 (3,303) - 4,878 $ 10.70 16-Sep-164 16-Sep-19 7,298 7,298 $ 114,201 (4,378) (2,920) - $ 15.65 21-Aug-173 21-Aug-20 9,259 9,259 $ 70,654 - - 9,259 $ 7.63 21-Aug-174 21-Aug-20 5,117 5,117 $ 72,620 - - 5,117 $ 14.19 17-Aug-183 17-Aug-21 11,335 11,335 $ 98,969 - - 11,335 $ 8.73 17-Aug-184 17-Aug-21 6,111 6,111 $ 88,881 - - 6,111 $ 14.54 17-Aug-193 17-Aug-22 - 16,599 $ 177,277 - - 16,599 $ 10.68 17-Aug-194 17-Aug-22 - 8,993 $ 125,093 - - 8,993 $ 13.91 25-Feb-205 17-Aug-22 - 6,676 $ 90,660 - - 6,676 $ 13.58 25-Feb-205 17-Aug-22 - 4,767 $ 85,186 - - 4,767 $ 17.87 S Gadd 16-Sep-153 16-Sep-198 35,116 47,533 $ 397,870 (24,896) (10,220) - $ 8.37 16-Sep-163 16-Sep-19 35,451 35,451 $ 379,372 (14,313) - 21,138 $ 10.70 16-Sep-164 16-Sep-19 31,627 31,627 $ 494,909 (18,976) (12,651) - $ 15.65 21-Aug-173 21-Aug-20 49,380 49,380 $ 376,809 - - 49,380 $ 7.63 21-Aug-174 21-Aug-20 27,288 27,288 $ 387,269 - - 27,288 $ 14.19 21-Aug-175 21-Aug-20 49,380 49,380 $ 376,809 - - 49,380 $ 7.63 21-Aug-176 21-Aug-20 27,288 27,288 $ 387,269 - - 27,288 $ 14.19 17-Aug-183 17-Aug-21 45,342 45,342 $ 395,895 - - 45,342 $ 8.73 17-Aug-184 17-Aug-21 24,442 24,442 $ 355,494 - - 24,442 $ 14.54 17-Aug-193 17-Aug-22 - 53,117 $ 567,290 - - 53,117 $ 10.68 17-Aug-194 17-Aug-22 - 28,779 $ 400,316 - - 28,779 $ 13.91 J Blasko 16-Sep-153 16-Sep-198 21,610 29,251 $ 244,843 (15,321) (6,289) - $ 8.37 16-Sep-163 16-Sep-19 24,543 24,543 $ 262,642 (9,909) - 14,634 $ 10.70 16-Sep-164 16-Sep-19 21,895 21,895 $ 342,620 (13,137) (8,758) - $ 15.65 21-Aug-173 21-Aug-20 30,863 30,863 $ 235,509 - - 30,863 $ 7.63 21-Aug-174 21-Aug-20 17,055 17,055 $ 242,043 - - 17,055 $ 14.19 17-Aug-183 17-Aug-21 28,339 28,339 $ 247,436 - - 28,339 $ 8.73 17-Aug-184 17-Aug-21 15,276 15,276 $ 222,113 - - 15,276 $ 14.54 17-Aug-193 17-Aug-22 - 33,198 $ 354,555 - - 33,198 $ 10.68 17-Aug-194 17-Aug-22 - 17,987 $ 250,199 - - 17,987 $ 13.91 R Kilcullen 16-Sep-153 16-Sep-198 5,403 7,313 $ 61,213 (3,830) (1,573) - $ 8.37 16-Sep-163 16-Sep-19 13,635 13,635 $ 145,912 (5,505) - 8,130 $ 10.70 16-Sep-164 16-Sep-19 12,164 12,164 $ 190,346 (7,298) (4,866) - $ 15.65 21-Aug-173 21-Aug-20 24,690 24,690 $ 188,404 - - 24,690 $ 7.63 21-Aug-174 21-Aug-20 13,644 13,644 $ 193,634 - - 13,644 $ 14.19 17-Aug-183 17-Aug-21 22,671 22,671 $ 197,947 - - 22,671 $ 8.73 17-Aug-184 17-Aug-21 12,221 12,221 $ 177,747 - - 12,221 $ 14.54 1-Mar-197 9-Dec-19 8,159 8,159 $ 99,213 (2,720) - 5,439 $ 12.16 17-Aug-193 17-Aug-22 - 26,559 $ 283,650 - - 26,559 $ 10.68 17-Aug-194 17-Aug-22 - 14,390 $ 200,165 - - 14,390 $ 13.91 M Marsh 16-Sep-153 16-Sep-18 48,622 65,816 $ 550,906 (9,379) (39,243) - $ 8.37 16-Sep-163 16-Sep-19 65,448 65,448 $ 700,379 (26,424) (39,024) - $ 10.70 16-Sep-164 16-Sep-19 58,388 58,388 $ 913,673 (35,032) (23,356) - $ 15.65 21-Aug-173 21-Aug-20 74,071 74,071 $ 565,221 - (74,071) - $ 7.63 21-Aug-174 21-Aug-20 40,932 40,932 $ 580,903 - (40,932) - $ 14.19 21-Aug-175 21-Aug-20 74,071 74,071 $ 565,221 - (74,071) - $ 7.63 21-Aug-176 21-Aug-20 40,932 40,932 $ 580,903 - (40,932) - $ 14.19 17-Aug-183 17-Aug-21 68,013 68,013 $ 593,842 - (68,013) - $ 8.73 17-Aug-184 17-Aug-21 36,663 36,663 $ 533,241 - (36,663) - $ 14.54
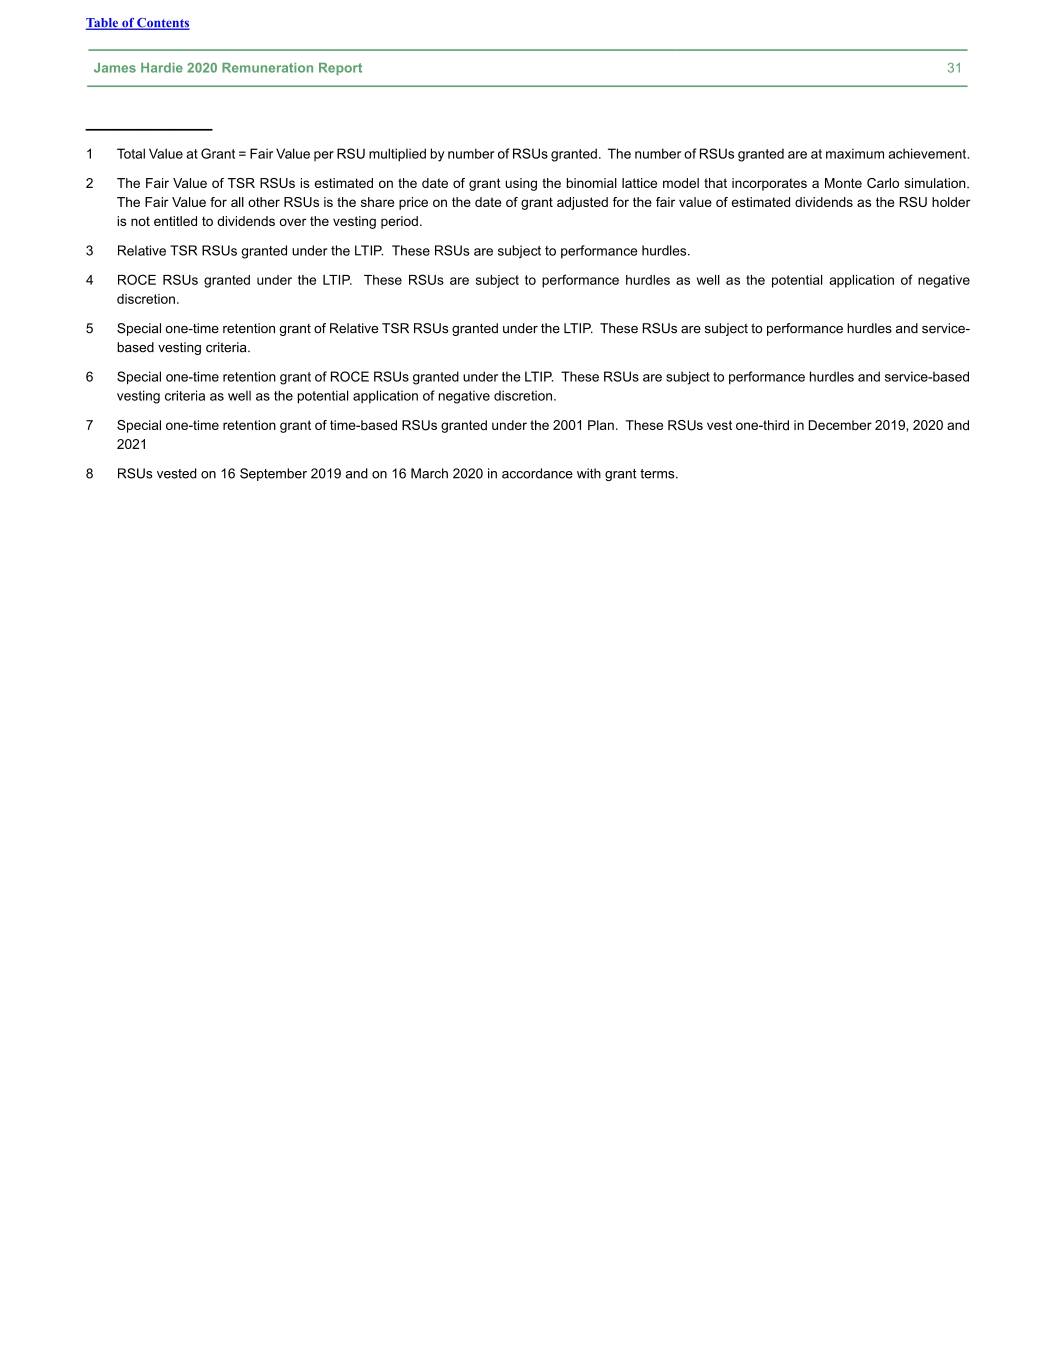
Table of Contents James Hardie 2020 Remuneration Report 31 ____________ 1 Total Value at Grant = Fair Value per RSU multiplied by number of RSUs granted. The number of RSUs granted are at maximum achievement. 2 The Fair Value of TSR RSUs is estimated on the date of grant using the binomial lattice model that incorporates a Monte Carlo simulation. The Fair Value for all other RSUs is the share price on the date of grant adjusted for the fair value of estimated dividends as the RSU holder is not entitled to dividends over the vesting period. 3 Relative TSR RSUs granted under the LTIP. These RSUs are subject to performance hurdles. 4 ROCE RSUs granted under the LTIP. These RSUs are subject to performance hurdles as well as the potential application of negative discretion. 5 Special one-time retention grant of Relative TSR RSUs granted under the LTIP. These RSUs are subject to performance hurdles and service- based vesting criteria. 6 Special one-time retention grant of ROCE RSUs granted under the LTIP. These RSUs are subject to performance hurdles and service-based vesting criteria as well as the potential application of negative discretion. 7 Special one-time retention grant of time-based RSUs granted under the 2001 Plan. These RSUs vest one-third in December 2019, 2020 and 2021 8 RSUs vested on 16 September 2019 and on 16 March 2020 in accordance with grant terms.
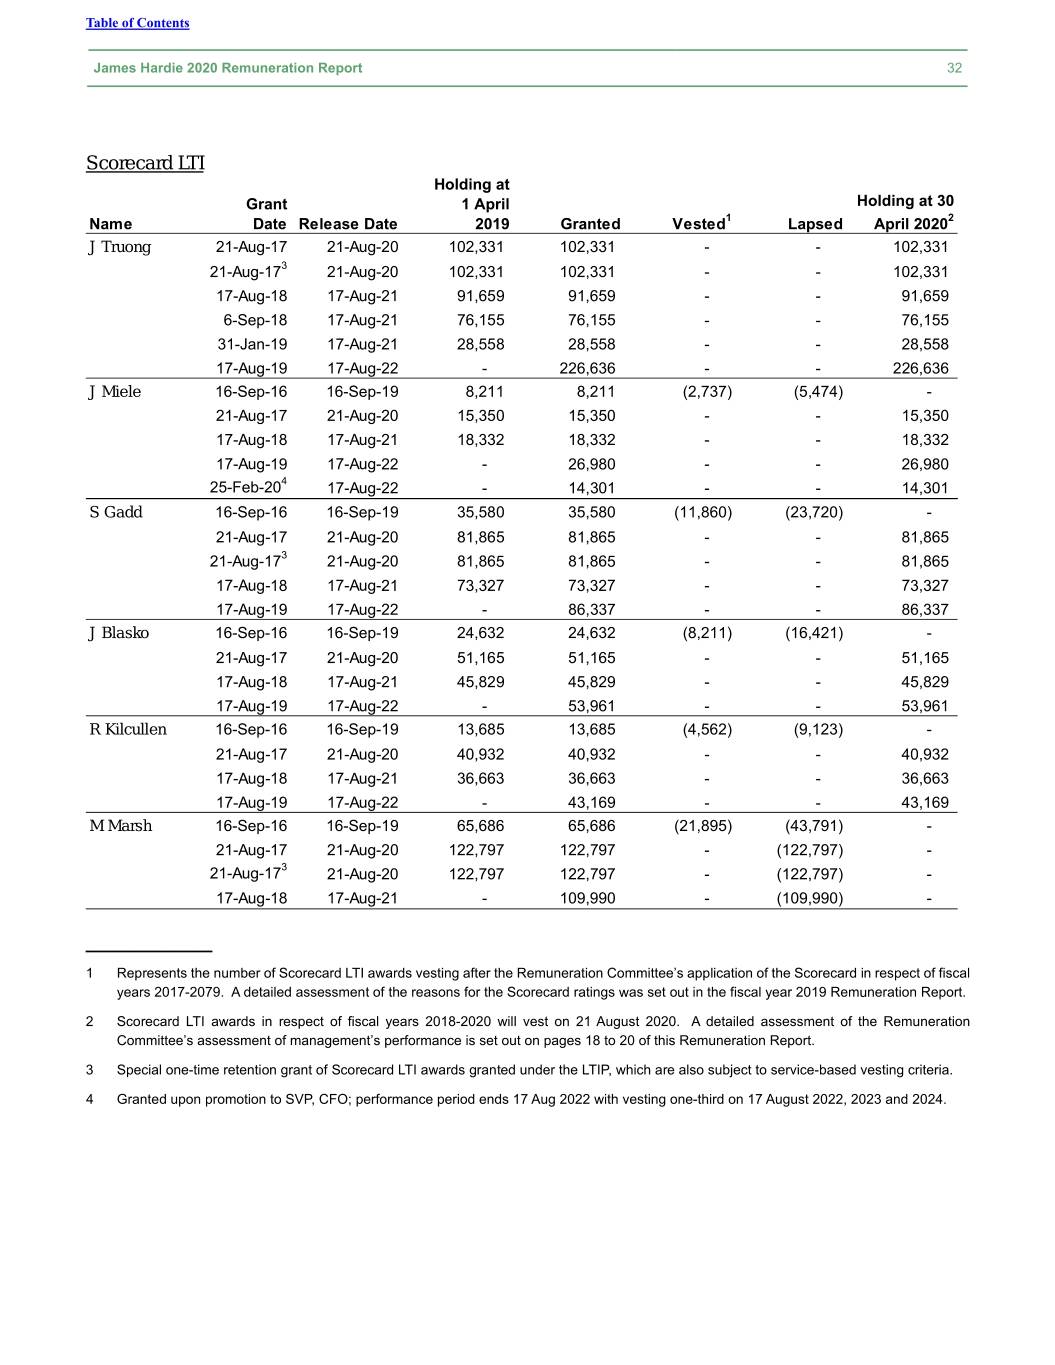
Table of Contents James Hardie 2020 Remuneration Report 32 Scorecard LTI Holding at Grant 1 April Holding at 30 Name Date Release Date 2019 Granted Vested1 Lapsed April 20202 J Truong 21-Aug-17 21-Aug-20 102,331 102,331 - - 102,331 21-Aug-173 21-Aug-20 102,331 102,331 - - 102,331 17-Aug-18 17-Aug-21 91,659 91,659 - - 91,659 6-Sep-18 17-Aug-21 76,155 76,155 - - 76,155 31-Jan-19 17-Aug-21 28,558 28,558 - - 28,558 17-Aug-19 17-Aug-22 - 226,636 - - 226,636 J Miele 16-Sep-16 16-Sep-19 8,211 8,211 (2,737) (5,474) - 21-Aug-17 21-Aug-20 15,350 15,350 - - 15,350 17-Aug-18 17-Aug-21 18,332 18,332 - - 18,332 17-Aug-19 17-Aug-22 - 26,980 - - 26,980 25-Feb-204 17-Aug-22 - 14,301 - - 14,301 S Gadd 16-Sep-16 16-Sep-19 35,580 35,580 (11,860) (23,720) - 21-Aug-17 21-Aug-20 81,865 81,865 - - 81,865 21-Aug-173 21-Aug-20 81,865 81,865 - - 81,865 17-Aug-18 17-Aug-21 73,327 73,327 - - 73,327 17-Aug-19 17-Aug-22 - 86,337 - - 86,337 J Blasko 16-Sep-16 16-Sep-19 24,632 24,632 (8,211) (16,421) - 21-Aug-17 21-Aug-20 51,165 51,165 - - 51,165 17-Aug-18 17-Aug-21 45,829 45,829 - - 45,829 17-Aug-19 17-Aug-22 - 53,961 - - 53,961 R Kilcullen 16-Sep-16 16-Sep-19 13,685 13,685 (4,562) (9,123) - 21-Aug-17 21-Aug-20 40,932 40,932 - - 40,932 17-Aug-18 17-Aug-21 36,663 36,663 - - 36,663 17-Aug-19 17-Aug-22 - 43,169 - - 43,169 M Marsh 16-Sep-16 16-Sep-19 65,686 65,686 (21,895) (43,791) - 21-Aug-17 21-Aug-20 122,797 122,797 - (122,797) - 21-Aug-173 21-Aug-20 122,797 122,797 - (122,797) - 17-Aug-18 17-Aug-21 - 109,990 - (109,990) - ____________ 1 Represents the number of Scorecard LTI awards vesting after the Remuneration Committee’s application of the Scorecard in respect of fiscal years 2017-2079. A detailed assessment of the reasons for the Scorecard ratings was set out in the fiscal year 2019 Remuneration Report. 2 Scorecard LTI awards in respect of fiscal years 2018-2020 will vest on 21 August 2020. A detailed assessment of the Remuneration Committee’s assessment of management’s performance is set out on pages 18 to 20 of this Remuneration Report. 3 Special one-time retention grant of Scorecard LTI awards granted under the LTIP, which are also subject to service-based vesting criteria. 4 Granted upon promotion to SVP, CFO; performance period ends 17 Aug 2022 with vesting one-third on 17 August 2022, 2023 and 2024.
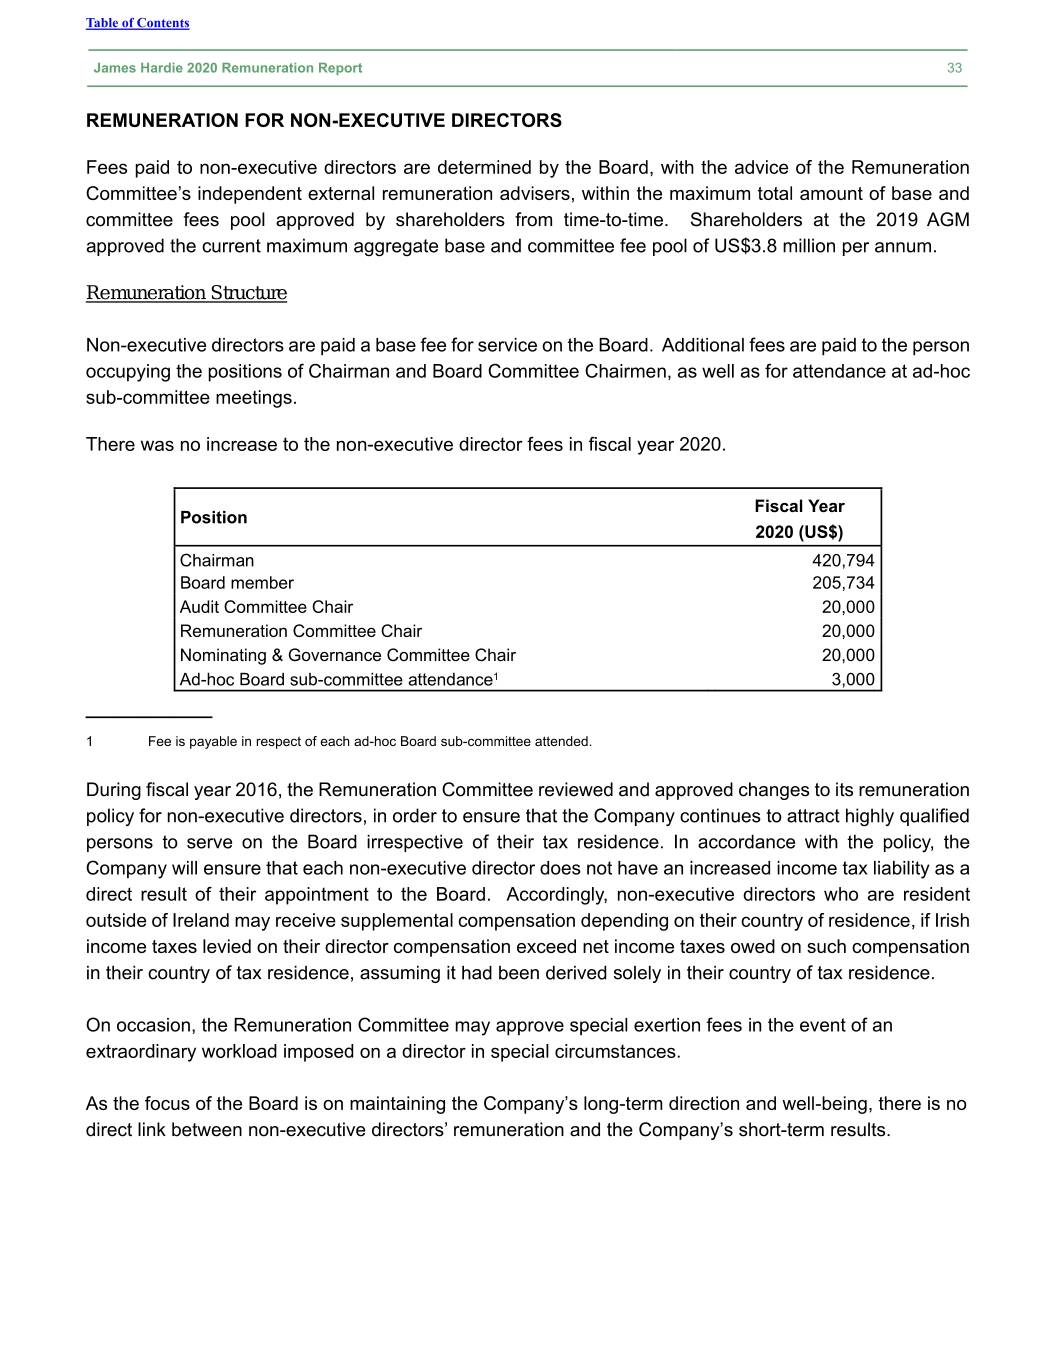
Table of Contents James Hardie 2020 Remuneration Report 33 REMUNERATION FOR NON-EXECUTIVE DIRECTORS Fees paid to non-executive directors are determined by the Board, with the advice of the Remuneration Committee’s independent external remuneration advisers, within the maximum total amount of base and committee fees pool approved by shareholders from time-to-time. Shareholders at the 2019 AGM approved the current maximum aggregate base and committee fee pool of US$3.8 million per annum. Remuneration Structure Non-executive directors are paid a base fee for service on the Board. Additional fees are paid to the person occupying the positions of Chairman and Board Committee Chairmen, as well as for attendance at ad-hoc sub-committee meetings. There was no increase to the non-executive director fees in fiscal year 2020. Fiscal Year Position 2020 (US$) Chairman 420,794 Board member 205,734 Audit Committee Chair 20,000 Remuneration Committee Chair 20,000 Nominating & Governance Committee Chair 20,000 Ad-hoc Board sub-committee attendance1 3,000 ____________ 1 Fee is payable in respect of each ad-hoc Board sub-committee attended. During fiscal year 2016, the Remuneration Committee reviewed and approved changes to its remuneration policy for non-executive directors, in order to ensure that the Company continues to attract highly qualified persons to serve on the Board irrespective of their tax residence. In accordance with the policy, the Company will ensure that each non-executive director does not have an increased income tax liability as a direct result of their appointment to the Board. Accordingly, non-executive directors who are resident outside of Ireland may receive supplemental compensation depending on their country of residence, if Irish income taxes levied on their director compensation exceed net income taxes owed on such compensation in their country of tax residence, assuming it had been derived solely in their country of tax residence. On occasion, the Remuneration Committee may approve special exertion fees in the event of an extraordinary workload imposed on a director in special circumstances. As the focus of the Board is on maintaining the Company’s long-term direction and well-being, there is no direct link between non-executive directors’ remuneration and the Company’s short-term results.
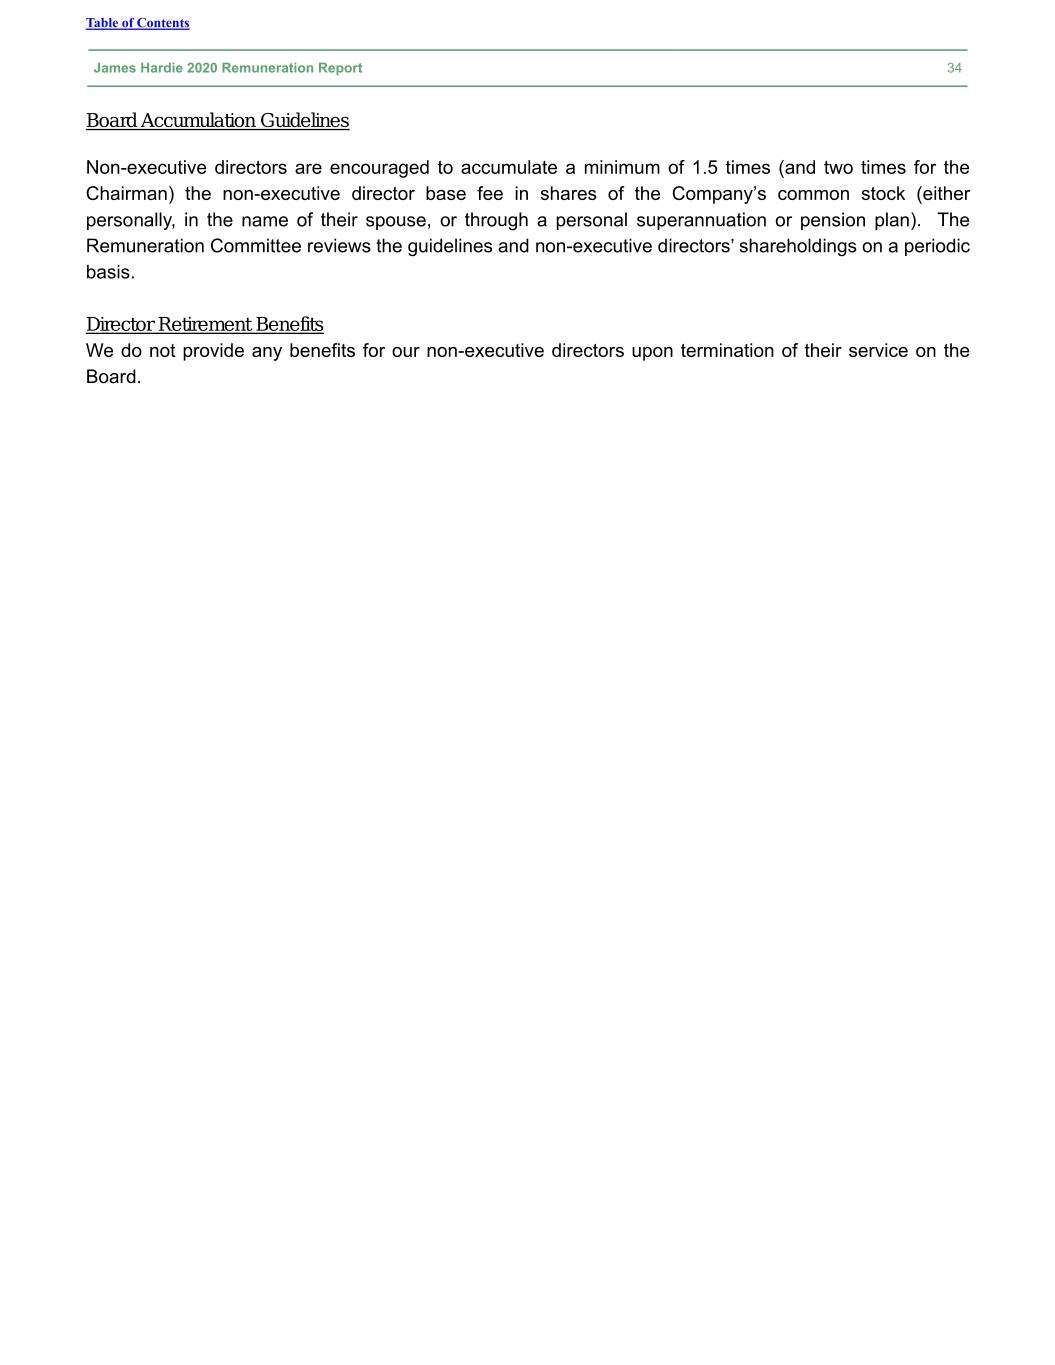
Table of Contents James Hardie 2020 Remuneration Report 34 Board Accumulation Guidelines Non-executive directors are encouraged to accumulate a minimum of 1.5 times (and two times for the Chairman) the non-executive director base fee in shares of the Company’s common stock (either personally, in the name of their spouse, or through a personal superannuation or pension plan). The Remuneration Committee reviews the guidelines and non-executive directors’ shareholdings on a periodic basis. Director Retirement Benefits We do not provide any benefits for our non-executive directors upon termination of their service on the Board.
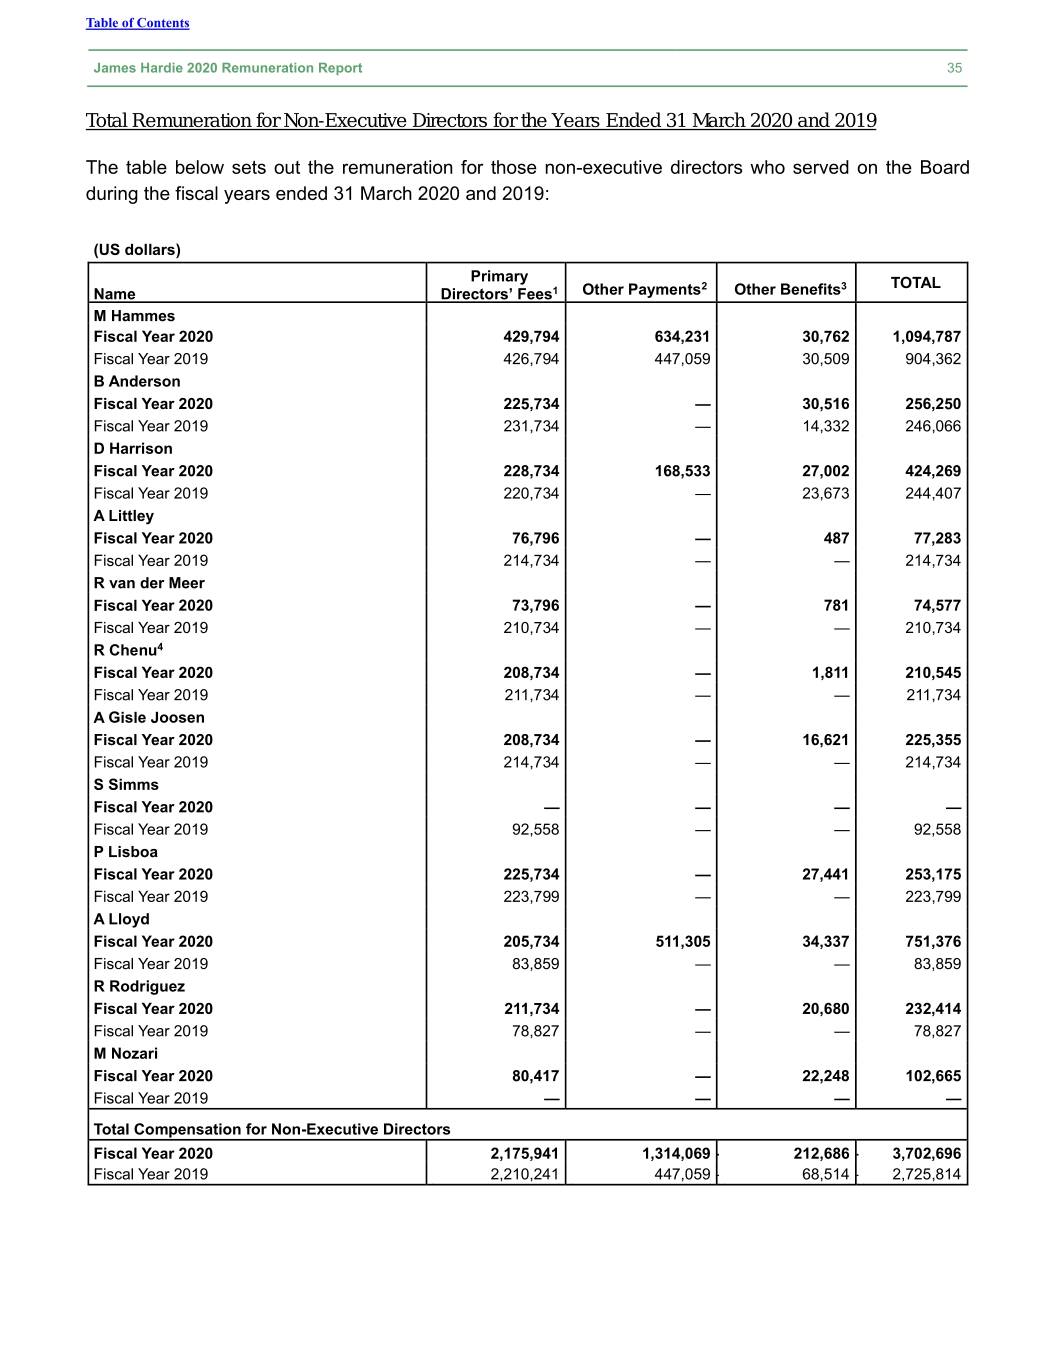
Table of Contents James Hardie 2020 Remuneration Report 35 Total Remuneration for Non-Executive Directors for the Years Ended 31 March 2020 and 2019 The table below sets out the remuneration for those non-executive directors who served on the Board during the fiscal years ended 31 March 2020 and 2019: (US dollars) Primary 2 3 TOTAL Name Directors’ Fees1 Other Payments Other Benefits M Hammes Fiscal Year 2020 429,794 634,231 30,762 1,094,787 Fiscal Year 2019 426,794 447,059 30,509 904,362 B Anderson Fiscal Year 2020 225,734 — 30,516 256,250 Fiscal Year 2019 231,734 — 14,332 246,066 D Harrison Fiscal Year 2020 228,734 168,533 27,002 424,269 Fiscal Year 2019 220,734 — 23,673 244,407 A Littley Fiscal Year 2020 76,796 — 487 77,283 Fiscal Year 2019 214,734 — — 214,734 R van der Meer Fiscal Year 2020 73,796 — 781 74,577 Fiscal Year 2019 210,734 — — 210,734 R Chenu4 Fiscal Year 2020 208,734 — 1,811 210,545 Fiscal Year 2019 211,734 — — 211,734 A Gisle Joosen Fiscal Year 2020 208,734 — 16,621 225,355 Fiscal Year 2019 214,734 — — 214,734 S Simms Fiscal Year 2020 — — — — Fiscal Year 2019 92,558 — — 92,558 P Lisboa Fiscal Year 2020 225,734 — 27,441 253,175 Fiscal Year 2019 223,799 — — 223,799 A Lloyd Fiscal Year 2020 205,734 511,305 34,337 751,376 Fiscal Year 2019 83,859 — — 83,859 R Rodriguez Fiscal Year 2020 211,734 — 20,680 232,414 Fiscal Year 2019 78,827 — — 78,827 M Nozari Fiscal Year 2020 80,417 — 22,248 102,665 Fiscal Year 2019 — — — — Total Compensation for Non-Executive Directors Fiscal Year 2020 2,175,941 1,314,069 — 212,686 — 3,702,696 Fiscal Year 2019 2,210,241 447,059 — 68,514 — 2,725,814
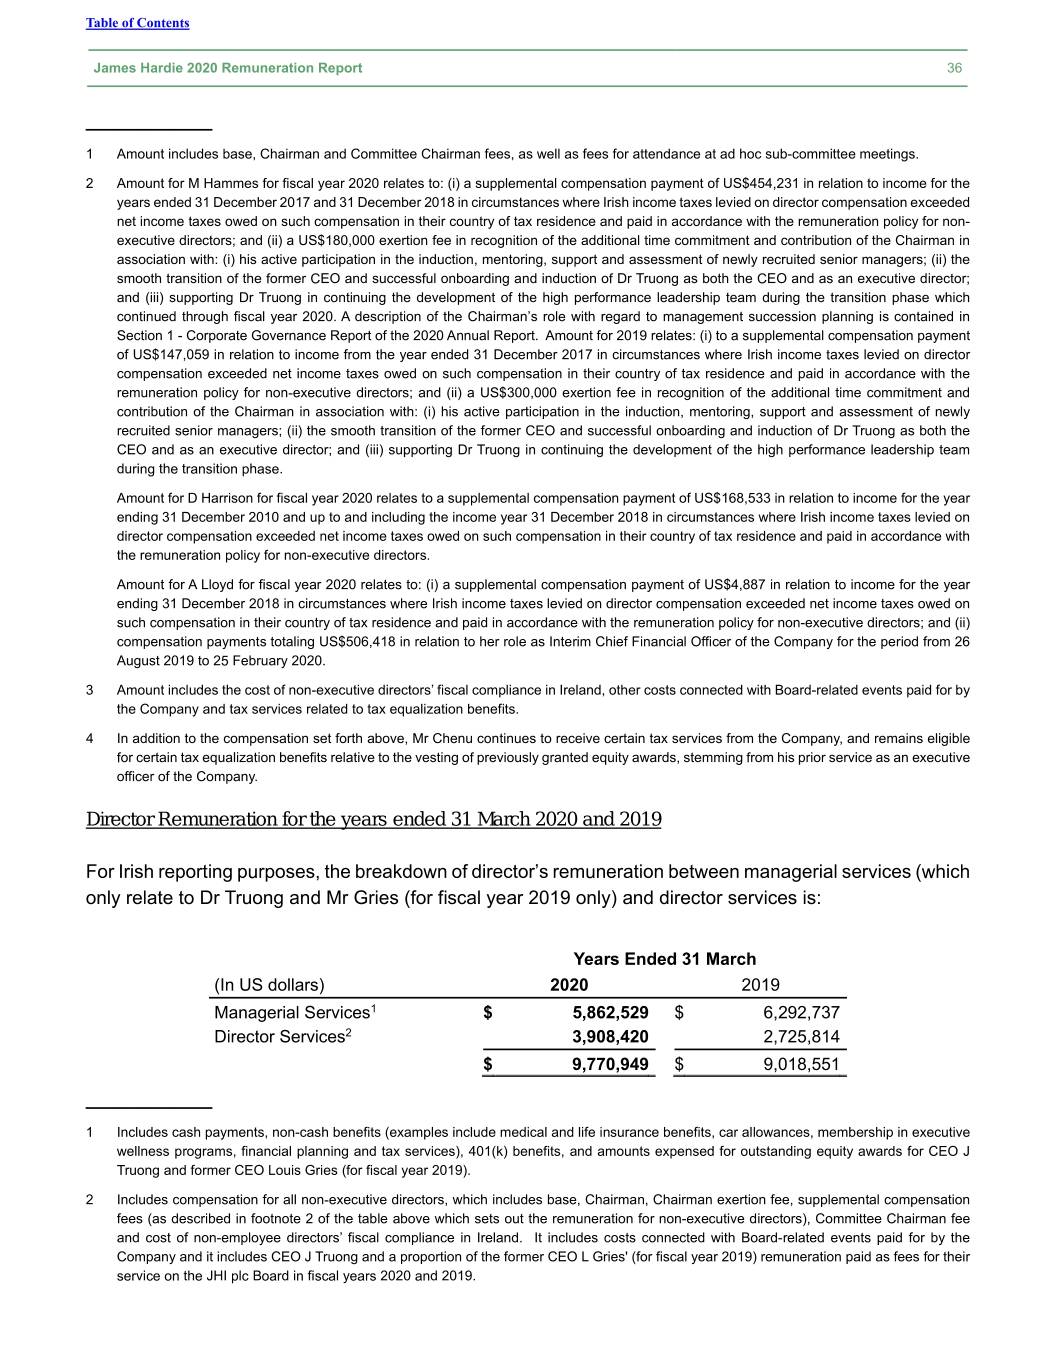
Table of Contents James Hardie 2020 Remuneration Report 36 ____________ 1 Amount includes base, Chairman and Committee Chairman fees, as well as fees for attendance at ad hoc sub-committee meetings. 2 Amount for M Hammes for fiscal year 2020 relates to: (i) a supplemental compensation payment of US$454,231 in relation to income for the years ended 31 December 2017 and 31 December 2018 in circumstances where Irish income taxes levied on director compensation exceeded net income taxes owed on such compensation in their country of tax residence and paid in accordance with the remuneration policy for non- executive directors; and (ii) a US$180,000 exertion fee in recognition of the additional time commitment and contribution of the Chairman in association with: (i) his active participation in the induction, mentoring, support and assessment of newly recruited senior managers; (ii) the smooth transition of the former CEO and successful onboarding and induction of Dr Truong as both the CEO and as an executive director; and (iii) supporting Dr Truong in continuing the development of the high performance leadership team during the transition phase which continued through fiscal year 2020. A description of the Chairman’s role with regard to management succession planning is contained in Section 1 - Corporate Governance Report of the 2020 Annual Report. Amount for 2019 relates: (i) to a supplemental compensation payment of US$147,059 in relation to income from the year ended 31 December 2017 in circumstances where Irish income taxes levied on director compensation exceeded net income taxes owed on such compensation in their country of tax residence and paid in accordance with the remuneration policy for non-executive directors; and (ii) a US$300,000 exertion fee in recognition of the additional time commitment and contribution of the Chairman in association with: (i) his active participation in the induction, mentoring, support and assessment of newly recruited senior managers; (ii) the smooth transition of the former CEO and successful onboarding and induction of Dr Truong as both the CEO and as an executive director; and (iii) supporting Dr Truong in continuing the development of the high performance leadership team during the transition phase. Amount for D Harrison for fiscal year 2020 relates to a supplemental compensation payment of US$168,533 in relation to income for the year ending 31 December 2010 and up to and including the income year 31 December 2018 in circumstances where Irish income taxes levied on director compensation exceeded net income taxes owed on such compensation in their country of tax residence and paid in accordance with the remuneration policy for non-executive directors. Amount for A Lloyd for fiscal year 2020 relates to: (i) a supplemental compensation payment of US$4,887 in relation to income for the year ending 31 December 2018 in circumstances where Irish income taxes levied on director compensation exceeded net income taxes owed on such compensation in their country of tax residence and paid in accordance with the remuneration policy for non-executive directors; and (ii) compensation payments totaling US$506,418 in relation to her role as Interim Chief Financial Officer of the Company for the period from 26 August 2019 to 25 February 2020. 3 Amount includes the cost of non-executive directors’ fiscal compliance in Ireland, other costs connected with Board-related events paid for by the Company and tax services related to tax equalization benefits. 4 In addition to the compensation set forth above, Mr Chenu continues to receive certain tax services from the Company, and remains eligible for certain tax equalization benefits relative to the vesting of previously granted equity awards, stemming from his prior service as an executive officer of the Company. Director Remuneration for the years ended 31 March 2020 and 2019 For Irish reporting purposes, the breakdown of director’s remuneration between managerial services (which only relate to Dr Truong and Mr Gries (for fiscal year 2019 only) and director services is: Years Ended 31 March (In US dollars) 2020 2019 Managerial Services1 $ 5,862,529 $ 6,292,737 Director Services2 3,908,420 2,725,814 $ 9,770,949 $ 9,018,551 ____________ 1 Includes cash payments, non-cash benefits (examples include medical and life insurance benefits, car allowances, membership in executive wellness programs, financial planning and tax services), 401(k) benefits, and amounts expensed for outstanding equity awards for CEO J Truong and former CEO Louis Gries (for fiscal year 2019). 2 Includes compensation for all non-executive directors, which includes base, Chairman, Chairman exertion fee, supplemental compensation fees (as described in footnote 2 of the table above which sets out the remuneration for non-executive directors), Committee Chairman fee and cost of non-employee directors’ fiscal compliance in Ireland. It includes costs connected with Board-related events paid for by the Company and it includes CEO J Truong and a proportion of the former CEO L Gries' (for fiscal year 2019) remuneration paid as fees for their service on the JHI plc Board in fiscal years 2020 and 2019.
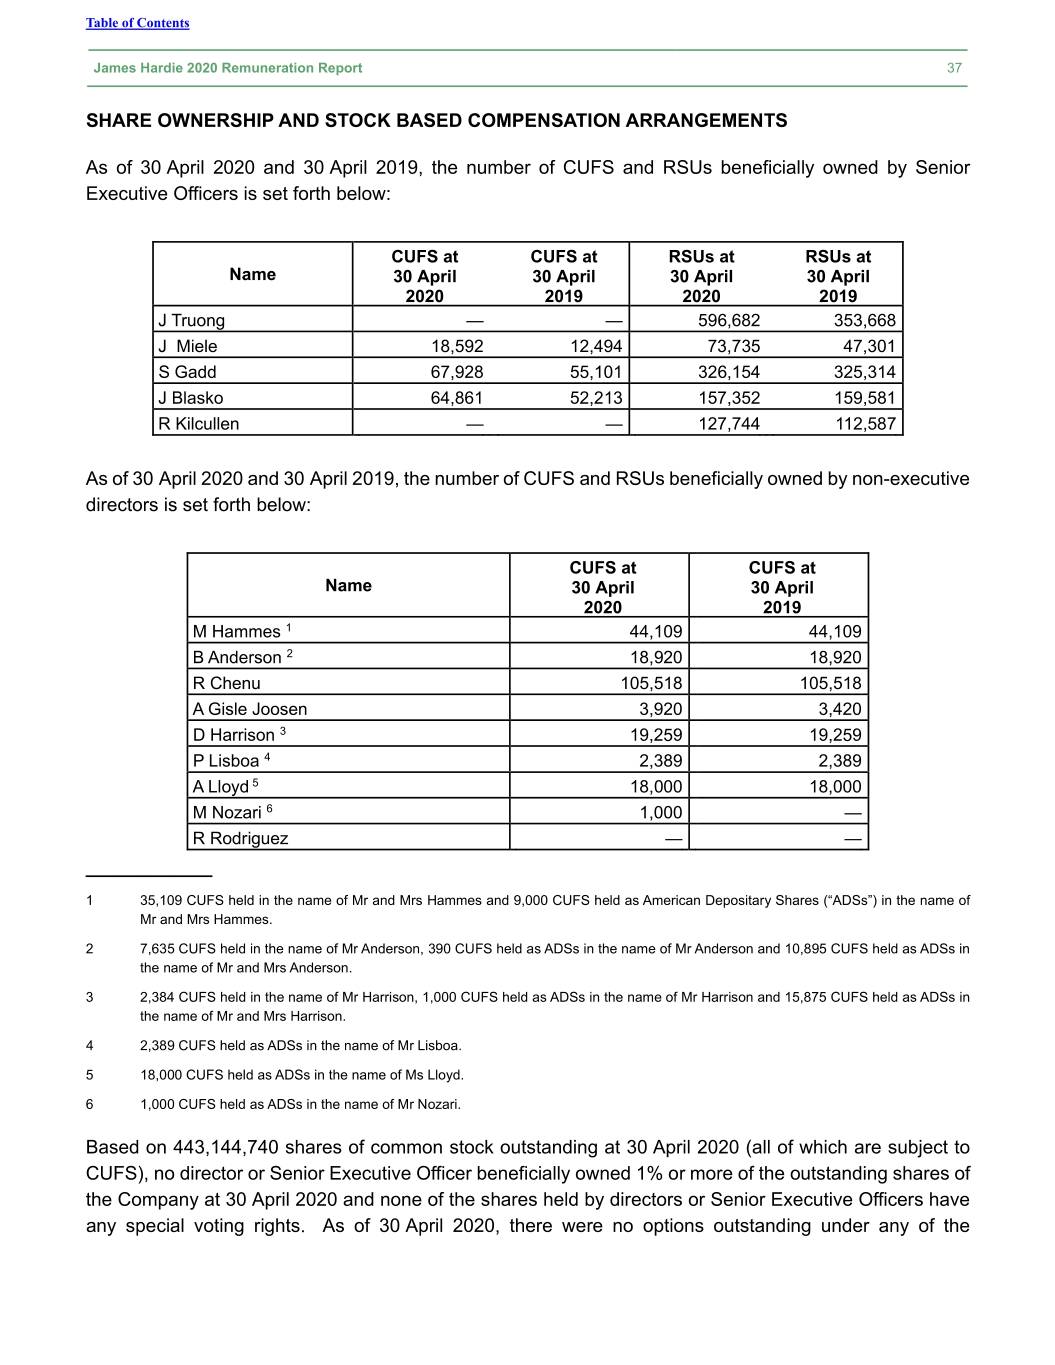
Table of Contents James Hardie 2020 Remuneration Report 37 SHARE OWNERSHIP AND STOCK BASED COMPENSATION ARRANGEMENTS As of 30 April 2020 and 30 April 2019, the number of CUFS and RSUs beneficially owned by Senior Executive Officers is set forth below: CUFS at CUFS at RSUs at RSUs at Name 30 April 30 April 30 April 30 April 2020 2019 2020 2019 J Truong — — 596,682 353,668 J Miele 18,592 12,494 73,735 47,301 8 S Gadd 67,928 55,101 326,154 325,314 J Blasko 64,861 52,213 157,352 159,581 R Kilcullen — — 127,744 112,587 As of 30 April 2020 and 30 April 2019, the number of CUFS and RSUs beneficially owned by non-executive directors is set forth below: CUFS at CUFS at Name 30 April 30 April 2020 2019 M Hammes 1 44,109 44,109 B Anderson 2 18,920 18,920 R Chenu 105,518 105,518 A Gisle Joosen 3,920 3,420 D Harrison 3 19,259 19,259 P Lisboa 4 2,389 2,389 A Lloyd 5 18,000 18,000 M Nozari 6 1,000 — R Rodriguez — — ____________ 1 35,109 CUFS held in the name of Mr and Mrs Hammes and 9,000 CUFS held as American Depositary Shares (“ADSs”) in the name of Mr and Mrs Hammes. 2 7,635 CUFS held in the name of Mr Anderson, 390 CUFS held as ADSs in the name of Mr Anderson and 10,895 CUFS held as ADSs in the name of Mr and Mrs Anderson. 3 2,384 CUFS held in the name of Mr Harrison, 1,000 CUFS held as ADSs in the name of Mr Harrison and 15,875 CUFS held as ADSs in the name of Mr and Mrs Harrison. 4 2,389 CUFS held as ADSs in the name of Mr Lisboa. 5 18,000 CUFS held as ADSs in the name of Ms Lloyd. 6 1,000 CUFS held as ADSs in the name of Mr Nozari. Based on 443,144,740 shares of common stock outstanding at 30 April 2020 (all of which are subject to CUFS), no director or Senior Executive Officer beneficially owned 1% or more of the outstanding shares of the Company at 30 April 2020 and none of the shares held by directors or Senior Executive Officers have any special voting rights. As of 30 April 2020, there were no options outstanding under any of the
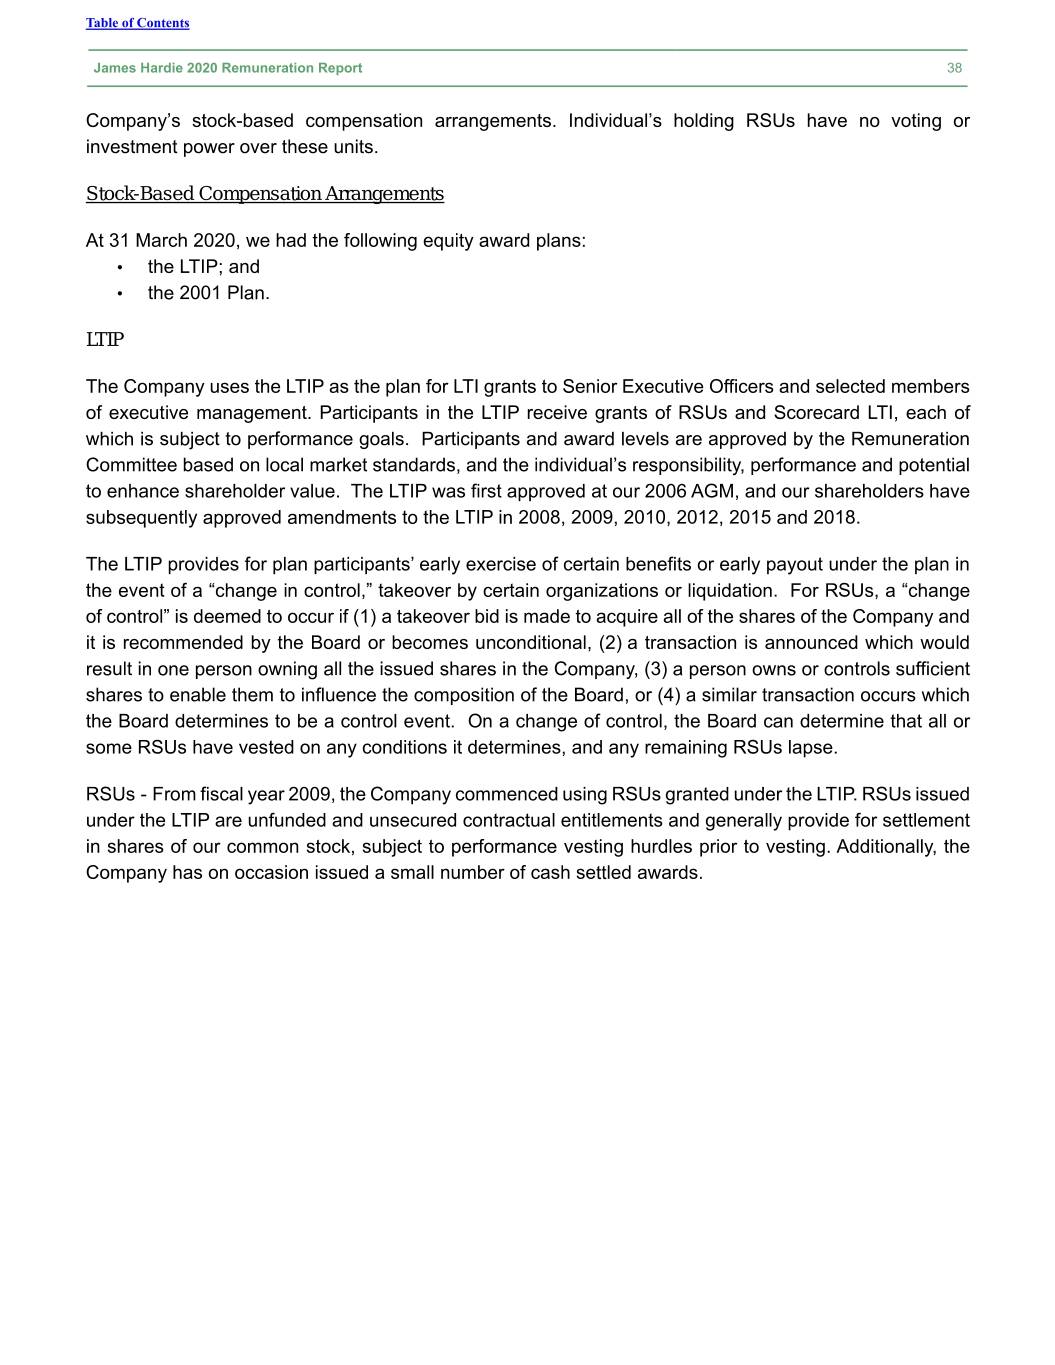
Table of Contents James Hardie 2020 Remuneration Report 38 Company’s stock-based compensation arrangements. Individual’s holding RSUs have no voting or investment power over these units. Stock-Based Compensation Arrangements At 31 March 2020, we had the following equity award plans: • the LTIP; and • the 2001 Plan. LTIP The Company uses the LTIP as the plan for LTI grants to Senior Executive Officers and selected members of executive management. Participants in the LTIP receive grants of RSUs and Scorecard LTI, each of which is subject to performance goals. Participants and award levels are approved by the Remuneration Committee based on local market standards, and the individual’s responsibility, performance and potential to enhance shareholder value. The LTIP was first approved at our 2006 AGM, and our shareholders have subsequently approved amendments to the LTIP in 2008, 2009, 2010, 2012, 2015 and 2018. The LTIP provides for plan participants’ early exercise of certain benefits or early payout under the plan in the event of a “change in control,” takeover by certain organizations or liquidation. For RSUs, a “change of control” is deemed to occur if (1) a takeover bid is made to acquire all of the shares of the Company and it is recommended by the Board or becomes unconditional, (2) a transaction is announced which would result in one person owning all the issued shares in the Company, (3) a person owns or controls sufficient shares to enable them to influence the composition of the Board, or (4) a similar transaction occurs which the Board determines to be a control event. On a change of control, the Board can determine that all or some RSUs have vested on any conditions it determines, and any remaining RSUs lapse. RSUs - From fiscal year 2009, the Company commenced using RSUs granted under the LTIP. RSUs issued under the LTIP are unfunded and unsecured contractual entitlements and generally provide for settlement in shares of our common stock, subject to performance vesting hurdles prior to vesting. Additionally, the Company has on occasion issued a small number of cash settled awards.
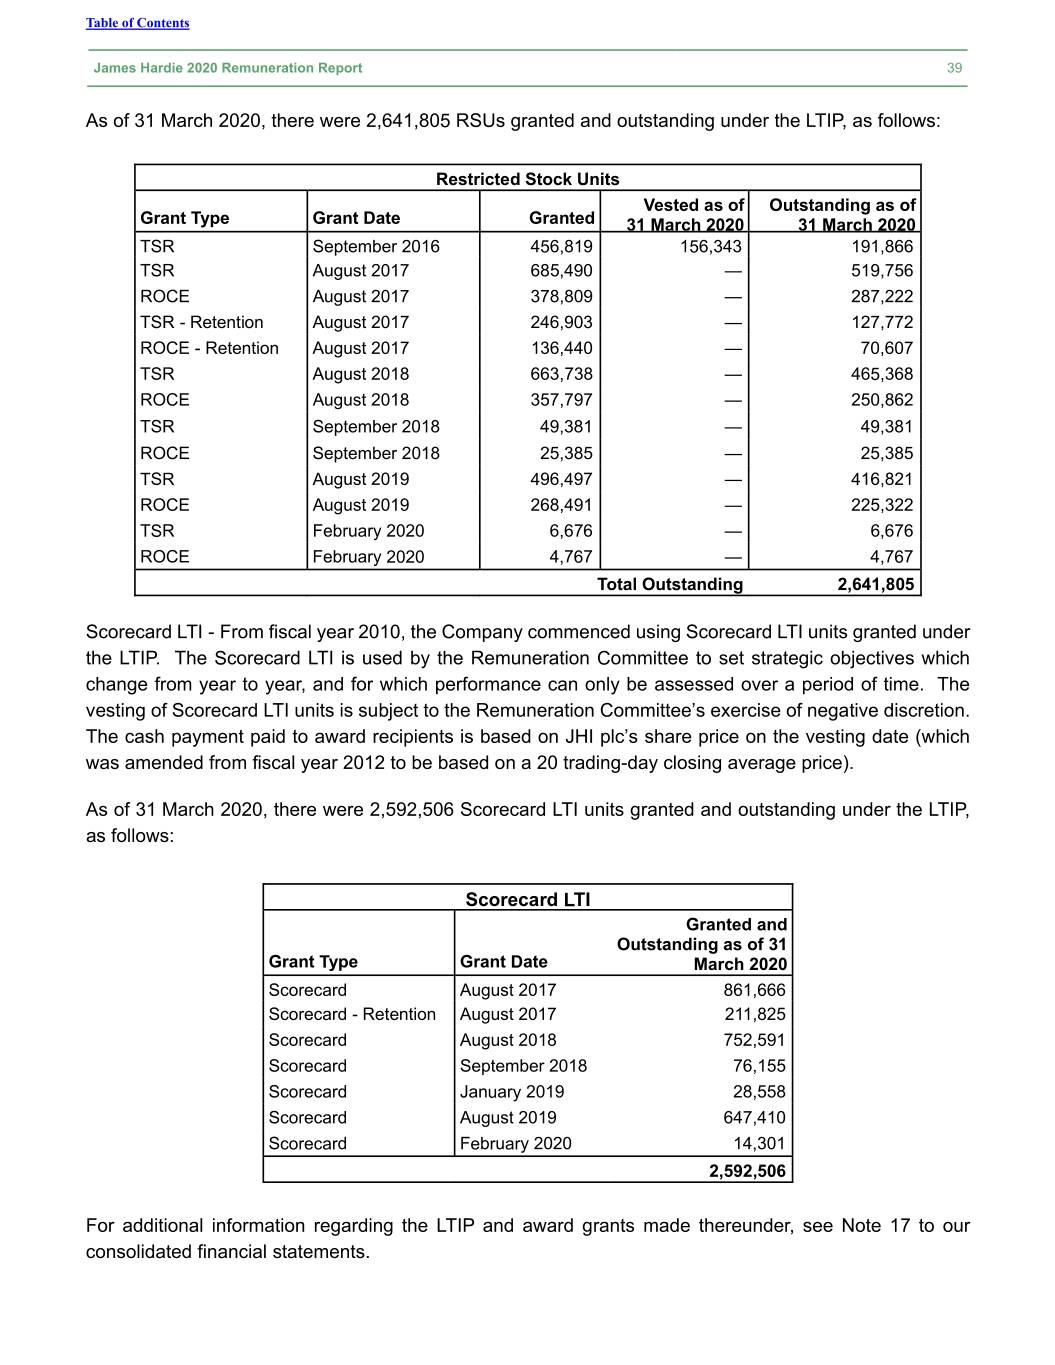
Table of Contents James Hardie 2020 Remuneration Report 39 As of 31 March 2020, there were 2,641,805 RSUs granted and outstanding under the LTIP, as follows: Restricted Stock Units Vested as of Outstanding as of Grant Type Grant Date Granted 31 March 2020 31 March 2020 TSR September 2016 456,819 156,343 191,866 TSR August 2017 685,490 — 519,756 ROCE August 2017 378,809 — 287,222 TSR - Retention August 2017 246,903 — 127,772 ROCE - Retention August 2017 136,440 — 70,607 TSR August 2018 663,738 — 465,368 ROCE August 2018 357,797 — 250,862 TSR September 2018 49,381 — 49,381 ROCE September 2018 25,385 — 25,385 TSR August 2019 496,497 — 416,821 ROCE August 2019 268,491 — 225,322 TSR February 2020 6,676 — 6,676 ROCE February 2020 4,767 — 4,767 Total Outstanding 2,641,805 Scorecard LTI - From fiscal year 2010, the Company commenced using Scorecard LTI units granted under the LTIP. The Scorecard LTI is used by the Remuneration Committee to set strategic objectives which change from year to year, and for which performance can only be assessed over a period of time. The vesting of Scorecard LTI units is subject to the Remuneration Committee’s exercise of negative discretion. The cash payment paid to award recipients is based on JHI plc’s share price on the vesting date (which was amended from fiscal year 2012 to be based on a 20 trading-day closing average price). As of 31 March 2020, there were 2,592,506 Scorecard LTI units granted and outstanding under the LTIP, as follows: Scorecard LTI Granted and Outstanding as of 31 Grant Type Grant Date March 2020 Scorecard August 2017 861,666 Scorecard - Retention August 2017 211,825 Scorecard August 2018 752,591 Scorecard September 2018 76,155 Scorecard January 2019 28,558 Scorecard August 2019 647,410 Scorecard February 2020 14,301 2,592,506 For additional information regarding the LTIP and award grants made thereunder, see Note 17 to our consolidated financial statements.
Table of Contents James Hardie 2020 Remuneration Report 40 2001 Plan The 2001 Plan is intended to promote the Company’s long-term financial interests by encouraging management below the senior executive level to acquire an ownership position in the Company and align their interests with our shareholders. Selected employees under the 2001 Plan are eligible to receive awards in the form of RSUs, nonqualified stock options, performance awards, restricted stock grants, stock appreciation rights, dividend equivalent rights, phantom stock or other stock-based benefits. Award levels are determined based on the Remuneration Committee’s review of local market standards and the individual’s responsibility, performance and potential to enhance shareholder value. The 2001 Plan was first approved by our shareholders and Board in 2001 and reapproved to continue until September 2021 at the 2011 AGM. An aggregate of 45,077,100 shares of common stock were made available for issuance under the 2001 Plan, subject to adjustment in the event of a number of prescribed events set out on the 2001 Plan. Outstanding RSUs granted under the 2001 Plan generally vest at the rate of 25% on the 1st anniversary of the grant, 25% on the 2nd anniversary date and 50% on the 3rd anniversary date. The 2001 Plan is administered by our Remuneration Committee, and the Remuneration Committee or its delegate is authorized to determine: (i) who may participate in the 2001 Plan; (ii) the number and types of awards made to each participant; and (iii) the terms, conditions and limitations applicable to each award. The Remuneration Committee has the exclusive power to interpret and adopt rules and regulations to administer the 2001 Plan, including a limited power to amend, modify or terminate the 2001 Plan to meet any changes in legal requirements or for any other purpose permitted by law. The purchase or exercise price of any award granted under the 2001 Plan may be paid in cash or other consideration at the discretion of our Remuneration Committee, including cashless exercises. The exercise price for all options is the market value of the shares on the date of grant. The Company may not reduce the exercise price of such an option or exchange such an option or stock appreciation right for cash, or other awards or a new option at a reduced exercise price without shareholder approval or as permitted under specific restructuring events. No unexercised options or unvested RSUs issued under the 2001 Plan are entitled to dividends or dividend equivalent rights. The 2001 Plan also permits the Remuneration Committee to grant stock options, performance awards, restricted stock awards, stock appreciation rights, dividend equivalent rights or other stock based benefits. The 2001 Plan provides for the automatic acceleration of certain benefits and the termination of the plan under certain circumstances in the event of a “change in control.” A change in control will be deemed to have occurred if either (1) any person or group acquires beneficial ownership equivalent to 30% of our voting securities, (2) individuals who are currently members of our Board cease to constitute at least a majority of the members of our Board, or (3) there occurs the consummation of certain mergers (other than a merger that results in existing voting securities continuing to represent more than 5% of the voting power of the merged entity or a recapitalization or reincorporation that does not result in a material change in the
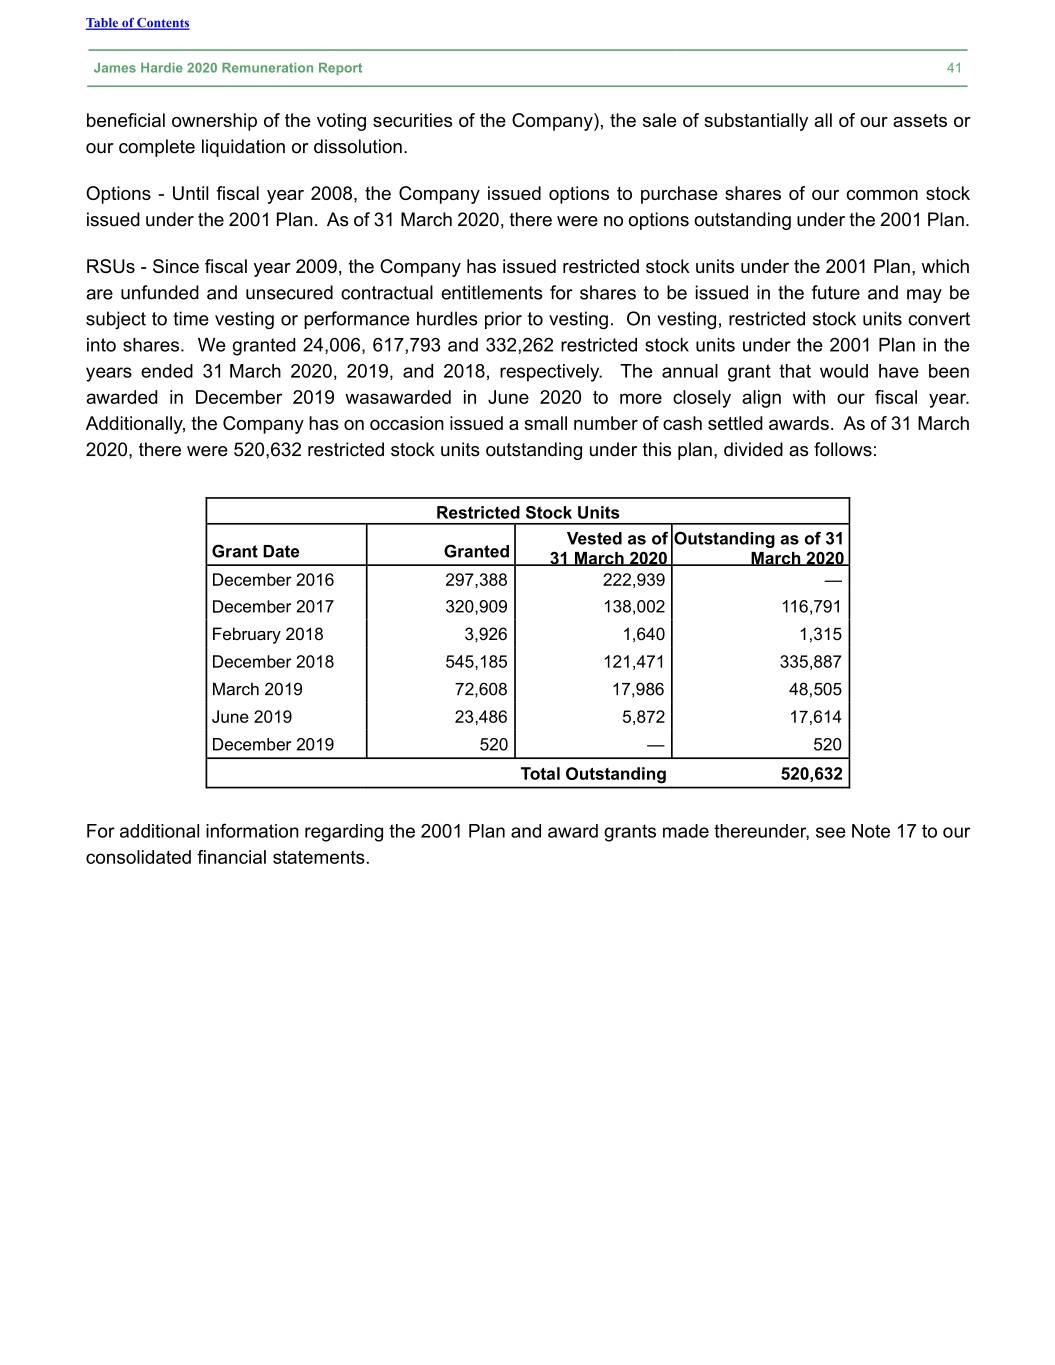
Table of Contents James Hardie 2020 Remuneration Report 41 beneficial ownership of the voting securities of the Company), the sale of substantially all of our assets or our complete liquidation or dissolution. Options - Until fiscal year 2008, the Company issued options to purchase shares of our common stock issued under the 2001 Plan. As of 31 March 2020, there were no options outstanding under the 2001 Plan. RSUs - Since fiscal year 2009, the Company has issued restricted stock units under the 2001 Plan, which are unfunded and unsecured contractual entitlements for shares to be issued in the future and may be subject to time vesting or performance hurdles prior to vesting. On vesting, restricted stock units convert into shares. We granted 24,006, 617,793 and 332,262 restricted stock units under the 2001 Plan in the years ended 31 March 2020, 2019, and 2018, respectively. The annual grant that would have been awarded in December 2019 wasawarded in June 2020 to more closely align with our fiscal year. Additionally, the Company has on occasion issued a small number of cash settled awards. As of 31 March 2020, there were 520,632 restricted stock units outstanding under this plan, divided as follows: Restricted Stock Units Vested as of Outstanding as of 31 Grant Date Granted 31 March 2020 March 2020 December 2016 297,388 222,939 — December 2017 320,909 138,002 116,791 February 2018 3,926 1,640 1,315 December 2018 545,185 121,471 335,887 March 2019 72,608 17,986 48,505 June 2019 23,486 5,872 17,614 December 2019 520 — 520 Total Outstanding 520,632 For additional information regarding the 2001 Plan and award grants made thereunder, see Note 17 to our consolidated financial statements.