A NEW JAMES HARDIE 2021 Annual Report Fiscal Year Ending 31 March 2021 Exhibit 99.9
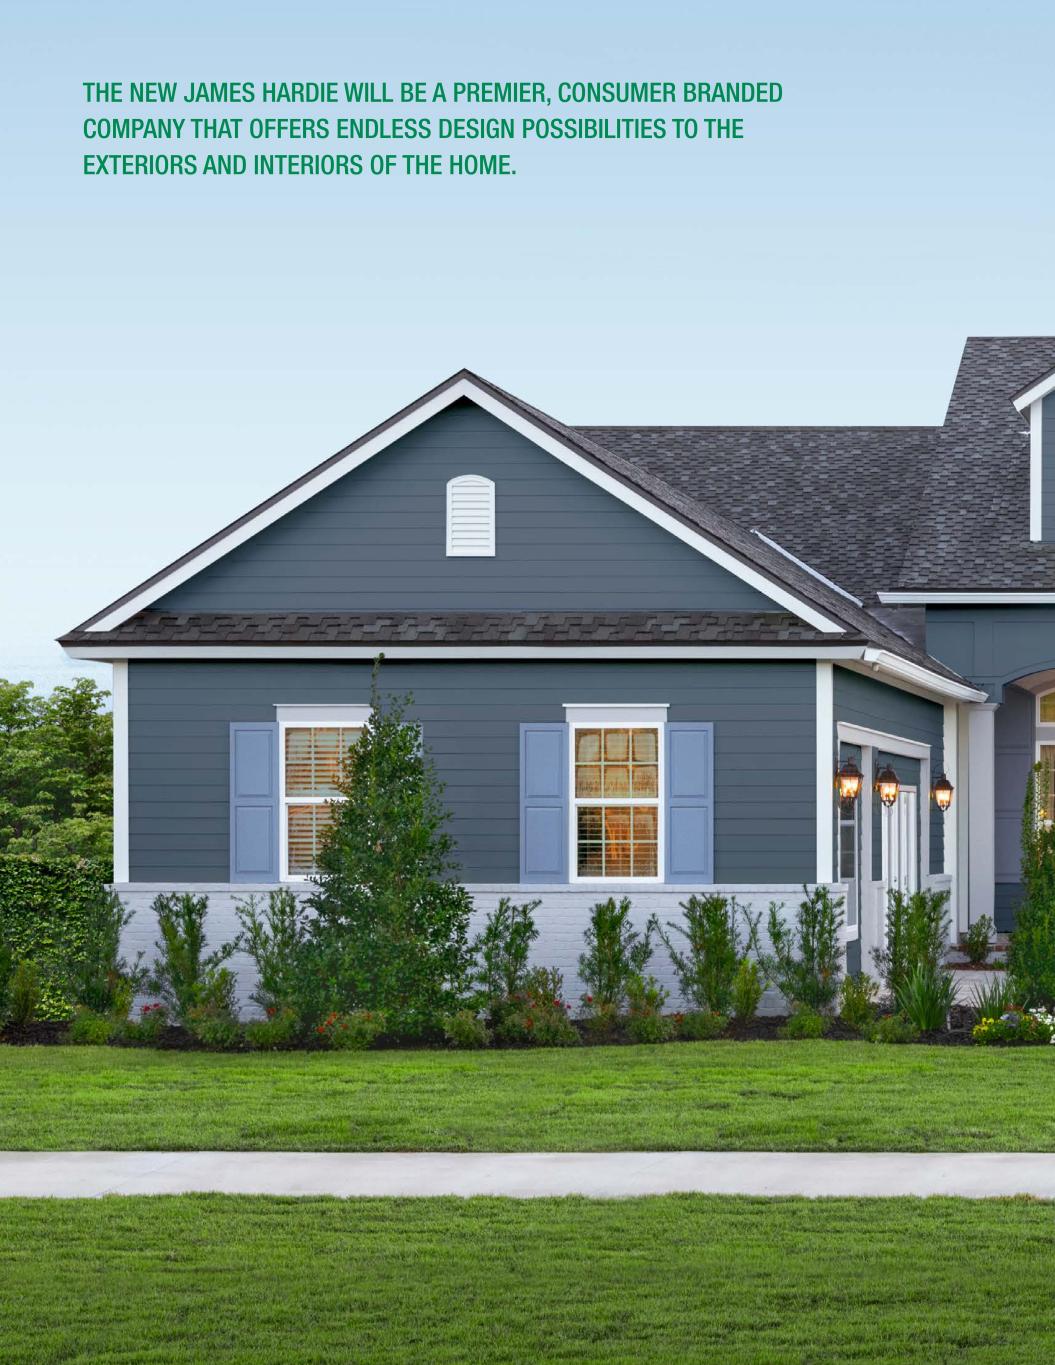
THE NEW JAMES HARDIE WILL BE A PREMIER, CONSUMER BRANDED COMPANY THAT OFFERS ENDLESS DESIGN POSSIBILITIES TO THE EXTERIORS AND INTERIORS OF THE HOME.
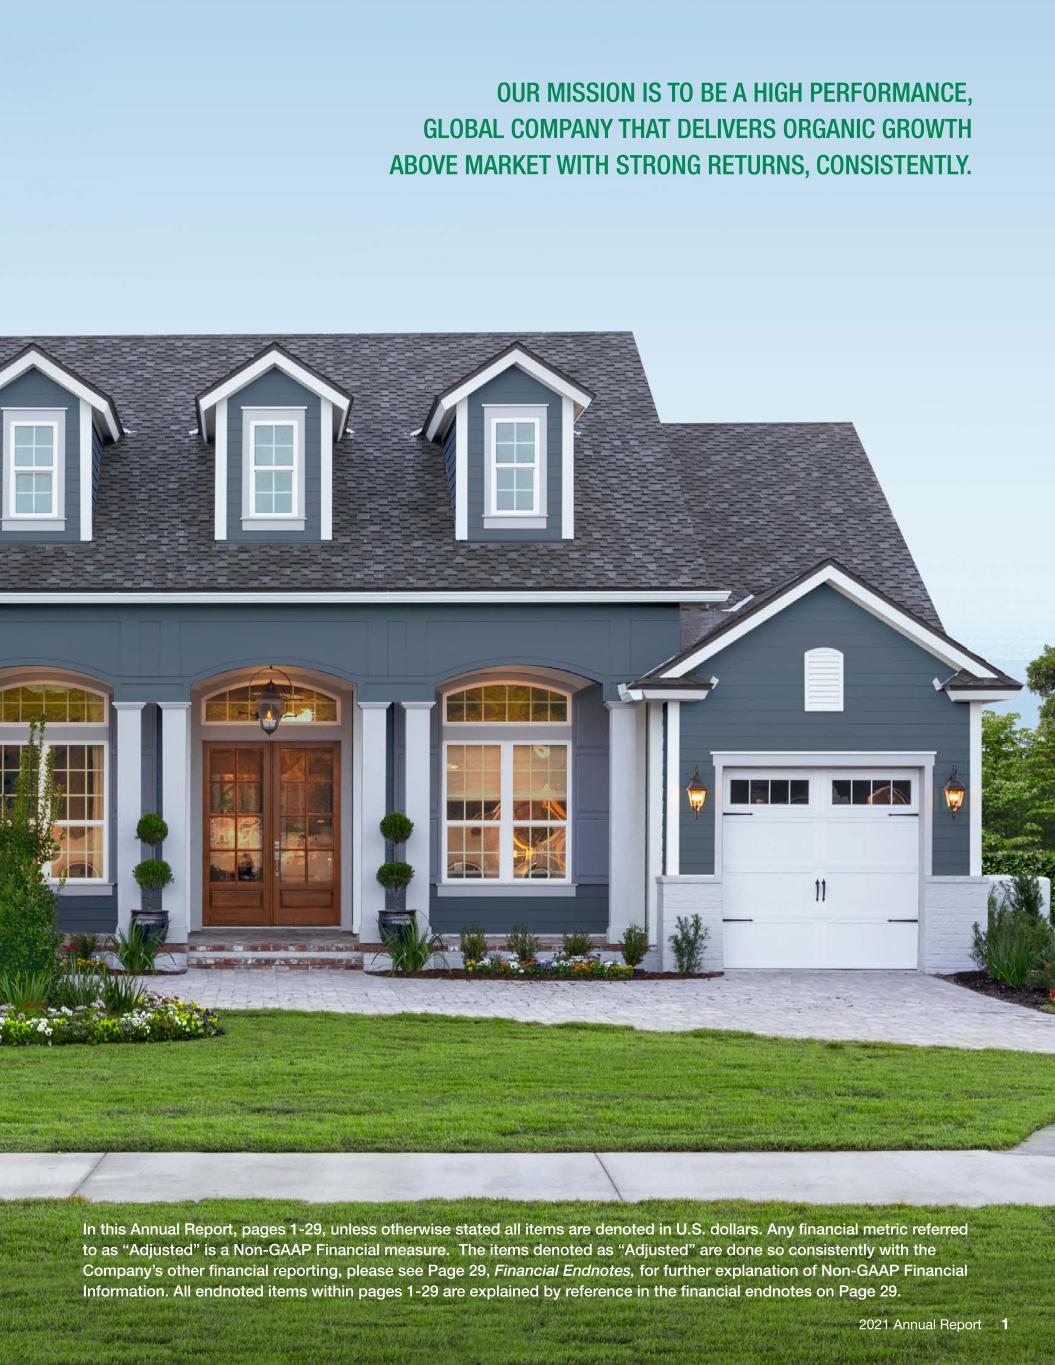
OUR MISSION IS TO BE A HIGH PERFORMANCE, GLOBAL COMPANY THAT DELIVERS ORGANIC GROWTH ABOVE MARKET WITH STRONG RETURNS, CONSISTENTLY. 2021 Annual Report 1 In this Annual Report, pages 1-29, unless otherwise stated all items are denoted in U.S. dollars. Any financial metric referred to as “Adjusted” is a Non-GAAP Financial measure. The items denoted as “Adjusted” are done so consistently with the Company’s other financial reporting, please see Page 29, Financial Endnotes, for further explanation of Non-GAAP Financial Information. All endnoted items within pages 1-29 are explained by reference in the financial endnotes on Page 29.
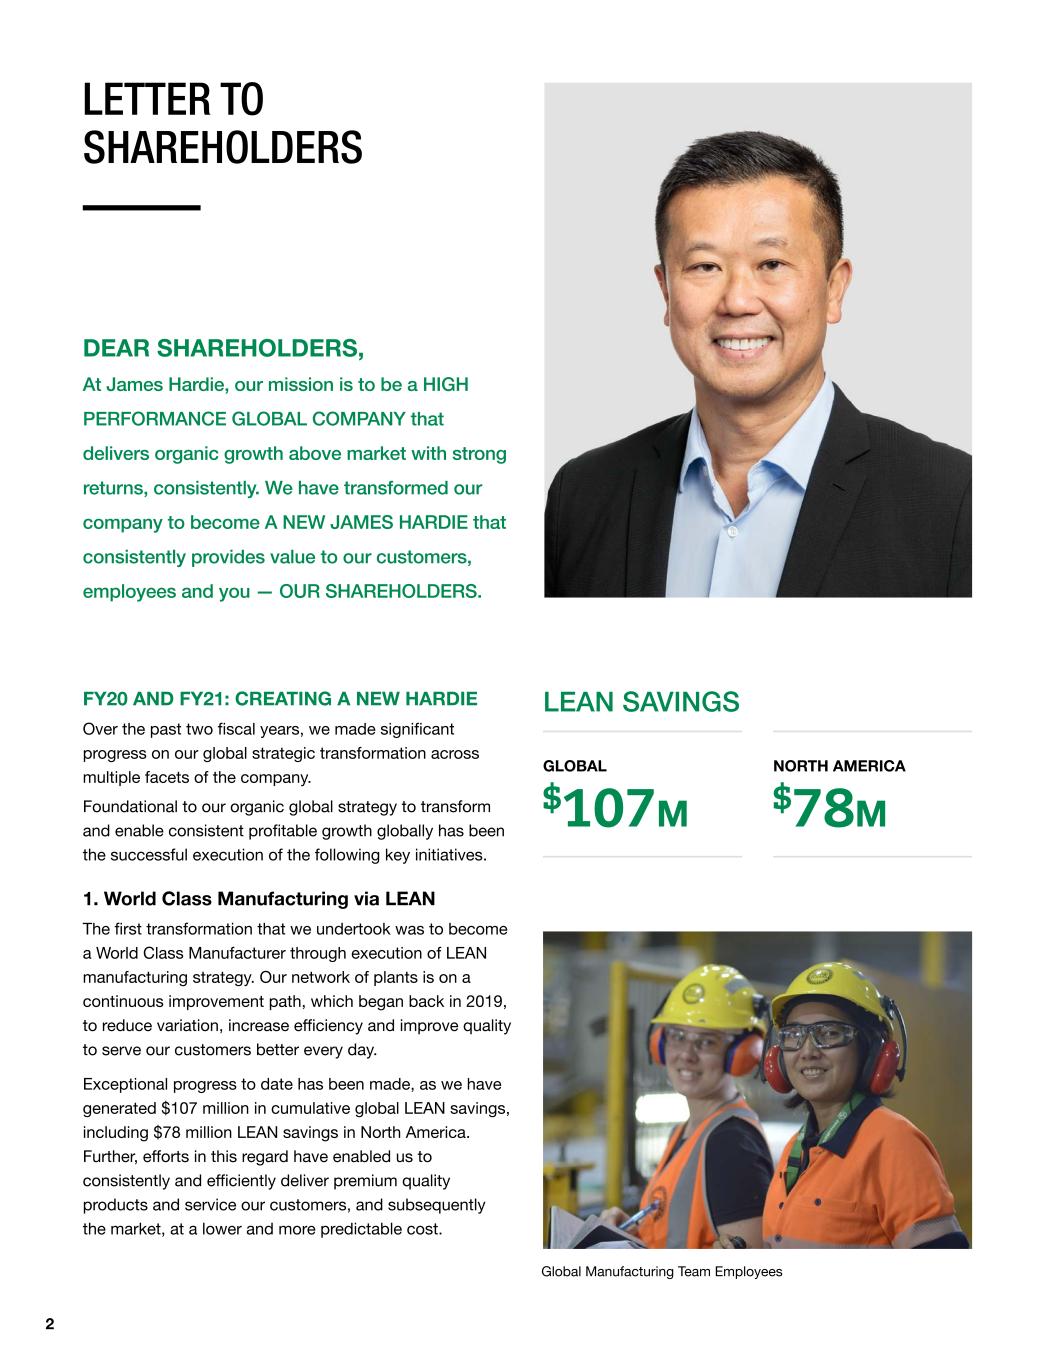
2 FY20 AND FY21: CREATING A NEW HARDIE Over the past two fiscal years, we made significant progress on our global strategic transformation across multiple facets of the company. Foundational to our organic global strategy to transform and enable consistent profitable growth globally has been the successful execution of the following key initiatives. 1. World Class Manufacturing via LEAN The first transformation that we undertook was to become a World Class Manufacturer through execution of LEAN manufacturing strategy. Our network of plants is on a continuous improvement path, which began back in 2019, to reduce variation, increase efficiency and improve quality to serve our customers better every day. Exceptional progress to date has been made, as we have generated $107 million in cumulative global LEAN savings, including $78 million LEAN savings in North America. Further, efforts in this regard have enabled us to consistently and efficiently deliver premium quality products and service our customers, and subsequently the market, at a lower and more predictable cost. LETTER TO SHAREHOLDERS DEAR SHAREHOLDERS, At James Hardie, our mission is to be a HIGH PERFORMANCE GLOBAL COMPANY that delivers organic growth above market with strong returns, consistently. We have transformed our company to become A NEW JAMES HARDIE that consistently provides value to our customers, employees and you — OUR SHAREHOLDERS. LEAN SAVINGS GLOBAL $107M NORTH AMERICA $78M PHOTO Global Manufacturing Team Employees
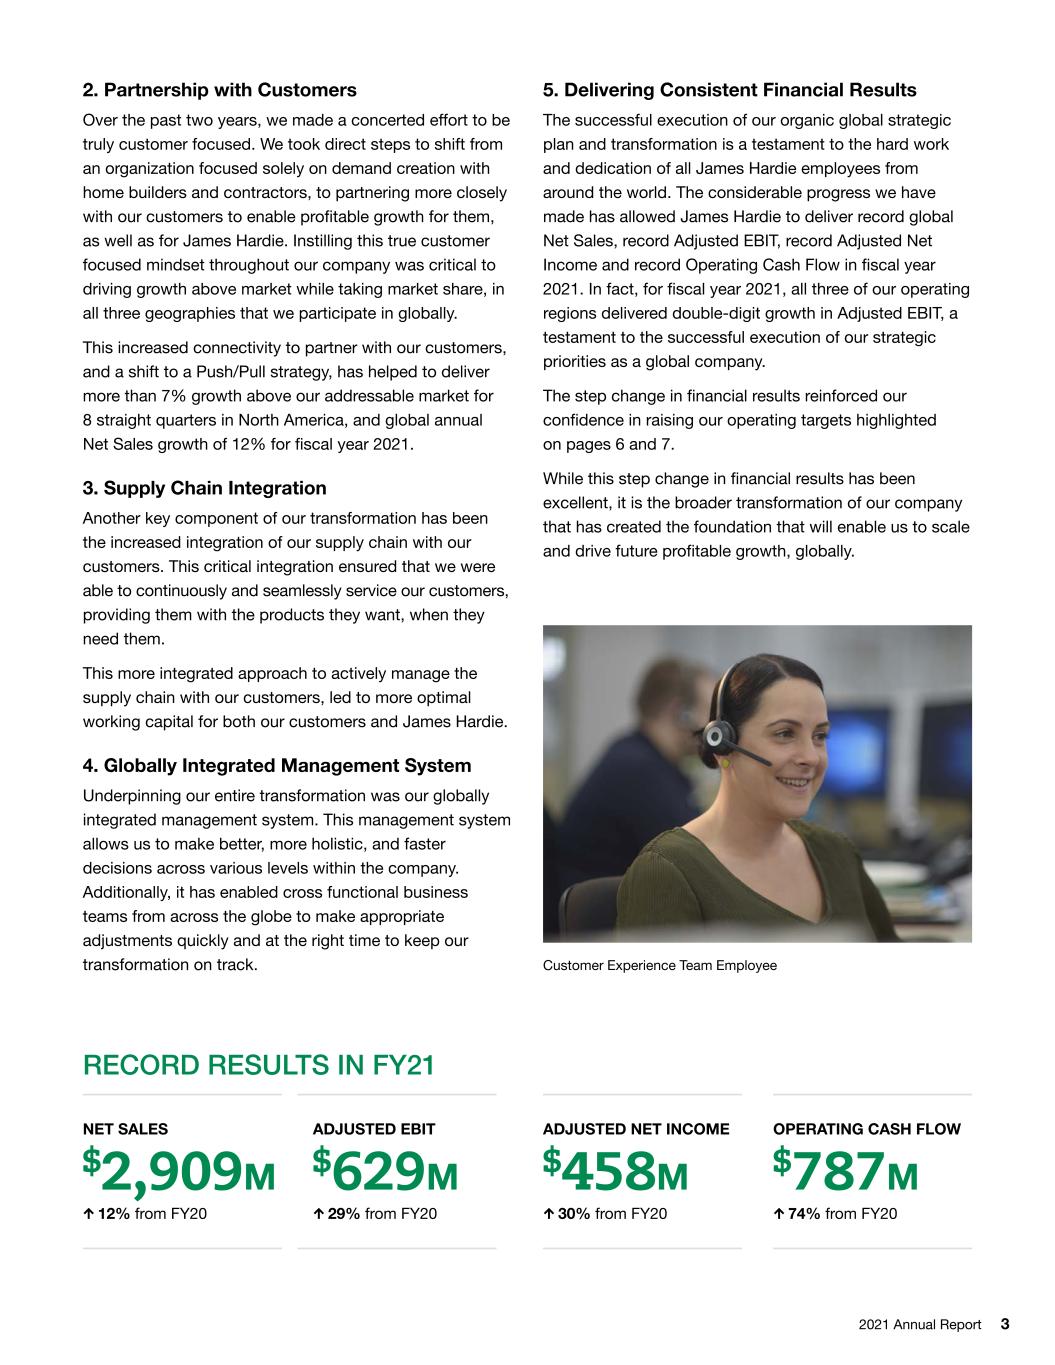
2021 Annual Report 3 2. Partnership with Customers Over the past two years, we made a concerted effort to be truly customer focused. We took direct steps to shift from an organization focused solely on demand creation with home builders and contractors, to partnering more closely with our customers to enable profitable growth for them, as well as for James Hardie. Instilling this true customer focused mindset throughout our company was critical to driving growth above market while taking market share, in all three geographies that we participate in globally. This increased connectivity to partner with our customers, and a shift to a Push/Pull strategy, has helped to deliver more than 7% growth above our addressable market for 8 straight quarters in North America, and global annual Net Sales growth of 12% for fiscal year 2021. 3. Supply Chain Integration Another key component of our transformation has been the increased integration of our supply chain with our customers. This critical integration ensured that we were able to continuously and seamlessly service our customers, providing them with the products they want, when they need them. This more integrated approach to actively manage the supply chain with our customers, led to more optimal working capital for both our customers and James Hardie. 4. Globally Integrated Management System Underpinning our entire transformation was our globally integrated management system. This management system allows us to make better, more holistic, and faster decisions across various levels within the company. Additionally, it has enabled cross functional business teams from across the globe to make appropriate adjustments quickly and at the right time to keep our transformation on track. 5. Delivering Consistent Financial Results The successful execution of our organic global strategic plan and transformation is a testament to the hard work and dedication of all James Hardie employees from around the world. The considerable progress we have made has allowed James Hardie to deliver record global Net Sales, record Adjusted EBIT, record Adjusted Net Income and record Operating Cash Flow in fiscal year 2021. In fact, for fiscal year 2021, all three of our operating regions delivered double-digit growth in Adjusted EBIT, a testament to the successful execution of our strategic priorities as a global company. The step change in financial results reinforced our confidence in raising our operating targets highlighted on pages 6 and 7. While this step change in financial results has been excellent, it is the broader transformation of our company that has created the foundation that will enable us to scale and drive future profitable growth, globally. Customer Experience Team Employee RECORD RESULTS IN FY21 NET SALES $2,909M ↑ 12% from FY20 ADJUSTED EBIT $629M ↑ 29% from FY20 ADJUSTED NET INCOME $458M ↑ 30% from FY20 OPERATING CASH FLOW $787M ↑ 74% from FY20
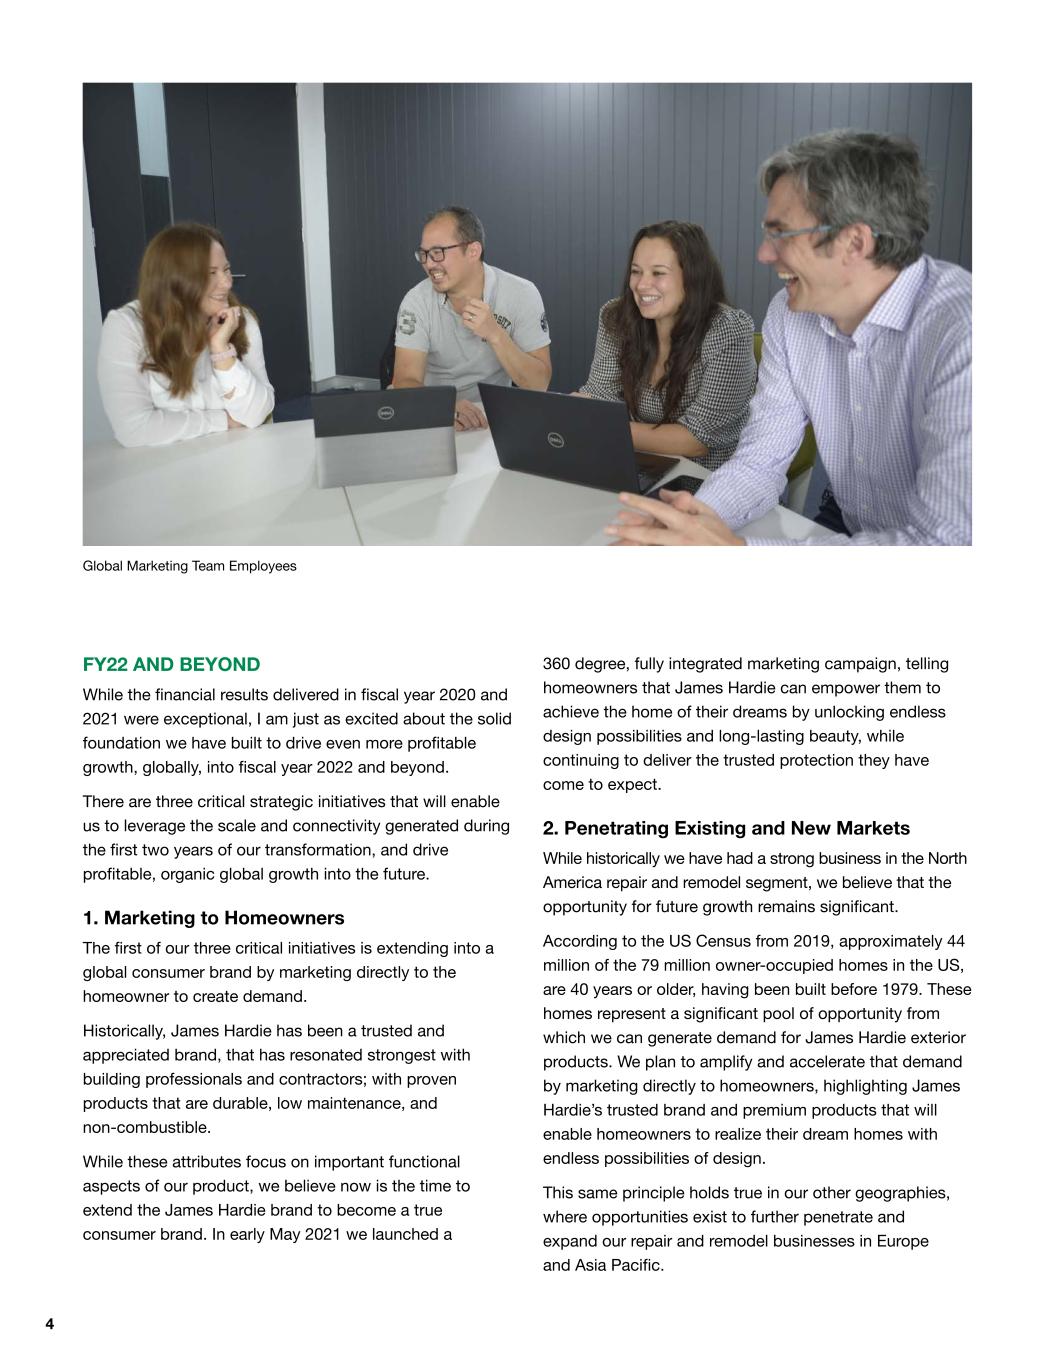
4 FY22 AND BEYOND While the financial results delivered in fiscal year 2020 and 2021 were exceptional, I am just as excited about the solid foundation we have built to drive even more profitable growth, globally, into fiscal year 2022 and beyond. There are three critical strategic initiatives that will enable us to leverage the scale and connectivity generated during the first two years of our transformation, and drive profitable, organic global growth into the future. 1. Marketing to Homeowners The first of our three critical initiatives is extending into a global consumer brand by marketing directly to the homeowner to create demand. Historically, James Hardie has been a trusted and appreciated brand, that has resonated strongest with building professionals and contractors; with proven products that are durable, low maintenance, and non-combustible. While these attributes focus on important functional aspects of our product, we believe now is the time to extend the James Hardie brand to become a true consumer brand. In early May 2021 we launched a 360 degree, fully integrated marketing campaign, telling homeowners that James Hardie can empower them to achieve the home of their dreams by unlocking endless design possibilities and long-lasting beauty, while continuing to deliver the trusted protection they have come to expect. 2. Penetrating Existing and New Markets While historically we have had a strong business in the North America repair and remodel segment, we believe that the opportunity for future growth remains significant. According to the US Census from 2019, approximately 44 million of the 79 million owner-occupied homes in the US, are 40 years or older, having been built before 1979. These homes represent a significant pool of opportunity from which we can generate demand for James Hardie exterior products. We plan to amplify and accelerate that demand by marketing directly to homeowners, highlighting James Hardie’s trusted brand and premium products that will enable homeowners to realize their dream homes with endless possibilities of design. This same principle holds true in our other geographies, where opportunities exist to further penetrate and expand our repair and remodel businesses in Europe and Asia Pacific. Global Marketing Team Employees
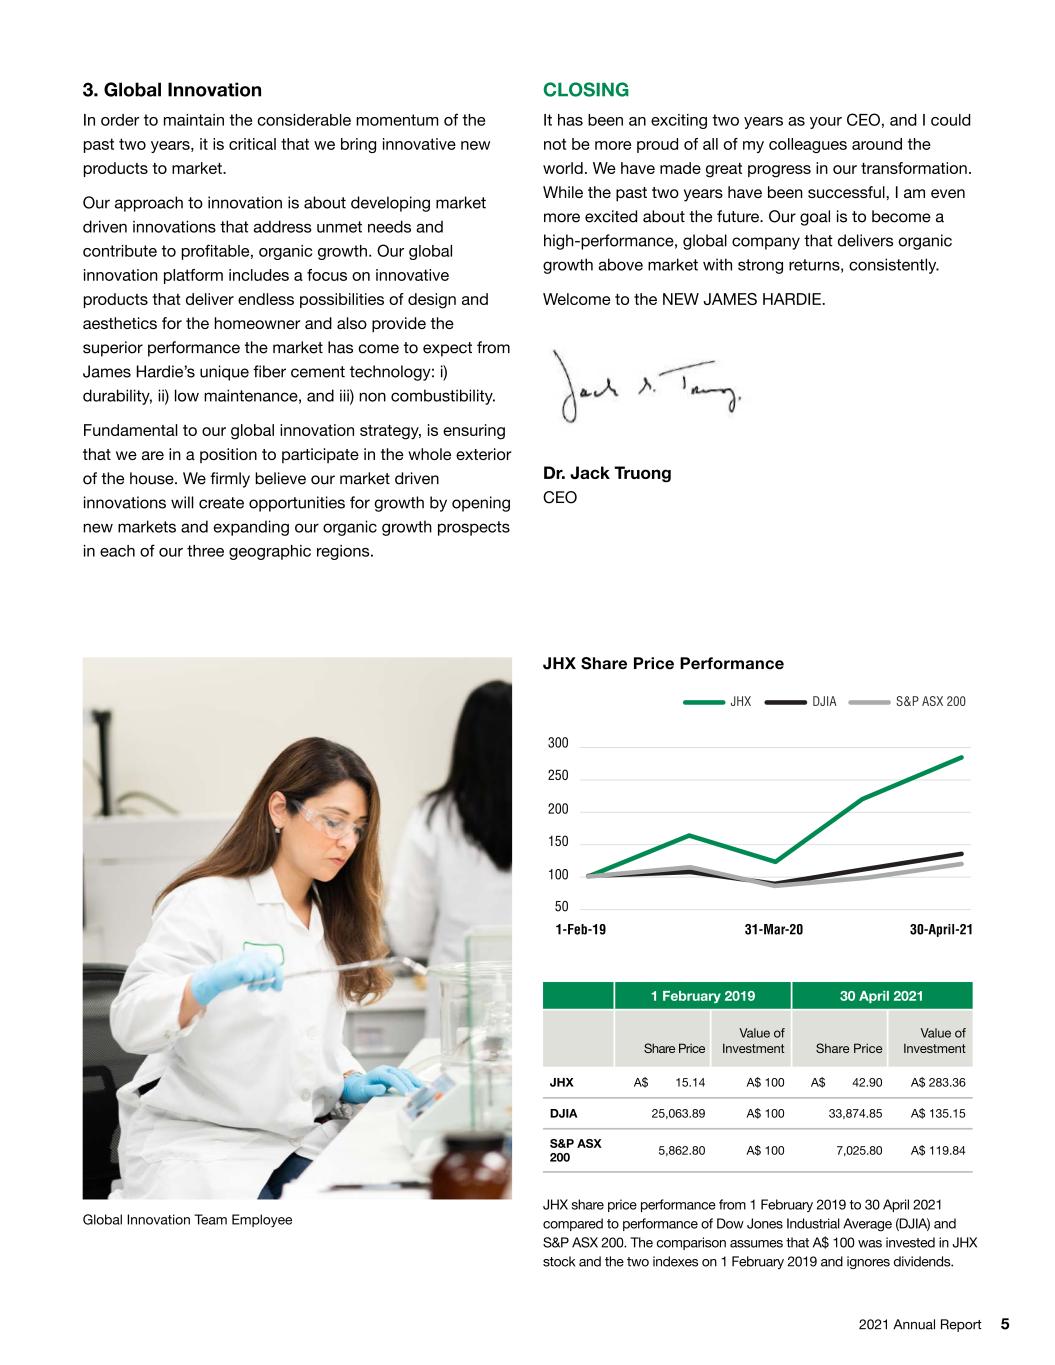
2021 Annual Report 5 3. Global Innovation In order to maintain the considerable momentum of the past two years, it is critical that we bring innovative new products to market. Our approach to innovation is about developing market driven innovations that address unmet needs and contribute to profitable, organic growth. Our global innovation platform includes a focus on innovative products that deliver endless possibilities of design and aesthetics for the homeowner and also provide the superior performance the market has come to expect from James Hardie’s unique fiber cement technology: i) durability, ii) low maintenance, and iii) non combustibility. Fundamental to our global innovation strategy, is ensuring that we are in a position to participate in the whole exterior of the house. We firmly believe our market driven innovations will create opportunities for growth by opening new markets and expanding our organic growth prospects in each of our three geographic regions. 300 250 200 150 100 50 1-Feb-19 31-Mar-20 30-April-21 DJIA S&P ASX 200JHX Global Innovation Team Employee JHX share price performance from 1 February 2019 to 30 April 2021 compared to performance of Dow Jones Industrial Average (DJIA) and S&P ASX 200. The comparison assumes that A$ 100 was invested in JHX stock and the two indexes on 1 February 2019 and ignores dividends. CLOSING It has been an exciting two years as your CEO, and I could not be more proud of all of my colleagues around the world. We have made great progress in our transformation. While the past two years have been successful, I am even more excited about the future. Our goal is to become a high-performance, global company that delivers organic growth above market with strong returns, consistently. Welcome to the NEW JAMES HARDIE. Dr. Jack Truong CEO JHX Share Price Performance 1 February 2019 30 April 2021 Share Price Value of Investment Share Price Value of Investment JHX A$ 15.14 A$ 100 A$ 42.90 A$ 283.36 DJIA 25,063.89 A$ 100 33,874.85 A$ 135.15 S&P ASX 200 5,862.80 A$ 100 7,025.80 A$ 119.84
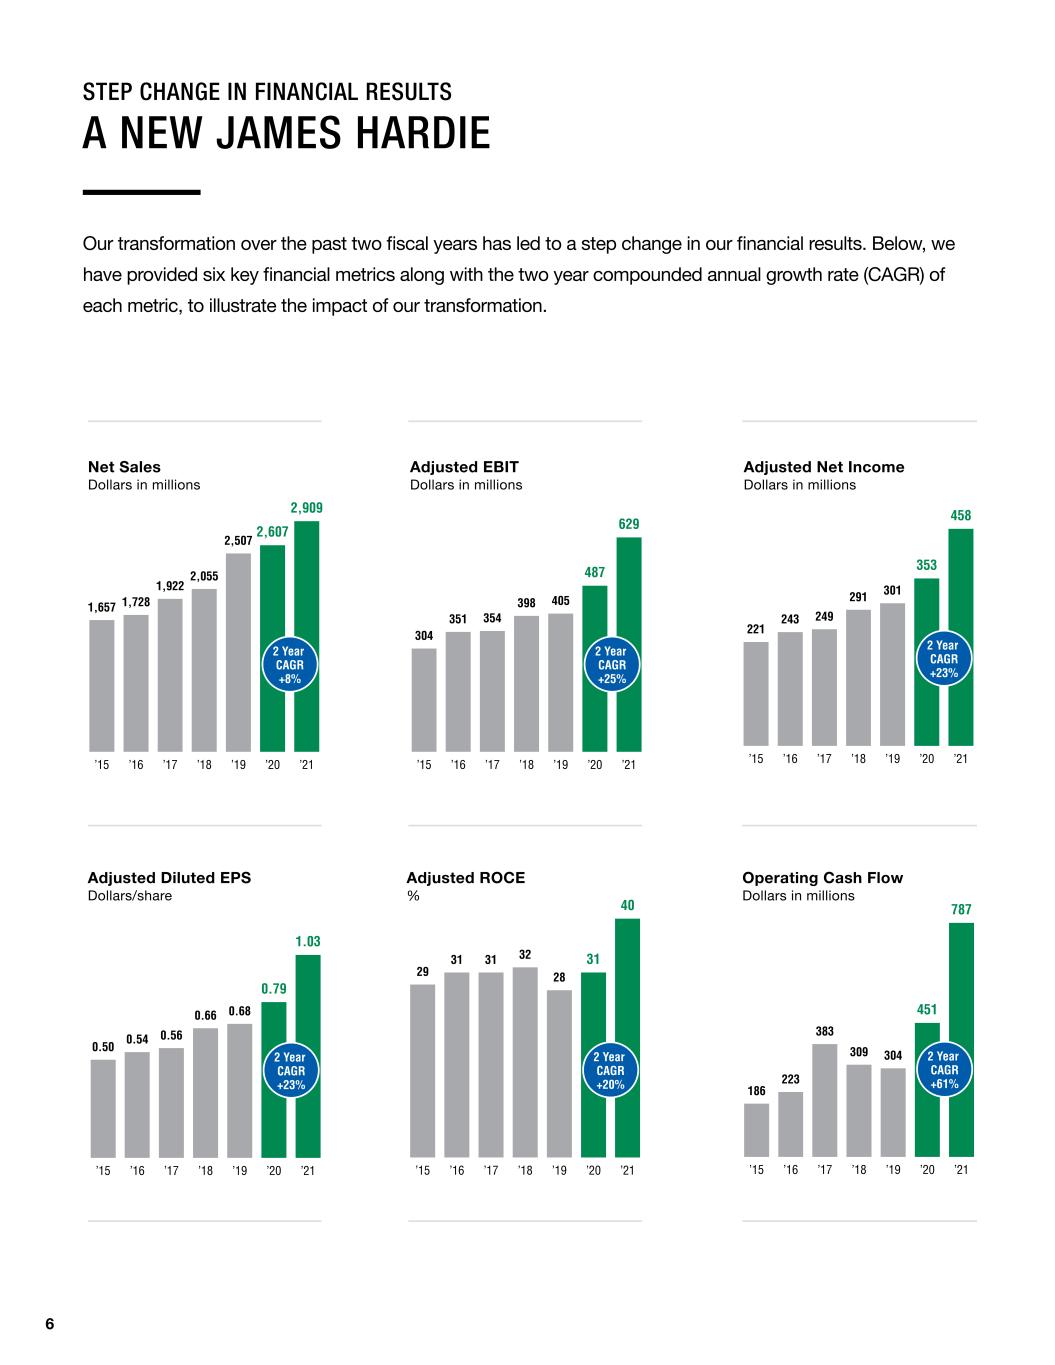
STEP CHANGE IN FINANCIAL RESULTS A NEW JAMES HARDIE Our transformation over the past two fiscal years has led to a step change in our financial results. Below, we have provided six key financial metrics along with the two year compounded annual growth rate (CAGR) of each metric, to illustrate the impact of our transformation. 6 ’15 ’16 ’17 ’18 ’19 2,507 2,054 1,922 1,7281,657 4 Year CAGR: +7%1 ’15 ’16 ’17 ’18 ’19 304 351 354 398 405 4 Year CAGR: +7% ’15 ’16 ’17 ’18 ’19 2,507 ’20 2,607 ’21 2,909 2,055 1,922 1,7281,657 2 Year CAGR +8% ’15 ’16 ’17 ’18 ’19 28 ’20 31 ’21 40 323131 29 ’15 ’16 ’17 ’18 ’19 405 ’20 487 ’21 629 398 354351 304 2 Year CAGR +25% 2 Year CAGR +20% ’15 ’16 ’17 ’17 ’18 ’19 301 ’20 353 ’21 458 291 249243 221 1,905.2 ’19 2,492.0 ’21 2,908.7 ’17 439.2 ’19 492.3 ’21 771.1 2 Year CAGR +23% ’15 ’16 ’17 ’18 ’19 0.68 ’20 0.79 ’21 1.03 0.66 0.560.54 0.50 ’15 ’16 ’17 ’18 ’19 304 ’20 451 ’21 787 309 383 223 186 2 Year CAGR +61% 2 Year CAGR +23% ’15 ’16 ’17 ’18 ’19 221 243 249 291 301 4 Year CAGR: +8% ’15 ’16 ’17 ’18 ’19 180 260 292 309 304 4 Year CAGR: +14% ’15 ’16 ’17 ’18 ’19 2,507 2,054 1,922 1,7281,657 4 Year CAGR: +7%1 ’15 ’16 ’17 ’18 ’19 304 351 354 398 405 4 Year CAGR: +7% ’15 ’16 ’17 ’18 ’19 2,507 ’20 2,607 ’21 2,909 2,055 1,922 1,7281,657 2 Year CAGR +8% ’15 ’16 ’17 ’18 ’19 28 ’20 31 ’21 40 323131 29 ’15 ’16 ’17 ’18 ’19 405 ’20 487 ’21 629 398 354351 304 2 Year CAGR +25% 2 Year CAGR +20% ’15 ’16 ’17 ’17 ’18 ’19 301 ’20 353 ’21 458 291 249243 221 1,905.2 ’19 2,492.0 ’21 2,908.7 ’17 439.2 ’19 492.3 ’21 771.1 2 Year CAGR +23% ’15 ’16 ’17 ’18 ’19 0.68 ’20 0.79 ’21 1.03 0.66 0.560.54 0.50 ’15 ’16 ’17 ’18 ’19 304 ’20 451 ’21 787 309 383 223 186 2 Year CAGR +61% 2 Year CAGR +23% ’15 ’16 ’17 ’18 ’19 221 243 249 291 301 4 Year CAGR: +8% ’15 ’16 ’17 ’18 ’19 180 260 292 309 304 4 Year CAGR: +14% Adjusted EBIT Dollars in millions ’15 ’16 ’17 ’18 ’19 2,507 2,054 1,922 1,7281,657 4 Year CAGR: +7%1 ’15 ’16 ’17 ’18 ’19 304 351 354 398 405 4 Year CAGR: +7% ’15 ’16 ’17 ’18 ’19 2,507 ’20 2,607 ’21 2,909 2,055 1,922 1,7281,657 2 Year CAGR +8% ’15 ’16 ’17 ’18 ’19 28 ’20 31 ’21 40 323131 29 ’15 ’16 ’17 ’18 ’19 405 ’20 487 ’21 629 398 354351 304 2 Year CAGR +25% 2 Year CAGR 20% ’15 ’16 ’17 ’17 ’18 ’19 301 ’20 353 ’21 458 291 249243 221 1,905.2 ’19 2,492.0 ’21 2,908.7 ’17 439.2 ’19 492.3 ’21 771.1 2 Year CAGR +23% ’15 ’16 ’17 ’18 ’19 0.68 ’20 0.79 ’21 1.03 0.66 0.560.54 0.50 ’15 ’16 ’17 ’18 ’19 304 ’20 451 ’21 787 309 383 223 186 2 Year CAGR +61% 2 Year CAGR +23% ’15 ’16 ’17 ’18 ’19 221 243 249 291 301 4 Year CAGR: +8% ’15 ’16 ’17 ’18 ’19 180 260 292 309 304 4 Year CAGR: +14% Adjusted Diluted EPS Dollars/share ’15 ’16 ’17 ’18 ’19 2,507 2,054 1,922 1,7281,657 4 Year CAGR: +7%1 ’15 ’16 ’17 ’18 ’19 304 351 354 398 405 4 Year CAGR: +7% ’15 ’16 ’17 ’18 ’19 2,507 ’20 2,607 ’21 2,909 2,055 1,922 1,7281,657 2 Year CAGR +8% ’15 ’16 ’17 ’18 ’19 28 ’20 31 ’21 40 323131 29 ’15 ’16 ’17 ’18 ’19 405 ’20 487 ’21 629 398 354351 304 2 Year CAGR +25% 2 Year CAGR +20% ’15 ’16 ’17 ’17 ’18 ’19 301 ’20 353 ’21 458 291 249243 221 1,905.2 ’19 2,492.0 ’21 2,908.7 ’17 439.2 ’19 492.3 ’21 771.1 2 Year CAGR +23% ’15 ’16 ’17 ’18 ’19 0.68 ’20 0.79 ’21 1.03 0.66 0.560.54 0.50 ’15 ’16 ’17 ’18 ’19 304 ’20 451 ’21 787 309 383 223 186 2 Year CAGR +61% 2 Year CAGR +23% ’15 ’16 ’17 ’18 ’19 221 243 249 291 301 4 Year CAGR: +8% ’15 ’16 ’17 ’18 ’19 180 260 292 309 304 4 Year CAGR: +14% ’15 ’16 ’17 ’18 ’19 2,507 2,054 1,922 1,7281,657 4 Year CAGR: +7%1 ’15 ’16 ’17 ’18 ’19 304 351 354 398 405 4 Year CAGR: +7% ’15 ’16 ’17 ’18 ’19 2,507 ’20 2,607 ’21 2,909 2,055 1,922 1,7281,657 2 Year CAGR +8% ’15 ’16 ’17 ’18 ’19 28 ’20 31 ’21 40 323131 29 ’15 ’16 ’17 ’18 ’19 405 ’20 487 ’21 629 398 354351 304 2 Year CAGR +25% 2 Year CAGR +20% ’15 ’16 ’17 ’17 ’18 ’19 301 ’20 353 ’21 458 291 249243 221 1,905.2 ’19 2,492.0 ’21 2,908.7 ’17 439.2 ’19 492.3 ’21 771.1 2 Year CAGR +23% ’15 ’16 ’17 ’18 ’19 0.68 ’20 0.79 ’21 1.03 0.66 0.560.54 0.50 ’15 ’16 ’17 ’18 ’19 304 ’20 451 ’21 787 309 383 223 186 2 Year CAGR +61% 2 Year CAGR +23% ’15 ’16 ’17 ’18 ’19 221 243 249 291 301 4 Year CAGR: +8% ’15 ’16 ’17 ’18 ’19 180 260 292 309 304 4 Year CAGR: +14% Net Sales Dollars in millions Adjusted Net Income Dollars in millions Operating Cash Flow Dollars in millions ’15 ’16 ’17 ’18 ’19 2,507 2,054 1,922 1,7281,657 4 Year CAGR: +7%1 ’15 ’16 ’17 ’18 ’19 304 351 354 398 405 4 Year CAGR: +7% ’15 ’16 ’17 ’18 ’19 2,507 ’20 2,607 ’21 2,909 2,055 1,922 1,7281,657 2 Year CAGR 8% ’15 ’16 ’17 ’18 ’19 28 ’20 31 ’21 40 323131 29 ’15 ’16 ’17 ’18 ’19 405 ’20 487 ’21 629 398 354351 304 2 Year CAGR +25% 2 Year CAGR +20% ’15 ’16 ’17 ’17 ’18 ’19 301 ’20 353 ’21 458 291 249243 221 1,905.2 ’19 2,492.0 ’21 2,908.7 ’17 439.2 ’19 492.3 ’21 771.1 2 Year CAGR +23% ’15 ’16 ’17 ’18 ’19 0.68 ’20 0.79 ’21 1.03 0.66 0.560.54 0.50 ’15 ’16 ’17 ’18 ’19 304 ’20 451 ’21 787 309 383 223 186 2 Year CAGR +61% 2 Year CAGR +23% ’15 ’16 ’17 ’18 ’19 221 243 249 291 301 4 Year CAGR: +8% ’15 ’16 ’17 ’18 ’19 180 260 292 309 304 4 Year CAGR: +14% Adjusted ROCE %
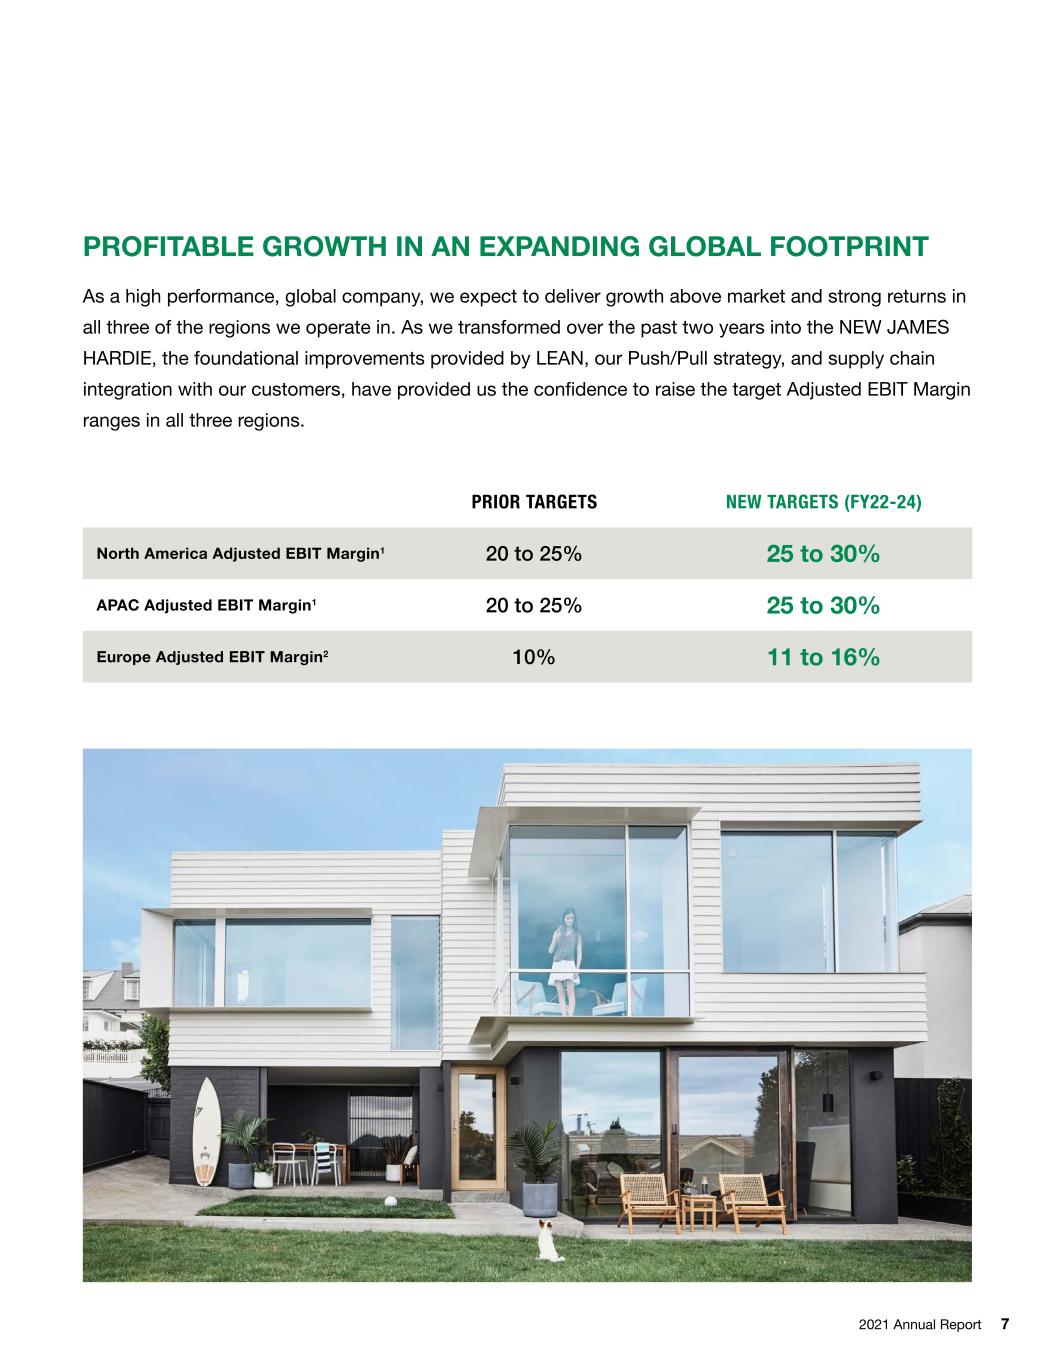
2021 Annual Report 7 PROFITABLE GROWTH IN AN EXPANDING GLOBAL FOOTPRINT As a high performance, global company, we expect to deliver growth above market and strong returns in all three of the regions we operate in. As we transformed over the past two years into the NEW JAMES HARDIE, the foundational improvements provided by LEAN, our Push/Pull strategy, and supply chain integration with our customers, have provided us the confidence to raise the target Adjusted EBIT Margin ranges in all three regions. PRIOR TARGETS NEW TARGETS (FY22-24) North America Adjusted EBIT Margin1 20 to 25% 25 to 30% APAC Adjusted EBIT Margin1 20 to 25% 25 to 30% Europe Adjusted EBIT Margin2 10% 11 to 16%
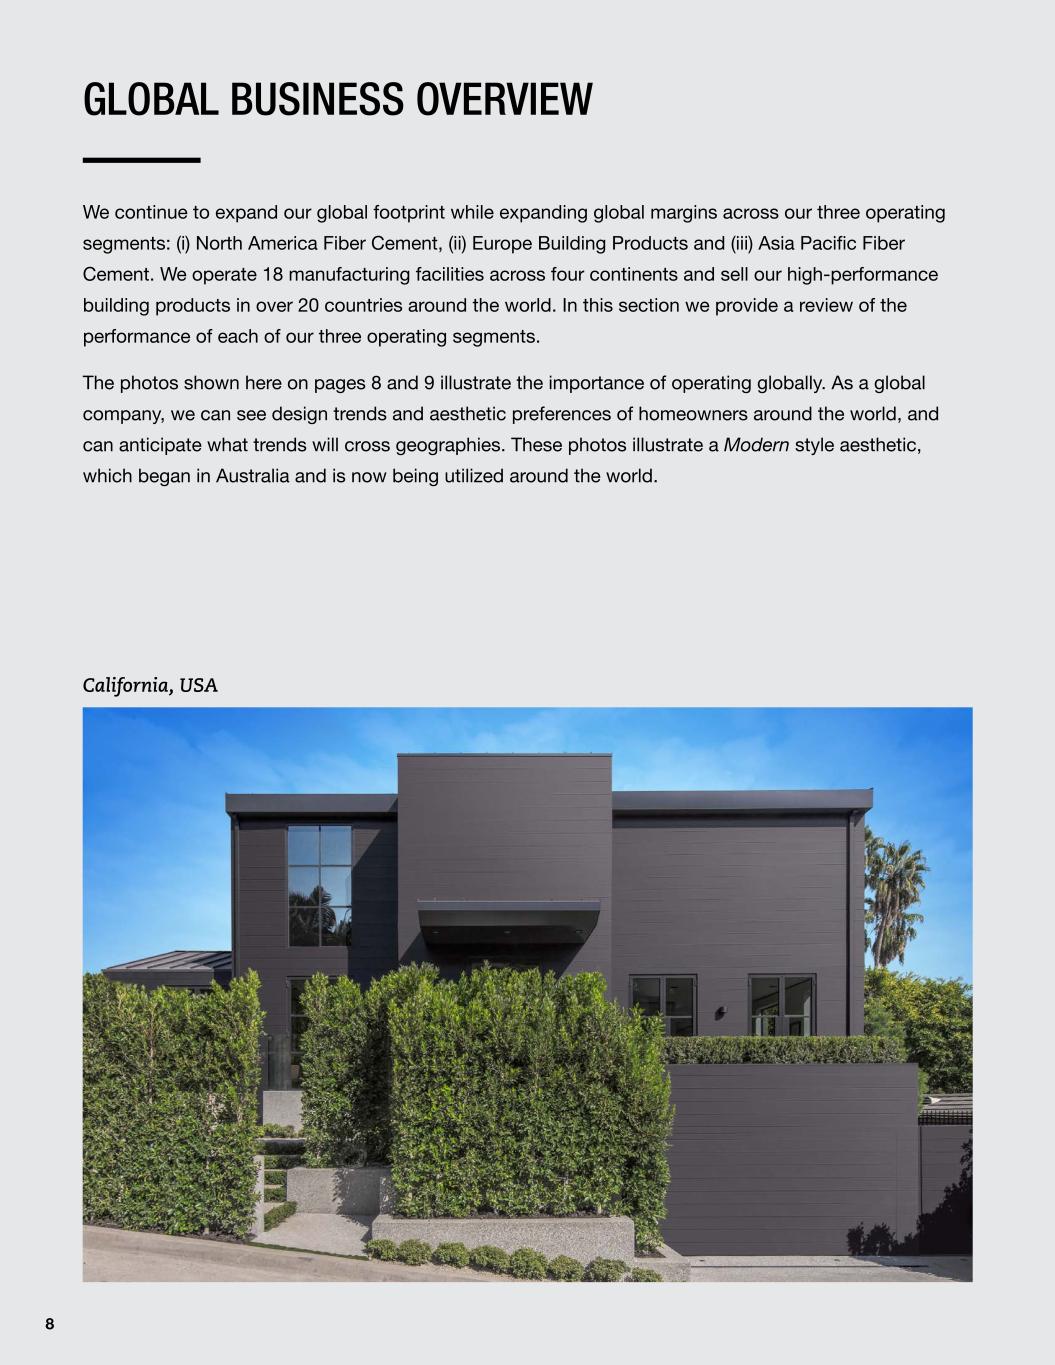
GLOBAL BUSINESS OVERVIEW We continue to expand our global footprint while expanding global margins across our three operating segments: (i) North America Fiber Cement, (ii) Europe Building Products and (iii) Asia Pacific Fiber Cement. We operate 18 manufacturing facilities across four continents and sell our high-performance building products in over 20 countries around the world. In this section we provide a review of the performance of each of our three operating segments. The photos shown here on pages 8 and 9 illustrate the importance of operating globally. As a global company, we can see design trends and aesthetic preferences of homeowners around the world, and can anticipate what trends will cross geographies. These photos illustrate a Modern style aesthetic, which began in Australia and is now being utilized around the world. California, USA 8
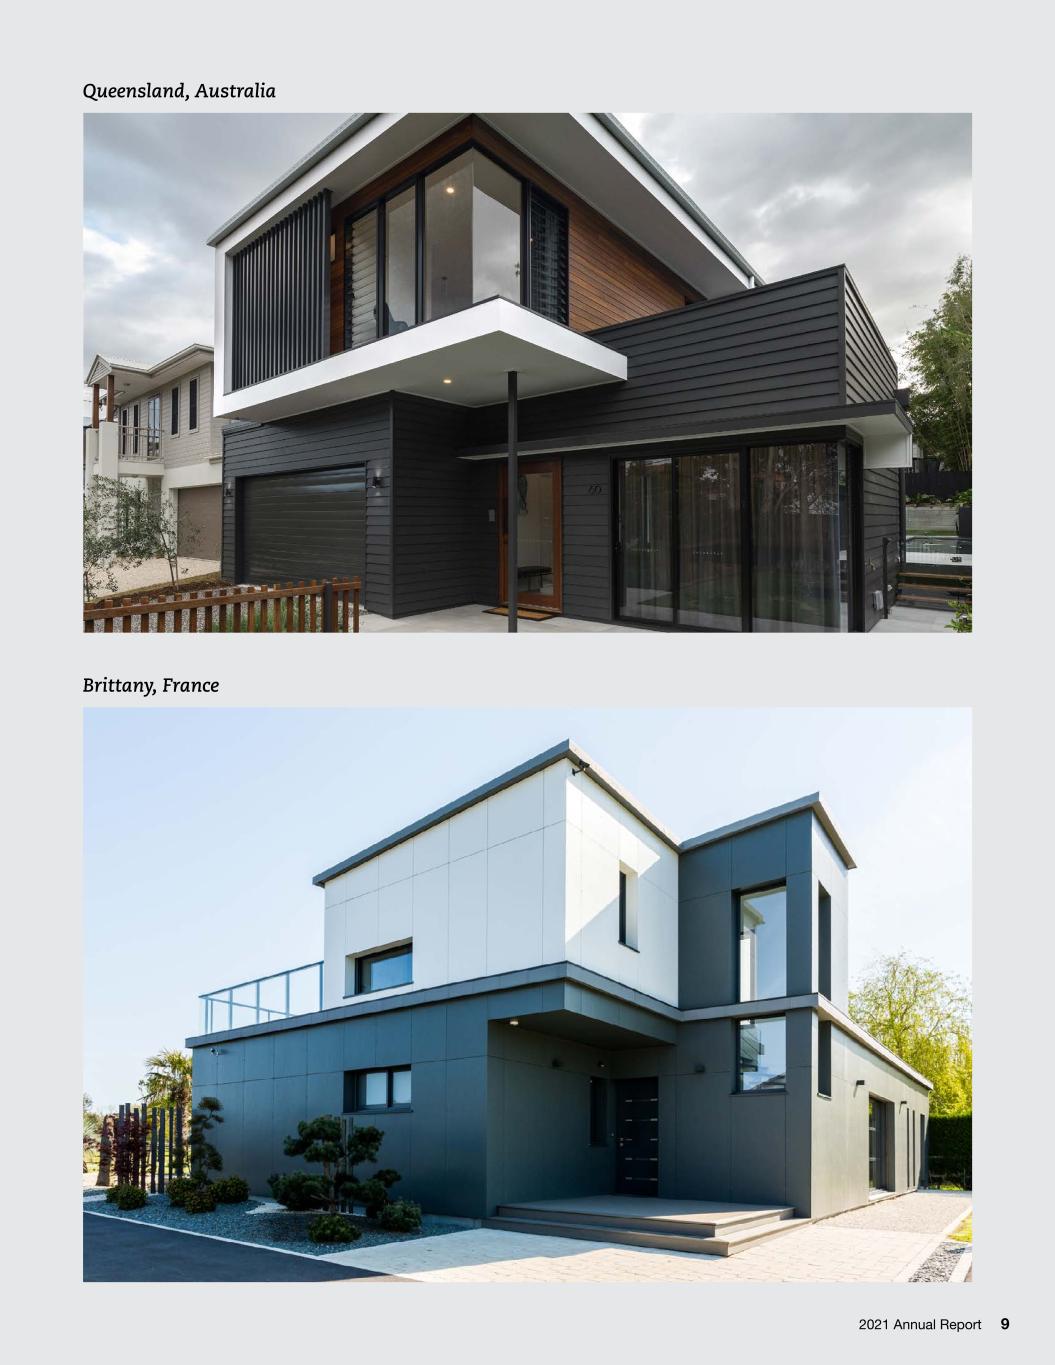
Queensland, Australia Brittany, France 2021 Annual Report 9

“ We continue to partner closely with our customers to enable profitable growth for them and for us. In fiscal year 2021 we drove significant market share gains by being closely integrated with our customers.” “ The implementation of Hardie Manufacturing Operating System based on LEAN has enabled us to deliver premium quality products and service to our local customers in Texas and nearby states, at a lower and more predictable cost.” John Madson Director of National Strategic Accounts – North America Asif Mohammed Plant Manager – Cleburne, Texas 10
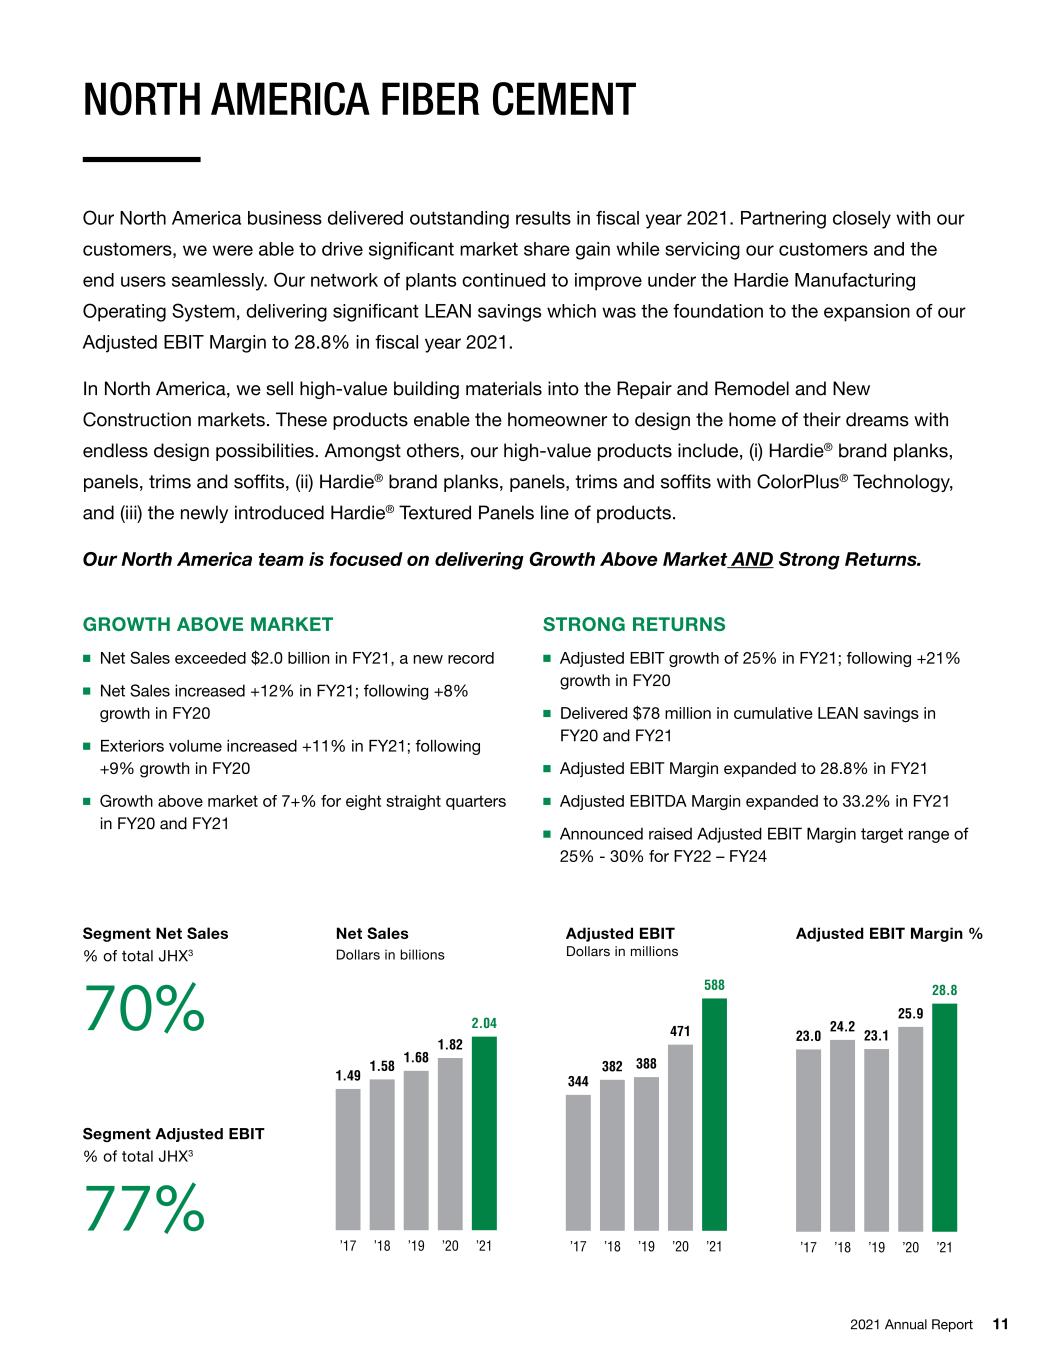
2021 Annual Report 11 NORTH AMERICA FIBER CEMENT Our North America business delivered outstanding results in fiscal year 2021. Partnering closely with our customers, we were able to drive significant market share gain while servicing our customers and the end users seamlessly. Our network of plants continued to improve under the Hardie Manufacturing Operating System, delivering significant LEAN savings which was the foundation to the expansion of our Adjusted EBIT Margin to 28.8% in fiscal year 2021. In North America, we sell high-value building materials into the Repair and Remodel and New Construction markets. These products enable the homeowner to design the home of their dreams with endless design possibilities. Amongst others, our high-value products include, (i) Hardie® brand planks, panels, trims and soffits, (ii) Hardie® brand planks, panels, trims and soffits with ColorPlus® Technology, and (iii) the newly introduced Hardie® Textured Panels line of products. Our North America team is focused on delivering Growth Above Market AND Strong Returns. GROWTH ABOVE MARKET ■ Net Sales exceeded $2.0 billion in FY21, a new record ■ Net Sales increased +12% in FY21; following +8% growth in FY20 ■ Exteriors volume increased +11% in FY21; following +9% growth in FY20 ■ Growth above market of 7+% for eight straight quarters in FY20 and FY21 Segment Net Sales % of total JHX3 70% Net Sales Dollars in billions Adjusted EBIT Dollars in millions Adjusted EBIT Margin % Segment Adjusted EBIT % of total JHX3 77% STRONG RETURNS ■ Adjusted EBIT growth of 25% in FY21; following +21% growth in FY20 ■ Delivered $78 million in cumulative LEAN savings in FY20 and FY21 ■ Adjusted EBIT Margin expanded to 28.8% in FY21 ■ Adjusted EBITDA Margin expanded to 33.2% in FY21 ■ Announced raised Adjusted EBIT Margin target range of 25% - 30% for FY22 – FY24 Net Sales EBIT 0.0 0.5 1.0 1.5 2.0 2.5 0 100 200 300 400 500 600 EBIT Margin 0 5 10 15 20 25 30 ’17 ’18 ’19 ’20 ’21 2.04 1.82 1.68 1.58 1.49 ’17 ’18 ’19 ’20 ’21 344 382 388 471 588 ’17 ’18 ’19 ’20 ’21 23.0 24.2 23.1 25.9 28.8 Net Sales EBIT 0.0 0.5 1.0 1.5 2.0 2.5 0 100 200 300 400 500 600 EBIT Margin 0 5 10 15 20 25 30 ’17 ’18 ’19 ’20 ’21 2.04 1.82 1.68 1.58 1.49 ’17 ’18 ’19 ’20 ’21 344 382 388 471 588 ’17 ’18 ’19 ’20 ’21 23.0 24.2 23.1 25.9 28.8 Net Sales EBIT 0.0 0.5 1.0 1.5 2.0 2.5 0 100 200 300 400 500 600 EBIT Margin 0 5 10 15 20 25 30 ’17 ’18 ’19 ’20 ’21 2.04 1.82 1.68 1.58 1.49 ’17 ’1 ’19 ’20 ’21 344 382 388 471 588 ’17 ’18 ’19 ’20 ’21 23.0 24.2 23.1 25.9 28.8

12 “ Talent acquisition and talent management are foundational to our HR initiatives in Europe. We have built a team that can think globally while executing locally, as we are now fully embedded into the James Hardie global team.” “ We exit fiscal year 2021 with significant momentum, having delivered record Net Sales of 105 million Euros and record Adjusted EBIT Margin of 15% in the fourth quarter.” Annette Brüseke Director of Human Resources – Europe Jörg Brinkmann General Manager – Europe
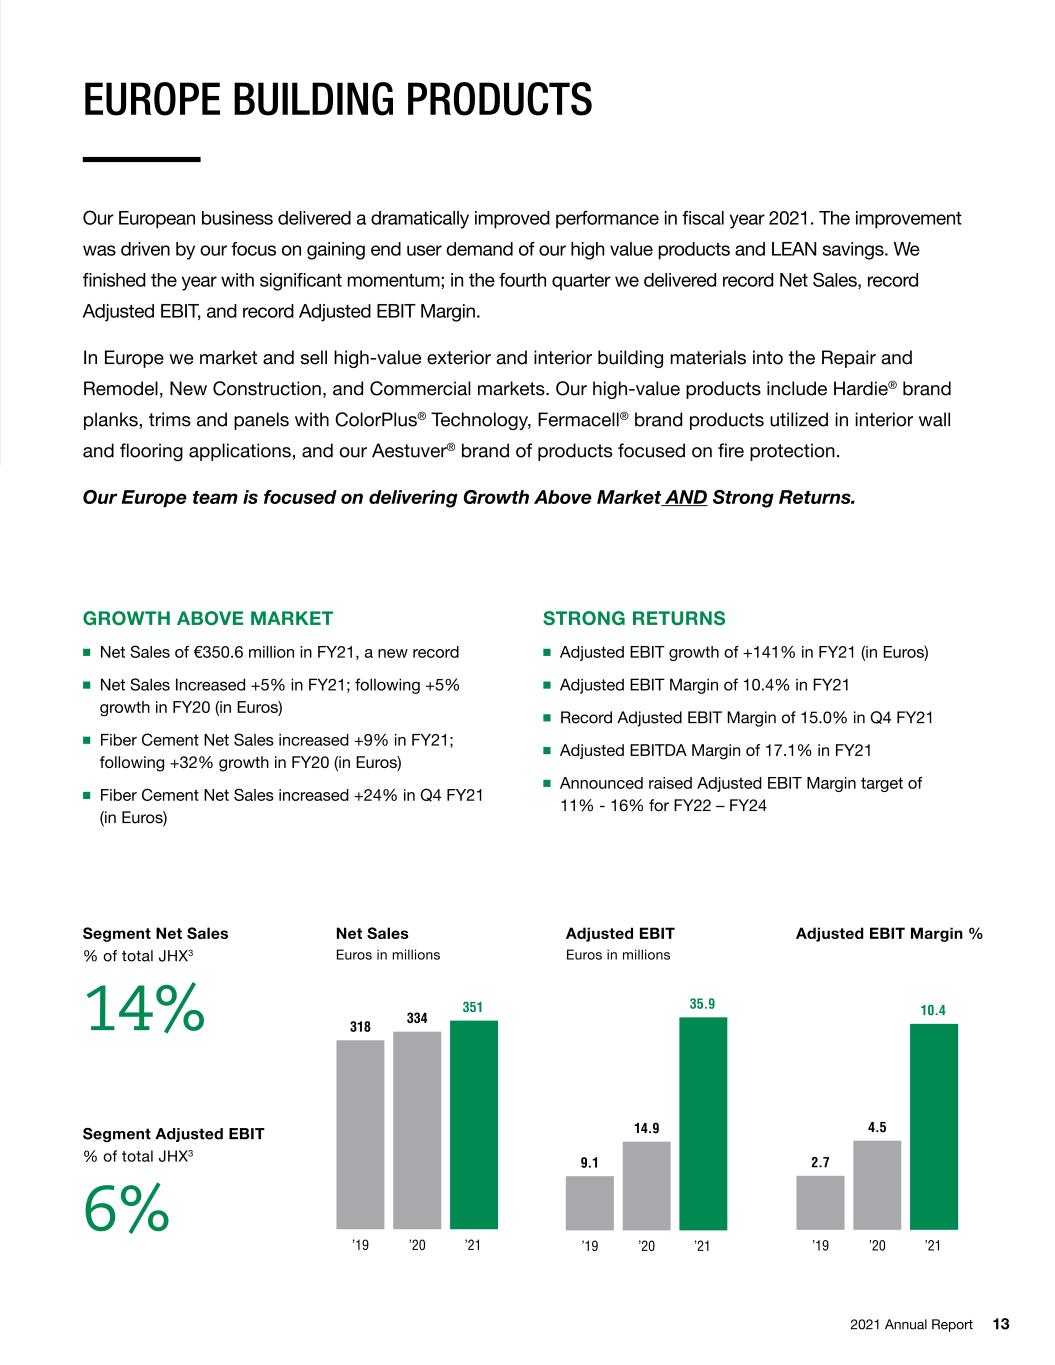
2021 Annual Report 13 EUROPE BUILDING PRODUCTS Our European business delivered a dramatically improved performance in fiscal year 2021. The improvement was driven by our focus on gaining end user demand of our high value products and LEAN savings. We finished the year with significant momentum; in the fourth quarter we delivered record Net Sales, record Adjusted EBIT, and record Adjusted EBIT Margin. In Europe we market and sell high-value exterior and interior building materials into the Repair and Remodel, New Construction, and Commercial markets. Our high-value products include Hardie® brand planks, trims and panels with ColorPlus® Technology, Fermacell® brand products utilized in interior wall and flooring applications, and our Aestuver® brand of products focused on fire protection. Our Europe team is focused on delivering Growth Above Market AND Strong Returns. GROWTH ABOVE MARKET ■ Net Sales of €350.6 million in FY21, a new record ■ Net Sales Increased +5% in FY21; following +5% growth in FY20 (in Euros) ■ Fiber Cement Net Sales increased +9% in FY21; following +32% growth in FY20 (in Euros) ■ Fiber Cement Net Sales increased +24% in Q4 FY21 (in Euros) Segment Net Sales % of total JHX3 14% Net Sales Euros in millions Adjusted EBIT Euros in millions STRONG RETURNS ■ Adjusted EBIT growth of +141% in FY21 (in Euros) ■ Adjusted EBIT Margin of 10.4% in FY21 ■ Record Adjusted EBIT Margin of 15.0% in Q4 FY21 ■ Adjusted EBITDA Margin of 17.1% in FY21 ■ Announced raised Adjusted EBIT Margin target of 11% - 16% for FY22 – FY24 Adjusted EBIT Margin % Segment Adjusted EBIT % of total JHX3 6% Net Sales EBIT 0 50 100 150 200 250 300 350 400 0 5 10 15 20 25 30 35 40 EBIT Margin 0 2 4 6 8 10 12 ’19 ’20 ’21 351 334 318 ’19 ’20 ’21 35.9 14.9 9.1 ’19 ’20 ’21 10.4 4.5 2.7 Net Sales EBIT 0 50 100 150 200 250 300 350 400 0 5 10 15 20 25 30 35 40 EBIT Margin 0 2 4 6 8 10 12 ’19 ’20 ’21 351 334 318 ’19 ’20 ’21 35.9 14.9 9.1 ’19 ’20 ’21 10.4 4.5 2.7 Net Sales EBIT 0 50 100 150 200 250 300 350 400 0 5 10 15 20 25 30 35 40 EBIT Margin 0 2 4 6 8 10 12 ’19 ’20 ’21 351 334 318 ’19 ’20 ’21 35.9 14.9 9.1 ’19 ’20 ’21 10.4 4.5 2.7

14 “ In the Philippines we continued to implement best practices from other regions to ensure we successfully execute our key strategic initiatives, such as push/pull and customer supply chain integration.” “ Our Australia and New Zealand regions expanded their Adjusted EBIT Margins as we consolidated our manufacturing operations to our Rosehill and Carole Park plants, and drove market share gain by partnering more closely with our customers.” Liza Alde Marketing Manager – Philippines John Arneil Country Manager – Australia and New Zealand
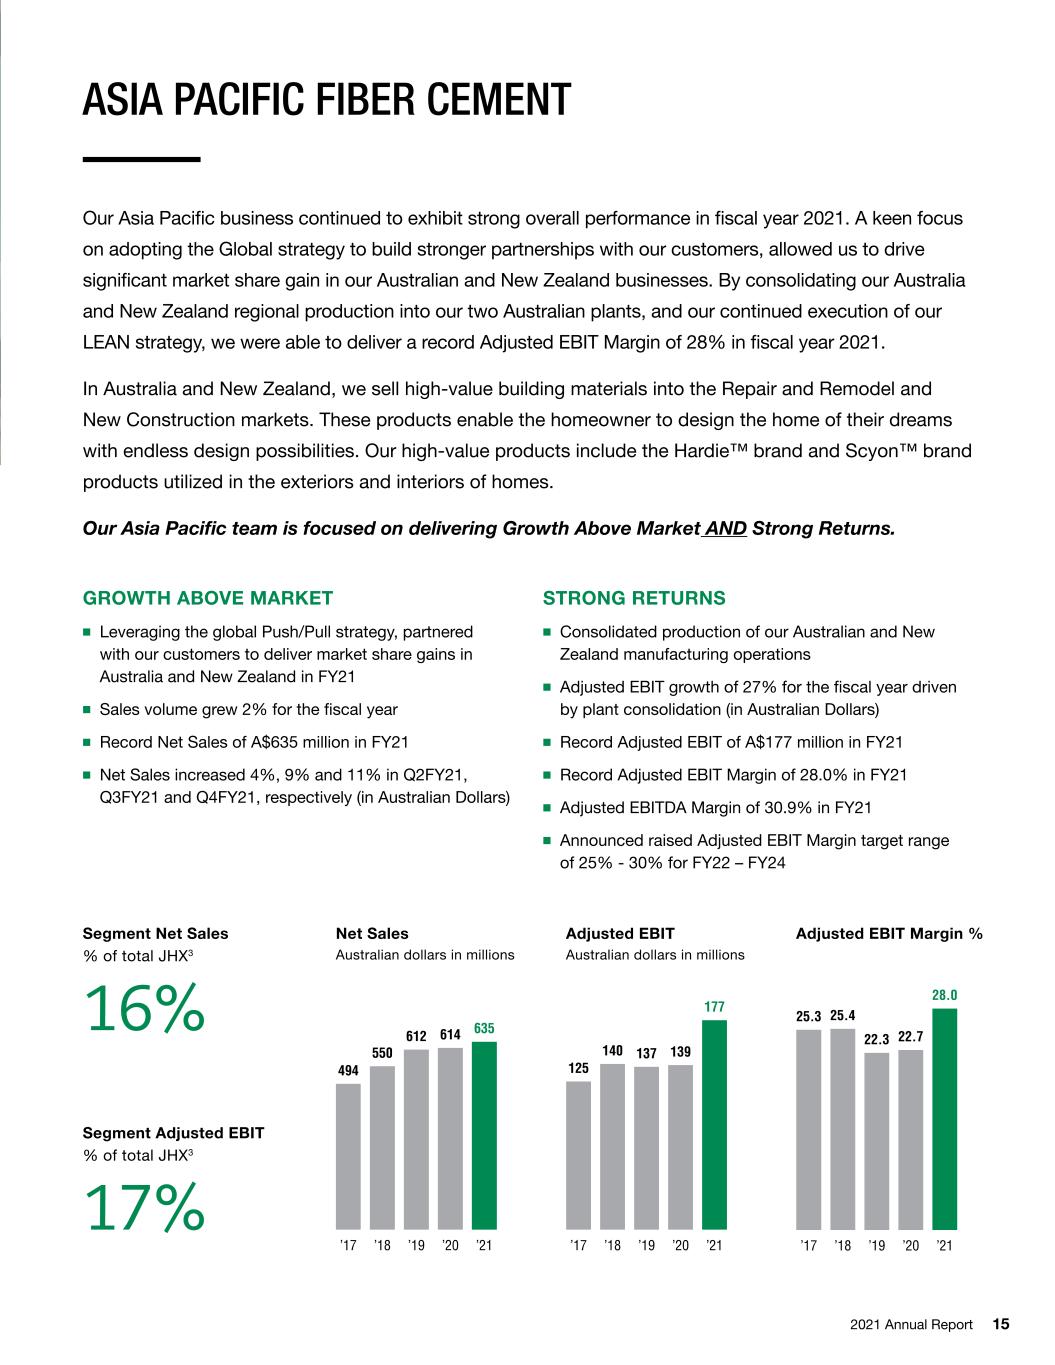
2021 Annual Report 15 ASIA PACIFIC FIBER CEMENT Our Asia Pacific business continued to exhibit strong overall performance in fiscal year 2021. A keen focus on adopting the Global strategy to build stronger partnerships with our customers, allowed us to drive significant market share gain in our Australian and New Zealand businesses. By consolidating our Australia and New Zealand regional production into our two Australian plants, and our continued execution of our LEAN strategy, we were able to deliver a record Adjusted EBIT Margin of 28% in fiscal year 2021. In Australia and New Zealand, we sell high-value building materials into the Repair and Remodel and New Construction markets. These products enable the homeowner to design the home of their dreams with endless design possibilities. Our high-value products include the Hardie™ brand and Scyon™ brand products utilized in the exteriors and interiors of homes. Our Asia Pacific team is focused on delivering Growth Above Market AND Strong Returns. GROWTH ABOVE MARKET ■ Leveraging the global Push/Pull strategy, partnered with our customers to deliver market share gains in Australia and New Zealand in FY21 ■ Sales volume grew 2% for the fiscal year ■ Record Net Sales of A$635 million in FY21 ■ Net Sales increased 4%, 9% and 11% in Q2FY21, Q3FY21 and Q4FY21, respectively (in Australian Dollars) Segment Net Sales % of total JHX3 16% Net Sales Australian dollars in millions Adjusted EBIT Australian dollars in millions STRONG RETURNS ■ Consolidated production of our Australian and New Zealand manufacturing operations ■ Adjusted EBIT growth of 27% for the fiscal year driven by plant consolidation (in Australian Dollars) ■ Record Adjusted EBIT of A$177 million in FY21 ■ Record Adjusted EBIT Margin of 28.0% in FY21 ■ Adjusted EBITDA Margin of 30.9% in FY21 ■ Announced raised Adjusted EBIT Margin target range of 25% - 30% for FY22 – FY24 Adjusted EBIT Margin % Segment Adjusted EBIT % of total JHX3 17% Net Sales EBIT 0 100 200 300 400 500 600 700 800 0 50 100 150 200 EBIT Margin 0 5 10 15 20 25 30 ’17 ’18 ’19 ’20 ’21 635614612 550 494 ’17 ’18 ’19 ’20 ’21 125 140 137 139 177 ’17 ’18 ’19 ’20 ’21 25.3 25.4 22.3 22.7 28.0 Net Sales EBIT 0 100 200 300 400 500 600 700 800 0 50 100 150 200 EBIT Margin 0 5 10 15 20 25 30 ’17 ’18 ’19 ’20 ’21 635614612 550 494 ’17 ’18 ’19 ’20 ’21 125 140 137 139 177 ’17 ’18 ’19 ’20 ’21 25.3 25.4 22.3 22.7 28.0 Net Sales EBIT 0 100 200 300 400 500 600 700 800 0 50 100 150 200 EBIT Margin 0 5 10 15 20 25 30 ’17 ’18 ’19 ’20 ’21 635614612 550 494 ’17 ’18 ’19 ’20 ’21 125 140 137 139 177 ’17 ’18 ’19 ’20 ’21 25.3 25.4 22.3 22.7 28.0

GLOBAL CONSUMER BRANDING MARKETING DIRECTLY TO HOMEOWNERS 16

2021 Annual Report 17

What if your home never stopped inspiring you? Bring your vision to life with exterior solutions by James Hardie. James Hardie Sponsored ... JAMESHARDIE.COM Home is what you make of it. Let’s design yours together. DOWNLOAD “ The It’s Possible™ campaign seeks to empower homeowners to realize their dream home. This marks our brand extension into a consumer-focused brand that inspires homeowners to achieve their dream exterior with endless design possibilities.” “ Our category-defining building solutions deliver lasting beauty and trusted protection. We are excited to communicate this message through an extraordinary campaign that brings our brand to the forefront of homeowners’ minds like never before.” Cathleya Buchanan Head of Marketing – APAC Marc Setty Head of Marketing – North America 18
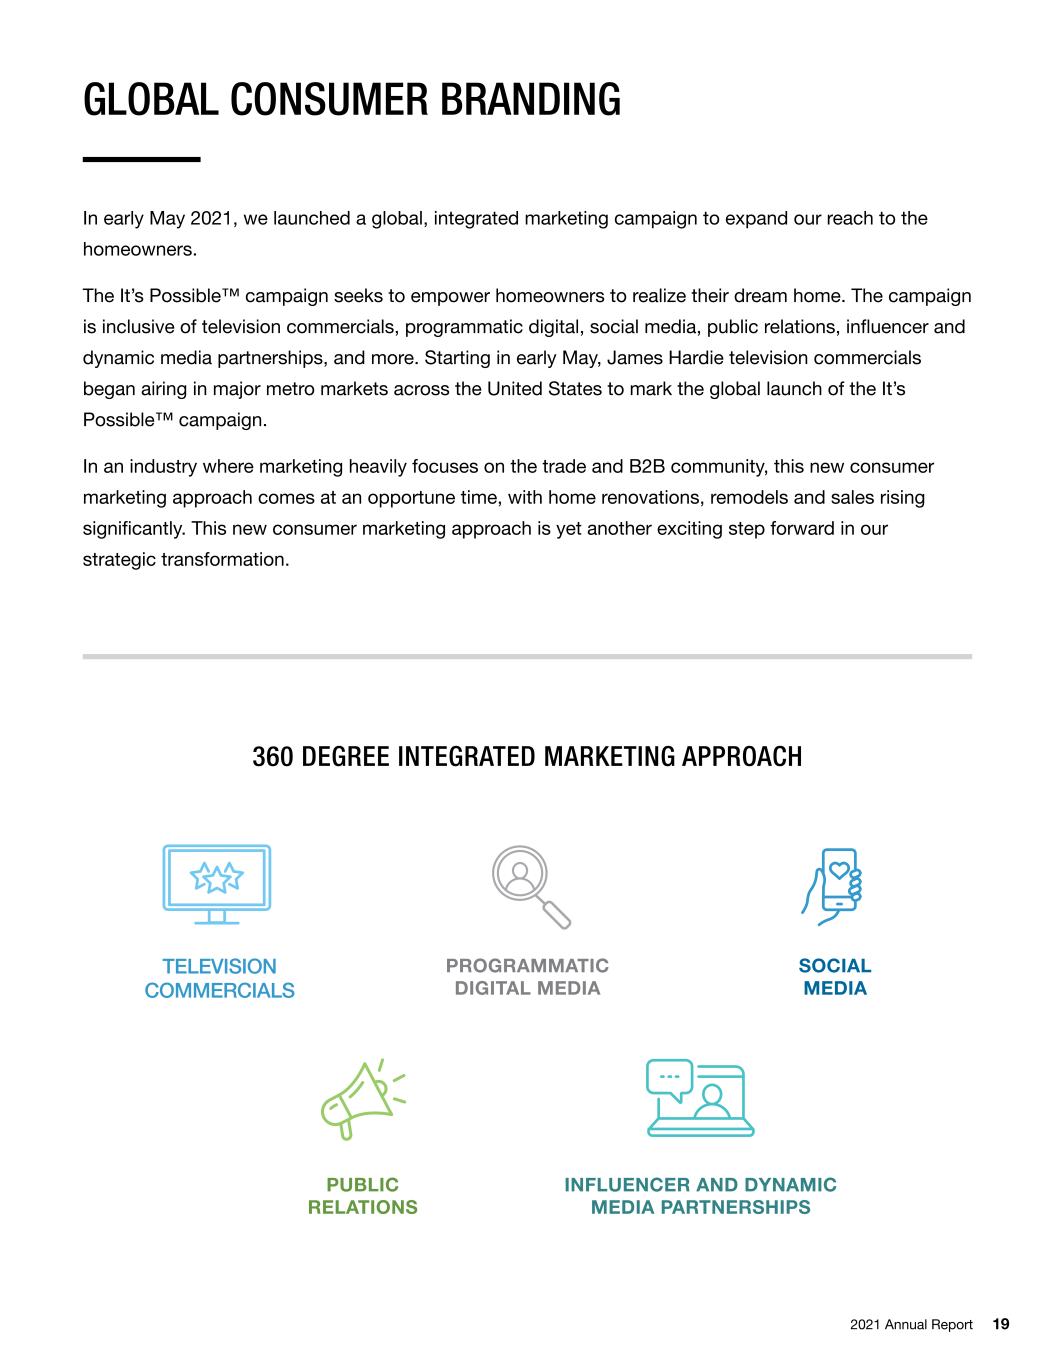
GLOBAL CONSUMER BRANDING In early May 2021, we launched a global, integrated marketing campaign to expand our reach to the homeowners. The It’s Possible™ campaign seeks to empower homeowners to realize their dream home. The campaign is inclusive of television commercials, programmatic digital, social media, public relations, influencer and dynamic media partnerships, and more. Starting in early May, James Hardie television commercials began airing in major metro markets across the United States to mark the global launch of the It’s Possible™ campaign. In an industry where marketing heavily focuses on the trade and B2B community, this new consumer marketing approach comes at an opportune time, with home renovations, remodels and sales rising significantly. This new consumer marketing approach is yet another exciting step forward in our strategic transformation. 360 DEGREE INTEGRATED MARKETING APPROACH 2021 Annual Report 19 TELEVISION COMMERCIALS PROGRAMMATIC DIGITAL MEDIA SOCIAL MEDIA PUBLIC RELATIONS INFLUENCER AND DYNAMIC MEDIA PARTNERSHIPS
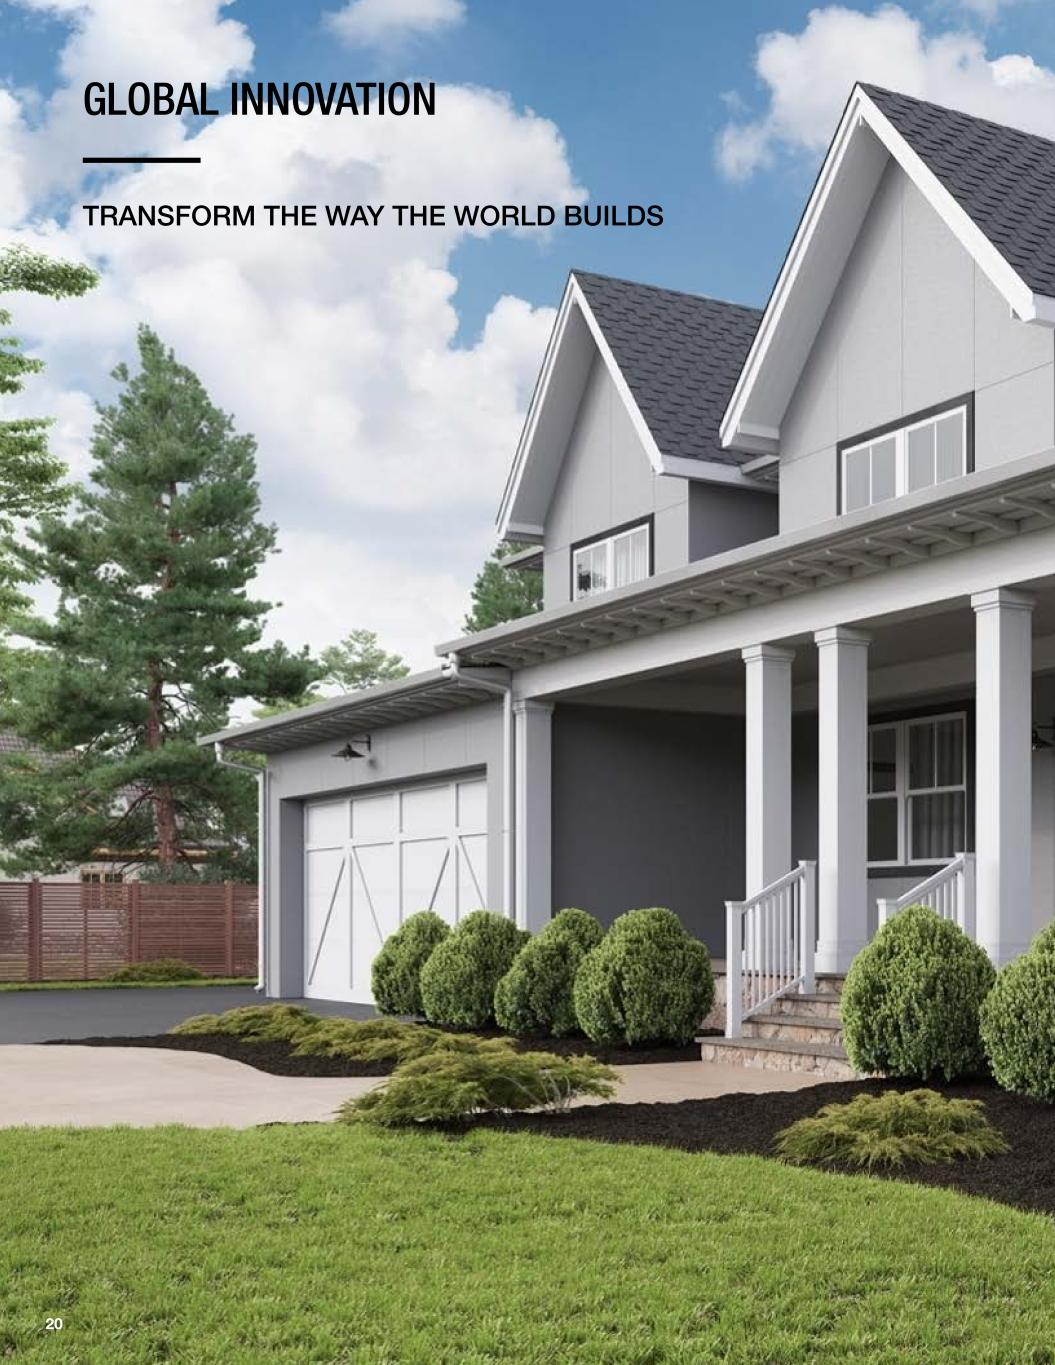
GLOBAL INNOVATION 20 TRANSFORM THE WAY THE WORLD BUILDS
2021 Annual Report 21
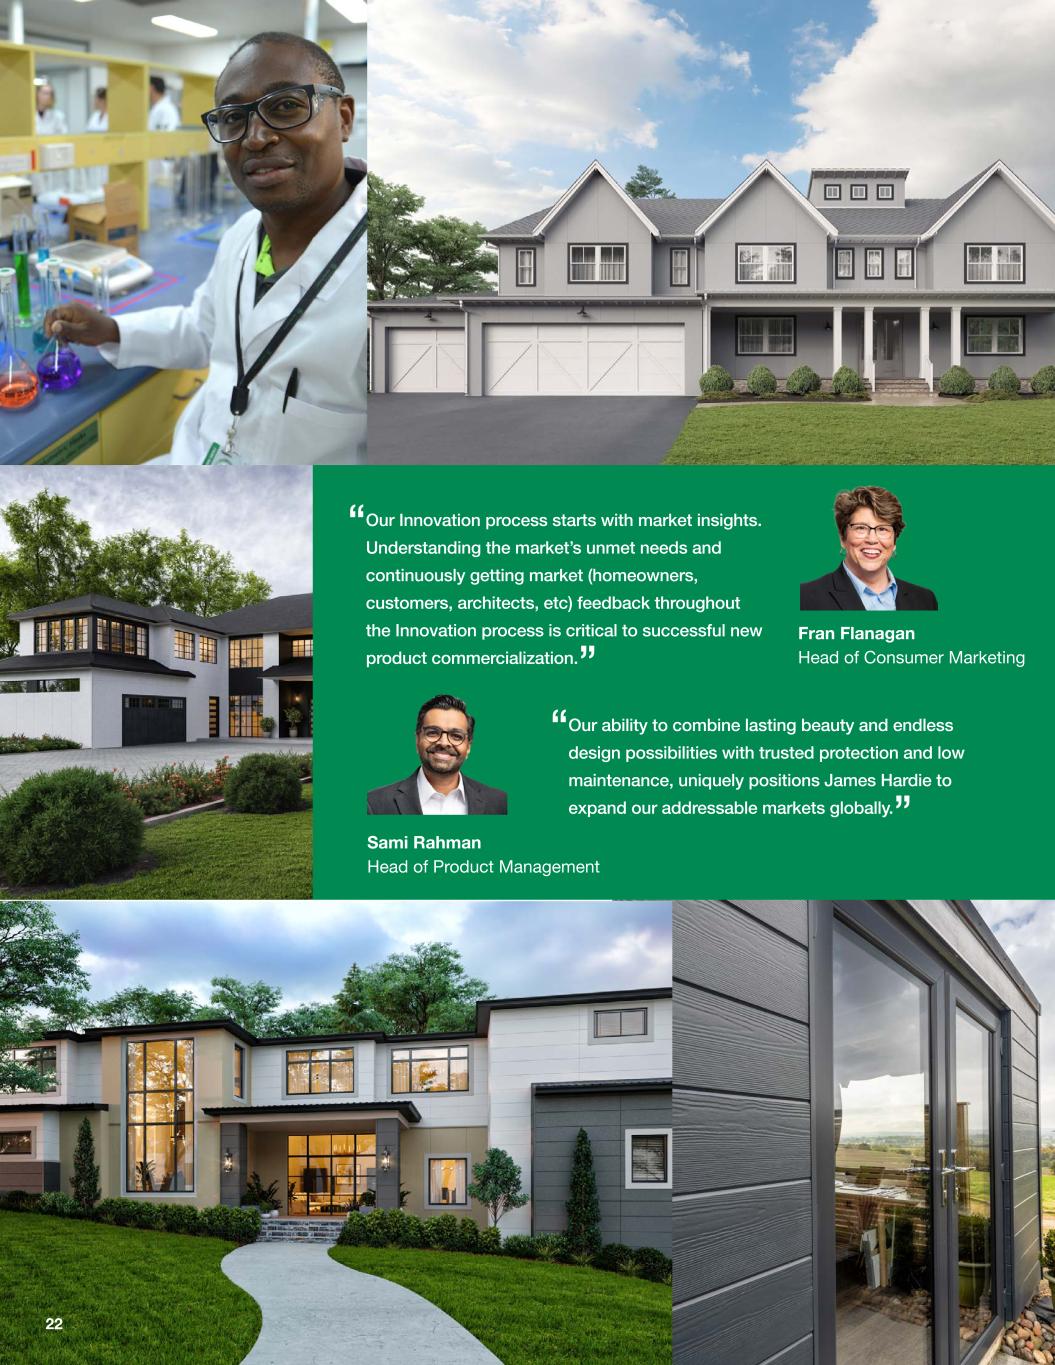
22 “ Our Innovation process starts with market insights. Understanding the market’s unmet needs and continuously getting market (homeowners, customers, architects, etc) feedback throughout the Innovation process is critical to successful new product commercialization.” “ Our ability to combine lasting beauty and endless design possibilities with trusted protection and low maintenance, uniquely positions James Hardie to expand our addressable markets globally.” Fran Flanagan Head of Consumer Marketing Sami Rahman Head of Product Management
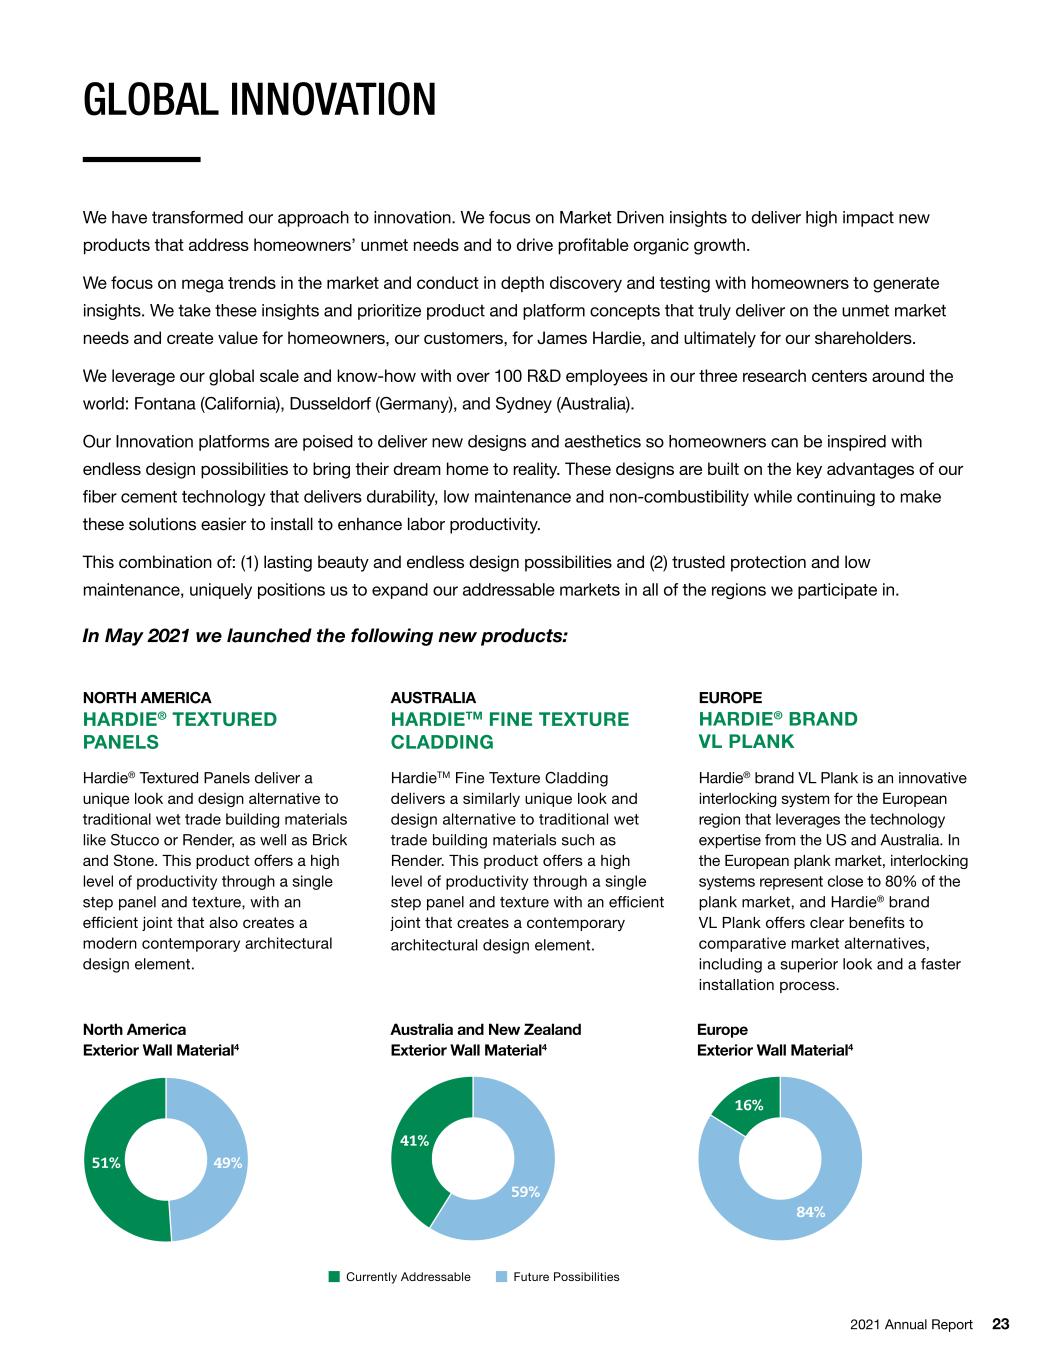
2021 Annual Report 23 GLOBAL INNOVATION We have transformed our approach to innovation. We focus on Market Driven insights to deliver high impact new products that address homeowners’ unmet needs and to drive profitable organic growth. We focus on mega trends in the market and conduct in depth discovery and testing with homeowners to generate insights. We take these insights and prioritize product and platform concepts that truly deliver on the unmet market needs and create value for homeowners, our customers, for James Hardie, and ultimately for our shareholders. We leverage our global scale and know-how with over 100 R&D employees in our three research centers around the world: Fontana (California), Dusseldorf (Germany), and Sydney (Australia). Our Innovation platforms are poised to deliver new designs and aesthetics so homeowners can be inspired with endless design possibilities to bring their dream home to reality. These designs are built on the key advantages of our fiber cement technology that delivers durability, low maintenance and non-combustibility while continuing to make these solutions easier to install to enhance labor productivity. This combination of: (1) lasting beauty and endless design possibilities and (2) trusted protection and low maintenance, uniquely positions us to expand our addressable markets in all of the regions we participate in. In May 2021 we launched the following new products: NORTH AMERICA HARDIE® TEXTURED PANELS AUSTRALIA HARDIETM FINE TEXTURE CLADDING EUROPE HARDIE® BRAND VL PLANK Hardie® Textured Panels deliver a unique look and design alternative to traditional wet trade building materials like Stucco or Render, as well as Brick and Stone. This product offers a high level of productivity through a single step panel and texture, with an efficient joint that also creates a modern contemporary architectural design element. HardieTM Fine Texture Cladding delivers a similarly unique look and design alternative to traditional wet trade building materials such as Render. This product offers a high level of productivity through a single step panel and texture with an efficient joint that creates a contemporary architectural design element. Hardie® brand VL Plank is an innovative interlocking system for the European region that leverages the technology expertise from the US and Australia. In the European plank market, interlocking systems represent close to 80% of the plank market, and Hardie® brand VL Plank offers clear benefits to comparative market alternatives, including a superior look and a faster installation process. 59% 41% 84% 16% 49%51% 59% 41% 84% 16% 49%51% 59% 41% 84% 16% 49%51% Future PossibilitiesCurrently Addressable North America Exterior Wall Material4 Australia and New Zealand Exterior Wall Material4 Europe Exterior Wall Material4
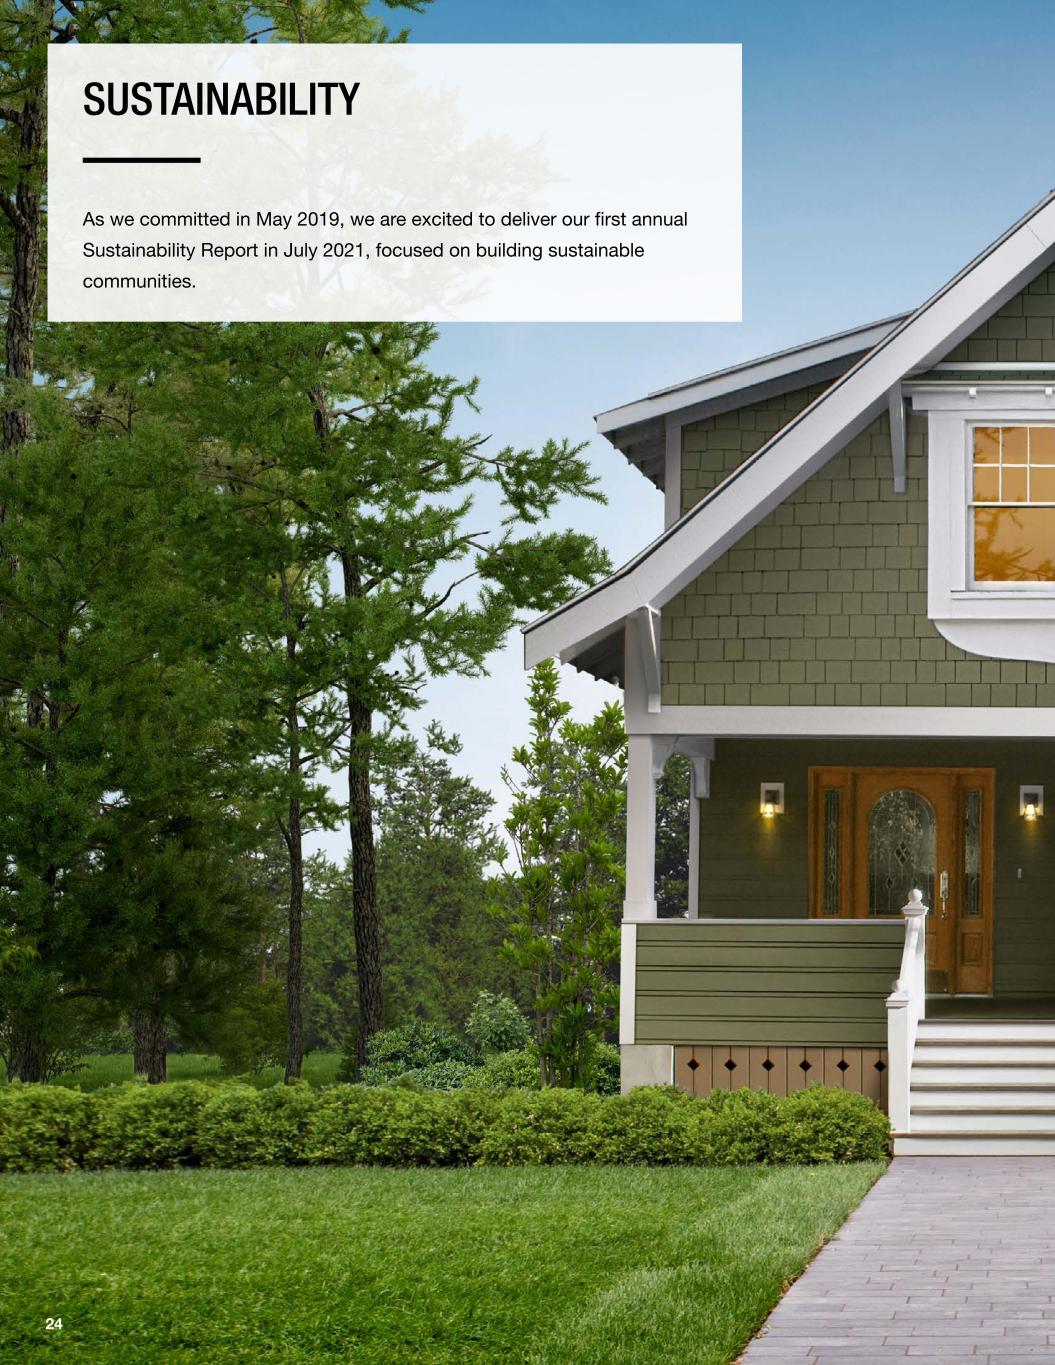
SUSTAINABILITY As we committed in May 2019, we are excited to deliver our first annual Sustainability Report in July 2021, focused on building sustainable communities. 24
2021 Annual Report 25
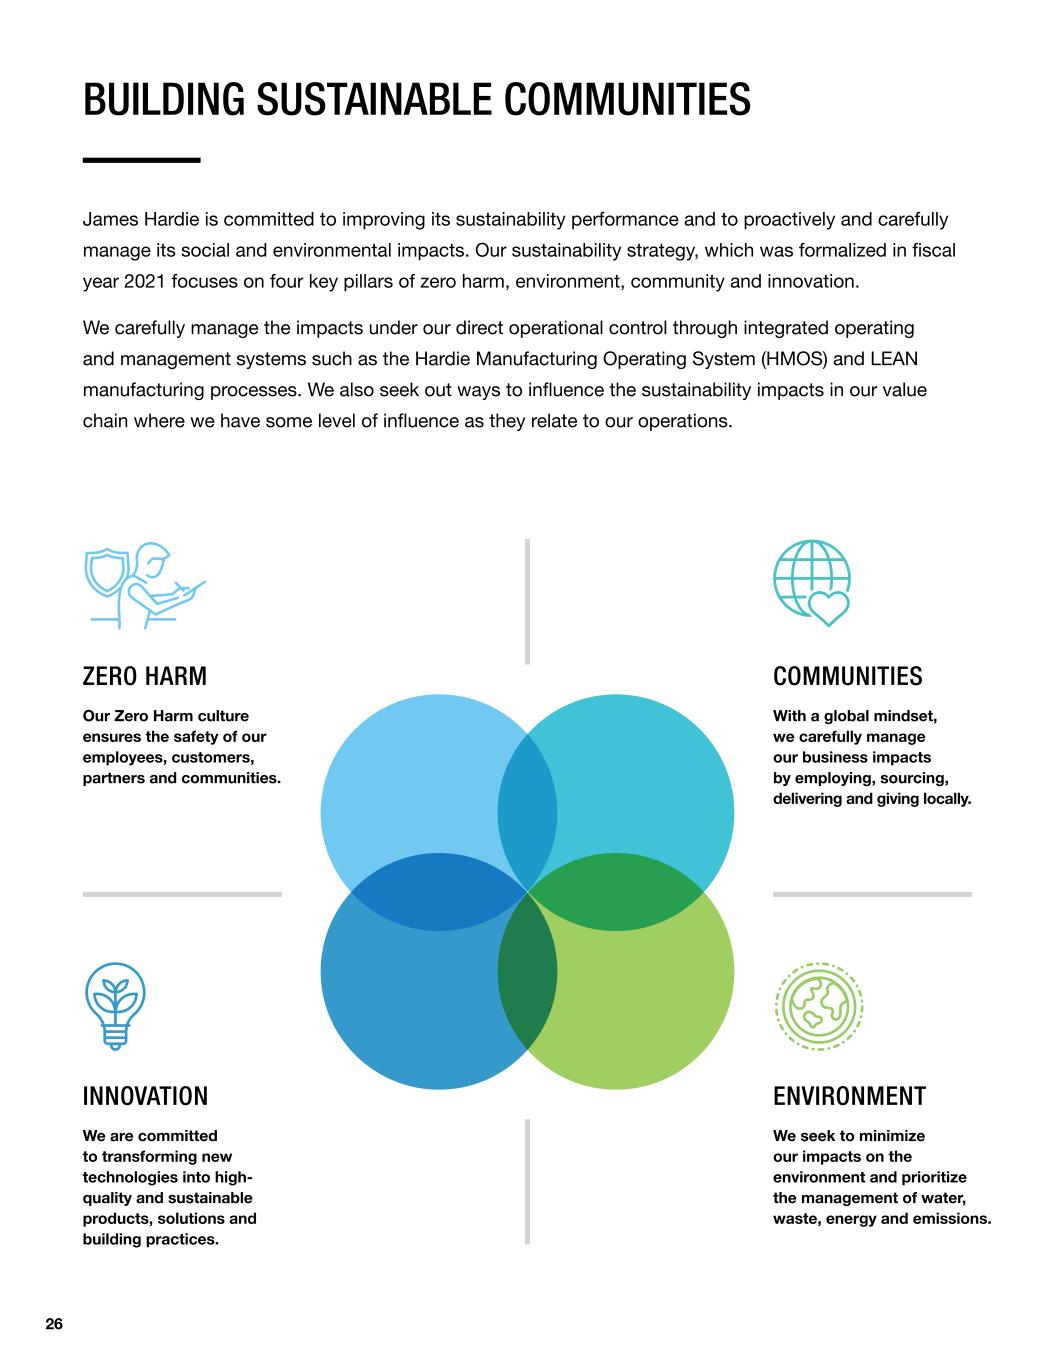
26 BUILDING SUSTAINABLE COMMUNITIES James Hardie is committed to improving its sustainability performance and to proactively and carefully manage its social and environmental impacts. Our sustainability strategy, which was formalized in fiscal year 2021 focuses on four key pillars of zero harm, environment, community and innovation. We carefully manage the impacts under our direct operational control through integrated operating and management systems such as the Hardie Manufacturing Operating System (HMOS) and LEAN manufacturing processes. We also seek out ways to influence the sustainability impacts in our value chain where we have some level of influence as they relate to our operations. INNOVATION We are committed to transforming new technologies into high- quality and sustainable products, solutions and building practices. ZERO HARM Our Zero Harm culture ensures the safety of our employees, customers, partners and communities. COMMUNITIES With a global mindset, we carefully manage our business impacts by employing, sourcing, delivering and giving locally. ENVIRONMENT We seek to minimize our impacts on the environment and prioritize the management of water, waste, energy and emissions.
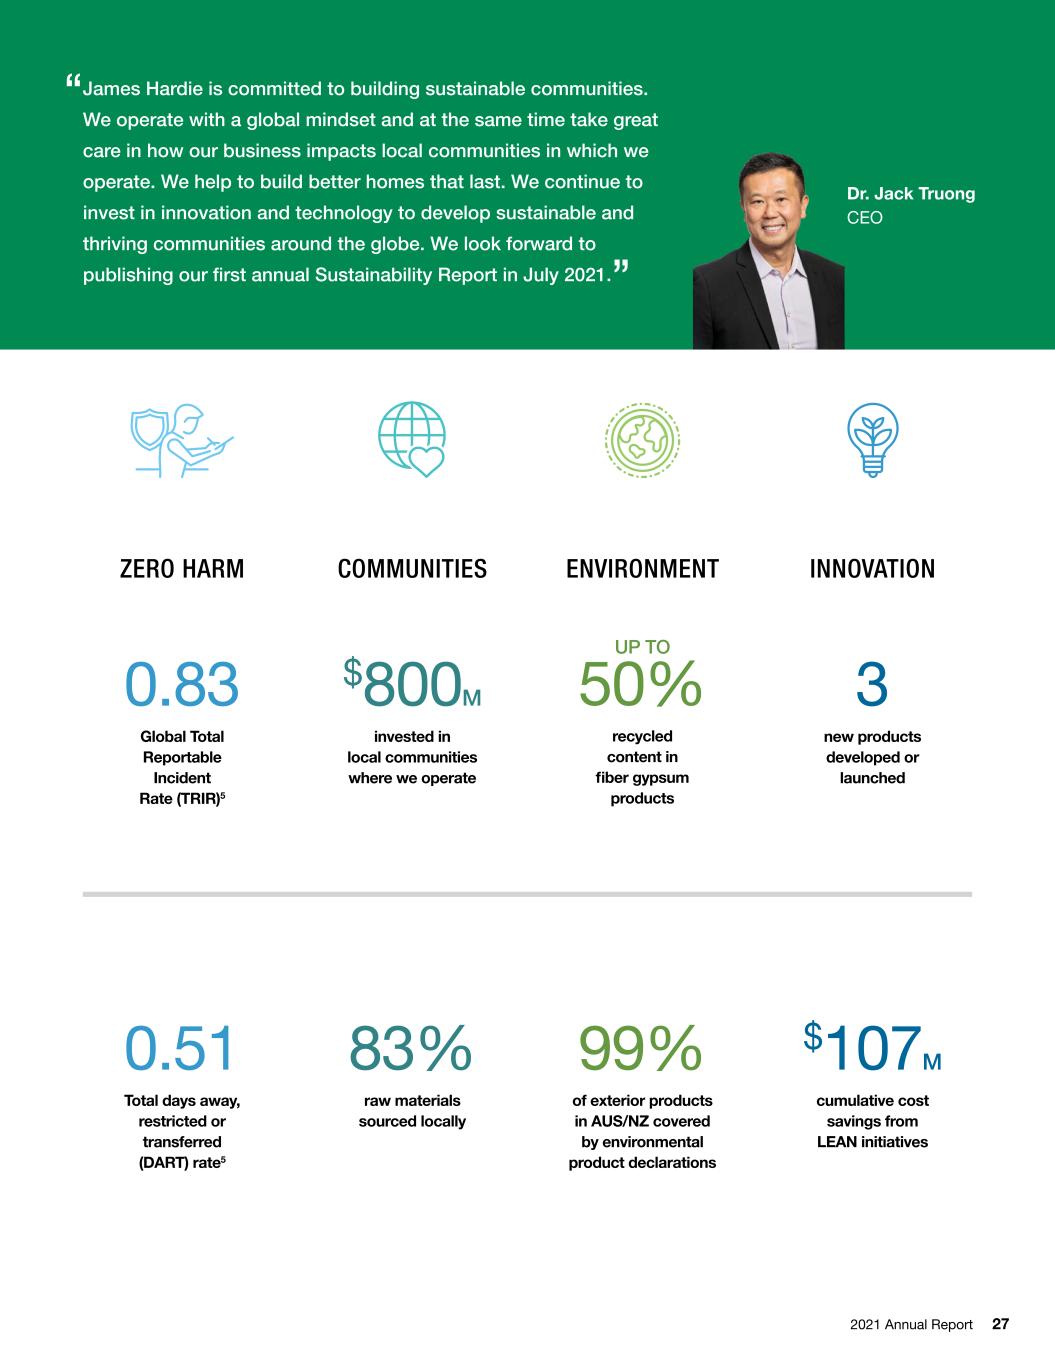
2021 Annual Report 27 0.51 Total days away, restricted or transferred (DART) rate5 $107M cumulative cost savings from LEAN initiatives 99% of exterior products in AUS/NZ covered by environmental product declarations 83% raw materials sourced locally 0.83 Global Total Reportable Incident Rate (TRIR)5 3 new products developed or launched UP TO 50% recycled content in fiber gypsum products $800M invested in local communities where we operate ZERO HARM COMMUNITIES ENVIRONMENT INNOVATION “ James Hardie is committed to building sustainable communities. We operate with a global mindset and at the same time take great care in how our business impacts local communities in which we operate. We help to build better homes that last. We continue to invest in innovation and technology to develop sustainable and thriving communities around the globe. We look forward to publishing our first annual Sustainability Report in July 2021.” Dr. Jack Truong CEO
28
2021 Annual Report 29 FINANCIAL ENDNOTES Unless otherwise stated all items are in US currency and financial information relates to fiscal year ended 31 March 2021. NON-GAAP FINANCIAL INFORMATION Pages 1-29 of this Annual Report contains financial measures that are not considered a measure of financial performance under US GAAP and should not be considered to be more meaningful than the equivalent US GAAP measure. Management has included such measures to provide investors with an alternative method for assessing its operating results in a manner that is focused on the performance of its ongoing operations. Additionally, management uses such non-GAAP financial measures for the same purposes. However, these non-GAAP financial measures are not prepared in accordance with US GAAP, may not be reported by all of James Hardie’s competitors and may not be directly comparable to similarly titled measures of James Hardie’s competitors due to potential differences in the exact method of calculation. For additional information regarding the non-GAAP financial measures presented in this Annual Report, including a reconciliation of each non-GAAP financial measure to the equivalent US GAAP measure, see the section titled “Glossary of Abbreviations and Definitions” in James Hardie’s Annual Report Form 20-F for the year ended 31 March 2021. Footnote 1 (EBIT Margin Targets, page 7) The Prior Targets for North America Fiber Cement segment and the Asia Pacific Fiber Cement segment are historical long-term Adjusted EBIT Margin target ranges communicated by management in past presentations. The new targets (FY22-24) represent targets for Annual Adjusted EBIT Margin in each region for each fiscal year in the period of fiscal years 2022, 2023 and 2024. Footnote 2 (EBIT Margin Targets, page 7) The Prior Targets for the Europe Building Products segment is the Average Annual Adjusted EBIT Margin excluding integration costs for Fiscal Years FY19 - FY21. The new targets (FY22-FY24) represent targets for Annual Adjusted EBIT Margin in each fiscal year in the period of fiscal years 2022, 2023 and 2024. Footnote 3 (Segment Net Sales and EBIT, pages 11, 13, 15) Segment Net Sales percent of total JHX is calculated as the FY21 Net Sales of each segment divided by the sum of the total FY21 Net Sales of the following three segments – North America Fiber Cement, Asia Pacific Fiber Cement and Europe Building Products. Segment EBIT percent of total JHX is calculated as the FY21 EBIT of each segment divided by the sum of the total FY21 EBIT of the following three segments – North America Fiber Cement, Asia Pacific Fiber Cement and Europe Building Products. Footnote 4 (Global Innovation, page 23) North America Exterior Wall Material. Exterior Cladding Material used in New Construction (NAHBNow, 2020) Source: NAHBNow 8 October 2020 for the full year 2019 Australia and New Zealand Exterior Wall Material Source: BIS Oxford, Australian Bureau of Statistics, BRANZ and Management Estimates Europe Exterior Wall Material Source: B+L (2018), Freedonia (2015) Footnote 5 (Zero Harm, page 27) Global Total Recordable Incident Rate (TRIR) and Total Days Away, Restricted or Transferred (DART) rate are reported across our global operations and include employees and temporary/ contract workers. Calculations follow OSHA guidelines. TRIR is the standard reporting term expected from GRI, ISS, MSCI and Sustainalytics. FORWARD-LOOKING STATEMENTS Certain statements in this Annual Report may constitute “forward-looking statements” as defined in the Private Securities Litigation Reform Act of 1995. James Hardie uses such words as “believe,” “anticipate,” “plan,” “expect,” “intend,” “target,” “estimate,” “project,” “predict,” “forecast,” “guideline,” “aim,” “will,” “should,” “likely,” “continue,” “may,” “objective,” “outlook” and similar expressions are intended to identify forward-looking statements but are not the exclusive means of identifying such statements. Readers are cautioned not to place undue reliance on these forward-looking statements and all such forward- looking statements are qualified in their entirety by reference to the following cautionary statements. Forward-looking statements are based on James Hardie’s current expectations, estimates and assumptions and because forward- looking statements address future results, events and conditions, they, by their very nature, involve inherent risks and uncertainties, many of which are unforeseeable and beyond the company’s control. Many factors could cause the actual results, performance or achievements of James Hardie to be materially different from those expressed or implied in this Annual Report, including, among others, the risks and uncertainties set forth in Section 3 “Risk Factors” in James Hardie’s Annual Report on Form 20-F for the year ended 31 March 2021; changes in general economic, political, governmental and business conditions globally and in the countries in which James Hardie does business, including the effect and consequences of the novel coronavirus public health crisis; changes in interest rates, changes in inflation rates; changes in exchange rates; the level of construction generally; changes in cement demand and prices; changes in raw material and energy prices; changes in business strategy and various other factors. Should one or more of these risks or uncertainties materialize, or should underlying assumptions prove incorrect, actual results may vary materially from those described herein. These forward-looking statements are made as of the date of this Annual Report and James Hardie does not assume any obligation to update them, except as required by law. Investors are encouraged to review James Hardie’s Annual Report on Form 20-F, and specifically the risk factors discussed therein, as it contains important disclosures regarding the risks attendant to investing in our securities.
30
2021 Annual Report 31 JAMES HARDIE INDUSTRIES Form 20-F

32
ANNUAL REPORT ON FORM 20-F FILED WITH THE UNITED STATES SECURITIES AND EXCHANGE COMMISSION ON MAY 18, 2021 INCORPORATED BY REFERENCE HEREIN
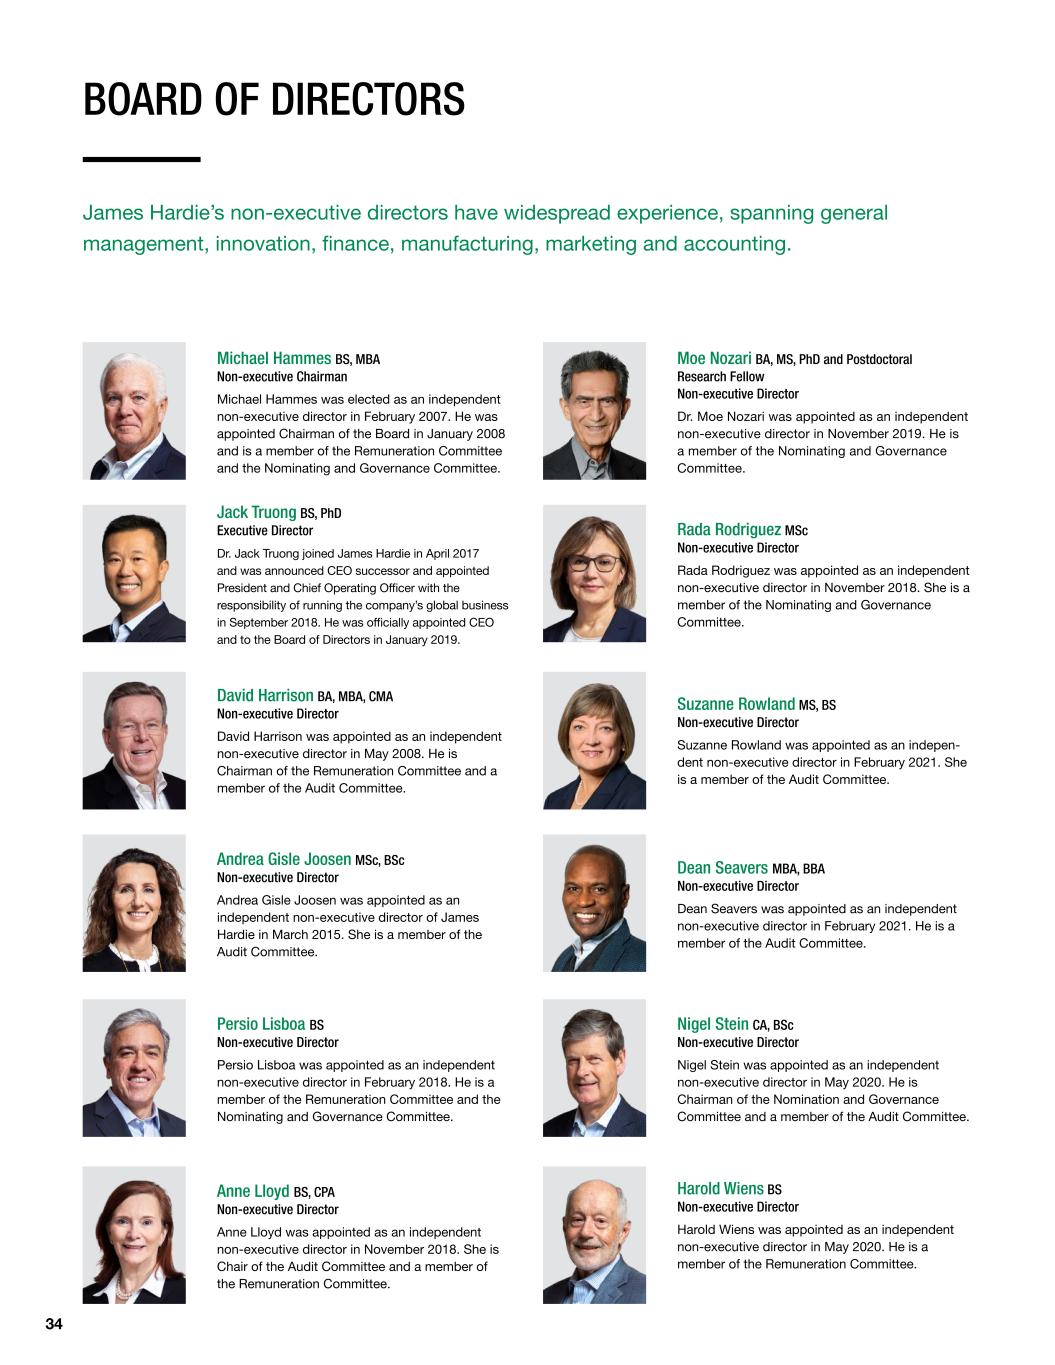
34 BOARD OF DIRECTORS James Hardie’s non-executive directors have widespread experience, spanning general management, innovation, finance, manufacturing, marketing and accounting. Michael Hammes BS, MBA Non-executive Chairman Michael Hammes was elected as an independent non-executive director in February 2007. He was appointed Chairman of the Board in January 2008 and is a member of the Remuneration Committee and the Nominating and Governance Committee. Moe Nozari BA, MS, PhD and Postdoctoral Research Fellow Non-executive Director Dr. Moe Nozari was appointed as an independent non-executive director in November 2019. He is a member of the Nominating and Governance Committee. Andrea Gisle Joosen MSc, BSc Non-executive Director Andrea Gisle Joosen was appointed as an independent non-executive director of James Hardie in March 2015. She is a member of the Audit Committee. Dean Seavers MBA, BBA Non-executive Director Dean Seavers was appointed as an independent non-executive director in February 2021. He is a member of the Audit Committee. David Harrison BA, MBA, CMA Non-executive Director David Harrison was appointed as an independent non-executive director in May 2008. He is Chairman of the Remuneration Committee and a member of the Audit Committee. Suzanne Rowland MS, BS Non-executive Director Suzanne Rowland was appointed as an indepen- dent non-executive director in February 2021. She is a member of the Audit Committee. Jack Truong BS, PhD Executive Director Dr. Jack Truong joined James Hardie in April 2017 and was announced CEO successor and appointed President and Chief Operating Officer with the responsibility of running the company’s global business in September 2018. He was officially appointed CEO and to the Board of Directors in January 2019. Rada Rodriguez MSc Non-executive Director Rada Rodriguez was appointed as an independent non-executive director in November 2018. She is a member of the Nominating and Governance Committee. Persio Lisboa BS Non-executive Director Persio Lisboa was appointed as an independent non-executive director in February 2018. He is a member of the Remuneration Committee and the Nominating and Governance Committee. Nigel Stein CA, BSc Non-executive Director Nigel Stein was appointed as an independent non-executive director in May 2020. He is Chairman of the Nomination and Governance Committee and a member of the Audit Committee. Anne Lloyd BS, CPA Non-executive Director Anne Lloyd was appointed as an independent non-executive director in November 2018. She is Chair of the Audit Committee and a member of the Remuneration Committee. Harold Wiens BS Non-executive Director Harold Wiens was appointed as an independent non-executive director in May 2020. He is a member of the Remuneration Committee.
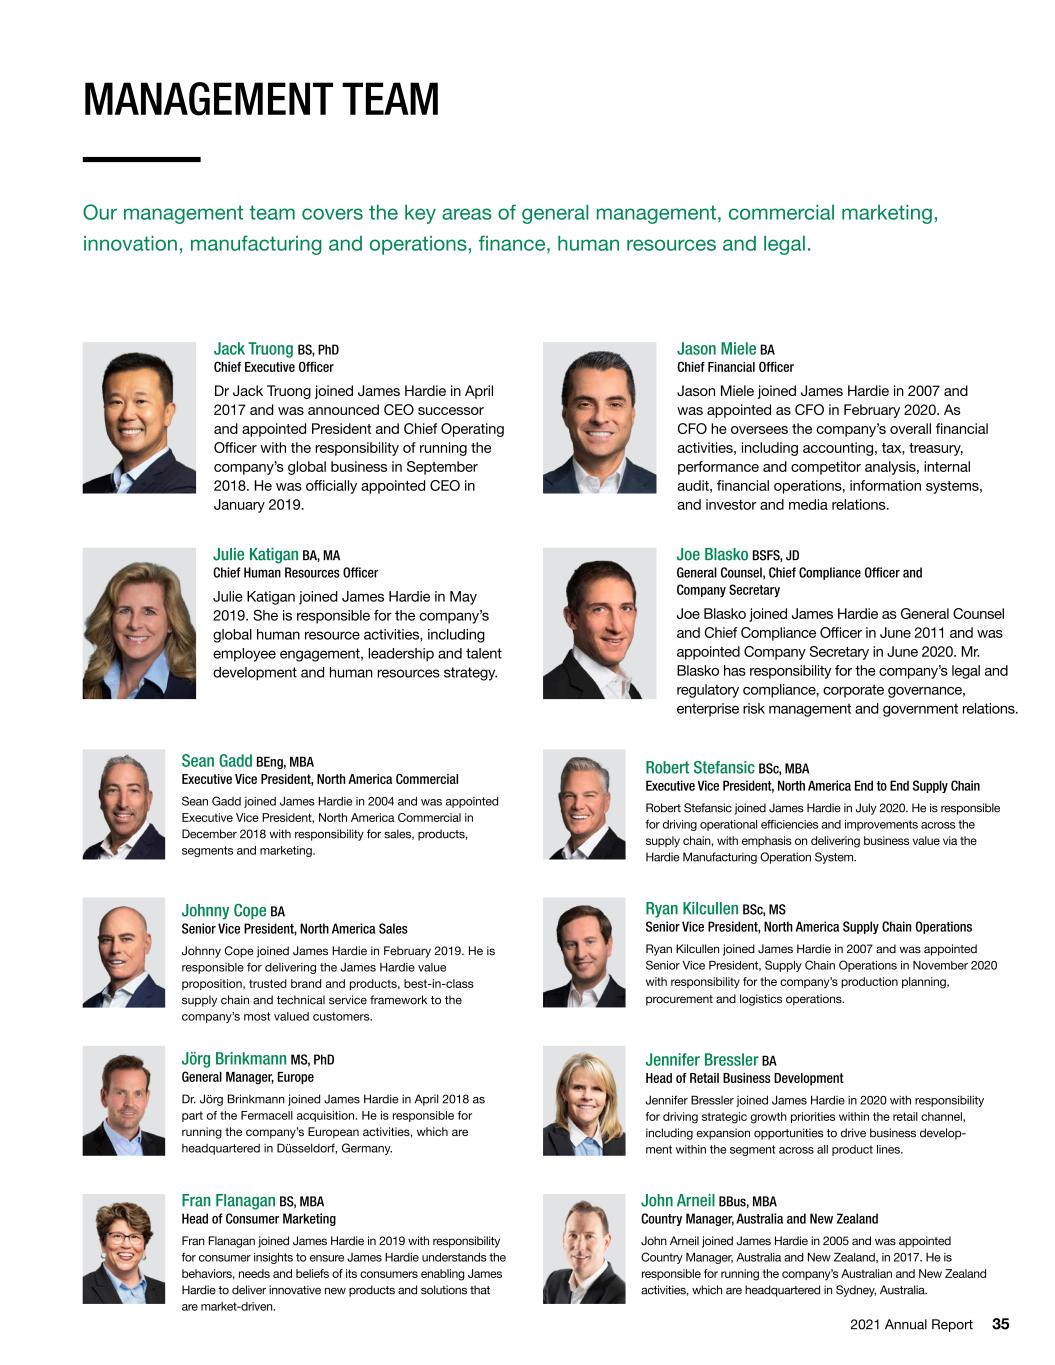
2021 Annual Report 35 MANAGEMENT TEAM Our management team covers the key areas of general management, commercial marketing, innovation, manufacturing and operations, finance, human resources and legal. Jack Truong BS, PhD Chief Executive Officer Dr Jack Truong joined James Hardie in April 2017 and was announced CEO successor and appointed President and Chief Operating Officer with the responsibility of running the company’s global business in September 2018. He was officially appointed CEO in January 2019. Jason Miele BA Chief Financial Officer Jason Miele joined James Hardie in 2007 and was appointed as CFO in February 2020. As CFO he oversees the company’s overall financial activities, including accounting, tax, treasury, performance and competitor analysis, internal audit, financial operations, information systems, and investor and media relations. Johnny Cope BA Senior Vice President, North America Sales Johnny Cope joined James Hardie in February 2019. He is responsible for delivering the James Hardie value proposition, trusted brand and products, best-in-class supply chain and technical service framework to the company’s most valued customers. Ryan Kilcullen BSc, MS Senior Vice President, North America Supply Chain Operations Ryan Kilcullen joined James Hardie in 2007 and was appointed Senior Vice President, Supply Chain Operations in November 2020 with responsibility for the company’s production planning, procurement and logistics operations. Robert Stefansic BSc, MBA Executive Vice President, North America End to End Supply Chain Robert Stefansic joined James Hardie in July 2020. He is responsible for driving operational efficiencies and improvements across the supply chain, with emphasis on delivering business value via the Hardie Manufacturing Operation System. Sean Gadd BEng, MBA Executive Vice President, North America Commercial Sean Gadd joined James Hardie in 2004 and was appointed Executive Vice President, North America Commercial in December 2018 with responsibility for sales, products, segments and marketing. Julie Katigan BA, MA Chief Human Resources Officer Julie Katigan joined James Hardie in May 2019. She is responsible for the company’s global human resource activities, including employee engagement, leadership and talent development and human resources strategy. Joe Blasko BSFS, JD General Counsel, Chief Compliance Officer and Company Secretary Joe Blasko joined James Hardie as General Counsel and Chief Compliance Officer in June 2011 and was appointed Company Secretary in June 2020. Mr. Blasko has responsibility for the company’s legal and regulatory compliance, corporate governance, enterprise risk management and government relations. Jennifer Bressler BA Head of Retail Business Development Jennifer Bressler joined James Hardie in 2020 with responsibility for driving strategic growth priorities within the retail channel, including expansion opportunities to drive business develop- ment within the segment across all product lines. Jörg Brinkmann MS, PhD General Manager, Europe Dr. Jörg Brinkmann joined James Hardie in April 2018 as part of the Fermacell acquisition. He is responsible for running the company’s European activities, which are headquartered in Düsseldorf, Germany. Fran Flanagan BS, MBA Head of Consumer Marketing Fran Flanagan joined James Hardie in 2019 with responsibility for consumer insights to ensure James Hardie understands the behaviors, needs and beliefs of its consumers enabling James Hardie to deliver innovative new products and solutions that are market-driven. John Arneil BBus, MBA Country Manager, Australia and New Zealand John Arneil joined James Hardie in 2005 and was appointed Country Manager, Australia and New Zealand, in 2017. He is responsible for running the company’s Australian and New Zealand activities, which are headquartered in Sydney, Australia.
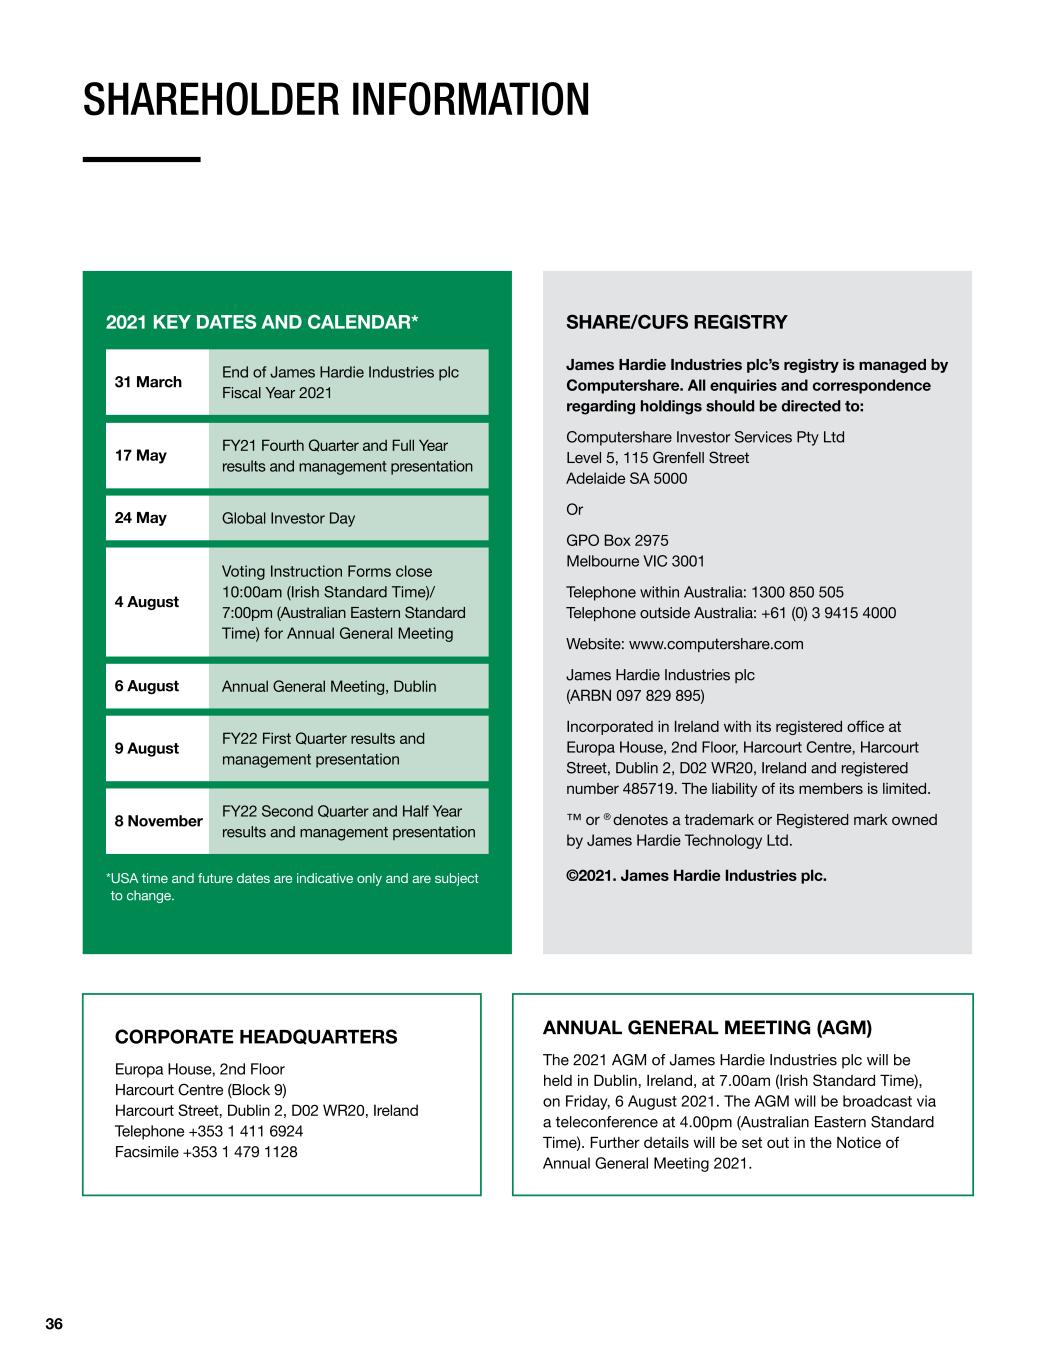
36 SHAREHOLDER INFORMATION SHARE/CUFS REGISTRY James Hardie Industries plc’s registry is managed by Computershare. All enquiries and correspondence regarding holdings should be directed to: Computershare Investor Services Pty Ltd Level 5, 115 Grenfell Street Adelaide SA 5000 Or GPO Box 2975 Melbourne VIC 3001 Telephone within Australia: 1300 850 505 Telephone outside Australia: +61 (0) 3 9415 4000 Website: www.computershare.com James Hardie Industries plc (ARBN 097 829 895) Incorporated in Ireland with its registered office at Europa House, 2nd Floor, Harcourt Centre, Harcourt Street, Dublin 2, D02 WR20, Ireland and registered number 485719. The liability of its members is limited. ™ or ® denotes a trademark or Registered mark owned by James Hardie Technology Ltd. ©2021. James Hardie Industries plc. 2021 KEY DATES AND CALENDAR* CORPORATE HEADQUARTERS Europa House, 2nd Floor Harcourt Centre (Block 9) Harcourt Street, Dublin 2, D02 WR20, Ireland Telephone +353 1 411 6924 Facsimile +353 1 479 1128 ANNUAL GENERAL MEETING (AGM) The 2021 AGM of James Hardie Industries plc will be held in Dublin, Ireland, at 7.00am (Irish Standard Time), on Friday, 6 August 2021. The AGM will be broadcast via a teleconference at 4.00pm (Australian Eastern Standard Time). Further details will be set out in the Notice of Annual General Meeting 2021. * USA time and future dates are indicative only and are subject to change. 31 March 17 May 9 August 8 November 4 August 24 May 6 August End of James Hardie Industries plc Fiscal Year 2021 FY21 Fourth Quarter and Full Year results and management presentation FY22 First Quarter results and management presentation FY22 Second Quarter and Half Year results and management presentation Voting Instruction Forms close 10:00am (Irish Standard Time)/ 7:00pm (Australian Eastern Standard Time) for Annual General Meeting Global Investor Day Annual General Meeting, Dublin
2021 Annual Report 37 ©This LandTM LTD 2021
