Exhibit 99.3
James Hardie Industries plc
Irish Statutory Accounts
For the Year Ended 31 March 2021
James Hardie Industries plc
Directors’ Report and
Consolidated Financial Statements
For the Year Ended 31 March 2021
| | |
| FY 2021 Irish Statutory Accounts |
James Hardie Industries plc
Table of Contents
| | | | | | | | |
| FY 2021 Irish Statutory Accounts | | i |
James Hardie Industries plc
Reading this Report
These Irish Statutory Accounts contain a Directors’ Report and audited consolidated financial statements and accompanying footnote disclosures prepared in accordance with accounting principles generally accepted in the United States of America (“US GAAP”), modified to comply with specific provisions of Irish Company Law for the consolidated entity consisting of James Hardie Industries plc and its direct and indirect wholly-owned subsidiaries and special purpose entity, (collectively referred to as “the Company”). In addition, these Irish Statutory Accounts include the James Hardie Industries plc Company Balance Sheet and related footnotes prepared on the going concern basis under the historical cost convention in accordance with the Companies Act 2014 and Financial Reporting Standard 101 Reduced Disclosure Framework (“FRS 101”).
For the year ended 31 March 2021, the Company has included, as an Appendix to the Directors’ Report, its fiscal year 2021 US and Australian Annual Report (“FY2021 Annual Report”). This report has been filed with the US Securities and Exchange Commission (“SEC”) and, except for the exhibits to the FY2021 Annual Report, is included in its entirety as an Appendix to the Directors’ Report. These exhibits can be obtained by accessing the Company’s FY2021 Annual Report on Form 20-F on the SEC’s website at www.sec.gov and on the Investor Relations area of the Company’s website at www.ir.jameshardie.com.au. Disclosures in the Directors’ Report and consolidated financial statements that are duplicative to the FY2021 Annual Report have been cross-referenced to the relevant section(s) in the FY2021 Annual Report.
The Independent Auditor’s Report included on pages 9-16 refers solely to the financial statements included in the Irish Statutory Accounts. The Report of Independent Registered Public Accounting Firm included in the FY2021 Annual Report (Appendix to the Directors’ Report) refers solely to the financial statements in the FY2021 Annual Report which were prepared under US GAAP. As such, readers should not rely on the Report of Independent Registered Public Accounting Firm included in the FY2021 Annual Report as it does not relate to the financial statements included in the Irish Statutory Accounts.
| | | | | | | | |
| FY 2021 Irish Statutory Accounts | | ii |
James Hardie Industries plc
Directors’ Report
For the year ended 31 March 2021
The directors present their report and audited consolidated financial statements for the fiscal year ended 31 March 2021 on the consolidated entity of James Hardie Industries plc (“JHI plc” or the "Parent Company") and its wholly-owned subsidiaries and special purpose entity. Unless the context indicates otherwise, JHI plc and its direct and indirect wholly-owned subsidiaries and special purpose entity (as of the time relevant to the applicable reference) are collectively referred to as “James Hardie”, the “James Hardie Group” or the “Company”.
The directors have elected to prepare the consolidated financial statements in accordance with Section 279 of the Companies Act 2014, which provides that a true and fair view of the assets and liabilities, financial position and profit or loss may be given by preparing the financial statements in accordance with accounting principles generally accepted in the United States of America (“US GAAP”), as defined in Section 279(1) of the Companies Act 2014, to the extent that the use of those principles in the preparation of the financial statements does not contravene any provision of the Companies Act 2014 or of any regulations made thereunder.
Directors’ Compliance Statement
As required by section 225(2) of the Companies Act 2014, the directors acknowledge that they are responsible for the Company's compliance with its relevant obligations (as defined in section 225(1) of the Companies Act 2014). The directors confirm that a “compliance policy statement” (as defined in section 225(3)(a)) has been drawn up, that appropriate arrangements and structures that are, in the directors' opinion, designed to secure material compliance with the company’s relevant obligations have been put in place and that a review of those arrangements and structures has been conducted in the financial year to which this report relates.
Audit Committee
As required by section 167(3) of the Companies Act 2014, the directors hereby state that the Company has established an audit committee.
Principal Activities
See “Information on the Company – Business Overview – General Overview of our Business” in Section 1 of the Appendix to this Directors’ Report.
Review of the Development and Performance of the Business
Trends and Economic Events
See “Management’s Discussion and Analysis – Outlook and Trend Information” in Section 2 of the Appendix to this Directors’ Report.
Operating Results
See “Management’s Discussion and Analysis – Operating Results” in Section 2 of the Appendix to this Directors’ Report.
In addition, refer to Note 1 of the consolidated financial statements in relation to the differences arising between the Irish Statutory Accounts and the Appendix to the Directors' Report for the year ended 31 March 2019.
| | | | | | | | |
| FY 2021 Irish Statutory Accounts | | 1 |
James Hardie Industries plc
Directors’ Report (continued)
For the year ended 31 March 2021
Liquidity and Capital Allocation
See “Management’s Discussion and Analysis – Liquidity and Capital Allocation” subsections “Overview”, “Sources of Liquidity”, “Cash Flow”, “Borrowings”, “Capital Expenditures and Lease Obligations”, “Capital Management” in Section 2 of the Appendix to this Directors’ Report.
In addition, refer to Note 1 of the consolidated financial statements in relation to the differences arising between the Irish Statutory Accounts and the Appendix to the Directors' Report for the year ended 31 March 2019.
Principal Risks and Uncertainties
See “Risk Factors” in Section 3 of the Appendix to this Directors’ Report.
Legal Proceedings
See “Legal Proceedings” in Section 3 of the Appendix to this Directors’ Report.
Financial Instruments
See Financial Instruments in Note 1 to the US GAAP consolidated financial statements in Section 2 of the Appendix to this Directors’ Report and “Quantitative and Qualitative Disclosures About Market Risk” in Section 3 of the Appendix to this Directors’ Report.
Research and Development
See “Information on the Company - Business Overview - Dependence on Trade Secrets and Research and Development (“R&D”)” in Section 1 of the Appendix to this Directors’ Report.
Capital Management and Dividends
See Note 17 to the US GAAP consolidated financial statements in Section 2 of the Appendix to this Directors’ Report and “Management’s Discussion Analysis – Liquidity and Capital Allocation – Capital Management” in Section 2 of the Appendix to this Directors’ Report.
Results for the Year and Proposed Transfer to Reserves
The results for the year are set out in the consolidated statements of operations and comprehensive income on page 17. The balance to be transferred to reserves is US$262.8 million (2020: US$241.5 million).
In addition, refer to Note 1 of the consolidated financial statements in relation to the differences arising between the Irish Statutory Accounts and the Appendix to the Directors' Report for the year ended 31 March 2019.
Future Developments
See “Management’s Discussion and Analysis – Outlook and Trend Information” in Section 2 of the Appendix to this Directors’ Report.
| | | | | | | | |
| FY 2021 Irish Statutory Accounts | | 2 |
James Hardie Industries plc
Directors’ Report (continued)
For the year ended 31 March 2021
Accounting Records
The measures taken by the directors to ensure compliance with the Company’s obligations under Section 281 to 285 of the Companies Act 2014 to keep adequate accounting records are the implementation of necessary policies and procedures for recording transactions, the employment of competent accounting personnel with appropriate expertise and the provision of adequate resources to the financial function.
The accounting records are maintained at the Company’s registered office at Europa House, 2nd Floor, Harcourt Centre, Harcourt Street, Dublin 2, D02 WR20.
Other Non-Financial Disclosures
These other non-financial disclosures are included for the purpose of Statutory Instrument 360/2017 European Union (Disclosure of Non-financial and Diversity Information by certain large undertakings and groups) Regulation 2017.
Our Business Model
See “Business Overview” in Section 1 of the Appendix to this Directors’ Report.
Environmental Matters
See “Environmental, Health and Safety Regulation” in Section 1, "Risk Factors" in Section 3 of the Appendix to this Directors’ Report and the “sustainability” statement published on our website at www.ir.jameshardie.com.au.
Social and Employee Aspects
See “Principle 3: Instill a culture of acting lawfully, ethically and responsibly” and “Workplace Diversity” in Section 1 of the Appendix to this Directors’ Report and “Employees” in Section 3 of the Appendix to this Directors’ Report.
Respect for Human Rights
See “Principle 3: Instill a culture of acting lawfully, ethically and responsibly”, “Principle 5: Make Timely and Balanced Disclosure” and "Principle 6: Respect the Rights of Security Holders" in Section 1 of the Appendix to this Directors’ Report and “Sustainability” statement and the James Hardie Global Code of Business Conduct on our investor relations website at www.ir.jameshardie.com.au for details of social responsibility programs.
Anti-Corruption and Bribery
See “Principle 3: Instill a culture of acting lawfully, ethically and responsibly,” “Insider Trading" and "Policies for Management of Material Business Risks" in Section 1 and "Risk Factors" in Section 3 of the Appendix to this Directors’ Report and the James Hardie Global Code of Business Conduct published on our investor relations website at www.ir.jameshardie.com.au.
| | | | | | | | |
| FY 2021 Irish Statutory Accounts | | 3 |
James Hardie Industries plc
Directors’ Report (continued)
For the year ended 31 March 2021
Diversity on Board of Directors
See “Workplace Diversity” in Section 1 of the Appendix to this Directors’ Report.
Principal Risks
Principal risks relating to environmental matters, social and employee matters, respect for human rights and anti-bribery and corruption are actively monitored as part of the role of the Risk Management Committee. This includes any potential adverse impacts where relevant and proportionate, to our business relationships, products and services.
Key Performance Indicators
Key performance indicators ("KPIs") in relation to each of the above areas are discussed in the relevant sections of the Appendix to this Directors’ Report.
KPIs have been established for those areas of our business where we believe the impact to be potentially material. No formal KPIs are in place relating to respect for human rights or anti-bribery and corruption, although performance in these areas is actively monitored as part of our Risk Management Committee.
See “Sustainability” statement and the James Hardie Global Code of Business Conduct on our investor relations website at www.ir.jameshardie.com.au for details of social responsibility programs.
Important Events Since Year End
Subsequent to 31 March 2021, the Company paid US$309.6 million as a special dividend of US70.0 cents per security which was announced on 10 February 2021.
Subsequent to 31 March 2021, the Company has drawn US$110.0 million from the unsecured revolving credit facility.
Directors of the Company
See “Board of Directors” in Section 1 of the Appendix to this Directors’ Report for a list of the Company’s directors along with their biographies. Other than Mr Harold Wiens and Mr Nigel Stein, who were appointed as independent non-executive directors on 14 May 2020, Mr Dean Seavers and Ms Suzanne Rowland, who were appointed as independent non-executive directors on 4 February 2021 and Mr Brian Anderson and Mr Russell Chenu who retired as independent non-executive directors on 5 November 2020, the directors listed served on the Board throughout fiscal year 2021.
Disclosure of Information to Auditors
As required by section 330 of the Companies Act 2014, the directors who held office at the date of approval of this Directors’ Report confirm that so far as they are each aware, there is no relevant audit information of which the Company’s statutory auditors are unaware and each director has taken all steps that they ought to have taken as a director to make themselves aware of any relevant audit information and to establish that the Company’s statutory auditors are aware of that information.
| | | | | | | | |
| FY 2021 Irish Statutory Accounts | | 4 |
James Hardie Industries plc
Directors’ Report (continued)
For the year ended 31 March 2021
Going Concern
The business activities, together with the factors likely to affect its future development, its financial position, financial risk management objectives, details of its financial instruments and derivative activities, and its exposures to price, credit, liquidity and cash flow risk of the Company are set out in Section 3 of the Appendix to this Directors’ Report. The James Hardie Group has considerable financial resources together with long-term contracts with a number of customers and suppliers across different geographic areas and industries. As a consequence, the directors believe that the James Hardie Group is well placed to manage its business risks successfully in the current economic outlook. After making enquiries, the directors have a reasonable expectation that the James Hardie Group has adequate resources to continue in operational existence for the foreseeable future. Accordingly, they continue to adopt the going concern basis in preparing the annual report and accounts.
JHI plc was in a net current asset position of US$11.0 million and a net current liability position of US$1.9 million at 31 March 2021 and 2020, respectively. The Parent Company has minimal liabilities other than amounts owed to the Group. These undertakings will not be repaid until all other debts are satisfied. In addition, the Group has cash reserves of US$208.5 million and US$495.3 million of available unused external loan facilities at 31 March 2021 which the Parent Company can access through an inter-company facility with its Treasury subsidiary. The directors are satisfied that the Parent Company will continue to generate adequate cash to meet all its obligations as they fall due. On this basis, and after making inquiries, the directors have reasonable expectations that the Parent Company has adequate resources to continue in operational existence for the foreseeable future. Accordingly, the Parent Company continues to adopt the going concern assumption in preparing the financial statements. These financial statements do not include any adjustments to the carrying amount or classification of assets and liabilities that would result if the Parent Company were unable to continue as a going concern.
Directors’ and Secretary’s Interests
No director, the Company Secretary nor any member of their immediate family had any interest in shares or debentures of any subsidiary. The interests of the executive director (Dr Jack Truong) and non-executive directors in the ordinary share capital of the Company at the beginning (or date of appointment if later) and end of fiscal year 2021 are set out in “Remuneration – Share Ownership and Stock Based Compensation Arrangements” in Section 1 of the Appendix to this Directors’ Report. The non-executive directors had no options or restricted stock units ("RSUs") at the beginning and end of fiscal year 2021.
The interests of Mr Joe Blasko, appointed as the Company Secretary effective 29 June 2020, in the ordinary share capital of the Company was 98,578 shares and 124,902 RSUs at 31 March 2021. The interests of Mr Joe Blasko in the ordinary share capital of the Company was 64,861 shares and 157,352 RSUs at 29 June 2020. The interests of Ms Natasha Mercer, resigned as the Company Secretary effective 29 June 2020, in the ordinary share capital of the Company was nil shares and 12,423 RSUs at 31 March 2020.
Political Donations
No political contributions that require disclosure under Irish law were made during fiscal year 2021.
| | | | | | | | |
| FY 2021 Irish Statutory Accounts | | 5 |
James Hardie Industries plc
Directors’ Report (continued)
For the year ended 31 March 2021
Subsidiary Companies
Information regarding subsidiary undertakings is provided in Note 33 to the consolidated financial statements.
Branches
As of 31 March 2021, the Company does not operate any branches outside of Ireland.
Annual General Meeting
The Annual General Meeting of the Company will be held on 6 August 2021 at James Hardie’s Corporate Headquarters in Dublin, Ireland.
Auditors
The auditors Ernst & Young, Chartered Accountants, are willing to continue in office and a resolution authorising the directors to fix their remuneration will be submitted at the Annual General Meeting.
On behalf of the Directors
| | | | | | | | |
| /s/ Michael Hammes | | /s/ Anne Lloyd |
| Michael Hammes | | Anne Lloyd |
| 18 May 2021 | | |
| | | | | | | | |
| FY 2021 Irish Statutory Accounts | | 6 |
James Hardie Industries plc
Directors’ Responsibilities Statement
Company law in Ireland requires the directors to prepare financial statements for each financial year which give a true and fair view of the state of the assets, liabilities and financial position of James Hardie Industries plc (“JHI plc” or the “Parent Company”) and of JHI plc and its wholly-owned subsidiaries and special purpose entity (collectively, the “Company” or the “Group”) and of the profit or loss of the Group for that period.
In preparing the financial statements of the Group, the directors are required to:
•select suitable accounting policies and then apply them consistently;
•make judgments and estimates that are reasonable and prudent;
•comply with applicable accounting principles generally accepted in the United States of America (“US GAAP”) in accordance with the Companies Act 2014 to the extent that the use of US GAAP does not contravene any provision of the Companies Act or of any regulations made thereunder, subject to any material departures disclosed and explained in the financial statements; and
•prepare the financial statements on the going concern basis unless it is inappropriate to presume that the Group will continue in business.
The considerations set out above for the Group are also required to be addressed by the directors in preparing the financial statements of the Parent Company (which are set out on pages 42 to 53), in respect of which the applicable accounting standards are those which are generally accepted in Ireland.
The directors have elected to prepare the Parent Company’s financial statements in accordance with Financial Reporting Standard 101 ‘Reduced Disclosure Framework’ (“FRS 101”) as issued by the Financial Reporting Council together with the Companies Act 2014.
Under Irish Company Law, the directors must not approve the financial statements unless they are satisfied that they give a true and fair view of the assets, liabilities and financial position of the Group and Parent Company as at the end of the financial year, and the profit or loss of the Group for the financial year, and otherwise comply with the Companies Act 2014.
The directors are responsible for keeping proper accounting records, which disclose with reasonable accuracy the assets, liabilities, financial position and profit and loss of the Parent Company and which enable them to ensure that the financial statements of the Group are prepared in accordance with US GAAP and comply with the provisions of the Companies Act 2014. They are also responsible for safeguarding the assets of the Group and hence for taking reasonable steps for the prevention and detection of fraud and other irregularities.
| | | | | | | | |
| FY 2021 Irish Statutory Accounts | | 7 |
Appendix to the
Directors’ Report
FY 2021 US and Australian Annual Report
(This document is an appendix to, and constitutes an integral part of, the Directors’ Report.)
| | | | | | | | |
| FY 2021 Irish Statutory Accounts | | 8 |
UNITED STATES
SECURITIES AND EXCHANGE COMMISSION
Washington, D.C. 20549
FORM 20-F
(Mark One)
☐ REGISTRATION STATEMENT PURSUANT TO SECTION 12(b) OR (g) OF THE SECURITIES EXCHANGE ACT OF 1934
OR
☒ ANNUAL REPORT PURSUANT TO SECTION 13 OR 15(d) OF THE SECURITIES EXCHANGE ACT OF 1934
For the fiscal year ended 31 March 2021
OR
☐ TRANSITION REPORT PURSUANT TO SECTION 13 OR 15(d) OF THE SECURITIES EXCHANGE ACT OF 1934
OR
☐ SHELL COMPANY REPORT PURSUANT TO SECTION 13 OR 15(d) OF THE SECURITIES EXCHANGE ACT OF 1934
Date of event requiring this shell company report
For the transition period from to
Commission file number 1-15240
JAMES HARDIE INDUSTRIES plc
(Exact name of Registrant as specified in its charter)
N/A
(Translation of Registrant’s name into English)
Ireland
(Jurisdiction of incorporation or organization)
Europa House, 2nd Floor
Harcourt Centre
Harcourt Street, Dublin 2, D02, WR20, Ireland
(Address of principal executive offices)
Joseph C. Blasko
General Counsel & Company Secretary
(Contact name)
353 1411 6924 (Telephone) 353 1479 1128 (Facsimile)
Securities registered or to be registered pursuant to Section 12(b) of the Act:
| | | | | | | | |
| Title of each class: | Trading Symbol: | Name of each exchange on which registered: |
| Common stock, represented by CHESS Units of Foreign Securities | JHX | New York Stock Exchange* |
| CHESS Units of Foreign Securities | JHX | New York Stock Exchange* |
| American Depositary Shares, each representing one unit of CHESS Units of Foreign Securities | JHX | New York Stock Exchange |
* Listed, not for trading, but only in connection with the registered American Depositary Shares, pursuant to the requirements of the U.S. Securities and Exchange Commission |
Securities registered or to be registered pursuant to Section 12(g) of the Act.
None
Securities for which there is a reporting obligation pursuant to Section 15(d) of the Act.
None
Indicate the number of outstanding shares of each of the issuer’s classes of capital or common stock as of the close of the period covered by the Annual Report: 444,288,874 shares of common stock at 31 March 2021
Indicate by check mark if the registrant is a well-known seasoned issuer, as defined in Rule 405 of the Securities Act. ☒ Yes ☐ No
If this report is an annual or transition report, indicate by check mark if the registrant is not required to file reports pursuant to Section 13 or 15(d) of the Securities Exchange Act of 1934. ☐ Yes ☒ No
Note — Checking the box will not relieve any registrant required to file reports pursuant to Section 13 or 15(d) of the Securities Exchange Act of 1934 from their obligations under those Sections.
Indicate by check mark whether the registrant (1) has filed all reports required to be filed by Section 13 or 15(d) of the Securities Exchange Act of 1934 during the preceding 12 months (or for such shorter period that the registrant was required to file such reports) and (2) has been subject to such filing requirements for the past 90 days. ☒ Yes ☐ No
Indicate by check mark whether the registrant has submitted electronically every Interactive Data File required to be submitted pursuant to Rule 405 of Regulation S-T (§232.405 of this chapter) during the preceding 12 months (or for such shorter period that the registrant was required to submit such files). ☒ Yes ☐ No
Indicate by check mark whether the registrant is a large accelerated filer, an accelerated filer, a non-accelerated filer, or an emerging growth company. See the definition of “large accelerated filer,” “accelerated filer” and “emerging growth company” in Rule 12b-2 of the Exchange Act. (Check one):
| | | | | | | | |
| Large accelerated filer | | ☒ |
| Accelerated filer | | ☐ |
| Non-accelerated filer | | ☐ |
| Emerging growth company | | ☐ |
If an emerging growth company that prepares its financial statements in accordance with U.S. GAAP, indicate by check mark if the registrant has elected not to use the extended transition period for complying with any new or revised financial accounting standards† provided pursuant to Section 13(a) of the Exchange Act. ☐
† The term “new or revised financial accounting standard” refers to any update issued by the Financial Accounting Standards Board to its Accounting Standards Codification after 5 April 2012.
| | | | | |
| Indicate by check mark whether the registrant has filed a report on and attestation to its management’s assessment of the effectiveness of its internal control over financial reporting under Section 404(b) of the Sarbanes-Oxley Act (15 U.S.C. 7262(b)) by the registered public accounting firm that prepared or issued its audit report | ☒ |
Indicate by check mark which basis of accounting the registrant has used to prepare the financial statements included in this filing:
| | | | | | | | |
International Financial Reporting Standards as issued by the International Accounting
Standards Board | | ☐ |
If “Other” has been checked in response to the previous question, indicate by check mark which financial statement item the registrant has elected to follow: ☐ Item 17 ☐ Item 18
If this is an Annual Report, indicate by check mark whether the registrant is a shell company (as defined in Rule 12b-2 of the Exchange Act). ☐ Yes ☒ No
2021
ANNUAL REPORT
ON FORM 20-F
| | | | | |
| |
James Hardie 2021 Annual Report on Form 20-F | i |
| |
TABLE OF CONTENTS
| | | | | |
| |
James Hardie 2021 Annual Report on Form 20-F | ii |
| |
FORM 20-F CROSS REFERENCE
| | | | | |
| Page(s) |
| PART 1 | |
| Item 1. Identity of Directors, Senior Management and Advisers | Not applicable |
| Item 2. Offer Statistics and Expected Timetable | Not applicable |
| Item 3. Key Information | |
| A. [Reserved] | Not applicable |
| B. Capitalization and Indebtedness | Not applicable |
| C. Reasons for the Offer and Use of Proceeds | Not applicable |
| D. Risk Factors | 153-165 |
| Item 4. Information on the Company | |
| A. History and Development of the Company | 2-3; 13; 181 |
| B. Business Overview | 4-9 |
| C. Organizational Structure | 3; 10 |
| D. Property, Plants and Equipment | 11-13; 105 |
| Item 4A. Unresolved Staff Comments | None |
| Item 5. Operating and Financial Review and Prospects | |
| A. Operating Results | 96-103 |
| B. Liquidity and Capital Resources | 103-106 |
| C. Research and Development, Patents and Licenses, etc. | 8-9 |
| D. Trend Information | 106-107 |
| E. Critical Accounting Estimates | 92-95 |
| Item 6. Directors, Senior Management and Employees | |
| A. Directors and Senior Management | 14-26 |
| B. Compensation | 27-65 |
| C. Board Practices | 19-26; 66-89 |
| D. Employees | 170 |
| E. Share Ownership | 53-56; 61-65 |
| Item 7. Major Shareholders and Related Party Transactions | |
| A. Major Shareholders | 185-186 |
| B. Related Party Transactions | 80 |
| C. Interests of Experts and Counsel | Not Applicable |
| Item 8. Financial Information | |
| A. Consolidated Statements and Other Financial Information | 108-151; 173 |
| B. Significant Changes | None |
| Item 9. The Offer and Listing | |
| A. Offer and Listing Details | 170-172 |
| B. Plan of Distribution | Not Applicable |
| C. Markets | 170-171 |
| D. Selling Shareholders | Not Applicable |
| E. Dilution | Not Applicable |
| F. Expenses of the Issue | Not Applicable |
| |
| | | | | |
| |
James Hardie 2021 Annual Report on Form 20-F | iii |
| |
| | | | | |
| PART 1 (continued) | |
| Item 10. Additional Information | |
| A. Share Capital | Not Applicable |
| B. Memorandum and Articles of Association | 173 |
| C. Material Contracts | 173 |
| D. Exchange Controls | 173 |
| E. Taxation | 173-181 |
| F. Dividends and Paying Agents | Not Applicable |
| G. Statement by Experts | Not Applicable |
| H. Documents on Display | 181 |
| I. Subsidiary Information | Not Applicable |
| Item 11. Quantitative and Qualitative Disclosures About Market Risk | 182-184 |
| Item 12. Description of Securities Other Than Equity Securities | |
| A. Debt Securities | Not Applicable |
| B. Warrants and Rights | Not Applicable |
| C. Other Securities | Not Applicable |
| D. American Depositary Shares | 171-172 |
| PART II | |
| Item 13. Defaults, Dividend Arrearages and Delinquencies | None |
Item 14. Material Modifications to the Rights of Security Holders and Use of Proceeds | None |
| Item 15. Controls and Procedures | 168-169 |
| Item 16A. Audit Committee Financial Expert | 84 |
| Item 16B. Code of Ethics | 81-82 |
| Item 16C. Principal Accountant Fees and Services | 152 |
Item 16D. Exemptions from the Listing Standards for Audit Committees | None |
| Item 16E. Purchases of Equity Securities by the Issuer and Affiliated Purchasers | None |
| Item 16F. Change in Registrant’s Certifying Accountant | None |
| Item 16G. Corporate Governance | 66-89 |
| Item 16H. Mine Safety Disclosure | 12 |
| PART III | |
| Item 17. Financial Statements | Not Applicable |
| Item 18. Financial Statements | 108-151 |
| Item 19. Exhibits | 193-199 |
| | | | | |
| |
James Hardie 2021 Annual Report on Form 20-F | 1 |
| |
SECTION 1
INTRODUCTION
James Hardie Industries plc is a world leader in the manufacturing of fiber cement building solutions, and a market leader in Europe for fiber gypsum products. Our current primary geographic markets include the United States of America (“US,” “USA” or the “United States”), Australia, Europe, New Zealand, the Philippines and Canada.
James Hardie Industries plc is a “public limited company,” incorporated and existing under the laws of Ireland. Except as the context otherwise may require, references in this Annual Report on Form 20-F (this “Annual Report”) to “James Hardie,” the “James Hardie Group,” the “Company,” “JHI plc,” “we,” “our” or “us” refer to James Hardie Industries plc, together with its direct and indirect wholly owned subsidiaries as of the time relevant to the applicable reference.
For certain information about the basis of preparing the financial information in this Annual Report as well as an explanation of forward-looking statements and the risks, uncertainties and assumptions to which they are subject, see “Section 2 – Reading this Report.” Further, a “Glossary of Abbreviations and Definitions” has also been included under Section 4 of this Annual Report.
The term “fiscal year” refers to our fiscal year ended 31 March of such year; the term “dollars,” “US$” or “$” refers to US dollars; the term “A$” refers to Australian dollars; and the term "EUR" or “€” refers to Euros.
Information contained in or accessible through the websites mentioned in this Annual Report does not form a part of this Annual Report unless we specifically state that it is incorporated by reference herein. All references in this Annual Report to websites are inactive textual references and are for information only.
| | | | | |
| |
James Hardie 2021 Annual Report on Form 20-F | 2 |
| |
INFORMATION ON THE COMPANY
History and Development of the Company
About James Hardie
James Hardie Industries plc is incorporated and existing under the laws of Ireland. As an Irish plc, we are governed by the Irish Companies Act 2014 and we operate under the regulatory requirements of numerous jurisdictions and organizations, including the Australian Securities Exchange ("ASX"), Australian Securities and Investments Commission ("ASIC"), the New York Stock Exchange (“NYSE”), the United States Securities and Exchange Commission (“SEC”), the Irish Takeover Panel and various other rulemaking bodies.
The address of our registered office in Ireland is Europa House, 2nd Floor, Harcourt Centre, Harcourt Street, Dublin 2, D02 WR20, Ireland. The telephone number is +353 1411 6924. Our agent in the United States is CT Corporation. Its office is located at 28 Liberty Street - 42nd Floor, New York, New York 10005. The address of our registered office in Australia is Level 20, 60 Castlereagh Street, Sydney NSW 2000 and the telephone number is +61 2 9638 9205. Our share registry is maintained by Computershare Investor Services Pty Ltd. All inquiries and correspondence regarding holdings should be directed to: Computershare Investor Services Pty Ltd, Level 5, 115 Grenfell Street, Adelaide, SA 5000; telephone: +61 3 9415 4000 or toll free within Australia: 1300 855 080. Our American Depositary Receipt ("ADR") register is maintained by Deutsche Bank. All inquiries and correspondence regarding American Depositary Shares ("ADSs") should be directed to Deutsche Bank, 60 Wall Street, New York, New York 10005, United States; telephone 1-212-250-9100.
Our History
James Hardie was established in 1888 as an import business, listing on the ASX in 1951 to become a publicly owned company in Australia. After becoming a listed company, we built a diverse portfolio of building and industrial products. In the late-1970s, we pioneered the development of asbestos-free fiber cement technology and in the early-1980’s began designing and manufacturing a wide range of fiber cement building products that made use of the benefits that came from the products’ durability, versatility and strength. Using the technical and manufacturing expertise developed in Australia, we expanded into the United States, opening our first fiber cement plant in Fontana, California in February 1990. Since then, we have expanded our product portfolio and global footprint, with fiber cement manufacturing plants across the United States, Australia and the Philippines. In April 2018, we completed the acquisition of Fermacell, a market leader in fiber gypsum and cement-bonded boards in Europe.
Our Agreement with Asbestos Injuries Compensation Fund
Prior to 1987, ABN 60 Pty Limited (formerly James Hardie Industries Limited, then the ultimate parent company of the James Hardie Group) (“ABN 60”) and two of its former subsidiaries, Amaca Pty Limited (“Amaca”) and Amaba Pty Limited (“Amaba”) (collectively, the “Former James Hardie Companies”), manufactured products in Australia that contained asbestos. The manufacture and sale of these products has resulted in liabilities for the Former James Hardie Companies in Australia.
In February 2007, our shareholders approved the Amended and Restated Final Funding Agreement (“AFFA”) entered into on 21 November 2006 to provide long-term funding to Asbestos Injuries Compensation Fund ("AICF") for the compensation of proven Australian-related personal injuries for which the Former James Hardie Companies are found liable. AICF, an independent trust, subsequently assumed ownership of the Former James Hardie Companies. We do not own AICF, however, we are
| | | | | |
| |
James Hardie 2021 Annual Report on Form 20-F | 3 |
| |
entitled to appoint three directors, including the Chairman, and the New South Wales (“NSW”) Government is entitled to appoint two directors.
Under the terms of the AFFA, James Hardie 117 Pty Ltd (the “Performing Subsidiary”) will make annual payments to AICF. The amount of these annual payments is dependent on several factors, including our free cash flow (as defined in the AFFA), actuarial estimations, actual claims paid, operating expenses of AICF, changes in the AUD/USD exchange rate and the annual cash flow cap. JHI plc owns 100% of the Performing Subsidiary and guarantees the Performing Subsidiary’s obligation. As a result, for US GAAP purposes, we consider JHI plc to be the primary beneficiary of AICF.
Although we have no legal ownership in AICF, for financial reporting purposes, our interest in AICF is considered variable and we consolidate AICF due to our pecuniary and contractual interests in AICF as a result of the funding arrangements outlined in the AFFA. For additional information on our consolidation of AICF and asbestos-related assets and liabilities, see Note 1 to our consolidated financial statements in Section 2.
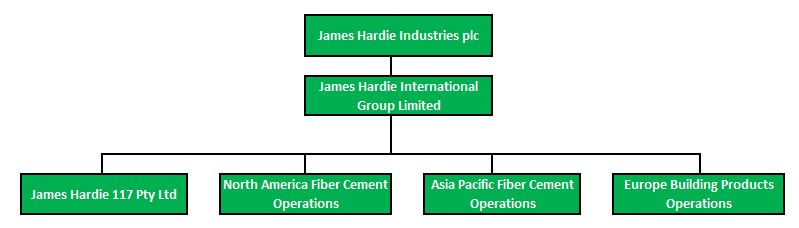
Corporate Structure
The following diagram summarizes our corporate structure at 31 March 2021:
| | | | | |
| |
James Hardie 2021 Annual Report on Form 20-F | 4 |
| |
Business Overview
General Overview of Our Business
We are a world leader in the manufacture of fiber cement building materials. Based on net sales, we believe we are the largest manufacturer of fiber cement products and systems for external and internal building construction applications in the United States, Australia and the Philippines. We market our fiber cement products and systems under various brand names, such as HardiePlank®, HardiePanel®, HardieTrim® and HardieBacker®, and other brand names such as Aspyre Collection by James Hardie™, Artisan®, Reveal®, Cemplank®, Scyon® and Linea®. We are also a market leader in the European premium timber frame and dry lining business, especially in Germany, Switzerland and Denmark. We market our fiber gypsum and cement-bonded boards under the Fermacell® brand and our fire-protection boards under the AESTUVER® brand.
The Company currently has three operating segments: North America Fiber Cement, Asia Pacific Fiber Cement and Europe Building Products. See Notes 2 and 18 to our consolidated financial statements in Section 2 for a description of our operating segments and a breakdown of our net sales by operating segment and geographic market for each of our last three fiscal years.
Products
We manufacture fiber cement, fiber gypsum and cement bonded boards. Our fiber cement building materials includes a wide-range of products for both external and internal use across a broad range of applications, including external applications: siding, cladding, trim, soffit; and internal applications: walls, floors, ceilings. While there are some market specific products, our core fiber cement products, planks and flat panels are sold across all of the markets in which we operate. Our fiber gypsum and cement-bonded boards are used mainly for interior applications such as dry lining walls, walls in timber frame buildings and flooring solutions. In addition, our cement-bonded boards are used in exterior and industrial applications as well as for fire protection.
Products Used in External Applications
We developed a proprietary technology platform that enables us to produce thicker yet lighter-weight fiber cement products that are generally easier to handle than most traditional building products. Further, we believe that our fiber cement products provide certain durability and performance advantages leading to improved maintenance, while offering comparable aesthetics to competing products, such as wood, and superior aesthetics when compared to vinyl siding.
Performance and design advantages:
•Our fiber cement products exhibit resistance to the damaging effects of moisture, fire, impact and termites compared to natural and engineered wood and wood-based products;
•Competing products do not duplicate fiber cement aesthetics;
•Our fiber cement products provide the ability to imprint designs that closely resemble the patterns and profiles of traditional building materials such as wood and stucco;
•The surface properties of our products provide an effective paint-holding finish, especially when compared to natural and engineered wood products, allowing for greater periods of time between necessary maintenance and repainting; and
•Compared to masonry construction, fiber cement is lightweight, physically flexible and can be cut using readily available tools, making our products more appealing across a broad range of architectural styles, be it of timber or steel-framed construction.
| | | | | |
| |
James Hardie 2021 Annual Report on Form 20-F | 5 |
| |
We believe the benefits associated with our fiber cement products have enabled us to gain a competitive advantage over competing products.
Products Used in Internal Applications
Compared to natural and oriented strand board ("OSB") and wood-based products, we believe our product range for internal applications provide the same general advantages provided by our products for external applications. In addition, our fiber cement products for internal applications exhibit less movement in response to exposure to moisture and impact damage than many competing products, providing a more consistent and durable substrate on which to install tiles. Further, we believe our ceramic tile underlayment products exhibit better handling and installation characteristics compared to fiberglass mesh cement boards. We believe our fiber gypsum products offer superior stability, fire safety and sound insulation properties compared to OSB and gypsum plaster boards. Furthermore, we believe our fiber gypsum flooring solutions offer superior handling properties, especially in the modernization of existing buildings, compared to wet screed solutions.
Significant New Products
In North America, new products released over the last three years include Hydrodefense® HardieBacker® boards, expanded ColorPlus® Technology offering through the Dream CollectionTM and Statement CollectionTM, and higher ventilation VentedPlus® HardieSoffit® boards.
In Asia Pacific, we have extended our product portfolio in both wood look and non-wood look exteriors. Over the last three years, the range of Linea®, Linea® Oblique and Stria® cladding products has been broadened to increase design versatility in line with modern design trends.
In Europe, new fiber cement products released over the past three years include HardieFoamTM, a solution for install of HardieBacker®. In our Fermacell business, new products released over the last three years include AESTUVER® Tx board, a key milestone for our fire protection boards.
Principal Markets for Our Products
Fiber Cement
In the US and Canada, the largest application for fiber cement building products is in external siding for the residential building industry.
Competition in this market comes primarily from substitute products, such as natural wood or OSB, vinyl, stucco and brick. We believe we can continue to increase our market share from these competing products through targeted marketing programs designed to educate customers and homeowners on our brand and the performance, design and cost advantages of our products.
In the Asia Pacific region, we principally sell into the Australian, New Zealand and Philippines markets, with the residential building industry representing the principal market for fiber cement products. The largest applications of fiber cement across our three primary markets are in external applications: siding, cladding, trim, soffit; and internal applications: walls, floors, ceilings.
In Australia, competition from imports and two locally based fiber cement manufacturers continues to be strong. Additionally, we have competition from natural and engineered wood, wallboard, masonry and brick products. In New Zealand and the Philippines, competitor fiber cement imports continue as manufacturers look to supplement their primary operating environments with additional markets.
| | | | | |
| |
James Hardie 2021 Annual Report on Form 20-F | 6 |
| |
In Europe, our fiber cement building products are used in both residential and commercial building applications in external siding, soffits and internal tile underlayment for walls and floors.
Fiber Gypsum and Cement-Bonded Boards
James Hardie Europe's Fermacell brand products are sold into the residential repair and remodel, commercial and residential new construction markets. Fermacell brand of products comprise fiber gypsum and cement-bonded boards, two complementary products in the high performance board space, mainly used in timber frame construction, commercial dry lining projects and repair and remodel. Cement bonded boards are also used for several fire protection projects including tunnels.
Our key markets for Fermacell brand products in Europe include Germany, Switzerland, UK, Denmark, France, Belgium, Netherlands and Luxembourg, where we sell our products to residential and commercial new-build as well as to repair and remodel. In addition, our fire protection AESTUVER® boards are sold to projects worldwide.
Seasonality
We do not have significant seasonality, however our businesses typically follow activity levels in the building and construction industry.
Raw Materials
The principal raw materials used in the manufacture of our fiber cement products are cellulose fiber (wood-based pulp), silica (sand), Portland cement and water. The key raw materials used in the manufacture of our fiber gypsum products are gypsum, recycled paper and water. We have established supplier relationships for all of our raw materials across the various markets in which we operate, and we do not anticipate having difficulty in obtaining our required raw materials from these suppliers. The purchase price of these raw materials and other materials can fluctuate depending on the supply-demand situation at any given point in time.
We work hard to reduce the effect of both price fluctuations and supply interruptions by entering into contracts with qualified suppliers and through continuous internal improvements in both our products and manufacturing processes.
Cellulose Fiber
Reliable access to specialized and consistent quality pulp is critical to the production of fiber cement building materials. As a result of our many years of experience and expertise in the industry, we share our internal expertise with pulp producers in New Zealand, the United States, Canada and Chile to ensure they are able to provide us with a highly specialized and proprietary formula crucial to the reinforcing cement matrix of our fiber cement products. We have confidentiality agreements with our pulp producers, and we have obtained patents in the United States and in certain other countries covering certain unique aspects of our pulping formulas and processes that we believe cannot adequately be protected through confidentiality agreements. However, we cannot be assured that our intellectual property and other proprietary information will be protected in all cases. See “Section 3 – Risk Factors.”
Silica
High purity silica is sourced locally by the various production plants. In the majority of locations, we use silica sand as a silica source. In certain other locations, however, we process quartz rock and beneficiate silica sand to ensure the quality and consistency of this key raw material.
| | | | | |
| |
James Hardie 2021 Annual Report on Form 20-F | 7 |
| |
Cement
Cement is acquired in bulk from local suppliers. We continue to evaluate options on agreements with suppliers for the purchase of cement that can lock in our cement prices over longer periods of time.
Water
We primarily use local water supplies and process all wastewater to comply with environmental requirements.
Gypsum
The primary types of gypsum used in the production of our fiber gypsum products are natural and synthetic gypsum. Natural gypsum is extracted and processed in Germany and Spain. Synthetic gypsum is obtained from power plants in Germany, Poland and the Netherlands. While synthetic gypsum will be phased out due to the coal power plant phase-out in the European Union, we are well positioned for the future with natural gypsum sources. In Germany, we have secured long-term contracts for the supply of natural gypsum and we have invested in a natural gypsum mine in Spain.
Recycled Paper
Recycled paper is generally acquired from local suppliers and we currently maintain long-term contracts with our key suppliers.
Sales, Marketing and Distribution
Our brand names, customer education in comparative product advantages, differentiated product range and customer service, including technical advice and assistance, provide the basis for our marketing strategy. In fiscal year 2022, the Company will be launching It's Possible™, a global integrated marketing campaign that seeks to empower homeowners to realize their dream home. The campaign is inclusive of television commercials, programmatic digital, social media, public relations, influencer and dynamic media partnerships, and more.
We offer our customers support through a specialized sales force and customer service infrastructure in North America, Australia, New Zealand, the Philippines and Europe.
Our customer service infrastructure includes inbound customer service support coordinated nationally in each country, and is complemented by outbound telemarketing capability. Within each regional market, we provide sales and marketing support to building products dealers and lumber yards and also provide support directly to the customers of these distribution channels, principally homebuilders and building contractors.
We maintain dedicated regional sales management teams in our major sales territories who maintain relationships with national and other major accounts. Our various sales forces, which in some instances manage specific product categories, include skilled trades people who provide on-site technical advice and assistance.
In North America, we sell our exterior fiber cement products for repair and remodel and new residential construction through a combination of distributors, dealers and lumber yards. Where sales are to distributors, they then sell these products to dealers or lumber yards. Our interior fiber cement products in North America are typically sold through the large home center retailers and specialist distributors or dealers. Our products are distributed across North America primarily by road and, to a lesser extent, by rail.
| | | | | |
| |
James Hardie 2021 Annual Report on Form 20-F | 8 |
| |
In Australia and New Zealand, both new construction and repair and remodel products are sold through a combination of distributors, dealers and lumber yards. In the Philippines, a network of thousands of small to medium size retail outlets sell our fiber cement products to consumers, builders and real estate developers and DIY type stores. The physical distribution of our product in each country is primarily by road, rail or sea transport.
In Europe, both new construction and repair and remodel products are primarily sold to builder’s merchants and DIY type stores. These customers then sell the products to applicators such as dry liners, timber frame companies, smaller applicators and end consumers. Our products are distributed across Europe primarily by road and rail and, to a lesser extent, by sea transport.
Despite the fact that distributors and dealers are generally our direct customers, we also aim to increase primary demand for our products by marketing our products directly to homeowners, architects and builders. We encourage them to specify and install our products because of the quality and craftsmanship of our products.
Geographic expansion of our fiber cement business has occurred in markets where framed construction is prevalent for residential applications or where there are opportunities to change building practices from masonry to framed construction. Expansion is also possible where there are direct substitution opportunities irrespective of the methods of construction. With the exception of our current major markets, as well as Japan and certain rural areas in Asia, and Eastern Europe, most markets in the world principally utilize masonry construction for external walls in residential construction. Accordingly, further geographic expansion depends substantially on our ability to provide alternative construction solutions and for those solutions to be accepted in those markets.
Dependence on Trade Secrets and Research and Development (“R&D”)
We pioneered the successful development of cellulose reinforced fiber cement and, since the early-1980s, have progressively introduced products developed as a result of our proprietary product formulation and process technology. The introduction of differentiated products is one of the core components of our global business strategy. This product differentiation strategy is supported by our significant investment in R&D activities.
We view spending on R&D as the key to sustaining our existing product leadership position, by providing a continuous pipeline of innovative new products and technologies with sustainable performance and unique design advantages over our competitors. Further, through our investments in new process technology or by modifying existing process technology, we aim to keep reducing our capital and operating costs and to find new ways to make existing and new products. As such, we expect to continue allocating significant funding to these endeavors.
Our current patent portfolio is based mainly on fiber cement compositions, associated manufacturing processes and the resulting products. Our non-patented technical intellectual property consists primarily of our operating and manufacturing know-how and raw material and operating equipment specifications, all of which are maintained as trade secret information. We have enhanced our abilities to effectively create, manage and utilize our intellectual property and have implemented a strategy that increasingly uses patenting and trade secret protection to protect and increase our competitive advantage.
In addition, we have a variety of industrial, commercial and financial contracts relating to our proprietary manufacturing processes. While we are dependent on the competitive advantage that these items provide as a whole, we are not dependent on any one of them individually and do not consider any one of them individually to be material. We do not materially rely on intellectual property licensed from any outside third parties. However, we cannot assure that our intellectual property and other proprietary
| | | | | |
| |
James Hardie 2021 Annual Report on Form 20-F | 9 |
| |
information will be protected in all cases. In addition, if our R&D efforts fail to generate new, innovative products or processes, our overall profit margins may decrease and demand for our products may fall. See “Section 3 – Risk Factors.”
Governmental Regulation
As an Irish plc, we are governed by the Irish Companies Act 2014 and are also subject to all applicable European Union level legislation. We also operate under the regulatory requirements of numerous jurisdictions and organizations, including the ASX, ASIC, the NYSE, the SEC, the Irish Takeover Panel and various other federal, state, local and foreign rulemaking bodies. See “Section 3 – Constitution” for additional information regarding the Irish Companies Act 2014 and regulations to which we are subject.
Environmental, Health and Safety Regulation
Our operations and properties are subject to extensive federal, state, local and foreign environmental protection, health and safety laws, regulations and ordinances governing activities and operations that may have adverse environmental effects. As it relates to our operations, regulated material, including wastewater and air emissions, may be produced at some of our manufacturing plants. The wastewater produced from our manufacturing plants is internally recycled and reused before eventually being discharged to publicly owned treatment works, a process which is monitored by us, as well as by regulators. In addition, we actively monitor air emissions and other regulated materials produced by our plants so as to ensure compliance with the various environmental regulations under which we operate.
Some environmental laws provide that a current or previous owner or operator of real property may be liable for the costs of investigation, removal or remediation of certain regulated materials on, under, or in that property or other impacted properties. In addition, persons who arrange, or are deemed to have arranged, for the disposal or treatment of certain regulated materials may also be liable for the costs of investigation, removal or remediation of the regulated materials at the disposal or treatment site, regardless of whether the affected site is owned or operated by such person. Environmental laws often impose liability whether or not the owner, operator, transporter or arranger knew of, or was responsible for, the presence of such regulated materials. Also, third parties may make claims against owners or operators of properties for personal injuries, property damage and/or for clean-up associated with releases of certain regulated materials pursuant to applicable environmental laws and common law tort theories, including strict liability.
In the past, from time to time, we have received notices of alleged discharges in excess of our water and air permit limits. In each case, and in compliance with our Environmental Policy, we have addressed the concerns raised in those notices, in part, through enhanced administrative controls and/or capital expenditures intended to prevent future discharges in excess of permitted levels and, on occasion, the payment of minor associated fines.
Environmental compliance costs in the future will depend, in part, on continued oversight of operations, expansion of operations and manufacturing activities, regulatory developments and future requirements that cannot presently be predicted.
| | | | | |
| |
James Hardie 2021 Annual Report on Form 20-F | 10 |
| |
Organizational Structure
JHI plc is incorporated and domiciled in Ireland and the table below sets forth our significant subsidiaries, all of which are wholly-owned by JHI plc, either directly or indirectly, as of 30 April 2021.
| | | | | | | | | | | | | | |
| Name of Company | | Jurisdiction of
Establishment | | Jurisdiction of
Tax Residence |
| Fermacell B.V. | | Netherlands | | Netherlands |
| Fermacell Schraplau GmbH | | Germany | | Germany |
| James Hardie 117 Pty Ltd | | Australia | | Australia |
| James Hardie Australia Pty Ltd | | Australia | | Australia |
| James Hardie Building Products Inc. | | United States | | United States |
| James Hardie Europe B.V. | | Netherlands | | Netherlands |
| James Hardie Europe GmbH | | Germany | | Germany |
| James Hardie Europe Holdings GmbH | | Germany | | Germany |
| James Hardie Holdings Limited | | Ireland | | Ireland |
| James Hardie International Finance Designated Activity Company | | Ireland | | Ireland |
| James Hardie International Group Limited | | Ireland | | Ireland |
| James Hardie International Holdings Limited | | Ireland | | Ireland |
| James Hardie NL1 B.V. | | Netherlands | | Netherlands |
| James Hardie NL2 B.V. | | Netherlands | | Netherlands |
| James Hardie NZ Holdings Limited | | New Zealand | | New Zealand |
| James Hardie North America, Inc | | United States | | United States |
| James Hardie Philippines Inc | | Philippines | | Philippines |
| James Hardie Research Pty Ltd | | Australia | | Australia |
| JH Research USA, LLC | | United States | | United States |
| James Hardie Spain S.L.U. | | Spain | | Spain |
| James Hardie Technology Holdings 1 Limited | | Ireland | | Ireland |
| James Hardie Technology Holdings 2 Limited | | Ireland | | Ireland |
| James Hardie Technology Limited | | Bermuda | | Ireland |
| James Hardie U.S. Investments Sierra Inc. | | United States | | United States |
| RCI Holdings Pty Ltd | | Australia | | Australia |
| | | | | |
| |
James Hardie 2021 Annual Report on Form 20-F | 11 |
| |
Property, Plants and Equipment
We believe we have some of the largest and lowest cost fiber cement manufacturing plants across the United States, Australia and the Philippines, with our plants servicing both domestic and export markets. We also have six manufacturing plants in Europe. Our plants are ideally located to take advantage of established transportation networks, allowing us to distribute our products into key markets, while also providing easy access to key raw materials.
Manufacturing Capacity
At 31 March 2021, we had manufacturing facilities at the following locations:
| | | | | | | | | | | | | | |
| Plant Location | | Owned /
Leased | | Nameplate Capacity (mmsf)1 |
| United States fiber cement | | | | |
| Cleburne, Texas | | Owned | | 666 | |
| Peru, Illinois | | Owned | | 560 | |
| Plant City, Florida | | Owned | | 600 | |
| Pulaski, Virginia | | Owned | | 600 | |
| Reno, Nevada | | Owned | | 300 | |
| Tacoma, Washington | | Owned | | 500 | |
| Waxahachie, Texas | | Owned | | 360 | |
| Fontana, California | | Owned | | 250 | |
Prattville, Alabama 2 | | Owned | | 300 | |
| Asia Pacific fiber cement | | | | |
| Rosehill, New South Wales, Australia | | Owned | | 180 | |
| Carole Park, Queensland, Australia | | Owned | | 260 | |
Cabuyao City, Philippines | | Owned | | 172 | |
| Europe fiber gypsum | | | | |
| Münchehof, Germany | | Owned | | 441 | |
| Orejo, Spain | | Owned | | 275 | |
| Wijchen, the Netherlands | | Owned | | 273 | |
| Siglingen, Germany | | Owned | | 154 | |
| Other | | | | |
Calbe, Germany 3 | | Owned | | 41 | |
Schraplau, Germany 3 | | Owned | | N/A |
____________
1The calculated annual nameplate capacity in the United States, Europe and Asia Pacific is based on management’s historical experience with our production process and is calculated assuming continuous operation, 24 hours per day, seven days per week, producing 5/16” medium density product at a targeted operating speed. No accepted industry standard exists for the calculation of our fiber cement, fiber gypsum and cement bonded board manufacturing facility nameplate, design and utilization capacities.
2The first sheet machine in Prattville, Alabama was commissioned in Q4 of fiscal year 2021, with nameplate capacity of 300 mmsf. The second sheet machine is expected to be commissioned in July 2021, for a total nameplate capacity in Prattville, Alabama of 600 mmsf at the end of fiscal year 2022.
3 Our Calbe, Germany plant produces cement bonded boards. Our Schraplau, Germany facility is a raw materials processing facility for our fiber gypsum plants. As a result, no annual nameplate capacity is available.
We continually evaluate the capacity required to service the housing markets in which we operate to ensure we meet demand and achieve our market penetration objectives. For a discussion of significant active and recently completed capacity expansion projects, see “Capital Expenditures” below.
| | | | | |
| |
James Hardie 2021 Annual Report on Form 20-F | 12 |
| |
Management has determined that for measuring the annual design capacity of the fiber cement and fiber gypsum network, the calculation should incorporate our expected production based upon our historical experience with certain factors such as demand, product mix of varying thickness and density, batch size, plant availability, differing production speeds and downtime expectations.
Based on the methodology noted above, for the year ended 31 March 2021 and 2020, we had an annual fiber cement flat sheet design capacity of 4,180 mmsf and 4,330 mmsf in the United States, respectively, and 720 mmsf and 730 mmsf in Asia Pacific, respectively. For the years ended 31 March 2021 and 2020, we had an annual design capacity of 720 mmsf and 790 mmsf, respectively, for our European fiber gypsum plants. It is important to note that annual design capacity does not necessarily reflect the actual capacity utilization rates of our manufacturing facilities. Actual utilization is calculated using actual production, which is affected by factors such as demand, product mix, batch size, plant availability and production speeds. For fiscal year 2021, actual capacity utilization across our fiber cement and fiber gypsum plants was an average of 83%, 79% and 84% in the United States, Europe and Asia Pacific, respectively. For fiscal year 2020, actual capacity utilization across our fiber cement and fiber gypsum plants was an average of 79%, 77% and 90% in the United States, Europe and Asia Pacific, respectively.
Mines
In North America, we lease silica quartz mine sites in Tacoma, Washington and Reno, Nevada. The lease for our quartz mine in Tacoma, Washington expires in February 2022 (with additional options to renew). The lease for our silica quartz mine site in Reno, Nevada expires in January 2024. We also own property in Victorville, California which could be mined for silica. As of 30 April 2021, we have not begun to mine this site and have no immediate plans to do so.
As a mine operator in the US, we are required by Section 1503(a) of the Dodd-Frank Wall Street Reform and Consumer Protection Act (the “Dodd-Frank Act”), and rules promulgated by the SEC implementing that section of the Dodd-Frank Act, to provide certain information concerning mine safety violations and other regulatory matters concerning the operation of our mines. During fiscal year 2021, we did not receive any notices, citations, orders, legal action or other communication from the US Department of Labor’s Mine Safety and Health Administration that would necessitate additional disclosure under Section 1503(a) of the Dodd-Frank Act. Similarly, we have not experienced any mining-related fatalities in our mining operations. There are currently no pending legal actions before the Federal Mine Safety and Health Review Commission related to our mining operations.
Our Fermacell business has an operating license for a mining facility in Schraplau, Germany, however no active mining is being undertaken, or allowed with respect to the former owner FELS-WERKE GmbH, and the mine is only being used for storage of material. We also have an investment in a natural gypsum mine in Spain.
| | | | | |
| |
James Hardie 2021 Annual Report on Form 20-F | 13 |
| |
Capital Expenditures
We utilize a mix of operating cash flow and debt facilities to fund our capital expenditure projects and investments. We continuously invest in safety, equipment maintenance and upgrades, and capacity to ensure continued environmental compliance and operating effectiveness of our plants. The following table sets forth our capital expenditures for the three most recent fiscal years:
| | | | | | | | | | | | | | | | | | | | |
| | | (Millions of US dollars) |
| | | 2021 | | 2020 | | 2019 |
| North America Fiber Cement | | $ | 76.8 | | | $ | 137.1 | | | $ | 246.8 | |
| Asia Pacific Fiber Cement | | 18.3 | | | 32.2 | | | 41.1 | |
| Europe Building Products | | 13.5 | | | 23.5 | | | 26.0 | |
| Other Businesses | | — | | | — | | | 1.5 | |
| R&D and Corporate | | 2.1 | | | 1.0 | | | 2.1 | |
| Total Capital Expenditures | | $ | 110.7 | | | $ | 193.8 | | | $ | 317.5 | |
Significant active capital expenditures
At 31 March 2021, the following significant capital expenditures related to capacity projects remain in progress:
| | | | | | | | | | | | | | | | | | | | | | | | | | | | | | | | |
| Project Description | | Approximate
Investment
(US millions) | | Investment
to date
(US millions) | | Project
Start Date | | Expected
Commission
Date | | Expected Nameplate Capacity Increase (mmsf) 1 |
| Prattville Greenfield expansion | | $ | 240.0 | | | $ | 233.8 | | | Q4FY18 | | FY22 | | 600 |
1 The first sheet machine in Prattville, Alabama was commissioned in Q4 of fiscal year 2021, with nameplate capacity of 300 mmsf. The second sheet machine is expected to be commissioned in July 2021, for a total nameplate capacity in Prattville, Alabama of 600 mmsf at the end of fiscal year 2022. |
Significant completed capital expenditure projects
The following is a list of significant capital expenditure projects we have invested in over the three most recent fiscal years:
| | | | | | | | | | | | | | |
| Project Description | | Total
Investment
(US Millions) | | Fiscal Year of
Expenditure |
| Philippines capacity expansion | | 18.0 | | | FY16 - FY19 |
| Tacoma Greenfield expansion | | 147.0 | | | FY17 - FY20 |
Carole Park Brownfield expansion
| | $ | 22.0 | | | FY19 - FY21 |
Capital Divestitures
During the three most recent fiscal years, we did not make any material capital divestitures. We do not consider the exit from our Penrose, New Zealand plant a material divestiture but a strategic decision to shift to an import sales model.
| | | | | |
| |
James Hardie 2021 Annual Report on Form 20-F | 14 |
| |
DIRECTORS, SENIOR MANAGEMENT AND EMPLOYEES
James Hardie Executive Team
Our management is overseen by our executive team, whose members cover the key areas of finance, human resources, investor relations, legal, manufacturing, marketing, operations, production, R&D and sales.
Members of our management executive team at 30 April 2021 are:
| | | | | |
Jack Truong BS, PhD Chief Executive Officer Age 58 |
| Dr Jack G. Truong joined James Hardie as President of International Operations in April 2017. Dr Truong was announced Chief Executive Officer ("CEO") successor and appointed President and Chief Operating Officer with the responsibility of running the Company's global business in September 2018. He was officially appointed CEO in January 2019.
Dr Truong’s ability to anticipate global market trends and deliver profitable revenue growth is evidenced by his extensive multinational and multisector business experience. Prior to James Hardie, Dr Truong was the President and Chief Executive Officer of leading home appliance manufacturer, Electrolux North America Inc, a $5+ billion revenue and 14,000+ employee business at the time of his leadership.
|
Before joining Electrolux, Dr Truong enjoyed a successful 22-year career at 3M Company, where he held senior leadership roles throughout the United States, Europe and Asia-Pacific, including Vice President and General Manager of the Global Construction and Home Improvements Division and Global Office Supplies Division.
As an engineer and inventor himself – earning his PhD in chemical engineering from the Rensselaer Polytechnic Institute in New York – Dr Truong is the recipient of 11 U.S. patents and several international patents. Dr Truong also enjoys giving time to philanthropic causes and professional industry associations, receiving multiple accolades for his humanitarian work and business accomplishments. |
| | | | | |
| |
James Hardie 2021 Annual Report on Form 20-F | 15 |
| |
| | | | | |
Jason Miele BA Chief Financial Officer Age 44 |
| Jason Miele was appointed as Chief Financial Officer (“CFO”) in February 2020. As CFO he oversees the Company’s overall financial activities, including accounting, tax, treasury, performance and competitor analysis, internal audit, financial operations, information systems, and investor and media relations.
Mr Miele has over 14 years of experience with James Hardie and has served in a number of important roles during his tenure, including most recently, as Vice President – Investor and Media Relations, a position he held from February 2017. In that role, Mr Miele had responsibility for overseeing James Hardie’s investor relations strategy and communicating James Hardie’s business strategy and its financial performance to various stakeholders including shareholders, investment analysts, and the financial media. |
Prior to that, Mr Miele served in a variety of roles of increasing responsibility, in finance functions such as Treasury, Controllership and Operational Finance, including reporting to the CFO as the Global Treasurer and later the Global Controller. Mr Miele has supported the James Hardie business during his tenure, working in multiple geographies including Dublin, Ireland, Amsterdam, Netherlands, Mission Viejo, California and Chicago, Illinois in the United States and most recently, Sydney, Australia. Mr Miele has a Bachelor’s Degree from the University of California at Santa Barbara, where he graduated with a degree in Business Economics with an emphasis in Accounting. |
| | | | | |
Julie Katigan BA, MA Chief Human Resources Officer Age 54 |
| Julie Katigan joined James Hardie as Chief Human Resources Officer (“CHRO”) in May 2019. As CHRO she has responsibility for the Company’s global human resource activities, including employee engagement, leadership and talent development and human resources strategy.
Most recently, Ms Katigan was the Senior Vice President, Human Resources for XPO Logistics’ Americas and Asia Pacific Supply Chain business unit, responsible for approximately 25,000 employees in 400 locations across the globe.
Prior to XPO Logistics, Ms Katigan held senior human resources leadership roles in both business partnering and specialty areas such as Talent Management and |
Organizational Development, with well-established companies that included Colfax Corporation, Electrolux, Mead Johnson Nutrition and Ford Motor Company.
Ms Katigan has a Bachelor of Arts degree in English and a Master’s degree in Labor and Industrial Relations from Michigan State University.
|
| | | | | |
| |
James Hardie 2021 Annual Report on Form 20-F | 16 |
| |
| | | | | |
Joe Blasko BSFS, JD General Counsel, Chief Compliance Officer and Company Secretary Age 54 |
| Joe Blasko joined James Hardie as General Counsel and Chief Compliance Officer in June 2011 and was appointed Company Secretary in June 2020. Mr Blasko has responsibility for the Company's legal and regulatory compliance, corporate governance, enterprise risk management and government relations. Before joining James Hardie, Mr Blasko was Assistant General Counsel, and later, the General Counsel at Liebert Corporation, an Emerson Network Power Systems company and wholly-owned subsidiary of Emerson Electric Co. In his four years with Liebert/Emerson, Mr Blasko was responsible for establishing the legal department in Columbus, Ohio, managing and overseeing all legal matters and working closely with the executive management team. In this role, Mr Blasko also had global responsibilities which required expertise across multiple jurisdictions.
|
From 2004 to 2006, Mr Blasko was Associate General Counsel at The Scotts Miracle-Gro Company, serving as the effective “general counsel” to numerous corporate divisions within the organization. From 1997 to 2004, Mr Blasko gained considerable regulatory and litigation expertise working at Vorys, Sater, Seymour and Pease LLP in Ohio. Mr Blasko has a Juris Doctor from Case Western Reserve University in Cleveland, Ohio, USA and a Bachelor of Science in Foreign Service from Georgetown University, USA, with a specialty in International Relations, Law and Organizations. |
| | | | | |
Sean Gadd BEng, MBA Executive Vice President – North America Commercial Age 48 |
| Sean Gadd joined James Hardie in 2004 as a Regional Engineering Manager for the Asia Pacific business, and progressed to Plant Manager for both the Carole Park and Rosehill facilities in Australia. Mr Gadd then moved to the US in 2006 to take the role of Manufacturing Manager for Trim and various manufacturing facilities across the US. In 2009, Mr Gadd ran the US trim business for James Hardie with responsibility for both Manufacturing and Sales, followed by a brief assignment leading Supply Chain. In 2012, Mr Gadd was promoted to the role of Vice President of Sales for Western USA and Canada. Over the next year, his role was expanded to include the Midwest and Northeast of the USA.
|
Mr Gadd was appointed Executive General Manager in September 2013 with full responsibility for the Northern Division and in October 2015, he was appointed Executive Vice President, Markets and Segments, North America with responsibility for Strategic Marketing and Development. In December 2018, Mr Gadd was appointed Executive Vice President, North America Commercial with responsibility for sales, products, segments and marketing. Mr Gadd has a Bachelor of Engineering in Manufacturing Management and an executive MBA from the Australian Graduate School of Management, Australia. |
| | | | | |
| |
James Hardie 2021 Annual Report on Form 20-F | 17 |
| |
| | | | | |
Robert Stefansic, BSc, MBA Executive Vice President – North America, End-to-End Supply Chain Age 59 |
| Bob Stefansic joined James Hardie as Executive Vice President, North America, End-to-End Supply Chain in July 2020. In his role, Mr Stefansic is responsible for driving operational efficiencies and improvements across the supply chain, with emphasis on delivering business value via the Hardie Manufacturing Operating System. His direct responsibilities include manufacturing, supply chain and all central operations support functions. Mr Stefansic held various Senior Operations leadership roles throughout his career prior to joining James Hardie. Most recently he was the Chief Operations Officer at Ingredion Incorporated, a $6 billion leading ingredients supplier to the food and beverage industry. There he was responsible for all global operations including a |
network of 50 manufacturing plants and supply chains across Asia, Europe, North America and South America. Additionally, he previously held manufacturing leadership roles at Valspar, General Chemical and Allied-Signal corporations. Mr Stefansic is a graduate of the University of South Carolina, where he received an MBA and a Bachelor of Science degree in Chemical Engineering. |
| | | | | |
Johnny Cope, BA Senior Vice President – North America Sales Age 53 |
| Johnny Cope joined James Hardie in February 2019 as the Senior Vice President, North America Sales with responsibility for delivering the James Hardie value proposition, trusted brand and products, best-in-class supply chain and technical service framework to the Company's most valued customers. Mr Cope has 25 years of industry experience serving Dealers, Distributors, Builders and Contractors. For the decade prior to this role, he was responsible for the Builder/Contract business for Electrolux Major Appliances North America. For the 10 years before joining Electrolux, Mr Cope had multiple Builder/Contract roles in the Appliance division of the General Electric Company. During the last |
6 years at GE, he was responsible for the Contract Appliance's South West Contract Region of the United States. Mr Cope has a Bachelor's Degree from Texas Tech University, where he graduated with a degree in Business Administration with an emphasis on Marketing. |
| | | | | |
| |
James Hardie 2021 Annual Report on Form 20-F | 18 |
| |
| | | | | |
Ryan Kilcullen BSc, MS Senior Vice President – North America Supply Chain Operations Age 40 |
| Ryan Kilcullen joined James Hardie in 2007 as a PcI/PdI Engineer. Since then, he has worked for the Company in various manufacturing and supply chain roles including Process Engineer, Production Manager, and Supply Chain Engineer. In 2012, he became Supply Chain Manager, ColorPlus® Business Unit, responsible for the end-to-end design and performance of our ColorPlus® product line supply chain. In 2013, he became responsible for North American Supply Chain operations, with responsibilities that included Procurement, Network Planning, Production Planning, Transportation, Distribution Management, Customer Service, and Inside Sales. In June 2015, he was appointed Vice President – Central Operations, responsible for the Company’s Supply Chain Operations and Centralized Manufacturing functions. |
In August 2016, he was appointed Executive Vice President – North America Operations, responsible for the Company’s Supply Chain, Manufacturing, Engineering and Environmental, Health & Safety Operations. Mr Kilcullen has a Bachelor of Science in Industrial Engineering from Rensselaer Polytechnic Institute and a Master of Engineering in Logistics from Massachusetts Institute of Technology. |
| | | | | |
Jörg Brinkmann MS, PhD General Manager, Europe Age 42 |
| Dr Jörg Brinkmann joined James Hardie as General Manager, Europe in April 2018 as part of the Fermacell GmbH acquisition. In this role he is responsible for running the Company’s European activities, which are headquartered in Düsseldorf, Germany. Before joining James Hardie, Dr Brinkmann held several German as well as international leadership roles in Sales and Marketing at the Xella Group (the former owner of the Fermacell business) starting in 2005. In 2014 he was appointed CEO of the former Fermacell Company with responsibility for the entire business. Under his leadership, the company achieved significant profitable growth.
|
Dr Brinkmann holds a Masters degree (“Diplom-Kaufmann”) from the University of Duisburg-Essen as well as a PhD from the University of Hohenheim, Germany.
|
| | | | | |
| |
James Hardie 2021 Annual Report on Form 20-F | 19 |
| |
Board of Directors
James Hardie’s non-executive directors have widespread experience, spanning general management, finance, manufacturing, marketing and accounting. Each non-executive director also brings valuable international experience that assists with James Hardie’s growth. For additional information, see "Section 1 - Corporate Governance Report" of this Annual Report.
Members of the Board of Directors (the “Board”) at 30 April 2021 are:
| | | | | |
Michael Hammes BS, MBA Age 79 |
| Michael Hammes was elected as an independent non-executive director of James Hardie in February 2007. He was appointed Chairman of the Board in January 2008 and is a member of the Remuneration Committee and the Nominating and Governance Committee. Experience: Mr Hammes has extensive commercial experience at a senior executive level. He has held a number of executive positions in the medical products, hardware and home improvement, and automobile sectors, including CEO and Chairman of Sunrise Medical, Inc. (2000-2007), Chairman and CEO of Guide Corporation (1998-2000), Chairman and CEO of Coleman Company, Inc. (1993-1997), Vice Chairman of Black & Decker Corporation (1992-1993) and |
various senior executive roles with Chrysler Corporation (1986-1990) and Ford Motor Company (1966-1986). Directorships of listed companies in the past five years: Former – Director of Navistar International Corporation (1996-2017); Director of DynaVox Mayer-Johnson (2010-2016). Other: Resident of the United States. Last elected: August 2018 Term expires: August 2021 |
| | | | | |
| |
James Hardie 2021 Annual Report on Form 20-F | 20 |
| |
| | | | | |
David D. Harrison BA, MBA, CMA Age 74 |
| David Harrison was appointed as an independent non-executive director of James Hardie in May 2008. He is Chairman of the Remuneration Committee and a member of the Audit Committee. Experience: Mr Harrison is an experienced company director with a finance background, having served in corporate finance roles, international operations and information technology for 22 years with Borg Warner/General Electric Co. His previous experience includes 10 years at Pentair, Inc., as Executive Vice President and CFO (1994-1996 and 2000-2007) and Vice President and CFO roles at Scotts, Inc. and Coltec Industries, Inc. (1996-2000). |
Directorships of listed companies in the past five years: Current – Director of National Oilwell Varco (since 2003). Other: Resident of the United States. Last elected: August 2019 Term expires: August 2022 |
| | | | | |
Andrea Gisle Joosen MSc, BSc Age 57 |
| Andrea Gisle Joosen was appointed as an independent non-executive director of James Hardie in March 2015. She is a member of the Audit Committee. Experience: Ms Gisle Joosen is an experienced former executive with extensive experience in marketing, brand management and business development across a range of different consumer businesses. Her former roles include Chief Executive of Boxer TV Access AB in Sweden and Managing Director (Nordic region) of Panasonic, Chantelle AB and Twentieth Century Fox. Her early career involved several senior marketing roles with Procter & Gamble and Johnson & Johnson. |
Directorships of listed companies in the past five years: Current – Director of BillerudKorsnas AB (since 2015); Director of Dixons Carphone plc (since 2014); Director of ICA Gruppen AB (since 2010). Former – Director of Mr Green AB (2015 - 2019). Other: Director of Logent AB (since 2019); Director of Qred AB (since 2019); Director of Acast AB (since 2018); Director of Neopitch AB (since 2004); resident of Sweden. Last elected: August 2018 Term expires: August 2021 |
| | | | | |
| |
James Hardie 2021 Annual Report on Form 20-F | 21 |
| |
| | | | | | | | | | | | | | |
Persio V. Lisboa BS Age 55 | | | |
| Persio Lisboa was appointed as an independent non-executive director of James Hardie in February 2018. He is a member of the Remuneration Committee and the Nominating and Governance Committee. Experience: Mr Lisboa has extensive senior executive experience. He currently serves as President and Chief Executive Officer of Navistar, Inc. (Navistar), a leading manufacturer of commercial trucks, buses, defense vehicles and engines, a position he has held since July 2020. Prior to that position, Mr Lisboa served as the Executive Vice President and Chief Operating Officer of Navistar from March 2017 to July 2020. Prior to that, Mr Lisboa served as President, Operations of Navistar from November 2014 to March 2017. Prior to that, Mr Lisboa served as |
Senior Vice President, Chief Procurement Officer of Navistar from December 2012 to November 2014, as Vice President, Purchasing and Logistics and Chief Procurement Officer of Navistar from October 2011 to November 2012, and as Vice President, Purchasing and Logistics of Navistar from August 2008 to October 2011. Prior to these positions, Mr Lisboa held various management positions within Navistar’s North American and South American operations. Mr Lisboa began his career at Maxion International Motores Brasil, followed by a move to International Engines Argentina S.A., and then to MWM-International South America. |
Directorships of listed companies in the past five years: Former - Director of Broadwind Energy, Inc. (2016-2018). Other: Resident of the United States. Last elected: August 2018 Term expires: August 2021
|
| | | | | |
| |
James Hardie 2021 Annual Report on Form 20-F | 22 |
| |
| | | | | |
Anne Lloyd, BS, CPA Age 59 |
| Anne Lloyd was appointed as an independent non-executive director of James Hardie in November 2018. She is Chair of the Audit Committee and a member of the Remuneration Committee. Experience: Ms Lloyd, an experienced corporate and finance executive, served as Chief Financial Officer of Martin Marietta Materials, Inc. a leading supplier of aggregates and heavy building materials, for over 12 years from June 2005 until her retirement in August 2017. She joined Martin Marietta in 1998 as Vice President and Controller and was promoted to Chief Accounting Officer in 1999. She was subsequently appointed Treasurer (2006-2013) and promoted to Executive Vice President in 2009. Earlier in her career, Ms Lloyd spent 14 years with Ernst & Young |
LLP (1984-1998), latterly as a senior manager and client service executive for the natural resources, mining, insurance and healthcare industries. Directorships of listed companies in the past five years: Current - Director of Insteel Industries, Inc (since April 2019); Director of Highwoods Properties, Inc. (since 2018). Former - Director of Terra Nitrogen Company, L.P. (2009-2018). Other: Resident of the United States. Last elected: August 2019 Term expires: August 2022
|
| | | | | |
Moe Nozari BA, MS, PhD and Postdoctoral Research Fellow Age 78 |
| Dr Moe Nozari was appointed as an independent non-executive director of James Hardie in November 2019. He is a member of the Nominating and Governance Committee.
Experience: Dr Nozari worked at 3M for thirty eight years. Latterly, he served as an Executive Vice President of Consumer and Office Business at 3M Company, from 2002 until his retirement from 3M in July 2009. Prior to that he served as an Executive Vice President of Consumer and Office Markets at 3M Company from 1999 to 2002 and served as its Group Vice President of Consumer and Office Markets Group from 1996 to 1999. Dr Nozari joined 3M, in the Central Research Laboratories in 1971 and advanced to the position of Technical Director of the Photographic Products Division. |
After a succession of managerial and business responsibilities in 1986 he was named a Division Vice President, then a Group Vice President in 1996. While at 3M his focus was on the development of new products, brands, identification, and development of people.
Other: Resident of the United States. Last elected: August 2020 Term expires: August 2023 |
| | | | | |
| |
James Hardie 2021 Annual Report on Form 20-F | 23 |
| |
| | | | | |
Rada Rodriguez MSc Age 62 |
| Rada Rodriguez was appointed as an independent non-executive director of James Hardie in November 2018. She is a member of the Nominating and Governance Committee. Experience: Ms Rodriguez serves as Chief Executive Officer of Signify DACH, part of the Signify Group, a world leader in connected LED lighting systems, software and services, since May 2021. She previously served as Chief Executive Officer of Schneider Electric GmbH, part of Schneider Electric Group, a global energy management and automation company and served as Senior Vice President, Corporate Alliances until 2021. On joining the company in 1999, she held a |
progression of senior roles including Head of International Research and Development for Schneider Electric Sweden, and Senior Vice President and Zone President, Central and Eastern Europe. Prior to joining Schneider Electric GmbH, she worked at Lexel Group (later acquired by Schneider) and before that she worked for 5 years at Colasit Scandinavia AB, a Swiss industrial machinery manufacturer. She started her career with K-Konsult AB, a Swedish technical consulting firm with a focus on installation technology where she worked for 5 years as a design engineer. Directorships of listed companies in the past five years: Former – Director of Eltel AB (2015-2017). Other: Director of Messe Berlin GmbH (since 2019); Director of ZVEI (since 2014); resident of Germany. Last elected: August 2019 Term expires: August 2022 |
| | | | | |
| |
James Hardie 2021 Annual Report on Form 20-F | 24 |
| |
| | | | | |
Suzanne B Rowland MS, BS Age 59 |
| Suzanne B Rowland was appointed as an independent non-executive director of James Hardie in February 2021. She is a member of the Audit Committee. Experience: Ms Rowland has a diverse set of functional experiences and brings business leadership experience across a wide range of complex global specialty materials and industrial businesses. She most recently served as Group Vice President of the Industrial Specialties business at Ashland Global Holdings Inc. from 2016 to 2019 where she aligned commercial and asset strategies and drove focused execution resulting in profitable growth. |
Prior to this, Ms Rowland served in separate Vice President and General Manager roles in Tyco International between 2009 and 2015. During this time in multiple divisions of the company, she led significant improvement in customer relationships, market position, and operational execution. Before joining Tyco International, Ms Rowland worked for Rohm and Haas Company for over twenty years, where she also held multiple senior executive roles. Directorships of listed companies in the past five years: Current – Director of Sealed Air Corporation (since 2020); Director of SPX Flow, Inc. (since 2018); Director of L.B. Foster Co. (since 2008). Other: Resident of the United States. Last elected: Ms Rowland will be standing for election at the August 2021 Annual General Meeting. |
| | | | | |
Dean Seavers MBA, BBA Age 60 |
| Dean Seavers was appointed as an independent non-executive director of James Hardie in February 2021. He is a member of the Audit Committee. Experience: Mr Seavers is a seasoned senior leader of transformation and turnaround strategies and currently serves as Chairman of Pacific Gas & Electric Utility. Mr Seavers most recently served as President and Executive Director of National Grid plc’s U.S. business, in which he led a fundamental business transformation with a focus on improving financial performance, safety and employee engagement. Prior to holding this position, Mr Seavers served in senior executive positions at Red Hawk Fire & Security LLC, United Technologies Fire & |
Security Corp. and GE Security and spent seven years with Tyco International, holding multiple senior operating roles. During this time, Mr Seavers advanced through learning and applying best in class operating systems and tools such as Lean and Six Sigma. Earlier in his career, Mr Seavers worked at Ford Motor Company and PepsiCo Inc., which led him to an entrepreneurial opportunity as Managing Director and co-owner of Flex-Tech Communications. Directorships of listed companies in the past five years: Current – Director of PG&E Corporation (since 2020); Chairman and Director of Pacific Gas & Electric Utility (since 2020); Director of Albemarle Corporation (since 2018). Former – Director of National Grid plc (2015-2020). Other: Resident of the United States. Last elected: Mr Seavers will be standing for election at the August 2021 Annual General Meeting. |
| | | | | |
| |
James Hardie 2021 Annual Report on Form 20-F | 25 |
| |
| | | | | |
Nigel Stein CA, BSc Age 65 |
| Nigel Stein was appointed as an independent non-executive director of James Hardie in May 2020. He is the Chairman of the Nominating and Governance Committee and is a member of the Audit Committee. Experience: Mr Stein has extensive experience in the global automotive and manufacturing sectors. He currently serves as Chairman of Inchcape plc (Inchcape), an automotive distribution, retail and financing company, a position he has held since May 2018. Mr Stein joined Inchcape as a non-executive director in October 2015.
Prior to holding this position, Mr Stein served as Chief Executive Officer of GKN plc |
(GKN) from January 2012 to December 2017. He joined the automotive and aerospace components supplier in 1994 and during his time with GKN held various senior positions in general management and finance including six years as Group Chief Financial Officer. Earlier in his career, Mr Stein held senior finance positions with Laird plc and Hestair plc. From 2003 until 2011, he served as an independent non-executive director on the Board of Ferguson (formerly Wolseley) plc, the leading specialist distributor of plumbing and heating products in North America and the UK. Mr Stein is a member of the Institute of Chartered Accountants of Scotland. Directorships of listed companies in the past five years: Current – Director of Inchcape plc (since 2015). Former – Director of GKN plc (2001-2017). Other: Resident of the United Kingdom. Last elected: November 2020 Term expires: August 2023 |
| | | | | |
| |
James Hardie 2021 Annual Report on Form 20-F | 26 |
| |
| | | | | |
Harold Wiens BS Age 74 |
| Harold Wiens was appointed as an independent non-executive director of James Hardie in May 2020. He is a member of the Remuneration Committee. Experience: Mr Wiens worked at 3M Company (3M) for thirty-eight years. He served as Executive Vice President, Industrial Business and Transportation Business from 1998 until his retirement from 3M in 2006. It is 3M’s largest and most diverse business serving many different end markets ranging from electronic to automotive and aerospace manufacturing. During this time, Mr Wiens restructured the business, leading a global implementation of Six Sigma that drove significant international growth.
|
Prior to holding this position, Mr Wiens served as Executive Vice President, Sumitomo 3M, 3M’s largest subsidiary, headquartered in Tokyo, Japan, from 1995 to 1998 and served as Data Storage Business Leader and Vice President from 1988 to 1995 and as Memory Technologies Group Manufacturing Manager from 1983 to 1988. Mr Wiens began his career with 3M in 1968 and held many positions of increasing responsibility over his first fifteen years with 3M. Directorships of listed companies in the past five years: Current – Director of Bio-Techne Corporation (since 2014). Other: Resident of the United States. Last elected: November 2020 Term expires: August 2023 |
| | | | | |
| |
James Hardie 2021 Annual Report on Form 20-F | 27 |
| |
Remuneration Report
This Remuneration Report describes the executive remuneration philosophy, programs and objectives of the Remuneration Committee and the Board of Directors (the “Board”), as well as the executive remuneration plans and programs implemented by James Hardie.
We are not required to produce a remuneration report under applicable Irish, Australian or US rules or regulations. However, taking into consideration our significant Australian and US shareholder bases and our primary listing on the Australian Securities Exchange (“ASX”), we have voluntarily produced a remuneration report consistent with those provided by similarly situated companies for non-binding shareholder approval since 2005.
This Remuneration Report outlines the key remuneration plans and programs and share ownership information for our Board of Directors and certain of our senior executive officers (Chief Executive Officer (“CEO”), Chief Financial Officer (“CFO”) and the other three highest paid executive officers based on total compensation that was earned or accrued for fiscal year 2021) (“Senior Executive Officers”) in fiscal year 2021, and also includes an outline of the key changes for fiscal year 2022. Further details of these changes are set out in the 2021 Notice of Annual General Meeting (“AGM”).
For fiscal year 2021, our senior executive officers are:
•Dr Jack Truong, Chief Executive Officer;
•Jason Miele, Chief Financial Officer;
•Sean Gadd, Executive Vice President, North America Commercial;
•Joe Blasko, General Counsel and Chief Compliance Officer; and
•Ryan Kilcullen, Senior Vice President – North America Supply Chain Operations.
This Remuneration Report has been adopted by our Board on the recommendation of the Remuneration Committee.
| | | | | |
| |
James Hardie 2021 Annual Report on Form 20-F | 28 |
| |
EXECUTIVE SUMMARY
Fiscal Year 2021 Business Highlights1
Our operating results for fiscal year 2021 reflected strong and disciplined financial performance, highlighted by adjusted net income of US$458 million and adjusted earnings before interest and taxes (“EBIT”) of US$629 million, an increase of 30% and 29%, respectively, compared to fiscal year 2020. In addition, we achieved net sales of US$2.9 billion, an increase of 12% compared to fiscal year 2020, and US$1.03 adjusted diluted earnings per share.
The following graphs show our performance for key financial measures during fiscal year 2021, with a comparison to prior corresponding periods:
____________
1Please see the "Glossary of Abbreviations and Definitions" in Section 4 of this Annual Report for a reconciliation of non-GAAP financial measures used in this Remuneration Report to the most directly comparable US GAAP financial measure.
| | | | | |
| |
James Hardie 2021 Annual Report on Form 20-F | 29 |
| |
Fiscal Year 2021 Compensation Highlights
Our fiscal year 2021 compensation continued to reflect and promote our pay-for-performance philosophy and our stated goal to position Senior Executive Officer fixed base salary and benefits at the median and total target direct remuneration (comprising fixed and target variable remuneration) at the 75th percentile of our Peer Group (defined herein), if stretch short- and long-term target performance goals are met.
The following is a summary of the key aspects and events that occurred relative to the Company’s remuneration policies, programs and arrangements during the course of fiscal year 2021:
•The core plan design for the FY2021 Company Performance Plan ("CP Plan") or Individual Performance Plan ("IP Plan") did not change. The CP Plan continues to measure both Growth and Returns when assessing Company performance and shareholder value creation. However, in the unprecedented and unpredictable market conditions related to the COVID-19 pandemic, we simplified the plan metrics, and strengthened the connection between consistent revenue growth and strong returns. A complete description of the CP Plan for fiscal year 2021 is set out in the section titled “Incentive Arrangements” later in this Remuneration Report.
•No changes were made to the design of the Long-Term Incentive ("LTI") Plan for fiscal year 2021. The LTI plan remains similar to the fiscal year 2020 plan with updated financial targets. A complete description of the LTI program, including the applicable performance hurdles, is set out in the section titled “Incentive Arrangements” later in this Remuneration Report.
Fiscal Year 2021 Total Target Compensation
Remuneration packages for Senior Executive Officers reflect our remuneration philosophy and comprise a mixture of fixed base salary, benefits and variable performance-based incentives. The Remuneration Committee seeks to appropriately balance fixed and variable remuneration in order to align our total compensation structure with our pay-for-performance philosophy. The following chart summarizes total target compensation awarded to each Senior Executive Officer in fiscal year 2021:
| | | | | | | | | | | | | | | | | |
| Summary of Fiscal Year 2021 Senior Executive Officer Target Compensation |
| Senior Executive Officer | FY2021 Annual Base Salary (US$) | FY2021 STI Target Value (US$) | FY2021 LTI Target Value (US$) | FY2021 Total Target Compensation (US$) |
| J Truong | 900,000 | 1,125,000 | 3,475,000 | 5,500,000 |
| J Miele | 416,000 | 249,600 | 450,000 | 1,115,600 |
| S Gadd | 577,830 | 346,698 | 800,000 | 1,724,528 |
| J Blasko | 459,900 | 275,940 | 500,000 | 1,235,840 |
| R Kilcullen | 380,544 | 228,326 | 400,000 | 1,008,870 |
| | | | | |
| |
James Hardie 2021 Annual Report on Form 20-F | 30 |
| |
Results of 2020 Remuneration Report Vote
In November 2020, our shareholders were asked to cast a non-binding advisory vote on our remuneration report for the fiscal year ended 31 March 2020. Although we are not required under applicable Irish, Australian or US laws or regulations to provide a shareholder vote on our executive remuneration practices, the Board believes that it is important to engage shareholders on this important issue and we have voluntarily submitted our remuneration report for non-binding shareholder approval on an annual basis since 2005 and currently intend to continue to do so.
At our 2020 Annual General Meeting, our shareholders approved our remuneration report, with 97.5% of the votes cast in support of our remuneration program. The Remuneration Committee considered the results of this advisory vote, together with investor feedback and other factors and data associated with strategic priorities discussed in this Remuneration Report, in determining our executive remuneration policies, objectives and decisions and related shareholder engagement efforts for fiscal year 2021.
APPROACH TO SENIOR EXECUTIVE REMUNERATION
Remuneration Philosophy
As our main business and all of our Senior Executive Officers are located in the US, our remuneration philosophy is to provide our Senior Executive Officers with an overall package that is competitive with Peer Group companies exposed to the US housing and consumer durables market. Within this philosophy, the executive remuneration framework emphasizes operational excellence and shareholder value creation through incentives that link executive remuneration with the interests of shareholders. Our remuneration plans and programs are structured to enable us to: (i) attract and retain talented executives; (ii) reward outstanding individual and corporate performance; and (iii) align the interests of our executives to the interests of our shareholders, with the ultimate goal of improving long-term value for our shareholders. This pay-for-performance system continues to serve as the framework for executive remuneration, aligning the remuneration received with the performance achieved.
Composition of Remuneration Packages
In line with our remuneration philosophy, our goal is to position Senior Executive Officer fixed base salary and benefits at the median and total target direct remuneration (comprising fixed and target variable remuneration) at the 75th percentile of our Peer Group, if stretch short- and long-term target performance goals are met. Performance goals for target variable performance-based incentive remuneration are set with the expectation that we will deliver results in the top quartile of our Peer Group. Performance below this level will result in variable remuneration payments below target (and potentially zero for poor performance). Performance above this level will result in variable remuneration payments above target.
`
| | | | | |
| |
James Hardie 2021 Annual Report on Form 20-F | 31 |
| |
Relative Weightings of Fixed and Variable Remuneration
The charts below detail the relative weightings of fixed versus variable remuneration for the CEO and other Senior Executive Officers for fiscal year 2021. Fixed remuneration includes base salary and variable remuneration is comprised of target Short-Term Incentive ("STI") awards and the following three LTI components: (i) Relative Total Shareholder Return ("TSR") Restricted Stock Units ("RSUs"); (ii) Return on Capital Employed ("ROCE") RSUs; and (iii) Scorecard LTI at target, each of which are discussed in more detail in this Remuneration Report.
Setting Remuneration Packages
Remuneration decisions are based on the executive remuneration philosophy and framework described in this Remuneration Report. The Remuneration Committee reviews and the Board approves this framework each year.
Remuneration packages for Senior Executive Officers are evaluated each year to make sure that they continue to align with our compensation philosophy, are competitive with our Peer Group and developments in the market, and continue to support our business structure and objectives. In making decisions regarding individual Senior Executive Officers, the Remuneration Committee takes into account both the results of an annual remuneration positioning review provided by the Remuneration Committee’s independent advisers and the Senior Executive Officer’s responsibilities and performance.
All aspects of the remuneration package for our CEO and CFO are determined by the Remuneration Committee and ratified by the Board. All aspects of the remuneration package for the remaining Senior Executive Officers are determined by the Remuneration Committee on the recommendation of the CEO.
Remuneration Committee Governance
The remuneration program for our Senior Executive Officers is overseen by our Remuneration Committee, the members of which are appointed by the Board. As prescribed by the Remuneration Committee Charter, the duties of the Remuneration Committee include, among other things: (i) administering and making recommendations on our incentive compensation and equity-based remuneration plans; (ii) reviewing the remuneration of directors; (iii) reviewing the remuneration framework for the Company; and (iv) making recommendations to the Board on recruitment, retention and termination policies and procedures for senior management. The current members of the
| | | | | |
| |
James Hardie 2021 Annual Report on Form 20-F | 32 |
| |
Remuneration Committee are David Harrison (Chairman), Michael Hammes, Persio Lisboa, Anne Lloyd and Harold Wiens, all of whom are independent non-executive directors. A more complete description of these and other Remuneration Committee functions is contained in the Remuneration Committee’s Charter, a copy of which is available in the Corporate Governance section of the Investor Relations page on our website (www.ir.jameshardie.com.au).
Summary of Executive Compensation Practices
The following table summarizes certain of the key governance practices employed by the Remuneration Committee relative to our executive compensation practices, including those practices which we believe are important drivers of both short- and long-term corporate performance and those practices which we believe are not aligned with the long-term interests of our shareholders:
| | | | | | | | | | | |
| Compensation Practices We Employ |
ü | Retain independent compensation advisers reporting directly to the Remuneration Committee | û | Prohibition on hedging of stock held by executives and directors |
ü | Pay for performance model, with approximately 84% of our CEO’s total target compensation being performance-based “at risk” compensation and an average of approximately 66% total target compensation being performance-based “at risk” compensation for our other Senior Executive Officers
| û | Limited employment agreements and severance arrangements |
ü | Circuit breaker on annual STI awards to ensure that no annual incentive awards are paid unless minimum NA growth and corporate performance levels are achieved
| û | Limited change-in-control benefits |
ü | Set share ownership requirements for all directors and Senior Executive Officers
| û | No dividends paid on unvested equity awards |
ü | Broad clawback policy on performance-based compensation | û | Limited perquisites and other benefits |
ü | Set performance-based vesting conditions for all equity grants to Senior Executive Officers
| û | No annual time-based LTI equity grants to Senior Executive Officers
|
ü | Provide the Remuneration Committee with ability to exercise “negative” discretion when determining the vesting and payout of our LTI programs
| û | No excessive retirement or deferred compensation arrangements |
Remuneration Advisers
As permitted by the Remuneration Committee Charter, the Remuneration Committee retained Aon Hewitt (in the US) and Guerdon Associates (in Australia) as its independent advisers for matters regarding remuneration for fiscal year 2021. The Remuneration Committee reviews the appointment of its advisers each year. Both Aon Hewitt and Guerdon Associates provided the Remuneration Committee with written certification during fiscal year 2021 to support their re-appointment. In those certifications, the advisers: (i) confirmed that their pay recommendations were made without undue influence from any member of our management; and (ii) provided detailed responses to the six independence factors a Remuneration Committee should consider under relevant NYSE rules, and confirmed their independence based on these factors.
The Remuneration Committee reviewed these certifications before re-appointing each adviser for fiscal year 2022.
| | | | | |
| |
James Hardie 2021 Annual Report on Form 20-F | 33 |
| |
Benchmarking Analysis
To assist the Remuneration Committee in making remuneration decisions, the Remuneration Committee evaluates the remuneration of our Senior Executive Officers against a designated set of companies (the “Peer Group”). The Peer Group, which is reviewed by the Remuneration Committee on an annual basis, consists of companies that are similar to us in terms of certain factors, including size, industry, and exposure to the US housing market. The Remuneration Committee believes that US market focused companies are a more appropriate peer group than ASX-listed companies, as they are exposed to the same macroeconomic factors in the US housing market as those we face. No changes were made to the Peer Group for fiscal year 2021. Set forth below are the names of the 20 companies comprising the Peer Group, which was used to benchmark the remuneration of our Senior Executive Officers in fiscal year 2021.
| | | | | | | | | | | | | | |
| Acuity Brands, Inc | Lennox International, Inc | Quanex Building Products Corp | |
| American Woodmark Corp | Louisiana-Pacific Corp | Simpson Manufacturing Co., Inc | |
| Apogee Enterprises, Inc | Martin Marietta Materials, Inc | Trex Co., Inc | |
| Armstrong World Industries, Inc | Masco Corporation | Valmont Industries, Inc | |
| Cornerstone Building Brands, Inc. | Mohawk Industries, Inc | Vulcan Materials Co | |
| Eagle Materials, Inc | Mueller Water Products, Inc | Watsco, Inc | |
| Fortune Brands Home & Security | Owens Corning | | |
Performance Linkage with Remuneration Policy
During its annual review, the Remuneration Committee assessed our performance in fiscal year 2021 against:
•our historical performance;
•our Peer Group;
•the goals in our STI and LTI variable remuneration plans; and
•the key objectives and measures the Board expects to see achieved, which are set forth in what is referred to as the “Scorecard” and further discussed later in this Remuneration Report.
Based on that review, the Board and the Remuneration Committee concluded that management’s performance in fiscal year 2021, during a pandemic, had on the whole extraordinary results of net sales growth and EBIT growth: (i) significantly above target on growth measures and significantly above target on return measures, resulting in STI variable remuneration outcomes above target for fiscal year 2021; and (ii) when taken together with performance in fiscal years 2019 and 2020, at approximately the 90th percentile of our Peer Group TSR performance (as of April 2021), significantly above expectations on ROCE performance, and met or exceeded expectations on long-term strategic measures included in the Scorecard, resulting in LTI variable remuneration being on average above target for fiscal years 2019-2021.
More details about this assessment are set out below in this Remuneration Report.
| | | | | |
| |
James Hardie 2021 Annual Report on Form 20-F | 34 |
| |
DESCRIPTION OF 2021 REMUNERATION ELEMENTS
Base Salaries and Other Fixed Remuneration Benefits
Base salary provides a guaranteed level of income that recognizes the market value of the position and internal equities between roles, as well as the individual’s capability, experience and performance. Annual base salary increases are not automatic. Base salaries for Senior Executive Officers are positioned around the market median for positions of similar responsibility and are reviewed by the Remuneration Committee each year.
In addition, Senior Executive Officers may receive certain other limited fixed benefits, such as medical and life insurance benefits, car allowances, participation in executive wellness programs and an annual financial planning allowance. For fiscal year 2021, the base salary and value of other fixed benefits for each of our Senior Executive Officers is provided in the Base Pay and Other Benefits columns of the remuneration table in the section titled “Remuneration Paid to Senior Executive Officers”.
Retirement Plan
In every country in which we operate, we offer employees access to pension, superannuation or individual retirement savings plans consistent with the laws of the respective country.
In the US, we sponsor a defined contribution plan, the James Hardie Retirement and Profit Sharing Plan (the “401(k) Plan”). The 401(k) Plan is a tax-qualified retirement and savings plan covering all US employees, including our Senior Executive Officers, subject to certain eligibility requirements as defined by the Internal Revenue Service (the "IRS"). In addition, we match employee contributions dollar for dollar up to a maximum of the first 6% of an employee’s eligible compensation.
Non-Qualified Deferred Compensation Plan
As of 1 January 2021, we sponsor a non-qualified deferred compensation plan, the James Hardie Executive Deferred Compensation Plan (the "Deferred Compensation Plan"). Participation in the Deferred Compensation Plan is generally limited to individuals whose annual salary exceeds the Internal Revenue Service ("IRS") limits applicable to our qualified plans or are participants in our Long-Term Incentive Plan (the "LTIP"). The Deferred Compensation Plan allows participants to elect to defer receipt of some or all of their salary or earned cash incentive to a later date. The Deferred Compensation Plan also restores matching employee contributions up to a maximum of the first 6% of an employee's eligible compensation that would not be eligible in the 401(k) Plan due to IRS contribution limits so long as the participant defers eligible compensation to the Deferred Compensation Plan.
| | | | | |
| |
James Hardie 2021 Annual Report on Form 20-F | 35 |
| |
Incentive Arrangements
In addition to the base salary and other fixed benefits provided to our Senior Executive Officers, the Remuneration Committee reviews and approves a combination of both short-term and long-term variable incentive programs on an annual basis. For fiscal year 2021, our variable incentive plans for Senior Executive Officers were as follows:
| | | | | | | | | | | |
| Duration | Plan Name | Amount | Form Incentive Paid |
| STI (1 year) | IP Plan | 20% of STI Target | Cash |
| CP Plan | 80% of STI Target | Cash |
| LTI (3 years) | LTIP | 25% of LTI Target | ROCE RSUs |
| | 25% of LTI Target | TSR RSUs |
| | 50% of LTI Target | Cash (Scorecard LTI) |
STI Plans
On an annual basis, the Remuneration Committee approves an STI target for all Senior Executive Officers, expressed as a percentage of base salary, which is allocated between individual goals and Company goals under the IP and CP Plans, respectively. For fiscal year 2021, the STI target percentage for Dr Truong was 125% of base salary and 60% for Messrs Miele, Gadd, Blasko and Kilcullen, with 80% allocated to the CP Plan and 20% allocated to the IP Plan for all Senior Executive Officers.
CP Plan
For fiscal year 2021, the core plan design was the same as prior years. We continued to measure both Growth and Returns when assessing Company performance and shareholder value creation. However, in the unprecedented and unpredictable market conditions related to the COVID-19 pandemic, we simplified the plan metrics, and strengthened the connection between consistent revenue growth and strong returns.
For fiscal year 2021, the metrics for all regions (North America, Asia Pacific and Europe) are a net revenue measure (Growth) and a profit measure (Returns). The metrics are each set with a threshold, target and maximum payout scale. Similar in concept to the matrices used previously and in order to incentivize exceptional company performance in an uncertain and highly volatile market, both net revenue AND profitability must be achieved together to derive a payout within the payout scale, reinforcing shareholder value creation. The maximum payout is 3.0x of target.
All Senior Executive Officers continued to be tied to the NA multiple either in part or in whole. Executives with NA responsibility are linked only to the NA multiple (Mr Gadd and Mr Kilcullen). For executives with global responsibility (Dr Truong and Messrs Miele and Blasko), their STI will be based on the metrics for North America and the net income of the Company.
IP Plan
Under the IP Plan, the Remuneration Committee approves a series of one-year individual performance goals which, along with our leadership behaviors, are used to assess the performance of our Senior Executive Officers. The IP Plan links financial rewards to the Senior Executive Officer’s achievement of specific objectives aligned with the strategic plan and contributions to shareholder value, but are not captured directly by financial measures in the CP Plan. Each Senior Executive Officer can receive
| | | | | |
| |
James Hardie 2021 Annual Report on Form 20-F | 36 |
| |
between 0% and 150% of their STI target allocated to the IP Plan with Board discretion to award up to 300% of target for members of the Executive Leadership Team (ELT).
The Remuneration Committee has reserved for itself discretion to change the STI paid. An example of when the Remuneration Committee would consider exercising this discretion includes external factors outside of management’s control, such as, a general shift in the housing market that is considered to have a sufficiently material impact on results. The Remuneration Committee will disclose the reasons for any such exercise of its discretion.
The Remuneration Committee believes that the payout scales are appropriate because they provide management with an incentive to achieve overall corporate goals, balance growth with returns, recognize the need to flexibly respond to strategic opportunities, and incorporate Remuneration Committee discretion to ensure appropriate outcomes.
STI Plan Performance for Fiscal Year 2021
Our CP Plan results and the subsequent STI payouts for fiscal year 2021 were significantly above target as a result of:
•The NA business performing significantly above target for both Net Revenue and EBIT
•The Asia Pacific business performing above target driven by both strong Net Revenue and EBIT growth in Australia, at target for objectives achieved in New Zealand and slightly below target for performance in the Philippines.
•The EU business performing significantly above target on Net Revenue and above target on EBIT and EBIT Margin.
In regards to the IP Plan, the Senior Executive Officers’ performance and the subsequent STI payouts for fiscal year 2021 were at or above target based on each Senior Executive Officer’s achievement of fiscal year 2021 one-year individual performance and core organizational values and leadership behavior goals.
For fiscal year 2021, the amount to be paid to each of our Senior Executive Officers under the STI Plans is provided in the STI Award column of the remuneration table, in the section titled “Remuneration Paid to Senior Executive Officers.”
LTI Plans
Each year, the Remuneration Committee approves an LTI target for all Senior Executive Officers. The approved target is allocated between three separate components to ensure that each Senior Executive Officer’s performance is assessed across factors considered important for sustainable long-term value creation:
•ROCE RSUs are used as they are an indicator of high capital efficiency required over time;
•Relative TSR RSUs are used as they are an indicator of our performance relative to our US Peer Group; and
•Scorecard LTI is an indicator of each Senior Executive Officer’s contribution to achieving our long-term strategic goals.
| | | | | |
| |
James Hardie 2021 Annual Report on Form 20-F | 37 |
| |
Awards issued under the LTI are issued pursuant to the terms of the LTIP. During fiscal year 2021, our Senior Executive Officers were granted the following awards under the LTIP:
| | | | | | | | | | | |
| ROCE RSUs | TSR RSUs | Scorecard LTI Units |
| J Truong | 82,131 | | 127,083 | | 246,394 | |
| J Miele | 10,636 | | 16,457 | | 31,907 | |
| S Gadd | 18,908 | | 29,256 | | 56,724 | |
| J Blasko | 11,817 | | 18,285 | | 35,452 | |
| R Kilcullen | 9,454 | | 14,628 | | 28,362 | |
RSUs issued under our LTI programs will be settled upon vesting in CHESS Units of Foreign Securities ("CUFS") on a 1-to-1 basis. Unless the context indicates otherwise, when we refer to our common stock, we are referring to the shares of our common stock that are represented by CUFS.
ROCE RSUs (25% of target LTI for Fiscal Years 2021-2023)
The Remuneration Committee introduced ROCE RSUs in fiscal year 2013 because the US housing market had stabilized to an extent which permitted the setting of multi-year financial metrics. The Remuneration Committee believes ROCE RSUs remain an appropriate component of the LTI Plan because they:
•tie the reward’s value to share price which provides alignment with shareholder interests;
•promote that we earn appropriate returns on capital invested;
•reward performance that is under management’s direct influence and control; and focus management on capital efficiency as the necessary precondition for the creation of additional shareholder value;
Consistent with recent prior years, the maximum payout for the ROCE RSUs is 2.0x target LTI. ROCE is determined by dividing Adjusted EBIT by Adjusted Capital Employed2. The ROCE hurdles will be indexed for changes to US and Asia Pacific addressable housing starts. The resulting Adjusted Capital Employed for each quarter of any fiscal year will be averaged to better reflect Capital Employed through a year rather than at a single point in time.
ROCE hurdles for the ROCE RSUs are based on historical results and take into account the US housing market and better optimization of our manufacturing plants. The three-year average ROCE for fiscal years 2018, 2019 and 2020 was 33.8%.
| | | | | |
| |
James Hardie 2021 Annual Report on Form 20-F | 38 |
| |
The hurdles for ROCE RSUs granted in fiscal year 2021 (for performance in fiscal years 2021 to 2023) remained the same as those granted in fiscal year 2019 and 2020 as follows:
| | | | | | | | | | | |
| Fiscal Years 2021-2023 ROCE | Amount of Target to Vest | |
| < 24.0% | 0.0x | |
| ≥ 24.0%, but < 26.0% | 0.5x | |
| ≥ 26.0%, but < 27.5% | 1.0x | |
| ≥ 27.5%, but < 28.5% | 1.5x | |
| > 28.5% | 2.0x | |
| | | |
At the conclusion of this three-year performance period, the Remuneration Committee will review management’s performance based on the quality of the returns balanced against management’s delivery of market share growth and performance against the Scorecard. Following this review, the Remuneration Committee can exercise negative discretion to reduce the number of shares received on vesting of the ROCE RSUs. This discretion can only be applied to reduce the number of shares which will vest.
____________
2 For purposes of ROCE RSU vesting, “Adjusted EBIT” and “Adjusted Capital Employed” will be calculated as follows:
“Adjusted EBIT” will be calculated as (i) EBIT as reported in our financial results; adjusted by (ii) excluding the earnings impact of legacy issues (such as asbestos adjustments); and (iii) adding back asset impairment charges in the relevant period, unless otherwise determined by the Remuneration Committee.
“Adjusted Capital Employed” will be calculated as Total Assets minus Current Liabilities as reported in our financial results; adjusted by: (i) excluding balance sheet items related to legacy issues (such as asbestos adjustments), dividends payable and deferred taxes; (ii) adding back asset impairment charges in the relevant period, unless otherwise determined by the Remuneration Committee; (iii) adding back leasehold assets for manufacturing facilities and other material leased assets; and (iv) deducting all greenfield construction-in-progress, and any brownfield construction-in-progress projects involving capacity expansion that are individually greater than US$20 million, until such assets reach commercial production and are transferred to the fixed asset register
ROCE RSUs Vesting in Fiscal Year 2021 (for Fiscal Years 2019-2021)
As a component of the fiscal year 2019 LTI Plan, we granted ROCE RSUs in August 2018. The ROCE RSUs comprised 25% of each Senior Executive Officer’s LTI target and were granted assuming 2.0x target. Vesting of the ROCE RSUs is dependent on the average ROCE performance for fiscal years 2019-2021 and is subject to the Remuneration Committee’s negative discretion based on its judgment regarding the quality of returns balanced against management’s delivery of market share growth. The ROCE performance hurdles for this grant were approved as follows:
| | | | | | | | | | | |
| ROCE Performance Level | Amount of Target to Vest | |
| < 24.0% | 0.0x | |
| ≥ 24.0%, but < 26.0% | 0.5x | |
| ≥ 26.0%, but < 27.5% | 1.0x | |
| ≥ 27.5%, but < 28.5% | 1.5x | |
| ≥ 28.5% | 2.0x | |
| | | |
Based on the average ROCE result for fiscal years 2019-2021 of 33.0%, 2.0x target of the ROCE RSUs granted will vest on August 17, 2021.
| | | | | |
| |
James Hardie 2021 Annual Report on Form 20-F | 39 |
| |
Relative TSR RSUs (25% of target LTI for Fiscal Years 2021-2023)
The Remuneration Committee believes that Relative TSR RSUs continue to be an appropriate component of the LTI Plan because they provide alignment with shareholders. Even if macro-economic conditions create substantial shareholder value, Senior Executive Officers will only receive payouts if the TSR of our shares exceeds a specified percentage of our Peer Group over a performance period.
Relative TSR RSUs have been a component of our LTI since fiscal year 2009. Consistent with recent prior years, the maximum payout for Relative TSR RSUs granted in fiscal year 2021 is 2.0x target LTI.
Relative TSR measures changes in our share price and the share prices of our Peer Group; and assumes all dividends and capital returns are reinvested when paid. For fiscal year 2021, our relative TSR performance will be measured against the Peer Group over a three-year performance period from grant date, with no re-testing. To eliminate the impact of short-term share price changes, the starting point and test date are measured using a 20 trading-day average closing price. Relative TSR RSUs will vest based on the following straight-line schedule:
| | | | | | | | | | | |
| Performance against Peer Group | Amount of Target to Vest | |
| < 40th Percentile | 0.0x | |
| 40th Percentile | 0.5x | |
| > 40th, but < 60th Percentile | Sliding Scale | |
| 60th Percentile | 1.0x | |
| > 60th, but < 80th Percentile | Sliding Scale | |
| ≥ 80th Percentile | 2.0x | |
The Remuneration Committee will continue to monitor the design of the Relative TSR RSU component of the LTI Plan for Senior Executive Officers with the aim of balancing investor preferences with the ability to motivate and retain Senior Executive Officers.
TSR RSUs Vested in Fiscal Year 2021
TSR RSUs Vested for Fiscal Years 2018-2020
As part of the fiscal year 2018 LTI Plan, in August 2017 we granted three-year Relative TSR RSUs to senior executives. Vesting of these Relative TSR RSUs was dependent on our TSR performance relative to the Peer Group in place at that time, based on the following schedule:
| | | | | | | | | | | |
| Performance against Peer Group | Amount of Target to Vest | |
| < 40th Percentile | 0.0x | |
| 40th Percentile | 0.5x | |
| > 40th, but < 60th Percentile | Sliding Scale | |
| 60th Percentile | 1.0x | |
| > 60th, but < 80th Percentile | Sliding Scale | |
| ≥ 80th Percentile | 2.0x | |
| | | | | |
| |
James Hardie 2021 Annual Report on Form 20-F | 40 |
| |
In August 2020, the first and only test of Relative TSR performance was completed, resulting in our TSR performance at the 80.9 percentile of the Peer Group in place at that time. As a result, 2.0x of target outstanding Relative TSR RSUs vested.
TSR RSUs Vested for Fiscal Years 2017-2019
In addition, the second test of the FY17 TSR RSUs was completed, resulting in our TSR performance at the 61.9 percentile of the Peer Group and as a result an additional .2875x of target vested. On 16 March 2021, the final test was completed resulting in TSR performance at the 76.1 percentile of the Peer Group and as a result .355x of target vested and the balance were cancelled.
Scorecard LTI (50% of target LTI for Fiscal Years 2021-2023)
Scorecard LTI has been a component of our LTI Plan since fiscal year 2010. Each year, the Remuneration Committee approves a number of key management objectives and the results it expects to see achieved in relation to these objectives. These objectives are incorporated into that year’s grant of Scorecard LTI. At the end of the three-year performance period, the Remuneration Committee assesses our Senior Executive Officers’ collective performance on each key objective and each individual Senior Executive Officer’s contribution to those achievements and the Board reviews this assessment. Senior Executive Officers may receive different ratings depending on the contribution they have made during the three-year performance period. Although most of the objectives in the Scorecard have quantitative targets, we consider some of the targets to be commercial-in-confidence. Consistent since fiscal year 2010, the maximum payout for Scorecard LTI is 3.0x target LTI.
The Remuneration Committee believes that the Scorecard LTI continues to be an appropriate component of its LTI Plan because it:
•allows the Remuneration Committee to set targets for and reward executives on a balance of longer-term financial, strategic, business, customer and organizational development goals which it believes are important contributors to long-term creation of shareholder value;
•ties the reward’s value to our share price over the medium-term; and
•allows flexibility to apply rewards across different countries, while providing Senior Executive Officers with liquidity to pay tax or other material commitments at a time that coincides with vesting of shares (via the other components of the LTI Plan), as payment is in cash.
No specific weighting is applied to any single objective and the final Scorecard assessment reflects an element of judgment by the Board. The Board may only exercise negative discretion (i.e., to reduce the amount of Scorecard LTI that will ultimately vest). It cannot enhance the maximum reward that can be received.
The amount received by Senior Executive Officers is based on both our share price performance over the three-year performance period and the Senior Executive Officer’s Scorecard rating. At the start of the three-year performance period, we calculate the number of units each Senior Executive Officer could have acquired if they received a maximum payout on the Scorecard LTI at that time (based on a 20 trading-day average closing price). Depending on the Senior Executive Officer’s performance, between 0.0x and 3.0x of the Senior Executive Officer’s Scorecard LTI awards will vest at the end of the three-year performance period. Each Senior Executive Officer will receive a cash payment based on our share price at the end of the period (based on a 20 trading-day average closing price) multiplied by the number of units they could have acquired at the start of the performance period, adjusted downward in accordance with their Scorecard rating.
| | | | | |
| |
James Hardie 2021 Annual Report on Form 20-F | 41 |
| |
Further details related to the Scorecard for fiscal year 2021, including the method of measurement, historical performance against the proposed measures and the Board of Director’s expectations, were previously set out in our Remuneration Report for fiscal year 2021. An assessment of our Scorecard performance for fiscal years 2019-2021 is set out below. We will provide an explanation of the final assessment of performance under the Scorecard for fiscal years 2021-2023 at the conclusion of fiscal year 2023.
Scorecard LTI Vesting in Fiscal Year 2021 (for Fiscal Years 2019-2021)
After fiscal year 2021, the Remuneration Committee reviewed our performance over fiscal years 2019-2021 against the Scorecard objectives set forth in fiscal year 2019, and the contribution of individual Senior Executive Officers towards the achievement of such objectives. As a result of this evaluation, the Remuneration Committee determined that Senior Executive Officers would receive a weighted average Scorecard rating between 0.75x and 3.0x of target.
| | | | | | | | |
| Performance Measure/Rationale | Performance Metric/Results | Board Assessment for the Three-year Period |
Grow market share in all our businesses and geographies
A key strategy for the Company is to maximize its market share growth/retention of the exterior cladding market for new housing starts and for repair & remodel markets. | Goal: NA Primary Demand Growth ("PDG") above market, EBIT Margin, EBIT Growth.
Result: Recognized significant growth in NA exteriors over the three-year period with FY2021 PDG of +9%.. In addition, EBIT Margin for FY21 was 28.8% with EBIT Growth of 25%. | Performance exceeded expectations |
People
Continue to invest in the development and promotion of our people and reduce turnover. | Goal: Continued focus on turnover, driving the North American turnover to below 15% by the end of the three year period. Execute a successful succession plan. Successful recruitment, hiring and onboarding of business leaders and development of bench strength.
Result: Succession plan successfully executed resulting in appointment of Dr Jack Truong as CEO on 31 January 2019. Significant improvements in the hiring of key talent at the executive level. Average total annual turnover decreased from 19.7% to 8.6% during the 3-year period and exceeded the turnover target. Demonstrated improvement in the critical areas of leadership behaviors and cultural change. | Performance exceeded expectations |
| | | | | |
| |
James Hardie 2021 Annual Report on Form 20-F | 42 |
| |
| | | | | | | | |
| Performance Measure/Rationale | Performance Metric/Results | Board Assessment for the Three-year Period |
Safety — Zero Harm
The safety of our employees is an essential objective of the Company. | Goal: The safety of all employees is an essential objective of the company. Zero Harm (zero fatalities) and implement a housekeeping, facility maintenance and safety management system in our plants globally.
Result: Implemented Zero Harm strategy during the three year period. Implemented the Hardie Maintenance and Operating System (HMOS) in all plants in Australia, NA during FY2020 and Europe in FY2021 with great success resulting in more engaged employees, decreased employee turnover and safer more efficient manufacturing processes. | Performance exceeded expectations |
Hardie Advantage Manufacturing
Adequate capacity, and effective machine utilization, product quality, and service are critical to delivering future growth and optimizing returns through a more efficient manufacturing network. | Goal: First pass quality and service as well as sheet machine Pcl/Pdl metrics for sheet machine. Reduce unit costs by 3% indexed for mix and PPV.
Result: Implemented HMOS in all plants in NA, Australia and Europe. Realized savings through Lean in North America of $51.5M since implementing in Q4 FY19. Unit cost was reduced by approximately 7% from FY19.
| Performance exceeded expectations |
International: APAC and Europe
Pursue organic growth in all international markets. | Goal: James Hardie Australia ("JHA") growth above market of 3.5% while maintaining category share. James Hardie New Zealand ("JHNZ") annual growth above market of 3.5% while maintaining category share. Growth of Scyon product line and introduction of new products in APAC over the three-year period. James Hardie Europe ("JHEU") was to successfully integrate, grow the Fermacell business and develop a business plan to manufacture fiber cement products that meet European market needs.
Result: JHA average annual growth has not met expectation. Category share has been retained. Scyon revenue growth on average increased 7.7% share, which exceeded three-year goals.
JHNZ did not perform well in FY2020 and rebounded in FY2021 with a PDG of 6.3% compared to -10.5% in FY2020.
JHEU: Successful acquisition of Fermacell in FY2018 with the transition completed in FY2019. Fiber Cement sales increased since FY2018 on average 16% annually. | Performance met expectations |
| | | | | |
| |
James Hardie 2021 Annual Report on Form 20-F | 43 |
| |
CHANGES TO REMUNERATION FOR FISCAL YEAR 2021
Remuneration for Fiscal Year 2022
During May 2021, the Board, with the assistance of the Remuneration Committee and its independent remuneration advisers, undertook its annual review of our existing remuneration policies, programs and arrangements and determined to implement certain changes for fiscal year 2022.
CEO Compensation
For fiscal year 2022, the CEO’s base salary will be increased 11% to US$1,000,000, which will bring base salary closer to the market median of the peer group. In addition, Dr Truong’s LTI target will be increased to US$5,750,000 for FY2022.
Other Senior Executive Officer Compensation
Base pay, target STI and LTI increases in fiscal year 2022 for the CEO and other Senior Executive Officers are as follows:
| | | | | | | | | | | | | | | | | | | | |
| Base Salary | Target STI | LTI Target |
| Name | Fiscal Year 2021 (US$) | Fiscal Year 2022 (US$) | Fiscal Year 2021 (US$) | Fiscal Year 2022 (US$) | Fiscal Year 2021 (US$) | Fiscal Year 2022 (US$) |
| J Truong | 900,000 | 1,000,000 | | 125% | 125% | 3,475,000 | 5,750,000 | |
| J Miele | 416,000 | 500,000 | | 60% | 60% | 450,000 | 600,000 | |
| S Gadd | 577,830 | 577,830 | | 60% | 60% | 800,000 | 800,000 |
| J Blasko | 459,900 | 471,398 | | 60% | 60% | 500,000 | 500,000 |
| R Kilcullen | 380,544 | 380,544 | | 60% | 60% | 400,000 | 300,000 | |
Mr Miele is receiving a merit increase of 5% in addition to a market increase in his base salary to bring base salary closer to the median of the peer group of other CFOs. In addition, Mr Miele is receiving an increase in his LTI target since he is currently below the 25th percentile of the peer group. Mr Kilcullen's LTI target is being reduced to be closer to the market median as well; otherwise, there are no other target LTI changes for the Senior Executive Officers for fiscal year 2022. Base salary increases, if any, are made in line with our annual compensation review guidelines and were adjusted as required to maintain positioning relative to market merit increase levels.
STI Plans
For fiscal year 2022, the plan design will continue to be the same as fiscal year 2021. We will continue to measure both Growth and Returns when assessing Company performance and shareholder value creation. We will continue to use the same the plan metrics, and continue to strengthen the connection between consistent revenue growth and strong returns. As in FY2021, the metrics for all regions (North America, Asia Pacific and Europe) will be a net revenue measure (Growth) and a profit measure (Returns). The metrics are each set with a threshold, target and maximum payout scale. The metrics and scales will incentivize exceptional company performance in a unpredictable market, both net revenue AND profitability must be achieved together to derive a payout within the payout scale, reinforcing shareholder value creation. The maximum payout will be 3.0x of target.
| | | | | |
| |
James Hardie 2021 Annual Report on Form 20-F | 44 |
| |
For fiscal year 2022, Messrs Gadd and Kilcullen will continue to be tied to the NA multiple. For executives with global responsibility (Dr Truong and Messrs Miele and Blasko), their STI will be based on the metrics for North America and the net income of the Company.
There will be no material change to the operation of the IP or CP Plans for fiscal year 2022.
LTI Plan
The Remuneration Committee believes the three components of the LTI Plan continue to (i) align management objectives with shareholder interests (Relative TSR RSU component), (ii) promote the appropriate internal management behaviors related to operating efficiency and the profitability of the Company's assets (ROCE RSU component), and (iii) emphasize strategic long-term priorities (Scorecard LTI component). As such, the fiscal year 2022 LTI Plan is consistent with the plan for fiscal year 2021 with updates to ROCE target measures and the Scorecard objectives.
The 2021 Notice of AGM will contain further details on the Relative TSR RSU and ROCE RSU grants for fiscal year 2022.
For fiscal year 2022, the Remuneration Committee has set the following eight Scorecard goals for each region (for the performance period in fiscal years 2022 to 2024) to ensure alignment with our strategic priorities:
| | | | | |
| |
James Hardie 2021 Annual Report on Form 20-F | 45 |
| |
| | | | | | | | | | | |
| APAC | Europe | North America |
| Organic revenue growth | 11%+ | 6%+ | 11%+ |
| High Value Product Mix | FY22 38%; FY23 42%; FY24 44% | FY22 39%; FY23 41%; FY24 43% | FY22 66%; FY23 67%; FY24 68% |
| Lean - Cumulative over 3 Years (FY22 – 24) | USD $78M vs FY19 Base
| USD $63M vs FY19 Base
| USD $200M vs FY19 Base
|
| EBIT Margin | 25% - 30% | 11% - 16% | 25% - 30% |
| Zero Harm | •Empower all employees to be Zero Harm Leaders •Execute on the critical ZH priorities thru ZH culture shift •DART rate: FY22 = 0.07; FY23=0.06; FY24= 0.05
| •Empower all employees to be Zero Harm leaders •Execute on the critical ZH priorities thru ZH culture shift •DART Rate: FY22=0.55; FY23=0.44; FY24=0.35 | •Empower all employees to be Zero Harm leaders •Execute on the critical ZH priorities thru ZH culture shift •DART rate: FY22=0.51; FY23=0.41; FY24=0.33 |
| Innovation | •Commercial-in-confidence metrics for products and process efficiencies
| •Commercial-in-confidence metrics for products and process efficiencies
| •Commercial-in-confidence metrics for products and process efficiencies |
| People & Culture | •Turnover: <11% •Enhance leadership capabilities in targeted areas •Talent and Performance Management •Execute region deliverables for I&D strategy to attract, develop and retain diverse talent •Diversity Target: Maintain or enhance gender diversity Sr. Leadership, grow to 20% or more all mgmt. positions and 20% or more in total workforce.
| •Turnover: <7.5% •Enhance leadership capabilities in targeted areas •Talent and Performance Management •Execute region deliverables for I&D strategy to attract, develop and retain diverse talent •Diversity Target: Enhance gender diversity Sr. Leadership, grow to 20% or more all mgmt. positions and 17% or more in total workforce.
| •Turnover: <11% •Enhance leadership capabilities in targeted areas •Talent and Performance Management •Execute region deliverables for I&D strategy to attract, develop and retain diverse talent •Diversity Target: 20% or more female representation in Mgmt & Sr. Leadership roles and 14% or more in total workforce; 45% or more total employee population with diverse characteristics.
|
| Environment, Social & Governance ("ESG") | FY22: •FY22 ESG Report shows improvement across areas management flagged in FY21 report •Receive zero negative shareholder votes across any resolution whereby the shareholder notes the vote was due to lack of clarity on ESG initiatives FY23: •Strengthen CDP disclosures with TCFD recommendations •Refresh materiality assessment with expanded stakeholder groups •FY23 ESG Report shows improvement across areas reported on FY24: •Improved CDP reporting with progress towards goals •Expanded Task Force for Climate Change Disclosure (TFCD) reporting •FY24 reporting shows improvement & PDCA as required based on stakeholder feedback
|
| | | | | |
| |
James Hardie 2021 Annual Report on Form 20-F | 46 |
| |
OTHER EXECUTIVE COMPENSATION PRACTICES
Clawback Provisions
The Remuneration Committee has established an executive performance-based compensation clawback policy in connection with performance-based compensation paid or awarded to certain executives. The clawback policy provides that the Board may, in all appropriate circumstances, recover from any current or former executive regardless of fault, that portion of any performance-based compensation erroneously awarded: (i) based on financial information required to be reported under applicable US or Australian securities laws or applicable exchange listing standards that would not have been paid in the three completed fiscal years preceding the year(s) in which an accounting restatement is required to correct a material error; or (ii) during the previous three completed fiscal years as a result of any errors or omissions in objective, calculable performance measures contained in formal papers presented to and relied upon by the Board for purposes of determining compensation to be paid or awarded, where the absence of such errors or omissions would have resulted in there being a material negative impact on the amount of performance-based compensation paid or awarded.
The clawback policy applies to any person designated as a participant by the Board in the annual LTI Plan and applies to any compensation that is granted, earned or vested based wholly or in part upon the attainment of any financial or other objective, calculable performance measure under any incentive, bonus, retirement or equity compensation plan maintained by the Company, including, without limitation, the STI Plan and LTI Plan. Salaries, discretionary bonuses, time-based equity awards and bonuses or equity awards based on subjective, non-financial measures, including strategic or personal performance metrics, are excluded.
The excess compensation requiring recovery shall be the amount of performance-based compensation that an executive received, based on the erroneous data, less the amount that would have been paid to the executive based on the restated or corrected data. All recoverable amounts shall be calculated on a pre-tax basis. For equity awards still held at the time of the recovery, the recoverable amount shall be the amount vested in excess of the number that should have vested under the restated or corrected financial reporting measure. For vested equity awards which have already been sold, the recoverable amount shall be the sale proceeds the executive received with respect to the excess number of shares.
In addition, all fiscal year 2021 LTI grants made to Dr Truong and Messrs Miele, Gadd, Blasko and Kilcullen are subject to a specific clawback provision for violation of a limited non-compete provision that specifically prohibits executives from working for designated competitors or for any company that may enter the fiber cement market within two years of departure. For fiscal year 2022, all LTI grants made to Senior Executive Officers will be subject to the clawback provision.
Stock Ownership Guidelines
The Remuneration Committee believes that Senior Executive Officers should hold a meaningful level of our stock to further align their interests with those of our shareholders. We have adopted stock ownership guidelines for the CEO and other Senior Executive Officers, respectively, which require them to accumulate holdings of three times and one times their base salary, respectively, in our stock over a period of five years from the effective date of the guidelines (1 April 2009) or the date the Senior Executive Officer first becomes subject to the applicable guideline.
Until the stock ownership guidelines have been met, Senior Executive Officers are required to retain at least 75% of shares obtained under our LTI Plans (net of taxes and other costs). Once Senior Executive Officers have met or exceeded their stock ownership guidelines, they are required to retain at least 25%
| | | | | |
| |
James Hardie 2021 Annual Report on Form 20-F | 47 |
| |
of shares issued under our LTI Plans through the vesting of RSUs (net of taxes and other costs) for a period of two years (by way of a holding lock), after which time those shares can be sold (provided the Senior Executive Officer remains at or above the stock ownership guideline).
As of 31 March 2021, all Senior Executive Officers have either achieved the minimum share ownership threshold or are within the initial five year accumulation period.
Equity Award Practices
The FY2022 annual equity awards under the LTI Plan were approved by the Remuneration Committee in May with awards generally issued in August of each year. We do not time the granting of equity awards to the disclosure of material information.
For details of the application of our insider-trading policy for equity award grant participants, including our prohibition on employee hedging transactions, see the “Insider Trading” section of this Annual Report.
Loans
We did not grant loans to Senior Executive Officers during fiscal year 2021. There are no loans outstanding to Senior Executive Officers.
Employment and Severance Arrangements
During fiscal year 2021, we maintained employment or severance agreements with Dr Truong and each of Messrs Gadd and Miele. Other than as provided under the terms of their respective employment agreements, no other termination payments are payable, except as required under the terms of the applicable STI or LTI plans.
Employment Agreement with Dr Jack Truong
Below is a summary of the key terms of Dr Truong’s current employment agreement:
•The Employment Agreement is effective 31 January 2019 providing for service as CEO.
•Dr Truong is an employee-at-will and either he or the Company may terminate his employment at any time or for any reason.
•Base salary at an initial annual rate of US$800,000, subject to annual review and approval by the Remuneration Committee.
•Participation in the Company’s annual STI and LTI Plans, with a minimum STI target of 100% of his annual base salary, as established by the Company’s Board.
•Participation in the Company’s benefit, health and welfare plans and certain fringe benefits made generally available to Senior Executive Officers in accordance with his agreement and Company policies.
•In the event that Dr Truong’s employment is terminated by the Company for any reason other than for “Cause”, or if Dr Truong voluntarily terminates his employment for “Good Reason”, in addition to those benefits that would be considered standard for any employee at termination (i.e., unpaid base salary, accrued vacation, unreimbursed business expenses and the payment of any earned but unpaid annual incentive award) Dr Truong will be entitled to receive the following benefits:
◦An aggregate amount equal to the sum of: (i) two times Dr Truong’s base salary plus (ii) two times Dr Truong’s target annual incentive, payable in substantially equal periodic installments over the two year period following the date of termination;
| | | | | |
| |
James Hardie 2021 Annual Report on Form 20-F | 48 |
| |
◦An amount, if any, with respect to the annual incentive award opportunity for the fiscal year in which termination of employment occurs, as determined under the terms and conditions of annual incentive program(s) then in-effect;
◦All outstanding equity awards will be subject to the terms and conditions of the applicable equity incentive plan and any corresponding award agreement(s); provided, however, that (i) if the date of termination occurs prior to 21 August 2022, any service-based vesting criteria on the long-term incentive awards granted to Dr Truong on 21 August 2017 that were designated as retention awards will be deemed satisfied in full (but any performance criteria then still applicable to those awards will remain in effect);
◦Monthly payments for a period of up to 24 months following the date of termination equal to the premium Dr Truong would be required to pay for continuing coverage under the Company’s health benefit plans; and
◦Reasonable professional outplacement services for a period of up to 24 months following the date of termination.
Offer of Employment with Jason Miele
Below is a summary of the key terms provided in Mr Miele's Offer of Employment, which was entered into in conjunction with his promotion to Senior Vice President, Chief Financial Officer effective 25 February 2020:
•Mr Miele is an employee-at-will and either he or the Company may terminate his employment at any time or any reason.
•Base salary at an initial annual rate of US$400,000, subject to annual review and approval by the Remuneration Committee.
•Participation in the Company’s annual STI and LTI Plans, with a STI target of 60% of his annual base salary.
•Participation in the Company’s benefit, health and welfare plans and certain fringe benefits made generally available to Senior Executive Officers in accordance with his agreement and Company policies.
•In the event that Mr Miele is terminated by the Company without "Cause" or terminated by Mr Miele for "Good Reason", in addition to those benefits that would be considered standard for any employee at termination (i.e., unpaid base salary, accrued vacation, unreimbursed business expenses and the payment of any earned but unpaid annual incentive award) Mr Miele will be entitled to receive the following benefits:
◦Salary continuation for the one year period following the date of termination, provided the aggregate amount of such continuation payments shall be equal to the sum of (i) one times the base salary plus (ii) one times the annual incentive award opportunity, as then in-effect;
◦All outstanding equity awards under the Company's equity incentive plans will be subject to the terms and conditions of the applicable plan and any corresponding award agreement(s);
◦Monthly payments for a period of 12 months following the date of termination equal to the premium Mr Miele would be required to pay for continuing coverage under the Company’s health benefit plans; and
◦Reasonable professional outplacement services for a period of up to 12 months following the date of termination.
| | | | | |
| |
James Hardie 2021 Annual Report on Form 20-F | 49 |
| |
Severance Agreement with Sean Gadd
During fiscal year 2019, we entered into a severance agreement with Mr Gadd in order to provide him with certain severance benefits under various termination scenarios. In the event of termination by the Company without cause or by the executive for good reason or death and disability, these benefits would be in addition to what would be considered standard for any employee at termination (i.e., lump sum unpaid base salary, accrued vacation, unreimbursed business expenses and the payment of any earned but unpaid annual incentive award) and would include: (i) salary continuation for one and one-half years provided the aggregate amount of such payments is equal to the sum of (a) one and one-half times the executive’s base salary, plus (b) one times the executive’s annual incentive opportunity, as then in effect; (ii) monthly payments for a period of 18 months following termination equal to the premium the executive would be required to pay for COBRA continuation coverage under the Company’s health benefit plans based on the level of coverage the executive has immediately prior to termination. Executive is not required to purchase COBRA continuation coverage or use these payments towards any payment of applicable premiums for COBRA continuation coverage; and (iii) reasonable outplacement services through a provider of the Company’s choice. Services terminate when the executive finds other employment and may not continue for more than 12 months following termination.
| | | | | |
| |
James Hardie 2021 Annual Report on Form 20-F | 50 |
| |
REMUNERATION PAID TO SENIOR EXECUTIVE OFFICERS
Total Remuneration for Senior Executive Officers
Details of the remuneration for Senior Executive Officers in fiscal years 2021, 2020 and 2019 are set out below:
| | | | | | | | | | | | | | | | | | | | | | | | | | | | | | | | | | | | | | | | | | | | | | | |
| (US dollars) | | Primary | | Post-
employment | | Equity Awards | | Other | TOTAL |
| Name | | Base Pay1 | | STI Award2 | | Other Benefits3 | | 401(k) | | Ongoing Vesting 4 | | Mark-to Market5 | | Relocation Allowances, and Other Nonrecurring6 |
J Truong7 | | | | | | | | | | | | | | | |
| Fiscal year 2021 | | 873,077 | | | 3,037,500 | | | 73,377 | | | 17,100 | | | 5,740,243 | | | 9,973,788 | | | — | | 19,715,085 | |
| Fiscal Year 2020 | | 800,000 | | | 2,160,000 | | | 75,038 | | | 17,366 | | | 3,329,423 | | | (316,615) | | | 3,051 | | 6,068,263 | |
| Fiscal Year 2019 | | 679,396 | | | 949,362 | | | 46,902 | | | 17,226 | | | 1,412,235 | | | (337,627) | | | 30,528 | | 2,798,022 | |
| J Miele | | | | | | | | | | | | | | | |
| Fiscal year 2021 | | 411,692 | | | 648,960 | | | 111,469 | | | 17,100 | | | 533,914 | | | 754,806 | | | 283,744 | | 2,761,685 | |
| Fiscal Year 2020 | | 292,840 | | | 269,233 | | | 39,384 | | | 18,076 | | | 255,805 | | | (3,427) | | | 382,089 | | 1,254,000 | |
| S Gadd | | | | | | | | | | | | | | | |
| Fiscal year 2021 | | 573,299 | | | 901,415 | | | 38,808 | | | 17,100 | | | 1,438,684 | | | 3,082,202 | | | — | | 6,051,508 | |
| Fiscal Year 2020 | | 558,038 | | | 747,252 | | | 35,249 | | | 18,230 | | | 1,347,237 | | | (29,332) | | | — | | 2,676,674 | |
| Fiscal Year 2019 | | 525,289 | | | 373,200 | | | 47,548 | | | 17,210 | | | 1,389,526 | | | (467,763) | | | 100,000 | | 1,985,010 | |
| J Blasko | | | | | | | | | | | | | | | |
| Fiscal year 2021 | | 457,472 | | | 717,444 | | | 71,350 | | | 17,100 | | | 609,857 | | | 1,129,200 | | | — | | 3,002,423 | |
| Fiscal Year 2020 | | 447,347 | | | 489,117 | | | 54,088 | | | 17,012 | | | 568,651 | | | 11,022 | | | — | | 1,587,237 | |
| Fiscal Year 2019 | | 434,317 | | | 321,484 | | | 59,065 | | | 16,677 | | | 688,153 | | | (240,355) | | | — | | 1,279,341 | |
| R Kilcullen | | | | | | | | | | | | | | | |
| Fiscal year 2021 | | 379,030 | | | 593,649 | | | 33,788 | | | 12,453 | | | 635,010 | | | 1,132,357 | | | — | | 2,786,287 | |
| Fiscal Year 2020 | | 371,038 | | | 476,898 | | | 26,046 | | | 18,022 | | | 552,189 | | | (11,661) | | | — | | 1,432,532 | |
| TOTAL | | | | | | | | | | | | | | | |
| Fiscal Year 2021 | | 2,694,570 | | | 5,898,968 | | | 328,792 | | | 80,853 | | | 8,957,708 | | | 16,072,353 | | | 283,744 | | 34,316,988 | |
| Fiscal Year 2020 | | 2,469,263 | | | 4,142,500 | | | 229,805 | | | 88,706 | | | 6,053,305 | | | (350,013) | | | 385,140 | | 13,018,706 | |
____________
1Base pay for fiscal years 2021, 2020 and 2019 includes salary paid to Senior Executive Officers for the 26 bi-weekly paychecks received during the fiscal years.
2For further details on STI awards paid for fiscal year 2021, see “Incentive Arrangements” above in this Remuneration section. Amounts reflect actual STI awards to be paid in June 2021 and paid in June 2020 and 2019, for fiscal years 2021, 2020 and 2019, respectively
3Includes the aggregate amount of all other benefits received in the year indicated. Examples of benefits that may be received include medical and life insurance benefits, car allowances, membership in executive wellness programs, and financial planning and tax services.
4Includes equity award expense for grants of Scorecard LTI awards, relative TSR RSUs and ROCE RSUs. Relative TSR RSUs are valued using a Monte Carlo simulation method. ROCE RSUs and Scorecard LTI awards are valued based on the Company’s share price at each balance sheet date adjusted for the fair value of estimated dividends as well as the Remuneration Committee’s current expectation of the amount of the RSUs or awards which will vest. The fair value of equity awards granted are included in compensation over the periods in which the equity awards vest. For ROCE RSUs and Scorecard LTI awards, this amount excludes adjustments to the equity award expense in previous fiscal years resulting from changes in the Company’s share price, which is disclosed separately in the Equity Awards “Mark-to-Market” column.
5The amount included in this column is the equity award expense in relation to ROCE RSUs and Scorecard LTI awards resulting from changes in fair market value of the US dollar share price during the fiscal years 2021, 2020 and 2019 as well as adjustments to
| | | | | |
| |
James Hardie 2021 Annual Report on Form 20-F | 51 |
| |
performance ratings based on review by Executive Management and the Board of Directors. During fiscal year 2021, there was a 164.7% increase in our share price from US$11.44 to US$30.28. During fiscal year 2020, there was a 11.1% decrease in our share price from US$12.87 to US$11.44.
6Includes the aggregate of non-recurring payments or other benefits received in the year indicated. Examples include one-time signing bonus or other limited payments connected to initial retention, one-time discretionary bonus payments, relocation allowances and costs and severance payments.
7J Truong's base pay includes US$205,734 in fiscal year 2021, which is allocated for tax purposes to his services on the Company’s Board.
Additional Summary Remuneration Table
This table shows the compensation provided to the executive that more closely reflects the amount of pay earned during each fiscal year reported. The footnotes below the table define each compensation component. The main difference between the two tables is the equity incentives. This table shows the value of the LTI Scorecard payout (not shown in previous table) in the Non-Equity Incentive Plan Compensation column, which also includes the annual STI payout. The Stock Awards column shows the value of the FY21-23 equity awards that were granted to each executive.
| | | | | | | | | | | | | | | | | | | | | | | | | | | | | | | | | | | | | | | | | | | | | | | |
| Name | | Base Pay1 | | Bonus2 | | Stock Awards3 | | Options Awards4 | | Non-Equity Incentive Plan Compensation5 | | Change in Pension Value and Nonqualified Deferred Compensation Earnings | | All Other Compensation6 | Total |
J Truong7 | | | | | | | | | | | | | | | |
| Fiscal year 2021 | | 873,077 | | | — | | | 1,737,499 | | | — | | | 5,983,696 | | | — | | | 90,477 | | 8,684,749 | |
| Fiscal Year 2020 | | 800,000 | | | — | | | 1,049,998 | | | — | | | 2,160,000 | | | — | | | 95,455 | | 4,105,453 | |
| Fiscal Year 2019 | | 679,396 | | | — | | | 500,000 | | | — | | | 949,362 | | | — | | | 94,656 | | 2,223,414 | |
| J Miele | | | | | | | | | | | | | | | |
| Fiscal year 2021 | | 411,692 | | | — | | | 225,005 | | | — | | | 795,901 | | | — | | | 412,313 | | 1,844,911 | |
| Fiscal Year 2020 | | 292,840 | | | — | | | 124,997 | | | — | | | 312,260 | | | — | | | 439,550 | | 1,169,647 | |
| S Gadd | | | | | | | | | | | | | | | |
| Fiscal year 2021 | | 573,299 | | | — | | | 399,998 | | | — | | | 2,095,596 | | | — | | | 55,907 | | 3,124,800 | |
| Fiscal Year 2020 | | 558,038 | | | — | | | 399,999 | | | — | | | 933,695 | | | — | | | 53,479 | | 1,945,211 | |
| Fiscal Year 2019 | | 525,289 | | | 100,000 | | | 399,999 | | | — | | | 631,300 | | | — | | | 64,757 | | 1,721,345 | |
| J Blasko | | | | | | | | | | | | | | | |
| Fiscal year 2021 | | 457,472 | | | — | | | 249,993 | | | — | | | 1,056,239 | | | — | | | 88,450 | | 1,852,154 | |
| Fiscal Year 2020 | | 447,347 | | | — | | | 250,000 | | | — | | | 618,197 | | | — | | | 71,101 | | 1,386,645 | |
| Fiscal Year 2019 | | 434,317 | | | — | | | 249,999 | | | — | | | 480,317 | | | — | | | 75,741 | | 1,240,374 | |
| R Kilcullen | | | | | | | | | | | | | | | |
| Fiscal year 2021 | | 379,030 | | | — | | | 199,999 | | | — | | | 985,476 | | | — | | | 46,241 | | 1,610,746 | |
| Fiscal Year 2020 | | 371,038 | | | — | | | 200,003 | | | — | | | 548,614 | | | — | | | 44,068 | | 1,163,723 | |
| TOTAL | | | | | | | | | | | | | | | |
| Fiscal Year 2021 | | 2,694,570 | | | — | | | 2,812,494 | | | — | | | 10,916,908 | | | — | | | 693,388 | | 17,117,360 | |
| Fiscal Year 2020 | | 2,469,263 | | | — | | | 2,024,997 | | | — | | | 4,572,766 | | | — | | | 703,653 | | 9,770,679 | |
| | | | | |
| |
James Hardie 2021 Annual Report on Form 20-F | 52 |
| |
____________
1 Base pay for fiscal years 2021, 2020 and 2019 includes salary paid to Senior Executive Officers for the 26 bi-weekly paychecks received during the fiscal years.
2 Includes non-performance bonuses such as a special award for retention or a sign-on bonus for a new hire. Examples include one-time signing bonus or other limited payments connected to initial retention, one-time discretionary bonus payments.
3 Shows the value on the date of grant for the TSR RSUs and ROCE RSUs granted to the executive during each fiscal year. Relative TSR RSUs are valued using a Monte Carlo simulation method. ROCE RSUs are valued based on the Company’s share price on the grant date. The TSR RSU valuation for fiscal year 2021 is US$13.67 and ROCE RSU 20-day average share price of US$21.16.
4 We do not grant stock options to executives.
5 For further details on STI awards paid for fiscal year 2021, see “Incentive Arrangements” above in this Remuneration section. Amounts reflect actual STI awards to be paid in June 2021 and paid in June 2020 and 2019, for fiscal years 2021, 2020 and 2019, respectively. In addition, the LTI Scorecard cash payouts are included that were paid in August 2020, 2019 and 2018.
6 Includes the aggregate amount of all other benefits received in the year indicated. Examples of benefits that may be received include medical and life insurance benefits, 401(K) company match, car allowances, membership in executive wellness programs, and financial planning and tax services.
7 J Truong's base pay includes US$205,734 in fiscal year 2021, which a portion is allocated for tax purposes to his services on the Company’s Board.
Variable Remuneration Payable in Future Years
Details of the accounting cost of the variable remuneration for fiscal year 2021 that may be paid to Senior Executive Officers in future years are set out below. The minimum amount payable is nil in all cases. The maximum amount payable will depend on the share price at time of vesting, and is therefore not possible to determine. The table below is based on the fair value of the RSUs and Scorecard LTI according to US GAAP and our estimate of the rating to be applied to Scorecard LTI.
| | | | | | | | | | | | | | | | | | | |
Scorecard LTI1 |
| (US dollars) |
| FY2021 | FY2022 | FY2023 | FY2024 | | | TOTAL |
| J Truong | 1,105,220 | | 2,047,742 | | 2,047,742 | | 779,825 | | | | 5,980,529 | |
| J Miele | 96,951 | | 179,631 | | 179,631 | | 68,407 | | | | 524,620 | |
| S Gadd | 113,266 | | 209,859 | | 209,859 | | 79,919 | | | | 612,903 | |
| J Blasko | 50,012 | | 92,662 | | 92,662 | | 35,288 | | | | 270,624 | |
| R Kilcullen | 55,399 | | 102,642 | | 102,642 | | 39,088 | | | | 299,771 | |
| 1,420,848 | | 2,632,536 | | 2,632,536 | | 1,002,527 | | | | 7,688,447 | |
| | | | | | | |
| | | | | | | |
| | | | | | | | | | | | | | | | | | | |
ROCE RSUs2 |
| (US dollars) |
| FY2021 | FY2022 | FY2023 | FY2024 | | | TOTAL |
| J Truong | 213,677 | | 534,192 | | 534,192 | | 203,432 | | | | 1,485,493 | |
| J Miele | 35,547 | | 65,861 | | 65,861 | | 25,081 | | | | 192,350 | |
| S Gadd | 63,196 | | 117,090 | | 117,090 | | 44,590 | | | | 341,966 | |
| J Blasko | 39,495 | | 73,176 | | 73,176 | | 27,867 | | | | 213,714 | |
| R Kilcullen | 31,598 | | 58,545 | | 58,545 | | 22,295 | | | | 170,983 | |
| 383,513 | | 848,864 | | 848,864 | | 323,265 | | | | 2,404,506 | |
| | | | | |
| |
James Hardie 2021 Annual Report on Form 20-F | 53 |
| |
| | | | | | | | | | | | | | | | | | | |
Relative TSR RSUs3 |
| (US dollars) |
| FY2021 | FY2022 | FY2023 | FY2024 | | | TOTAL |
| J Truong | 340,226 | | 850,566 | | 850,566 | | 323,914 | | | | 2,365,272 | |
| J Miele | 44,317 | | 82,111 | | 82,111 | | 31,269 | | | | 239,808 | |
| S Gadd | 78,784 | | 145,970 | | 145,970 | | 55,589 | | | | 426,313 | |
| J Blasko | 49,240 | | 91,231 | | 91,231 | | 34,743 | | | | 266,445 | |
| R Kilcullen | 39,392 | | 72,985 | | 72,985 | | 27,794 | | | | 213,156 | |
| 551,959 | | 1,242,863 | | 1,242,863 | | 473,309 | | | | 3,510,994 | |
| | | | | | | |
____________
1 Represents annual SG&A expense for Scorecard LTI granted in fiscal year 2021. The fair value of each award is adjusted for changes in JHI plc’s common stock price at each balance sheet date until the final scorecard rating is applied in August 2023 at which time the final values are based on the Company’s share price and the senior executive’s scorecard rating at time of vesting.
2 Represents annual SG&A expense for the ROCE RSUs granted in fiscal year 2021. The fair value of each RSU is adjusted for changes in JHI plc’s common stock price at each balance sheet date until August 2023 when ROCE results are known and the Remuneration Committee makes a determination on the amount of negative discretion to be applied and some, all or none of the awards become vested.
3 Represents annual SG&A expense for the Relative TSR RSUs granted in fiscal 2021 with fair market value estimated using a binomial lattice model that incorporates a Monte Carlo simulation.
OUTSTANDING EQUITY AWARDS HELD BY SENIOR EXECUTIVE OFFICERS
The following tables set forth information regarding outstanding equity awards held by our Senior Executive Officers as of 30 April 2021.
Options
As of 30 April 2021, no Senior Executive Officers held stock options.
| | | | | |
| |
James Hardie 2021 Annual Report on Form 20-F | 54 |
| |
Restricted Stock Units
| | | | | | | | | | | | | | | | | | | | | | | | | | | | | |
| Name | Grant
Date | Release Date | Holding and Unvested at 2020 | Granted | Total
Value at Grant¹
(US$) | Vested | Lapsed | Holding and Unvested at 30 April 2021 | Fair Value per RSU2 (US$) |
| J Truong | 21-Aug-173 | 21-Aug-20 | 61,726 | | 61,726 | | $ | 471,019 | | (61,726) | | — | | — | | $ | 7.63 | |
| 21-Aug-174 | 21-Aug-20 | 34,110 | | 34,110 | | $ | 484,086 | | (21,319) | | (12,791) | | — | | $ | 14.19 | |
| 21-Aug-175 | 21-Aug-20 | 61,726 | | 61,726 | | $ | 471,019 | | (20,576) | | — | | 41,150 | | $ | 7.63 | |
| 21-Aug-176 | 21-Aug-20 | 34,110 | | 34,110 | | $ | 484,086 | | (7,107) | | (4,263) | | 22,740 | | $ | 14.19 | |
| 17-Aug-183 | 17-Aug-21 | 56,677 | | 56,677 | | $ | 494,864 | | — | | — | | 56,677 | | $ | 8.73 | |
| 17-Aug-184 | 17-Aug-21 | 30,553 | | 30,553 | | $ | 444,375 | | — | | — | | 30,553 | | $ | 14.54 | |
| 6-Sep-183 | 17-Aug-21 | 49,381 | | 49,381 | | $ | 334,255 | | — | | — | | 49,381 | | $ | 6.77 | |
| 6-Sep-184 | 17-Aug-21 | 25,385 | | 25,385 | | $ | 343,817 | | — | | — | | 25,385 | | $ | 13.54 | |
| 9-Aug-193 | 17-Aug-21 | 18,518 | | 18,518 | | $ | 138,885 | | — | | — | | 18,518 | | $ | 7.50 | |
| 9-Aug-194 | 17-Aug-21 | 9,519 | | 9,519 | | $ | 131,933 | | — | | — | | 9,519 | | $ | 13.86 | |
| 17-Aug-193 | 17-Aug-22 | 139,432 | | 139,432 | | $ | 1,489,134 | | — | | — | | 139,432 | | $ | 10.68 | |
| 17-Aug-194 | 17-Aug-22 | 75,545 | | 75,545 | | $ | 1,050,831 | | — | | — | | 75,545 | | $ | 13.91 | |
| 17-Aug-203 | 17-Aug-23 | — | | 127,083 | | $ | 2,365,015 | | — | | — | | 127,083 | | $ | 18.61 | |
| 17-Aug-204 | 17-Aug-23 | — | | 82,131 | | $ | 2,104,196 | | — | | — | | 82,131 | | $ | 25.62 | |
| J Miele | 16-Sep-168 | 16-Sep-19 | 4,878 | | 8,181 | | $ | 87,547 | | (4,080) | | (798) | | — | | $ | 10.70 | |
| 21-Aug-173 | 21-Aug-20 | 9,259 | | 9,259 | | $ | 70,654 | | (9,259) | | — | | — | | $ | 7.63 | |
| 21-Aug-174 | 21-Aug-20 | 5,117 | | 5,117 | | $ | 72,620 | | (3,198) | | (1,919) | | — | | $ | 14.19 | |
| 17-Aug-183 | 17-Aug-21 | 11,335 | | 11,335 | | $ | 98,969 | | — | | — | | 11,335 | | $ | 8.73 | |
| 17-Aug-184 | 17-Aug-21 | 6,111 | | 6,111 | | $ | 88,881 | | — | | — | | 6,111 | | $ | 14.54 | |
| 17-Aug-193 | 17-Aug-22 | 16,599 | | 16,599 | | $ | 177,277 | | — | | — | | 16,599 | | $ | 10.68 | |
| 17-Aug-194 | 17-Aug-22 | 8,993 | | 8,993 | | $ | 125,093 | | — | | — | | 8,993 | | $ | 13.91 | |
| 25-Feb-205 | 17-Aug-22 | 6,676 | | 6,676 | | $ | 90,660 | | — | | — | | 6,676 | | $ | 13.58 | |
| 25-Feb-205 | 17-Aug-22 | 4,767 | | 4,767 | | $ | 85,186 | | — | | — | | 4,767 | | $ | 17.87 | |
| 17-Aug-203 | 17-Aug-23 | — | | 16,457 | | $ | 239,778 | | — | | — | | 16,457 | | $ | 14.57 | |
| 17-Aug-204 | 17-Aug-23 | — | | 10,636 | | $ | 236,226 | | — | | — | | 10,636 | | $ | 22.21 | |
| S Gadd | 16-Sep-168 | 16-Sep-19 | 21,138 | | 35,451 | | $ | 379,372 | | (17,681) | | (3,457) | | — | | $ | 10.70 | |
| 21-Aug-173 | 21-Aug-20 | 49,380 | | 49,380 | | $ | 376,809 | | (49,380) | | — | | — | | $ | 7.63 | |
| 21-Aug-174 | 21-Aug-20 | 27,288 | | 27,288 | | $ | 387,269 | | (17,055) | | (10,233) | | — | | $ | 14.19 | |
| 21-Aug-175 | 21-Aug-20 | 49,380 | | 49,380 | | $ | 376,809 | | (16,460) | | — | | 32,920 | | $ | 7.63 | |
| 21-Aug-176 | 21-Aug-20 | 27,288 | | 27,288 | | $ | 387,269 | | (5,685) | | (3,411) | | 18,192 | | $ | 14.19 | |
| 17-Aug-183 | 17-Aug-21 | 45,342 | | 45,342 | | $ | 395,895 | | — | | — | | 45,342 | | $ | 8.73 | |
| 17-Aug-184 | 17-Aug-21 | 24,442 | | 24,442 | | $ | 355,494 | | — | | — | | 24,442 | | $ | 14.54 | |
| 17-Aug-193 | 17-Aug-22 | 53,117 | | 53,117 | | $ | 567,290 | | — | | — | | 53,117 | | $ | 10.68 | |
| 17-Aug-194 | 17-Aug-22 | 28,779 | | 28,779 | | $ | 400,316 | | — | | — | | 28,779 | | $ | 13.91 | |
| 17-Aug-203 | 17-Aug-23 | — | | 29,256 | | $ | 426,260 | | — | | — | | 29,256 | | $ | 14.57 | |
| 17-Aug-204 | 17-Aug-23 | — | | 18,908 | | $ | 419,947 | | — | | — | | 18,908 | | $ | 22.21 | |
| J Blasko | 16-Sep-168 | 16-Sep-19 | 14,634 | | 24,543 | | $ | 262,642 | | (12,241) | | (2,393) | | — | | $ | 10.70 | |
| 21-Aug-173 | 21-Aug-20 | 30,863 | | 30,863 | | $ | 235,509 | | (30,863) | | — | | — | | $ | 7.63 | |
| 21-Aug-174 | 21-Aug-20 | 17,055 | | 17,055 | | $ | 242,043 | | (10,659) | | (6,396) | | — | | $ | 14.19 | |
| 17-Aug-183 | 17-Aug-21 | 28,339 | | 28,339 | | $ | 247,436 | | — | | — | | 28,339 | | $ | 8.73 | |
| 17-Aug-184 | 17-Aug-21 | 15,276 | | 15,276 | | $ | 222,113 | | — | | — | | 15,276 | | $ | 14.54 | |
| 17-Aug-193 | 17-Aug-22 | 33,198 | | 33,198 | | $ | 354,555 | | — | | — | | 33,198 | | $ | 10.68 | |
| 17-Aug-194 | 17-Aug-22 | 17,987 | | 17,987 | | $ | 250,199 | | — | | — | | 17,987 | | $ | 13.91 | |
| 17-Aug-203 | 17-Aug-23 | — | | 18,285 | | $ | 266,412 | | — | | — | | 18,285 | | $ | 14.57 | |
| 17-Aug-204 | 17-Aug-23 | — | | 11,817 | | $ | 262,456 | | — | | — | | 11,817 | | $ | 22.21 | |
| | | | | |
| |
James Hardie 2021 Annual Report on Form 20-F | 55 |
| |
Restricted Stock Units (continued)
| | | | | | | | | | | | | | | | | | | | | | | | | | | | | |
| Name | Grant
Date | Release Date | Holding and Unvested at
1 April 2019 | Granted | Total
Value at Grant¹
(US$) | Vested | Lapsed | Holding and Unvested at 30 April 2020 | Fair Value per RSU2 (US$) |
| R Kilcullen | 16-Sep-168 | 16-Sep-19 | 8,130 | | 13,635 | | $ | 145,912 | | (6,800) | | (1,330) | | — | | $ | 10.70 | |
| 21-Aug-173 | 21-Aug-20 | 24,690 | | 24,690 | | $ | 188,404 | | (24,690) | | — | | — | | $ | 7.63 | |
| 21-Aug-174 | 21-Aug-20 | 13,644 | | 13,644 | | $ | 193,634 | | (8,528) | | (5,116) | | — | | $ | 14.19 | |
| 17-Aug-183 | 17-Aug-21 | 22,671 | | 22,671 | | $ | 197,947 | | — | | — | | 22,671 | | $ | 8.73 | |
| 17-Aug-184 | 17-Aug-21 | 12,221 | | 12,221 | | $ | 177,747 | | — | | — | | 12,221 | | $ | 14.54 | |
| 1-Mar-197 | 9-Dec-19 | 5,439 | | 8,159 | | $ | 99,213 | | (2,720) | | — | | 2,719 | | $ | 12.16 | |
| 17-Aug-193 | 17-Aug-22 | 26,559 | | 26,559 | | $ | 283,650 | | — | | — | | 26,559 | | $ | 10.68 | |
| 17-Aug-194 | 17-Aug-22 | 14,390 | | 14,390 | | $ | 200,165 | | — | | — | | 14,390 | | $ | 13.91 | |
| 17-Aug-203 | 17-Aug-23 | — | | 14,628 | | $ | 213,130 | | — | | — | | 14,628 | | $ | 14.57 | |
| 17-Aug-204 | 17-Aug-23 | — | | 9,454 | | $ | 209,973 | | — | | — | | 9,454 | | $ | 22.21 | |
____________
1 Total Value at Grant = Fair Value per RSU multiplied by number of RSUs granted. The number of RSUs granted are at maximum achievement.
2 The Fair Value of TSR RSUs is estimated on the date of grant using the binomial lattice model that incorporates a Monte Carlo simulation. The Fair Value for all other RSUs is the share price on the date of grant adjusted for the fair value of estimated dividends as the RSU holder is not entitled to dividends over the vesting period.
3 Relative TSR RSUs granted under the LTIP. These RSUs are subject to performance hurdles.
4 ROCE RSUs granted under the LTIP. These RSUs are subject to performance hurdles as well as the potential application of negative discretion.
5 Special one-time retention grant of Relative TSR RSUs granted under the LTIP. These RSUs are subject to performance hurdles and service-based vesting criteria.
6 Special one-time retention grant of ROCE RSUs granted under the LTIP. These RSUs are subject to performance hurdles and service-based vesting criteria as well as the potential application of negative discretion.
7 Special one-time retention grant of time-based RSUs granted under the 2001 Equity Incentive Plan ("2001 Plan"). These RSUs vest one-third in December 2019, 2020 and 2021
8 RSUs vested on 16 September 2020 and on 16 March 2021 in accordance with grant terms.
| | | | | |
| |
James Hardie 2021 Annual Report on Form 20-F | 56 |
| |
Scorecard LTI
| | | | | | | | | | | | | | | | | | | | | | | |
| Name | Grant
Date | Release Date | Holding at
1 April
2020 | Granted | Vested1 | Lapsed | Holding at 30 April 20212 |
| J Truong | 21-Aug-17 | 21-Aug-20 | 102,331 | | 102,331 | | (102,331) | | — | | — | |
| 21-Aug-173 | 21-Aug-20 | 102,331 | | 102,331 | | (34,111) | | — | | 68,220 | |
| 17-Aug-18 | 17-Aug-21 | 91,659 | | 91,659 | | — | | — | | 91,659 | |
| 6-Sep-18 | 17-Aug-21 | 76,155 | | 76,155 | | — | | — | | 76,155 | |
| 31-Jan-19 | 17-Aug-21 | 28,558 | | 28,558 | | — | | — | | 28,558 | |
| 17-Aug-19 | 17-Aug-22 | 226,636 | | 226,636 | | — | | — | | 226,636 | |
| 17-Aug-20 | 17-Aug-23 | — | | 246,394 | | — | | — | | 246,394 | |
| J Miele | 21-Aug-17 | 21-Aug-20 | 15,350 | | 15,350 | | (6,805) | | (8,545) | | — | |
| 17-Aug-18 | 17-Aug-21 | 18,332 | | 18,332 | | — | | — | | 18,332 | |
| 17-Aug-19 | 17-Aug-22 | 26,980 | | 26,980 | | — | | — | | 26,980 | |
| 25-Feb-204 | 17-Aug-22 | 14,301 | | 14,301 | | — | | — | | 14,301 | |
| 17-Aug-20 | 17-Aug-23 | — | | 31,907 | | — | | — | | 31,907 | |
| S Gadd | 21-Aug-17 | 21-Aug-20 | 81,865 | | 81,865 | | (41,478) | | (40,387) | | — | |
| 21-Aug-173 | 21-Aug-20 | 81,865 | | 81,865 | | (13,826) | | (13,463) | | 54,576 | |
| 17-Aug-18 | 17-Aug-21 | 73,327 | | 73,327 | | — | | — | | 73,327 | |
| 17-Aug-19 | 17-Aug-22 | 86,337 | | 86,337 | | — | | — | | 86,337 | |
| 17-Aug-20 | 17-Aug-23 | — | | 56,724 | | — | | — | | 56,724 | |
| J Blasko | 21-Aug-17 | 21-Aug-20 | 51,165 | | 51,165 | | (15,690) | | (35,475) | | — | |
| 17-Aug-18 | 17-Aug-21 | 45,829 | | 45,829 | | — | | — | | 45,829 | |
| 17-Aug-19 | 17-Aug-22 | 53,961 | | 53,961 | | — | | — | | 53,961 | |
| 17-Aug-20 | 17-Aug-23 | — | | 35,452 | | — | | — | | 35,452 | |
| R Kilcullen | 21-Aug-17 | 21-Aug-20 | 40,932 | | 40,932 | | (18,146) | | (22,786) | | — | |
| 17-Aug-18 | 17-Aug-21 | 36,663 | | 36,663 | | — | | — | | 36,663 | |
| 17-Aug-19 | 17-Aug-22 | 43,169 | | 43,169 | | — | | — | | 43,169 | |
| 17-Aug-20 | 17-Aug-23 | — | | 28,362 | | — | | — | | 28,362 | |
____________
1 Represents the number of Scorecard LTI awards vesting after the Remuneration Committee’s application of the Scorecard in respect of fiscal years 2017-2079. A detailed assessment of the reasons for the Scorecard ratings was set out in the fiscal year 2019 Remuneration Report.
2 Scorecard LTI awards in respect of fiscal years 2019-2021 will vest on 17 August 2021. A detailed assessment of the Remuneration Committee’s assessment of management’s performance is set out on pages 18 to 20 of this Remuneration Report.
3 Special one-time retention grant of Scorecard LTI awards granted under the LTIP, which are also subject to service-based vesting criteria.
4 Granted upon promotion to SVP, CFO; performance period ends 17 August 2022 with vesting one-third on 17 August 2022, 2023 and 2024.
| | | | | |
| |
James Hardie 2021 Annual Report on Form 20-F | 57 |
| |
REMUNERATION FOR NON-EXECUTIVE DIRECTORS
Fees paid to non-executive directors are determined by the Board, with the advice of the Remuneration Committee’s independent external remuneration advisers, within the maximum total amount of base and committee fees pool approved by shareholders from time-to-time. Shareholders at the 2019 AGM approved the current maximum aggregate base and committee fee pool of US$3.8 million per annum.
Remuneration Structure
Non-executive directors are paid a base fee for service on the Board. Additional fees are paid to the person occupying the positions of Chairman and Board Committee Chairmen, as well as for attendance at ad-hoc sub-committee meetings.
There was no increase to the non-executive director fees in fiscal year 2021.
| | | | | | | | |
| Position | | Fiscal Year 2021 (US$) |
| Chairman | | 420,794 | |
| Board member | | 205,734 | |
| Audit Committee Chair | | 20,000 | |
| Remuneration Committee Chair | | 20,000 | |
| Nominating & Governance Committee Chair | | 20,000 | |
Ad-hoc Board sub-committee attendance1 | | 3,000 | |
____________
1 Fee is payable in respect of each ad-hoc Board sub-committee attended.
During fiscal year 2016, the Remuneration Committee reviewed and approved changes to its remuneration policy for non-executive directors, in order to ensure that the Company continues to attract highly qualified persons to serve on the Board irrespective of their tax residence. In accordance with the policy, the Company will ensure that each non-executive director does not have an increased income tax liability as a direct result of their appointment to the Board. Accordingly, non-executive directors who are resident outside of Ireland may receive supplemental compensation depending on their country of residence, if Irish income taxes levied on their director compensation exceed net income taxes owed on such compensation in their country of tax residence, assuming it had been derived solely in their country of tax residence.
On occasion, the Remuneration Committee may approve special exertion fees in the event of an extraordinary workload imposed on a director in special circumstances.
As the focus of the Board is on maintaining the Company’s long-term direction and well-being, there is no direct link between non-executive directors’ remuneration and the Company’s short-term results.
| | | | | |
| |
James Hardie 2021 Annual Report on Form 20-F | 58 |
| |
Board Accumulation Guidelines
Non-executive directors are encouraged to accumulate a minimum of 1.5 times (and two times for the Chairman) the non-executive director base fee in shares of the Company’s common stock (either personally, in the name of their spouse, or through a personal superannuation or pension plan). The Remuneration Committee reviews the guidelines and non-executive directors’ shareholdings on a periodic basis.
Director Retirement Benefits
We do not provide any benefits for our non-executive directors upon termination of their service on the Board.
| | | | | |
| |
James Hardie 2021 Annual Report on Form 20-F | 59 |
| |
Total Remuneration for Non-Executive Directors for the Years Ended 31 March 2021 and 2020
The table below sets out the remuneration for those non-executive directors who served on the Board during the fiscal years ended 31 March 2021 and 2020:
| | | | | | | | | | | | | | | | | | | | | | | | | | |
| (US dollars) | | | | | | | | |
Name | | Primary Directors’ Fees1 | | Other Payments2 | | Other Benefits3 | | TOTAL |
| M Hammes | | | | | | | | |
| Fiscal Year 2021 | | 432,794 | | | 703,651 | | | 3,873 | | | 1,140,318 | |
| Fiscal Year 2020 | | 429,794 | | | 634,231 | | | 30,762 | | | 1,094,787 | |
| B Anderson | | | | | | | | |
| Fiscal Year 2021 | | 129,950 | | | — | | | — | | | 129,950 | |
| Fiscal Year 2020 | | 225,734 | | | — | | | 30,516 | | | 256,250 | |
| D Harrison | | | | | | | | |
| Fiscal Year 2021 | | 231,734 | | | 112,498 | | | 1,195 | | | 345,427 | |
| Fiscal Year 2020 | | 228,734 | | | 168,533 | | | 27,002 | | | 424,269 | |
| A Littley | | | | | | | | |
| Fiscal Year 2021 | | — | | | — | | | — | | | — | |
| Fiscal Year 2020 | | 76,796 | | | — | | | 487 | | | 77,283 | |
| R van der Meer | | | | | | | | |
| Fiscal Year 2021 | | — | | | — | | | — | | | — | |
| Fiscal Year 2020 | | 73,796 | | | — | | | 781 | | | 74,577 | |
R Chenu4 | | | | | | | | |
| Fiscal Year 2021 | | 122,993 | | | — | | | — | | | 122,993 | |
| Fiscal Year 2020 | | 208,734 | | | — | | | 1,811 | | | 210,545 | |
| A Gisle Joosen | | | | | | | | |
| Fiscal Year 2021 | | 217,734 | | | — | | | — | | | 217,734 | |
| Fiscal Year 2020 | | 208,734 | | | — | | | 16,621 | | | 225,355 | |
| P Lisboa | | | | | | | | |
| Fiscal Year 2021 | | 217,093 | | | — | | | — | | | 217,093 | |
| Fiscal Year 2020 | | 225,734 | | | — | | | 27,441 | | | 253,175 | |
| A Lloyd | | | | | | | | |
| Fiscal Year 2021 | | 221,777 | | | — | | | — | | | 221,777 | |
| Fiscal Year 2020 | | 205,734 | | | 511,305 | | | 34,337 | | | 751,376 | |
| R Rodriguez | | | | | | | | |
| Fiscal Year 2021 | | 217,734 | | | — | | | — | | | 217,734 | |
| Fiscal Year 2020 | | 211,734 | | | — | | | 20,680 | | | 232,414 | |
| M Nozari | | | | | | | | |
| Fiscal Year 2021 | | 205,734 | | | 12,937 | | | — | | | 218,671 | |
| Fiscal Year 2020 | | 80,417 | | | — | | | 22,248 | | | 102,665 | |
| N Stein | | | | | | | | |
| Fiscal Year 2021 | | 190,072 | | | — | | | — | | | 190,072 | |
| Fiscal Year 2020 | | — | | | — | | | — | | | — | |
| H Wiens | | | | | | | | |
| Fiscal Year 2021 | | 181,430 | | | — | | | — | | | 180,430 | |
| Fiscal Year 2020 | | — | | | — | | | — | | | — | |
| S Rowland | | | | | | | | |
| Fiscal Year 2021 | | 31,565 | | | — | | | — | | | 31,565 | |
| Fiscal Year 2020 | | — | | | — | | | — | | | — | |
| D Seavers | | | | | | | | |
| Fiscal Year 2021 | | 31,565 | | | — | | | — | | | 31,565 | |
| Fiscal Year 2020 | | — | | | — | | | — | | | — | |
| Total Compensation for Non-Executive Directors |
| Fiscal Year 2021 | | 2,432,175 | | | 829,086 | | | 5,068 | | | 3,266,329 | |
| Fiscal Year 2020 | | 2,175,941 | | | 1,314,069 | | | 212,686 | | | 3,702,696 | |
| | | | | |
| |
James Hardie 2021 Annual Report on Form 20-F | 60 |
| |
____________
1Amount includes base, Chairman and Committee Chairman fees, as well as fees for attendance at ad hoc sub-committee meetings.
2Amount for M Hammes for fiscal year 2021 relates to a supplemental compensation payment of (i) US$497,791 in relation to income for the year ended 31 December 2019; and (ii) US$205,860 in relation to income for the year ended 31 December 2020 in circumstances where Irish income taxes levied on director compensation exceeded net income taxes owed on such compensation in their country of tax residence and paid in accordance with the remuneration policy for non-executive directors.
Amount for D Harrison for fiscal year 2021 relates to a supplemental compensation payment of US$112,498 in relation to income for the year ending 31 December 2019 in circumstances where Irish income taxes levied on director compensation exceeded net income taxes owed on such compensation in their country of tax residence and paid in accordance with the remuneration policy for non-executive directors.
Amount for M Nozari for fiscal year 2021 relates to a supplemental compensation payment of US$12,937 in relation to income for the year ending 31 December 2019 in circumstances where Irish income taxes levied on director compensation exceeded net income taxes owed on such compensation in their country of tax residence and paid in accordance with the remuneration policy for non-executive directors.
3Amount includes the cost of non-executive directors’ fiscal compliance in Ireland, other costs connected with Board-related events paid for by the Company and tax services related to tax equalization benefits.
4In addition to the compensation set forth above, Mr Chenu continues to receive certain tax services from the Company, and remains eligible for certain tax equalization benefits relative to the vesting of previously granted equity awards, stemming from his prior service as an executive officer of the Company.
Director Remuneration for the years ended 31 March 2021 and 2020
For Irish reporting purposes, the breakdown of director’s remuneration between managerial services (which only relate to Dr Truong) and director services is:
| | | | | | | | | | | |
| Years Ended 31 March |
| (In US dollars) | 2021 | | 2020 |
Managerial Services1 | $ | 19,509,351 | | | $ | 5,862,529 | |
Director Services2 | 3,472,063 | | | 3,908,420 | |
| $ | 22,981,414 | | | $ | 9,770,949 | |
____________
1Includes cash payments, non-cash benefits (examples include medical and life insurance benefits, car allowances, membership in executive wellness programs, financial planning and tax services), 401(k) benefits, and amounts expensed for outstanding equity awards for CEO J Truong.
2Includes compensation for all non-executive directors, which includes base, Chairman, supplemental compensation fees (as described in footnote 2 of the table above which sets out the remuneration for non-executive directors), Committee Chairman fee and cost of non-employee directors’ fiscal compliance in Ireland. It includes costs connected with Board-related events paid for by the Company and it includes a proportion of the former CEO's remuneration paid as fees for his service on the JHI plc Board in fiscal years 2021 and 2020.
| | | | | |
| |
James Hardie 2021 Annual Report on Form 20-F | 61 |
| |
SHARE OWNERSHIP AND STOCK BASED COMPENSATION ARRANGEMENTS
As of 30 April 2021 and 30 April 2020, the number of CUFS and RSUs beneficially owned by Senior Executive Officers is set forth below:
| | | | | | | | | | | | | | | | | | | | | | | | | | |
| Name | | CUFS at
30 April
2021 | | CUFS at
30 April
2020 | | RSUs at
30 April
2021 | | RSUs at
30 April
2020 |
| J Truong | | 61,669 | | | — | | | 678,114 | | | 596,682 | |
| J Miele | | 29,997 | | | 18,592 | | | 81,574 | | | 73,735 | |
| S Gadd | | 89,216 | | | 67,928 | | | 250,956 | | | 326,154 | |
| J Blasko | | 98,578 | | | 64,861 | | | 124,902 | | | 157,352 | |
| R Kilcullen | | 21,875 | | | — | | | 102,642 | | | 127,744 | |
As of 30 April 2021 and 30 April 2020, the number of CUFS and RSUs beneficially owned by non-executive directors is set forth below:
| | | | | | | | | | | | | | |
| Name | | CUFS at
30 April
2021 | | CUFS at
30 April
2020 |
M Hammes 1 | | 44,109 | | | 44,109 | |
| A Gisle Joosen | | 3,920 | | | 3,920 | |
D Harrison 2 | | 19,259 | | | 19,259 | |
P Lisboa 3 | | 3,089 | | | 2,389 | |
A Lloyd 4 | | 18,000 | | | 18,000 | |
M Nozari 5 | | 10,000 | | | 1,000 | |
| R Rodriguez | | 270 | | | — | |
S Rowland 6 | | 2,000 | | | — | |
D Seavers 7 | | 81 | | | — | |
N Stein 8 | | 3,653 | | | — | |
H Wiens 9 | | 6,633 | | | — | |
____________
135,109 CUFS held in the name of Mr and Mrs Hammes and 9,000 CUFS held as ADSs in the name of Mr and Mrs Hammes.
22,384 CUFS held in the name of Mr Harrison, 1,000 CUFS held as ADSs in the name of Mr Harrison and 15,875 CUFS held as ADSs in the name of Mr and Mrs Harrison.
33,089 CUFS held as ADSs in the name of Mr Lisboa.
418,000 CUFS held as ADSs in the name of Ms Lloyd.
510,000 CUFS held as ADSs in the name of Mr Nozari.
62,000 CUFS held as ADSs in the name of Ms Rowland.
781 CUFS held as ADSs in the name of Mr Seavers.
83,400 CUFS held in the name of Mr Stein and 253 CUFS held as ADSs in the name of Mr Stein.
96,633 CUFS held as ADSs in the name of Mr Wiens.
Based on 444,288,874 shares of common stock outstanding at 30 April 2021 (all of which are subject to CUFS), no director or Senior Executive Officer beneficially owned 1% or more of the outstanding shares of the Company at 30 April 2021 and none of the shares held by directors or Senior Executive Officers have any special voting rights. As of 30 April 2021, there were no options outstanding under any of the
| | | | | |
| |
James Hardie 2021 Annual Report on Form 20-F | 62 |
| |
Company’s stock-based compensation arrangements. Individual’s holding RSUs have no voting or investment power over these units.
Stock-Based Compensation Arrangements
At 31 March 2021, we had the following equity award plans:
•the LTIP; and
•the 2001 Plan.
LTIP
The Company uses the LTIP as the plan for LTI grants to Senior Executive Officers and selected members of executive management. Participants in the LTIP receive grants of RSUs and Scorecard LTI, each of which is subject to performance goals. Participants and award levels are approved by the Remuneration Committee based on local market standards, and the individual’s responsibility, performance and potential to enhance shareholder value. The LTIP was first approved at our 2006 AGM, and our shareholders have subsequently approved amendments to the LTIP in 2008, 2009, 2010, 2012, 2015 and 2018.
The LTIP provides for plan participants’ early exercise of certain benefits or early payout under the plan in the event of a “change in control,” takeover by certain organizations or liquidation. For RSUs, a “change of control” is deemed to occur if (1) a takeover bid is made to acquire all of the shares of the Company and it is recommended by the Board or becomes unconditional, (2) a transaction is announced which would result in one person owning all the issued shares in the Company, (3) a person owns or controls sufficient shares to enable them to influence the composition of the Board, or (4) a similar transaction occurs which the Board determines to be a control event. On a change of control, the Board can determine that all or some RSUs have vested on any conditions it determines, and any remaining RSUs lapse.
RSUs - From fiscal year 2009, the Company commenced using RSUs granted under the LTIP. RSUs issued under the LTIP are unfunded and unsecured contractual entitlements and generally provide for settlement in shares of our common stock, subject to performance vesting hurdles prior to vesting. Additionally, the Company has on occasion issued a small number of cash settled awards.
| | | | | |
| |
James Hardie 2021 Annual Report on Form 20-F | 63 |
| |
As of 31 March 2021, there were 2,013,210 RSUs granted and outstanding under the LTIP, as follows:
| | | | | | | | | | | | | | |
| Restricted Stock Units |
| Grant Type | Grant Date | Granted | Vested as of
31 March 2021 | Outstanding as of 31 March 2021 |
| TSR - Retention | August 2017 | 246,903 | | 42,591 | | 74,070 | |
| ROCE - Retention | August 2017 | 136,440 | | 14,327 | | 40,932 | |
| TSR | August 2018 | 663,738 | | — | | 461,370 | |
| ROCE | August 2018 | 357,797 | | — | | 248,706 | |
| TSR | September 2018 | 49,381 | | — | | 49,381 | |
| ROCE | September 2018 | 25,385 | | — | | 25,385 | |
| TSR | August 2019 | 496,497 | | — | | 406,078 | |
| ROCE | August 2019 | 268,491 | | — | | 219,500 | |
| TSR | February 2020 | 6,676 | | — | | 6,676 | |
| ROCE | February 2020 | 4,767 | | — | | 4,767 | |
| TSR | August 2020 | 289,347 | | — | | 289,347 | |
| ROCE | August 2020 | 186,998 | | — | | 186,998 | |
| | Total Outstanding | 2,013,210 | |
Scorecard LTI - From fiscal year 2010, the Company commenced using Scorecard LTI units granted under the LTIP. The Scorecard LTI is used by the Remuneration Committee to set strategic objectives which change from year to year, and for which performance can only be assessed over a period of time. The vesting of Scorecard LTI units is subject to the Remuneration Committee’s exercise of negative discretion. The cash payment paid to award recipients is based on JHI plc’s share price on the vesting date (which was amended from fiscal year 2012 to be based on a 20 trading-day closing average price).
As of 31 March 2021, there were 2,178,879 Scorecard LTI units granted and outstanding under the LTIP, as follows:
| | | | | | | | |
| Scorecard LTI |
| Grant Type | Grant Date | Granted and Outstanding as of 31 March 2021 |
| Scorecard - Retention | August 2017 | 122,796 | |
| Scorecard | August 2018 | 746,125 | |
| Scorecard | September 2018 | 76,155 | |
| Scorecard | January 2019 | 28,558 | |
| Scorecard | August 2019 | 629,947 | |
| Scorecard | February 2020 | 14,301 | |
| Scorecard | August 2020 | 560,997 | |
| | 2,178,879 | |
For additional information regarding the LTIP and award grants made thereunder, see Note 16 to our consolidated financial statements.
| | | | | |
| |
James Hardie 2021 Annual Report on Form 20-F | 64 |
| |
2001 Plan
The 2001 Plan is intended to promote the Company’s long-term financial interests by encouraging management below the senior executive level to acquire an ownership position in the Company and align their interests with our shareholders. Selected employees under the 2001 Plan are eligible to receive awards in the form of RSUs, nonqualified stock options, performance awards, restricted stock grants, stock appreciation rights, dividend equivalent rights, phantom stock or other stock-based benefits. Award levels are determined based on the Remuneration Committee’s review of local market standards and the individual’s responsibility, performance and potential to enhance shareholder value.
The 2001 Plan was first approved by our shareholders and Board in 2001 and reapproved to continue until September 2021 at the 2011 AGM. An aggregate of 45,077,100 shares of common stock were made available for issuance under the 2001 Plan, subject to adjustment in the event of a number of prescribed events set out on the 2001 Plan. Outstanding RSUs granted under the 2001 Plan generally vest at the rate of 25% on the 1st anniversary of the grant, 25% on the 2nd anniversary date and 50% on the 3rd anniversary date.
The 2001 Plan is administered by our Remuneration Committee, and the Remuneration Committee or its delegate is authorized to determine: (i) who may participate in the 2001 Plan; (ii) the number and types of awards made to each participant; and (iii) the terms, conditions and limitations applicable to each award. The Remuneration Committee has the exclusive power to interpret and adopt rules and regulations to administer the 2001 Plan, including a limited power to amend, modify or terminate the 2001 Plan to meet any changes in legal requirements or for any other purpose permitted by law.
The purchase or exercise price of any award granted under the 2001 Plan may be paid in cash or other consideration at the discretion of our Remuneration Committee, including cashless exercises.
The exercise price for all options is the market value of the shares on the date of grant. The Company may not reduce the exercise price of such an option or exchange such an option or stock appreciation right for cash, or other awards or a new option at a reduced exercise price without shareholder approval or as permitted under specific restructuring events.
No unexercised options or unvested RSUs issued under the 2001 Plan are entitled to dividends or dividend equivalent rights.
The 2001 Plan also permits the Remuneration Committee to grant stock options, performance awards, restricted stock awards, stock appreciation rights, dividend equivalent rights or other stock based benefits.
The 2001 Plan provides for the automatic acceleration of certain benefits and the termination of the plan under certain circumstances in the event of a “change in control.” A change in control will be deemed to have occurred if either (1) any person or group acquires beneficial ownership equivalent to 30% of our voting securities, (2) individuals who are currently members of our Board cease to constitute at least a majority of the members of our Board, or (3) there occurs the consummation of certain mergers (other than a merger that results in existing voting securities continuing to represent more than 5% of the voting power of the merged entity or a recapitalization or reincorporation that does not result in a material change in the beneficial ownership of the voting securities of the Company), the sale of substantially all of our assets or our complete liquidation or dissolution.
Options - Until fiscal year 2008, the Company issued options to purchase shares of our common stock issued under the 2001 Plan. As of 31 March 2021, there were no options outstanding under the 2001 Plan.
| | | | | |
| |
James Hardie 2021 Annual Report on Form 20-F | 65 |
| |
RSUs - Since fiscal year 2009, the Company has issued restricted stock units under the 2001 Plan, which are unfunded and unsecured contractual entitlements for shares to be issued in the future and may be subject to time vesting or performance hurdles prior to vesting. On vesting, restricted stock units convert into shares. We granted 358,922 restricted stock units under the 2001 Plan in the fiscal year ended 31 March 2021. As of 31 March 2021, there were 593,950 restricted stock units outstanding under this plan, divided as follows:
| | | | | | | | | | | |
| Restricted Stock Units |
| Grant Date | Granted | Vested as of
31 March 2021 | Outstanding as of 31 March 2021 |
| December 2018 | 545,185 | | 230,424 | | 194,395 | |
| March 2019 | 72,608 | | 35,461 | | 28,890 | |
| June 2019 | 23,486 | | 11,743 | | 11,743 | |
| June 2020 | 330,961 | | 1,024 | | 318,077 | |
| August 2020 | 30,628 | | | 32,628 | |
| December 2020 | 7,792 | | | 7,792 | |
| February 2021 | 425 | | | 425 | |
| Total Outstanding | 593,950 | |
For additional information regarding the 2001 Plan and award grants made thereunder, see Note 16 to our consolidated financial statements.
| | | | | |
| |
James Hardie 2021 Annual Report on Form 20-F | 66 |
| |
CORPORATE GOVERNANCE REPORT
Corporate Governance Statement
The Company believes strong corporate governance is essential to achieving both its short and long-term performance goals and to maintaining the trust and confidence of investors, employees, regulatory agencies, customers and other stakeholders. The Board follows, both formally and informally, corporate governance principles designed to assure that the Board, through its membership, composition, Board committee structure and governance practices, is able to provide informed, competent and independent guidance and oversight and thereby promote long-term shareholder value. This Corporate Governance Statement (this “Statement”) describes the key aspects of the Company’s corporate governance framework.
During fiscal year 2021, the Board evaluated the Company’s corporate governance framework and practices and approved this Statement. This Statement is current as at 30 April 2021.
Overall Approach to Corporate Governance
The Company operates under the regulatory requirements of numerous jurisdictions, including those of its corporate domicile (Ireland) and its principal stock exchange listings (Australia and the United States). In presenting this Statement, the Board has evaluated the Company’s corporate governance framework in relation to the ASX Corporate Governance Council’s Corporate Governance Principles and Recommendations (4th Edition) (the “ASX Principles”), as well as the NYSE Corporate Governance Standards (the “NYSE Standards”).
ASX Principles
Pursuant to ASX Listing Rule 4.10.3, the Company is required to disclose in this Annual Report the extent to which it has followed the ASX Principles for fiscal year 2021 and must identify any areas where the Company has determined not to follow the ASX Principles and provide the reasons for not following them.
NYSE Standards
As a foreign private issuer with ADSs listed on the NYSE, the Company is required to disclose in this Annual Report any significant ways in which its corporate governance practices differ from those followed by domestic companies under NYSE listing standards. Based on the requirements of the NYSE Standards, the Company believes that its corporate governance framework and practices were consistent with the NYSE Standards during fiscal year 2021, except as otherwise noted below:
•Generally, in the United States, an audit committee of a public company is directly responsible for appointing the company’s independent registered public accounting firm, with such appointment being subsequently ratified by shareholders. Under Irish law, the independent registered public accounting firm is directly appointed by the shareholders where there is a new appointment. Otherwise, the appointment is deemed to continue unless the firm retires, is asked to retire or is unable to perform their duties; and
•NYSE rules require each issuer to have an audit committee, a compensation committee (equivalent to a remuneration committee) and a nominating committee composed entirely of independent directors. As a foreign private issuer, the Company does not have to comply with this requirement; however, the Board committee charters reflect Australian and Irish practices, in that such Board committees have a majority of independent directors, unless a higher number or percentage is mandated.
| | | | | |
| |
James Hardie 2021 Annual Report on Form 20-F | 67 |
| |
Availability of Key Governance Documents
This Statement, as well as the Company’s Constitution, Board committee charters and the other key governance and corporate policies referenced in this Statement, as updated from time to time, are available in the Corporate Governance section of the Company’s investor relations website (www.ir.jameshardie.com.au) or by requesting a copy from the Company Secretary at the Company’s corporate headquarters, Europa House, 2nd Floor, Harcourt Centre, Harcourt Street, Dublin 2, D02 WR20, Ireland.
The Board committee charters and other key governance and corporate policies referenced in this Statement were reviewed by the Board during fiscal year 2021.
Discussion of Corporate Governance Framework and Practices
The following discussion of the Company’s corporate governance framework and practices incorporates the disclosures required by the ASX Principles, and generally follows the order of the ASX Principles.
Principle 1: Lay Solid Foundations for Management and Oversight
The Role of the Board and Management
The principal role of the Board is to promote and protect shareholder value by providing strategic guidance to management and overseeing management’s implementation of the Company’s strategic goals and objectives. On an annual basis, the Board reviews the Company’s strategic priorities with management, including the Company’s business plan, and leads discussions on execution strategy, including budgetary considerations, to ensure that the Company has the appropriate resources to deliver the agreed strategy. The Board also monitors management, operational and financial performance against the Company’s goals on an ongoing basis throughout the year. To enable it to do this, the Board receives operational and financial updates at every scheduled Board meeting.
The Board is accountable to shareholders by whom they are elected for delivering long-term shareholder value. To achieve this, the Board ensures that the Company has in place a framework of controls, which enables management to appraise and manage risk effectively with oversight from the Board, through clear and robust procedures and delegated authorities.
In accordance with the provisions of the Company’s Constitution, the Board committee charters and other applicable governance and corporate policies, the Board has delegated a number of powers to Board committees and responsibility for the day-to-day management of the Company’s affairs and the implementation of corporate strategy to the CEO. The responsibilities delegated to the CEO are established by the Board and include limits on the way in which the CEO can exercise such authority. In addition, the Board has also reserved certain matters to itself for decision, including:
•appointing, removing and assessing the performance and remuneration of the CEO and CFO;
•the appointment and removal of the Company Secretary;
•succession planning for the Board and the CEO and defining the Company’s management structure and responsibilities;
•approving the overall strategy for the Company, including the business plan and annual operating and capital expenditure budgets;
•ensuring that the Company has in place an appropriate risk management framework and that the risk appetite and tolerances are set at an appropriate level;
•ensuring that the Company has in place an appropriate framework for relevant information to be reported by management to the Board;
| | | | | |
| |
James Hardie 2021 Annual Report on Form 20-F | 68 |
| |
•convening and monitoring the operation of shareholder meetings and approving matters to be submitted to shareholders for their consideration;
•approving annual and periodic reports, results announcements and related media releases, and notices of shareholder meetings;
•approving the dividend policy and interim dividends and, when appropriate, making recommendations to shareholders regarding the annual dividend;
•reviewing the authority levels of the CEO and management;
•approving the remuneration framework for the Company;
•overseeing corporate governance matters for the Company;
•approving corporate-level Company policies;
•considering management’s recommendations on various matters which are above the authority levels delegated to the CEO or management;
•oversight of sustainability-related topics and strategy; and
•any other matter which the Board considers appropriate to be approved by the Board.
In discharging its duties, the Board aims to take into account, within the context of the industry in which the Company operates, the interests of the Company (including the interests of its employees), shareholders, and other stakeholders, and where possible, aligns its activities with current best practices in the jurisdictions in which the Company operates.
The full list of those matters reserved to the Board is formalized in our Board Charter. The Board Charter is available in the Corporate Governance section of our investor relations website (www.ir.jameshardie.com.au).
Board Committees
In order to ensure that the Board properly discharges its responsibilities and fulfills its oversight role, the Board has established the following standing Board committees:
•Audit Committee;
•Remuneration Committee; and
•Nominating and Governance Committee.
Additionally, from time to time, the Board may establish ad hoc Board committees to address particular matters. Each standing Board committee meets at least quarterly and has scheduled an annual calendar of meetings and discussion topics to assist it to properly discharge all of its responsibilities. Each Board committee Chair reports to the Board at each scheduled Board meeting on their activities.
Each of the standing Board committees operates under a written charter adopted by the Board. On an annual basis, each committee, with the assistance of the Nominating and Governance Committee, undertakes a review of its charter for consistency with applicable regulatory requirements and current corporate governance principles and practices. Each of the standing Board committee charters is available on the Corporate Governance section of the Company’s investor relations website (www.ir.jameshardie.com.au).
Full discussions of the role and oversight responsibilities for each standing committee are provided below under Principle 2 (Nominating and Governance Committee), Principle 4 (Audit Committee) and Principle 8 (Remuneration Committee).
| | | | | |
| |
James Hardie 2021 Annual Report on Form 20-F | 69 |
| |
Board and Board Committee Meetings
The Board and each of the standing Board committees meet formally at least four times a year and on an ad hoc basis as deemed necessary or appropriate. Scheduled Board meetings are normally held over a period of one or two days, with Board committee meetings also taking place during such time. This meeting structure enhances the effectiveness of the Board and the Board committees. Board and Board committee meetings are generally held at the Company’s corporate headquarters in Ireland. At each scheduled meeting, the Board meets in executive session without management present for at least part of the meeting.
Prior to each scheduled Board or Board committee meeting, directors are provided timely and necessary information by Company management to allow them to fulfill their duties. The Nominating and Governance Committee periodically reviews the format, timeliness and content of information provided to the Board and Board committees. All directors receive access to all Board committee materials and may attend any Board committee meeting, whether or not they are members of such committee. Directors also receive the minutes of each committee’s deliberations and findings, as well as oral reports from each Board committee Chair, at each scheduled Board meeting.
In discharging their duties, directors are provided with direct access to executive management and outside advisors and auditors.
The Board has regular discussions with the CEO and executive management regarding the Company’s strategy and performance, during which Board members formally review the Company’s progress. During the year, the Board and each Board committee develop and review an annual work plan created from the standing Board committee charters so that the responsibilities of each Board committee are addressed at appropriate times throughout the year.
| | | | | |
| |
James Hardie 2021 Annual Report on Form 20-F | 70 |
| |
The following table provides the composition of each standing Board committee during fiscal year 2021, as well as sets out the number of Board and Board committee meetings held, and each director’s attendance:
| | | | | | | | | | | | | | | | | | | | | | | | | | | | | | | | | | | | | | | | | | | | | | | | | | | | | | | | | | | | | | | | | | | | |
| | | Board | | Audit | | Remuneration | | Nominating &
Governance |
| Name | | H | | A | | Member | | H | | A | | Member | | H | | A | | Member | | H | | A |
| M Hammes | | 5 | | 5 | | | | | | | | • | | 5 | | 5 | | • | | 4 | | 4 |
B Anderson1 | | 3 | | 3 | | • | | 3 | | 3 | | • | | 2 | | 1 | | | | | | |
R Chenu2 | | 3 | | 3 | | | | | | | | • | | 2 | | 2 | | • | | 2 | | 2 |
| D Harrison | | 5 | | 5 | | • | | 4 | | 4 | | C | | 3 | | 3 | | • | | 2 | | 2 |
| A Gisle Joosen | | 5 | | 5 | | • | | 4 | | 4 | | | | | | | | | | | | |
| P Lisboa | | 5 | | 5 | | | | | | | | • | | 5 | | 5 | | • | | 2 | | 2 |
| A Lloyd | | 5 | | 5 | | C | | 3 | | 3 | | • | | 3 | | 3 | | • | | 4 | | 4 |
| M Nozari | | 5 | | 5 | | | | | | | | • | | 2 | | 2 | | • | | 1 | | 1 |
| R Rodriguez | | 5 | | 5 | | | | | | | | | | | | | | • | | 4 | | 4 |
S Rowland3 | | 2 | | 2 | | | | | | | | | | | | | | | | | | |
D Seavers4 | | 2 | | 2 | | | | | | | | | | | | | | | | | | |
| N Stein | | 5 | | 5 | | • | | 4 | | 4 | | | | | | | | C | | 2 | | 2 |
| H Wiens | | 5 | | 5 | | | | | | | | • | | 4 | | 4 | | | | | | |
____________
● Board Committee member
C Board Committee chair
H Number of meetings held during the time the director held office or was a member of the Board committee during the fiscal year.
A Number of meetings attended during the time the director held office or was a member of the Board committee during the fiscal year. Non-committee members may also attend Board committee meetings from time to time; these attendances are not shown.
1 B Anderson retired as director at 2020 Annual General Meeting.
2 R Chenu retired as director at 2020 Annual General Meeting.
3 S Rowland appointed as director in February 2021.
4 D Seavers appointed as director in February 2021.
Company Secretary
The Company Secretary is accountable to the Board through the Chair of the Board on all matters relative to the proper functioning of the Board. The Company Secretary is also responsible for ensuring that Board procedures are complied with. All directors have access to the Company Secretary for advice and services. The Board appoints and removes the Company Secretary. The duties required of the Company Secretary include:
•advising the Board and its committees on governance matters;
•monitoring that Board and committee policy and procedures are followed;
•coordinating the timely completion and dispatch of Board and committee papers;
•ensuring that the business at Board and committee meetings is accurately captured in the minutes; and
•helping to organize and facilitate the induction and professional development of directors.
| | | | | |
| |
James Hardie 2021 Annual Report on Form 20-F | 71 |
| |
Evaluation of Director Candidates
Before appointing a director or nominating a candidate to shareholders for election as a director, the Company typically undertakes background checks, including checks as to the candidate’s education, experience, criminal history, bankruptcy and character. To facilitate shareholders making an informed decision on whether or not to elect or re-elect a director, the Board details in the Notice of Meeting all material information it possesses relevant to the decision. This information includes biographical details, relevant qualifications and experience and the skills they bring to the Board and details of any other material directorships currently held by the candidate as well as the term of office currently served by the director, and if the Board considers that the director is independent.
In addition, when a director is being elected for the first time, the following information will be presented in the Notice of Meeting:
•material adverse information revealed by the checks the Company has performed about the director;
•details of any interest, position, association or influence in a material respect; and
•if the Board considers that the candidate if elected, will qualify as an independent director.
Agreements with Directors and Senior Executives
Each incoming director receives a letter of appointment setting out the key terms and conditions of his or her appointment and the Company’s expectations of them in that role. No benefits are provided to our non-executive directors upon termination of appointment. The Company has executive agreements in place with certain senior executives where it is in the Company’s strategic interest. Certain senior executives have more specific written agreements and details of such agreements can be found in the Company’s remuneration information contained in “Section 1 – Remuneration” of this Annual Report. The letter of appointment includes:
•a requirement to disclose directors’ interests and any matters which could affect the director’s independence;
•the requirement to comply with key corporate policies, including the Company’s Code of Conduct, its Anti-Bribery and Corruption Policy and its Insider Trading policy;
•the requirement to notify the Company of, or to seek the Company's approval before accepting, any new role that could impact upon the time commitment expected of the directors or give rise to a conflict of interest;
•the Company’s policy on when directors may seek independent professional advice at the expense of the Company;
•indemnity and insurance arrangements;
•ongoing rights of access to corporate information; and
•ongoing confidentiality obligations.
Management Performance Evaluations
On an annual basis, the Remuneration Committee, and subsequently the Board, review the performance of the CEO against performance measures approved by the Board and Remuneration Committee. The CEO reviews the performance of each of the CEO’s direct reports throughout the year, assessing their performance against performance measures approved by the Remuneration Committee and the Board and reports to the Board through the Remuneration Committee on the outcome of those reviews annually. Performance evaluations for fiscal year 2021 were conducted in accordance with the process outlined above in April and May 2021. Further details on the assessment criteria for the CEO and other senior executive officers are set out in “Section 1 – Remuneration Report” of this Annual Report.
| | | | | |
| |
James Hardie 2021 Annual Report on Form 20-F | 72 |
| |
Board & Board Committee's Performance Evaluation
The Nominating and Governance Committee oversees the Board and Board committee's evaluation process and makes recommendations to the Board. During fiscal year 2021, the process, which was undertaken in February 2021, involved the completion of purpose-designed surveys by each director and a private discussion between the Chair of the Board and each director, and the results were reviewed and discussed by the Nominating and Governance Committee and the Board. Further, during fiscal year 2021, the Chair of the Nominating and Governance Committee discussed with the Board, the Chair’s performance and contribution to the effectiveness of the Board.
Workplace Diversity
James Hardie is fully committed to becoming an inclusive and globally diverse workplace, free from any form of discrimination, prejudice, inequality or injustice, with a workforce that reflects the communities we operate in and the markets we serve. We believe fostering an environment where employees have a sense of belonging, feel comfortable and are able to do their best work, is part of our overall commitment to employee wellbeing. We recognize the value of the diverse perspectives, experiences, skills and capabilities of our global team and expect each of our employees will always be treated with respect whether in the plant, office or at a customer / vendor site and unequivocally reject any form of intolerance.
The Workplace Diversity Policy, which is located in the Corporate Governance section of the Company’s investor relations website (www.ir.jameshardie.com.au), applies to all individuals recruited or employed by the Company and reflects the organization’s inclusive view of diversity, which embraces individual differences related to race, gender, age, national origin, religion, sexual orientation or disability.
The Board, with assistance from management, is responsible for approving and monitoring the Company’s diversity policy and measurable objectives in the context of the Company’s unique circumstances and industry. The Board assesses the policy and objectives annually and the Company’s progress in achieving them.
The Board has delegated responsibility to the Nominating and Governance Committee for monitoring the effectiveness of this policy to the extent it relates to diversity of the Board’s composition, senior leadership, management, and the organization as a whole and for reviewing and recommending any updates to this policy, as deemed necessary.
| | | | | |
| |
James Hardie 2021 Annual Report on Form 20-F | 73 |
| |
Details of diversity composition across various levels of the organization at the end of fiscal year 2021 are set out below:
| | | | | | | | | | | | | | |
| Level | | Percentage of female
employees | | Percentage of employees with
diversity characteristics |
James Hardie Board1 | | 36% (4 of 11) | | 55% (6 of 11) |
US BUSINESS 2 |
Senior leadership positions3 | | 16% (26 of 162) | | 28% (46 of 162) |
| All management positions | | 16% (71 of 437) | | 33% (145 of 437) |
| Total workforce | | 12% (357 of 2,904) | | 40% (1,156 of 2,904) |
NON-US BUSINESSES 4 |
Senior leadership positions3 | | 24% (14 of 58) | | |
| All management positions | | 17% (43 of 258) | | |
| Total workforce | | 17% (311 of 1,883) | | |
____________
1Includes gender and race diversity characteristics for the Board. CEO is reported with US Business Senior leadership positions.
2Includes US employees with diversity characteristics including gender, race or national origin.
3Senior Leaders are defined as individuals at senior manager and director level and above who participate in the Company and Individual Performance (CIP) Plan.
4Race/national origin diversity characteristics vary between countries and are therefore not captured in aggregate for Non-US businesses.
The Board has a goal to maintain:
•diversity characteristics in excess of 30%; and
•women in excess of 20% among non-executive directors.
| | | | | |
| |
James Hardie 2021 Annual Report on Form 20-F | 74 |
| |
With regard to the Company’s senior leadership, management, and the organization as a whole, the following table outlines the organization’s five primary objectives in promoting diversity during fiscal year 2021, the actions in place or undertaken to achieve these objectives, the progress made against these objectives during fiscal year 2021 and the fiscal year 2022 plans.
| | | | | | | | | | | |
| Objectives | FY21 Actions and Outcomes | FY22 Plans | |
To promote a culture of inclusion and diversity (which includes ethnicity, gender, skills, experience, and other elements that reflect a broad representation of individuals with various backgrounds).
| •Developed and launched a global inclusion and diversity program. Objectives are to align and refine our culture, define employee value proposition, grow and develop talent, and improve our hiring processes. •Introduced and launched two new Employee Resource Groups in North America; one for Hispanic/Latino employees and the other for African/African American employees. •Built/retrofit 4 new “mother’s rooms” with appropriate accommodations and refrigeration for lactating working mothers in our NA Headquarters building. •In Asia Pacific, an Inclusion and Diversity survey was undertaken to establish base line demographic data and Inclusion and Diversity committees were established across each country in the APAC region with specific localized country plans developed targeting areas identified in the survey. •Asia Pacific workplaces have been reviewed and where appropriate changes have been made to cater to diverse requirements (i.e. religious and nursing mother facilities). •Europe launched periodic pulse checks for the first time to improve engagement and seek feedback regarding diversity from the European workforce.
| •A global employee engagement survey will be launched and results reviewed with eye towards development of programs and initiatives to improve engagement, support diversity and further enhance our culture. •Asia Pacific region will be implementing localized specific country plans for inclusion and diversity with a focus on education across the three countries. •Install new locker rooms in Wijchen Netherlands plant as gender diversity at facility has progressed.
| |
| To ensure that recruitment and selection processes are based on merit. | •Continued showcasing diverse talent on LinkedIn and other recruiting platforms to attract more diverse talent into the organization. •As of the end of FY21 total new hires in North America were 14% female, with 4 out of 11 (36%) open Leadership roles filled by women. •Results for North America’s Engineering Development Program (EDP) recruits, 10 out of 28 (35%) hires were either female and/or diverse. •Standardized assessments and interview methodology strategies were implemented in North America to enhance selection in recruiting diverse talent. •In APAC, included a requirement for our agency panel participants to have a diverse and balanced shortlist for all roles in their service contract. | •Recruitment of diverse candidates for management roles will continue to be a focus across all global locations including requirements to have diverse candidates interview as part of each leadership opening globally. •Require our temporary employee agency partners in APAC to have a diverse and balanced shortlist for all roles in their service contract. •Introduce a scholarship program for high school students local to our operations in North America with diversity characteristics as one of the selection criteria in order to create a pipeline of local talent for our organization.
| |
To provide talent management and development opportunities which provide equal opportunities for all current employees.
| •Introduced global talent and organizational review processes for senior leadership roles to identify strengths, gaps and future succession. •Rolled out new global leadership behaviors to all employees and included these behaviors as part of our annual performance management evaluation for each employee. •Introduced global workforce planning process to determine key talent and staffing needs and skills needed on a future forward basis. •Continued our Women’s Initiative Network group in North America and introduced new Hispanic/Latino and African/Africa American employee resource groups. •In Australia, members of the management team have continued to participate in a women’s mentoring program as mentors and mentees. | •Conduct global talent and organizational review processes, including succession planning throughout the organization including levels below senior leadership. •Introduce employee development opportunities for corporate and office staff according to balanced gender ratio in Europe. •Introduce a women’s network in Europe and APAC, including outside speakers, development and networking opportunities.
| |
| | | | | |
| |
James Hardie 2021 Annual Report on Form 20-F | 75 |
| |
| | | | | | | | | | | |
| Objectives | FY21 Actions and Outcomes | FY22 Plans | |
To reward and remunerate employees fairly across the globe.
| •Conducted the annual employee wage benchmarking study to ensure remuneration is aligned with the Company remuneration philosophy. The study again included all corporate and plant locations. •Conducted a global benefits review to better understand our offerings related to local market practice and our global population’s preferences and needs. •The Workplace Gender Equality Act (WGEA) report is submitted to the Australian government on an annual basis. The WGEA confirmed that JH Australia is compliant with the Workplace Gender Equality Act 2012 (Act).
| •Complete a global job structure and market-based pay review in order to standardize job levels and job titles across the organization. Review will include evaluating compensation and incentive levels to ensure we are competitive with the local markets where we operate. •Asia Pacific will extend the WEGA gender pay review and analysis across all countries to identify any gender pay gaps and establish an action plan to address any issues identified.
| |
To provide flexible work practices across the globe.
| •Flexible working arrangements were offered across all global locations as job requirements allowed due to COVID-19 and continue to be discussed with employees throughout the organization. •Paid Time-Off (PTO), family and parental leave programs were reviewed and evaluated in North America, with updated program proposed to better align with market and current best practices in FY22. •In Asia Pacific, developed and launched Hardie Flex, a policy and guidelines to allow for flexible working arrangements where job requirements allow. •Provided family services and employee assistance to assist in balancing work life for women and emergency cases in Europe. | •Introduce and implement new and updated PTO, family and parental leave programs in North America. •Improve part time employment opportunities within and across certain roles in Europe. •Review and update the APAC Hardie Families Policy as it has been in place for 24 months.
| |
Principle 2: Structure the Board to Add Value
Composition of the Board
As of the date of this report, the Board comprises eleven non-executive directors and one executive director (being the CEO). In accordance with the Company’s Constitution, the Board must have no less than three and not more than twelve directors, with the precise number to be determined by the Board.
| | | | | | | | |
| Director | Board tenure | Independence |
| Michael Hammes | 7 February 2007 | Independent non-executive Chair |
| Jack Truong | 31 January 2019 | Chief Executive Officer, Executive director |
| David Harrison | 19 May 2008 | Independent non-executive director |
| Andrea Gisle Joosen | 20 March 2015 | Independent non-executive director |
| Persio Lisboa | 2 February 2018 | Independent non-executive director |
| Anne Lloyd | 4 November 2018 | Independent non-executive director |
| Rada Rodriguez | 13 November 2018 | Independent non-executive director |
| Moe Nozari | 6 November 2019 | Independent non-executive director |
| Nigel Stein | 14 May 2020 | Independent non-executive director |
| Harold Wiens | 14 May 2020 | Independent non-executive director |
| Suzanne B. Rowland | 4 February 2021 | Independent non-executive director |
| Dean Seavers | 4 February 2021 | Independent non-executive director |
Mr Nigel Stein and Mr Harold Wiens were appointed to the Board on 14 May 2020. Ms Suzanne Rowland and Mr Dean Seavers were appointed to the Board on 4 February 2021. For additional information on each director, see “Section 1 – Directors, Senior Management and Employees” of this Annual Report.
Mr Brian Anderson and Mr Russell Chenu retired as non-executive directors of the Board on 5 November 2020. These retirements were in line with the Board’s ongoing succession plan.
| | | | | |
| |
James Hardie 2021 Annual Report on Form 20-F | 76 |
| |
Directors may be elected by the Company's shareholders at general meetings or appointed by the Board and elected at the next general meeting if there is a vacancy. A person appointed as a director by the Board must submit him or herself for election at the next AGM. The Board and our shareholders have the right to nominate candidates for the Board. Directors may be dismissed by the Company's shareholders at a general meeting. In accordance with the Company’s Constitution and the ASX Listing Rules, no director (other than the CEO) shall hold office for a continuous period of more than three years without being re-elected by shareholders at an AGM. The Company’s Constitution provides for a classified Board structure and the Board is divided into three classes (excluding the CEO). Upon the expiration of the term of a class of directors at an AGM, each director in that class may, if willing to act and if the Board so recommends, put themselves forward for re-election at that same AGM to serve from the time of re-election until the third AGM following his or her re-election.
The Board’s overriding desire is to maximize its effectiveness by appointing the best candidates for vacancies and closely reviewing the performance of directors subject to re-election. Directors are not automatically nominated for re-election. Nomination for re-election is based on a number of factors, including an assessment of their individual performance, independence, tenure, and their skills and experience relative to the needs of the Company. The Nominating and Governance Committee and the Board discuss the performance of each director due to stand for re-election at the next AGM before deciding whether to recommend their re-election.
As part of the appointment process, the Nominating and Governance Committee, in consultation with the Board, considers the size and composition of the Board, the current range of skills, competencies and experience and the desired range of skills, as well as Board renewal, succession and diversity plans. The Nominating and Governance Committee identifies suitable candidates, with assistance from an external consultant, where appropriate, and a number of directors meet with those candidates. Prior to the Board selecting the most suitable candidate (based on a recommendation from the Nominating and Governance Committee), the Board, with the assistance of external consultants, conducts appropriate background and reference checks.
During fiscal year 2021, the Nominating and Governance Committee continued to execute its forward-looking plan for Board and Committee succession, to ensure orderly succession to key posts (including for the Chair of the Board), effective recruitment and smooth onboarding of new members (including any required transition). The plan is under regular review by the Board supported by updates and reports to the Board from the Nominating and Governance Committee.
Board refreshment and renewal continued in fiscal year 2021 with the retirement of two non-executive directors and the appointment of four new non-executive directors. It is anticipated that during fiscal year 2022, further Board refreshment and renewal will take place.
Director Independence
In accordance with the ASX Principles and the NYSE Standards, the Company requires that a majority of directors on the Board and the Board committees, as well as the Chair of the Board and each committee, be independent, unless a greater number is required to be independent under the rules and regulations of the ASX, the NYSE or other applicable regulatory body.
All directors are expected to bring their independent views and judgment to the Board and Board committees and must declare any potential or actual conflicts of interest. For a director to be considered independent, the Board must determine the director does not have any direct or indirect business or other relationship that could materially interfere with such director’s exercise of independent judgment. In assessing the independence of each director, the Board considers the standards for determining director independence set forth in the ASX Principles and the NYSE Standards and evaluates all potential
| | | | | |
| |
James Hardie 2021 Annual Report on Form 20-F | 77 |
| |
conflicting relationships on a case-by-case basis, considering the materiality of each potential or actual conflict of interest.
During fiscal year 2021, the Board, with the assistance of the Nominating and Governance Committee, undertook an independence assessment of each director. The Board determined that, with the exception of Jack Truong, as CEO of the Company, each of Michael Hammes, Andrea Gisle Joosen, David Harrison, Persio Lisboa, Anne Lloyd, Moe Nozari, Rada Rodriguez, Suzanne B. Rowland, Dean Seavers, Nigel Stein and Harold Wiens is independent.
In assessing Ms Lloyd’s independence, the Board considered her role as interim Chief Financial Officer of the Company for a six month period, from August 2019 to February 2020 and determined that notwithstanding her performing this role, given its short term nature she remains independent. The position held will not interfere with Ms Lloyd's capacity to bring an independent judgment to bear on issues before the Board and to act in the best interests of the Company as a whole.
In assessing the independence of Mr Hammes, the Board considered his expanded role (which concluded in late 2019) in management succession planning and, notwithstanding (i) the additional time the Chair of the Board spent with the management team, and (ii) his length of tenure, the Board believes that he has not formed an association with management that could interfere with his ability to exercise independent judgment.
The Board also believes that, notwithstanding the length of Mr Harrison's tenure, he remains independent in character and judgment and has not formed an association with management that could interfere with his ability to exercise independent judgment.
Director Qualifications and Board Diversity
The Board seeks to achieve a mix of skills, experience and expertise to maximize the effectiveness of the Board and utilizes a skills matrix in reviewing Board composition and in succession planning. The following lists the mix of skills, experience and diversity the Board has and is looking to achieve, taking into consideration the strategic objectives of the Company.
| | | | | |
| |
James Hardie 2021 Annual Report on Form 20-F | 78 |
| |
Key Board Skills and Experience
| | | | | |
| Skill and Experience | Definition |
| Executive leadership | •Successful business history at a senior executive level, including international business management. |
| Board experience | •Experience as a non-executive director of a listed company. |
| Succession planning | •Experience in identifying and growing talent to fill leadership and business-critical positions. |
| Strategy | •Demonstrable ability to develop and implement successful business strategy. •Experience in overseeing management for the delivery of strategic objectives. |
| Governance | •Awareness of global governance practices and trends. •Experience in the identification and resolution of regulatory issues across a wide range of jurisdictions. |
| Financial acumen/ Corporate finance | •Experience in financial accounting and reporting and evaluating financial risks and the adequacy of financial controls. •Understanding of key financial drivers of business and corporate finance. •Understanding of capital markets. |
| Risk management | •Experience in anticipating, evaluating and managing risks across various countries, regulatory systems or business environments.
|
| Global experience | •Experience in developing and implementing successful and sustainable operational/ governance structures in new geographies and jurisdictions. •Exposure to different political, cultural and regulatory business environments. |
| Health, safety and environmental | •Experience in a role with responsibility for the health and safety of employees. •Experience implementing and improving health and safety processes/ management systems. •Experience with social responsibility issues. |
| Human resources and executive remuneration | •Experience leading large, diverse and geographically distributed teams, promoting inclusion and diversity. •Experience in talent management and culture. •Senior executive role or board experience of remuneration frameworks that aim to attract and retain high caliber of executives and other employees. |
| Manufacturing | •Senior executive experience or technical experience in the manufacturing sector, including end-to-end supply chain and LEAN Manufacturing. |
| Market experience/ Customer Centricity/Innovation | •Experience in next generation insight, digital and customer experience. •Experience in technical innovation and new product development. •Experience in retail industry and merchandise expertise. •Industry Knowledge. |
| Commercial Brand Management/ Marketing | •Experience in brand building and consumer marketing. •Experience in new products commercialization. |
The Board regularly reviews its skills matrix to make sure it covers the skills needed to address existing and emerging business and governance issues relevant to the Company. During the year, we identified retail experience as an area which could be strengthened on the Board and is a key consideration in the Board renewal process, which also aligns with the Company's strategic plan.
Information regarding Board diversity can be found in the “Workplace Diversity” section above.
Directors must be able to devote a sufficient amount of time to prepare for, and effectively participate in, Board and Board committee meetings. The Nominating and Governance Committee reviews the other commitments of directors annually and otherwise, as required. In fiscal year 2021, the Nominating and Governance Committee noted that Ms Lloyd, who is considered a financial expert by virtue of her
| | | | | |
| |
James Hardie 2021 Annual Report on Form 20-F | 79 |
| |
qualifications and previous experience, serves on a total of three public company audit committees (including the Company’s Audit Committee). The Board has determined that such simultaneous service does not impair the ability of Ms Lloyd to effectively serve as Chair of the Company’s Audit Committee.
Biographical information for each member of the Board, along with the skills, qualifications, experience and relevant expertise for each director, and his or her date and term of appointment, are summarized in the Board biography section of this Annual Report and also appear in the Corporate Governance section of the Company’s investor relations website (www.ir.jameshardie.com.au).
Nominating and Governance Committee
| | | | | | | | |
| Director | Committee tenure | Independence |
| Nigel Stein – Committee Chair | 21 October 2020 | Independent non-executive director |
| Michael Hammes | 16 November 2009 | Independent non-executive Chair |
| Rada Rodriguez | 13 November 2018 | Independent non-executive director |
| Moe Nozari | 7 February 2020 | Independent non-executive director |
| Persio Lisboa | 21 October 2020 | Independent non-executive director |
The Board has established the Nominating and Governance Committee to identify and recommend to the Board individuals qualified to become members of the Board, develop and recommend to the Board a set of corporate governance principles, and perform a leadership role in shaping the Company’s corporate governance policies. The duties and responsibilities of the Nominating and Governance Committee include:
•identifying and recommending to the Board individuals qualified to become directors;
•overseeing the evaluation of the Board and senior management and formulating succession plans for the CEO, CFO and senior executives;
•assessing the independence of each director;
•reviewing the remuneration of directors;
•reviewing the conduct of the AGM; and
•performing a leadership role in shaping the Company’s culture and corporate governance policies.
A more complete description of these duties and responsibilities and other Nominating and Governance Committee functions is contained in the Nominating and Governance Committee’s Charter, a copy of which is available in the Corporate Governance section of the Company’s investor relations website (www.ir.jameshardie.com.au).
Management Succession Planning
The Board, together with the Nominating and Governance Committee, has developed, and periodically reviews with the CEO, management succession plans, policies and procedures for the CEO and certain other members of executive management.
Retirement and Tenure Policy
The Company does not have a retirement and tenure policy. The length of tenure of individual directors is one of many factors considered by the Board when assessing the independence, performance and contribution of a director, in succession planning, and as part of the Board’s decision-making process when considering whether a director should be recommended by the Board for re-election.
| | | | | |
| |
James Hardie 2021 Annual Report on Form 20-F | 80 |
| |
Related Party Transactions
Other than the compensation arrangements with our executive officers and directors, which are disclosed in “Section 1 – Remuneration” of this Annual Report, the Company has not entered into any related party transactions requiring disclosure during fiscal year 2021.
Induction and Continuing Development
The Company has an induction program for new directors, tailored to their existing skills, knowledge and experience, to position them to discharge their responsibilities effectively and to add value. The program includes an overview of the Company’s governance arrangements and directors’ duties in Ireland, the United States and Australia, plant and market tours to understand the Company’s strategic plans and impart relevant industry knowledge, briefings on the Company’s risk management and control framework, financial results and key risks and issues, and meeting other directors, the CEO and members of management. New directors are also provided with comprehensive orientation materials including relevant corporate documents and policies.
The Nominating and Governance Committee regularly assesses whether the directors as a group have the skills, knowledge and experience to deal with new and emerging business and governance issues and professional development is provided for identified gaps. For example, training on key accounting matters is provided through internal and external sources for directors with little accounting skills or knowledge.
In addition, the Company regularly schedules time at Board meetings to develop the Board’s understanding of the Company’s operations, regulatory environment and material developments in laws, including updates on topical developments from management and external experts.
Board Leadership Structure
In an effort to promote the efficient undertaking of its roles and responsibilities, the Board has appointed one of its independent, non-executive members, Michael Hammes, as Chair of the Board. In his role as Chair of the Board, Mr Hammes co-ordinates the Board’s duties and responsibilities and acts as an active liaison between management and the Company’s non-executive directors, maintaining frequent contact with the CEO and being advised generally on the progress of Board and Board committee meetings. In his role as Chair of the Board, Mr Hammes also:
•provides leadership to the Board;
•chairs Board and shareholder meetings;
•facilitates Board discussions;
•monitors, evaluates and assesses the performance of the Board and Board committees; and
•is a member of and attends meetings of the Remuneration and Nominating and Governance committees.
At the behest of the Board, Mr Hammes remained heavily engaged in fiscal year 2021 in Company CEO and leadership assessment, succession, transition, and development.
Remuneration
For a detailed discussion of the Company’s remuneration policies for directors and executives, and the link between remuneration and overall corporate performance, see “Section 1 – Remuneration” of this Annual Report.
| | | | | |
| |
James Hardie 2021 Annual Report on Form 20-F | 81 |
| |
Board Accumulation Guidelines
Non-executive directors are encouraged to accumulate up to 1.5 times (and 2 times for the Chair of the Board) the base Board member fee in the Company’s shares (either personally, in the name of their spouse, or through a personal superannuation or pension plan) over a reasonable time following their appointment. The Remuneration Committee reviews the guidelines and non-executive directors’ shareholdings on a periodic basis.
Independent Advice and Access to Information
In addition to their access to the Company Secretary and senior management, the Board, the Board committees and individual directors may all seek independent professional advice at the Company’s expense for the proper performance of their duties.
Indemnification
The Company’s Constitution provides for indemnification of any person who is (or who was) a director, the Company Secretary, or an employee or any other person deemed by the Board to be an agent of the Company, who suffers any loss as a result of any action in discharge of their duties, in the absence of a willful act or default and subject to the provisions of the Irish Companies Acts.
The Company and certain of its subsidiaries have provided Deeds of Access, Insurance and Indemnity to directors and executives who are directors or officers of the Company or its subsidiaries.
Principle 3: Instill a culture of acting lawfully, ethically and responsibly
The Company’s values and leadership behaviors are integral to our business and express the standards and behaviors expected of directors, senior executives and employees:
Thrive on Competition – we will execute our business strategy by never accepting the status quo and continuously striving to be better than we were yesterday;
Build on Organizational Advantage – we will win by recruiting, engaging and developing the right people through a culture that promotes innovation, high performance and growth;
Embrace Step Change – we will seek and support opportunities that drive toward the Company Mission by deviating from established practices;
Operate with Respect – we will behave with professionalism and regard toward our internal and external stakeholders, fostering a diverse environment of candid communication and ideas.
Global Code of Business Conduct
The Company seeks to maintain high standards of integrity and is committed to ensuring that the Company conducts its business in accordance with high standards of ethical behavior. The Company requires its employees to comply with both the spirit and the letter of all laws and other statutory requirements governing the conduct of the Company’s activities in each country in which the Company operates. The Company has adopted a Global Code of Business Conduct (the “Code of Conduct”) which applies to all of the Company’s employees and directors. The Code of Conduct covers many aspects of corporate policy and addresses compliance with legal and other responsibilities to stakeholders. All directors and employees of the Company worldwide are required to review the Code of Conduct on an annual basis. As part of its oversight functions, the Audit Committee oversees the Code of Conduct and
| | | | | |
| |
James Hardie 2021 Annual Report on Form 20-F | 82 |
| |
reviews the policy on an annual basis. A copy of the Code of Conduct is available in the Corporate Governance section of the Company’s investor relations website (www.ir.jameshardie.com.au).
The Company did not grant any waivers from the provisions of the Code of Conduct during fiscal year 2021.
Complaints/Ethics Hotline
The Code of Conduct provides employees with advice about who they should contact if they have information or questions regarding potential violations of the policy. Globally, the Company maintains an ethics hotline operated telephonically (except in France) by an independent external provider which allows employees to report anonymously any concerns. All Company employees worldwide are reminded annually of the existence of the ethics hotline.
All complaints, whether to the ethics hotline or otherwise, are initially reported directly to the General Counsel and Chief Compliance Officer, Employment Counsel, Chief Human Resources Officer and the Director of Internal Audit (except in cases where the complaint refers to one of them). The material complaints are referred immediately to the Chair of the Board and the Audit Committee. Less serious complaints are reported to the Audit Committee on a quarterly basis.
Interested parties who have a concern about the Company’s conduct, including accounting, internal accounting controls or audit matters, may communicate directly with the Company’s Chair of the Board, directors as a group, the Chair of the Audit Committee or Audit Committee members. These communications may be confidential or anonymous, and may be submitted in writing to the Company Secretary at the Company’s corporate headquarters or submitted by phone on +1 312 705 6164. All concerns will be forwarded to the appropriate directors for their review and will be simultaneously reviewed and addressed by the Company’s General Counsel, Chief Compliance Officer and Company Secretary in the same way that other concerns are addressed. The Company’s Code of Conduct, which is described above, prohibits any employee from retaliating or taking any adverse action against anyone for raising or helping to resolve a concern about integrity.
Insider Trading
All directors and employees of the Company are subject to the Company’s Insider Trading Policy. Under the Insider Trading Policy, employees and directors may generally conduct transactions in the Company’s securities during a four week period beginning two days after the announcement of quarterly or full year results, or such other periods as may be designated by the Board provided that such persons are not in possession of material, non-public information. The Insider Trading Policy also contains preclearance requirements for certain designated senior employees and directors, as well as general prohibitions on hedging activities or selling any shares for short-swing profit. There is a general prohibition on hedging unvested shares, options or RSUs.
The Board recognizes that it is the individual responsibility of each director and employee to ensure he or she complies with the Insider Trading Policy and applicable insider trading laws.
A copy of the Insider Trading Policy is available in the Corporate Governance section of the Company’s investor relations website (www.ir.jameshardie.com.au).
| | | | | |
| |
James Hardie 2021 Annual Report on Form 20-F | 83 |
| |
Anti-Bribery and Corruption
James Hardie is committed to ensuring a workplace free from bribery and corruption. This zero tolerance is endorsed and supported by senior management and the Board. All employees must comply with the Company's Anti-Bribery and Corruption Policy.
All complaints, are initially reported directly to the General Counsel and Chief Compliance Officer, Employment Counsel, Chief Human Resources Officer and the Director of Internal Audit (except in cases where the complaint refers to one of them). The material complaints are referred immediately to the Chair of the Board and the Audit Committee. Less serious complaints are reported to the Audit Committee on a quarterly basis.
A copy of the Anti-Bribery and Corruption Policy is available in the Corporate Governance section of the Company’s investor relations website (www.ir.jameshardie.com.au).
Principle 4: Safeguard Integrity in Corporate Reporting
Audit Committee
| | | | | | | | |
| Director | Committee tenure | Independence |
Anne Lloyd – Committee Chair | 4 November 2018 - 26 August 2019, 1 June 2020;
Chair since 7 August 2020 | Independent non-executive director |
| David Harrison | 18 August 2008 | Independent non-executive director |
| Andrea Gisle Joosen | 20 March 2015 | Independent non-executive director |
| Nigel Stein | 1 June 2020 | Independent non-executive director |
| Suzanne B. Rowland | 6 November 2020 | Independent non-executive director |
| Dean Seavers | 6 November 2020 | Independent non-executive director |
The Board has established the Audit Committee to oversee the adequacy and effectiveness of the Company’s accounting and financial policies and controls. The Audit Committee provides advice and assistance to the Board in fulfilling its responsibilities and, amongst other matters:
•overseeing the Company’s financial reporting process and reports on the results of its activities to the Board;
•reviewing with management and the external auditor the Company’s annual and quarterly financial statements and reports to shareholders; discussing earnings releases as well as information and earnings guidance provided to analysts;
•reviewing and assessing the Company’s risk management strategy, policies and procedures and the adequacy of the Company’s policies, processes and frameworks for managing risk;
•exercising general oversight of the appointment and provision of all external audit services to the Company, the remuneration paid to the external auditor, and the performance of the Company’s internal audit function;
•reviewing the adequacy and effectiveness of the Company’s internal compliance and control procedures;
•reviewing the Company’s compliance with legal and regulatory requirements; and
•establishing procedures for complaints regarding accounting, internal accounting controls and auditing matters, including any complaints from whistle-blowers.
A more complete description of these and other Audit Committee functions is contained in the Audit Committee’s Charter, a copy of which is available in the Corporate Governance section of the Company’s investor relations website (www.ir.jameshardie.com.au).
| | | | | |
| |
James Hardie 2021 Annual Report on Form 20-F | 84 |
| |
The Audit Committee meets at least quarterly in a separate executive session with the external auditor and internal auditor, respectively. The Chair of the Audit Committee reports to the full Board following each Audit Committee meeting. As part of such report, the Chair of the Audit Committee will inform the Board of any general issues that arise with respect to the quality or integrity of the Company’s financial statements, the Company’s compliance with legal or regulatory requirements, the Company’s risk management framework, the performance and independence of the external auditor, or the performance of the internal audit function.
All members of the Audit Committee are financially literate and have sufficient business, industry and financial expertise to act effectively as members of the Audit Committee. In addition, in accordance with the SEC rules, the Nominating and Governance Committee and the Board have determined that Mr Harrison, Ms Lloyd and Mr Stein qualify as “audit committee financial experts". Ms Lloyd transitioned into the role of Chair of the Audit Committee, in August 2020 prior to Mr Anderson’s retirement from the Board at the conclusion of the 2020 Annual General meeting in November. The skills, qualifications, experience and relevant expertise for each member are summarized in the Board biography section of this Annual Report.
Internal Audit
The Vice President of Internal Audit heads the internal audit department. It is the role of the internal audit department to provide assurance, independent of management, that the Company’s internal processes, controls and procedures are operating to provide an effective financial reporting and risk management framework. The Internal Audit Charter sets out the independence of the internal audit department, its scope of work, responsibilities and audit plan. The internal audit department’s work plan is approved annually by the Audit Committee. The Vice President of Internal Audit reports to the Chair of the Audit Committee and meets quarterly with the Audit Committee in executive sessions.
External Audit
Ernst & Young LLP has served as the Company’s external auditor since fiscal year 2009. The external auditor reviews each quarterly and half-year consolidated financial statements and audits the full year consolidated financial statements. The external auditor attends each meeting of the Audit Committee, including an executive session where members of the Audit Committee are present. The Audit Committee has approved policies to ensure that all non-audit services performed by the external auditor, including the amount of fees payable for those services, receive prior approval. The Audit Committee also reviews the remuneration paid to the external auditor and makes recommendations to the Board regarding the maximum compensation to be paid to the external auditor and concerning their reappointment as external auditor. The lead audit engagement partner is required to rotate every five years.
The Audit Committee reviews and approves management representations made to the external auditor as part of the audit of the full year results.
Representatives of Ernst & Young LLP are present at each AGM to make a statement if they desire to do so and are available to respond to appropriate questions from shareholders.
| | | | | |
| |
James Hardie 2021 Annual Report on Form 20-F | 85 |
| |
Management Representations
Consistent with applicable SEC rules, the CEO and CFO of the Company have provided the certifications required by Section 302 and 906 of the Sarbanes Oxley Act 2002, which, among other things, certify that to the best of each individual’s knowledge:
•the financial statements, and other financial information included in this Annual Report, fairly present in all material respects the financial condition, results of operations and cash flows of the Company as of, and for, the periods presented in this Annual Report; and
•this Annual Report does not contain any untrue statement of a material fact or omit to state a material fact necessary to make the statements made, in light of the circumstances under which such statements were made, not misleading with respect to the period covered by this Annual Report.
Principle 5: Make Timely and Balanced Disclosure
Continuous Disclosure and Market Communication
The Company strives to comply with all relevant disclosure laws and listing rules in Australia (ASIC and ASX) and the United States (SEC and NYSE).
The Company’s Continuous Disclosure and Market Communication Policy aims to ensure timely communications so that investors can readily:
•understand the Company’s strategy and assess the quality of its management;
•examine the Company’s financial position and the strength of its growth prospects; and
•receive any news or information that might reasonably be expected to materially affect the price or market for the Company securities.
Furthermore, the Company releases any new and substantive investor or analyst presentation on the ASX Market Announcements Platform ahead of the presentation.
The CEO is responsible for ensuring the Company complies with its continuous disclosure obligations. A Disclosure Committee comprised of senior management (CEO, CFO, General Counsel and the Vice President – Investor and Media Relations) is responsible for all decisions regarding market disclosure obligations outside of the Company’s normal financial reporting calendar. The Nominating and Governance Committee reviewed the Continuous Disclosure and Market Communication policy and the Audit Committee reviewed the Company’s disclosure practices under the Continuous Disclosure and Market Communication policy during fiscal year 2021. A copy of the Continuous Disclosure and Market Communication policy is available in the Corporate Governance section of the Company’s investor relations website (www.ir.jameshardie.com.au).
Principle 6: Respect the Rights of Security Holders
Communication
The Company is committed to communicating effectively with the Company’s shareholders and engaging them through its dedicated investor relations program that includes:
•making management briefings and presentations accessible via a live webcast and/or teleconference following the release of quarterly and annual results;
•audio webcasts of other management briefings and the annual shareholder meeting;
•a comprehensive investor relations website that displays all announcements and notices (promptly after they have been cleared by the ASX), major management and investor road show presentations;
•site visits and briefings on strategy for investment analysts;
| | | | | |
| |
James Hardie 2021 Annual Report on Form 20-F | 86 |
| |
•regular engagement with institutional shareholders to discuss a wide range of governance issues;
•an email alert service to advise shareholders and other interested parties of announcements and other events; and
•equality of access for shareholders and investment analysts to briefings, presentations and meetings and equality of media access to the Company, on a reasonable basis.
Shareholders can also elect to receive communications from the Company and its share registry, by electronic means. In addition, shareholders can communicate directly with the Company and its registry via the Company’s investor relations website (www.ir.jameshardie.com.au).
Annual General Meeting
The 2020 AGM was held in Ireland and shareholders were able to participate in the AGM via teleconference of proceedings. The 2021 AGM will also be held in Ireland, and shareholders not present in Ireland who wish to participate in the meeting, including asking questions about the management of the Company, can do so via teleconference. In addition, shareholders have the opportunity to submit questions to the Company online or by returning the question form enclosed with the Notice of Meeting in advance of the meeting. Questions received from shareholders will be collated and the Chair of the Board will address as many questions as possible at the meeting. Shareholders also have the opportunity to ask questions of the external auditor at the AGM about the conduct of the audit and the preparation of the auditor’s report.
Notices of Meeting are accompanied by explanatory notes which provide clear and concise information regarding the business to be transacted at the meeting.
Further details regarding the 2021 AGM will be set out in the 2021 AGM Notice of Meeting. This will be available electronically to all shareholders and made available on the Company’s website.
Each shareholder (other than an ADS holder) has the right to:
•attend the AGM virtually, in person or by proxy;
•speak at the AGM; and
•exercise voting rights, including at the AGM, subject to their instructions on the Voting Instruction Form.
While ADS holders cannot vote directly, ADS holders can direct the voting of their underlying shares through the ADS depositary.
At any general meeting, and as provided in the Company’s constitution, a resolution put to the vote of the meeting shall be decided on a poll.
Principle 7: Recognize and Manage Risk
Risk Management Objectives
The Company believes that sound risk management policies, procedures and controls produce a system of risk oversight, risk management and internal control that is fundamental to good corporate governance and compliance and creation of shareholder value. The objective of the Company’s risk management policies, procedures and controls is to ensure that:
•the Company’s principal strategic, operational and financial risks are identified and assessed;
•the Company’s risk appetite for each risk is considered;
•effective systems are in place to monitor and manage risks; and
•reporting systems, internal controls and arrangements for monitoring compliance with laws and regulations are adequate.
| | | | | |
| |
James Hardie 2021 Annual Report on Form 20-F | 87 |
| |
Risk management does not involve avoiding all risks. The Company’s risk management policies seek to strike a balance between ensuring that the Company continues to generate financial returns while simultaneously managing risks appropriately by setting appropriate strategies, objectives, controls and tolerance levels.
The Company’s business, operations and financial condition are subject to various risks and uncertainties, including risks related to economic and regulatory concerns. For additional information, see “Section 3 – Risk Factors” of this Annual Report which outlines the significant factors that may adversely affect the Company’s business, operations, financial performance and condition or industry, and information as to how the Company manages a number of these risks.
Risk Management Framework
The Board and its standing Board committees oversee the Company’s overall strategic direction, including setting risk management strategy, processes, tolerance and parameters. Generally, the Audit Committee is responsible for oversight of the Company’s risk management strategy, policies, procedures and controls. As there is currently no separate Risk Committee at Board level, the Audit Committee reviews, monitors and discusses these matters with the CEO, CFO, General Counsel, Vice President of Internal Audit and other senior business leaders. The Audit Committee, CEO, CFO and General Counsel report periodically to the Board on the Company’s risk management policies, processes and controls. The Audit Committee and the Board review and evaluate the Company’s risk management strategies and processes on an on-going basis throughout the course of each fiscal year.
The Audit Committee is supported in its oversight role by the policies put in place by management to oversee and manage material business risks, as well as the roles played by internal risk management committees, as described below, and internal and external audit functions. The internal and external audit functions are separate from and independent of each other and each has a direct reporting line to the Audit Committee. The CEO and the CEO’s direct reports are the primary management forum for risk assessment and management within the Company.
Consistent with its oversight functions, the Audit Committee reviewed the Company’s risk management framework and internal controls during fiscal year 2021. As part of the review, information was reported by management to the Audit Committee to enable it to assess the effectiveness of the Company’s risk management and internal control systems. In addition, consistent with the requirements of Section 404 of the Sarbanes-Oxley Act of 2002, during fiscal year 2021, management assessed the effectiveness of the Company’s internal controls over financial reporting and the effectiveness of the Company’s internal control over financial reporting has been audited by Ernst & Young LLP. Based on its assessment, management concluded that the Company’s internal controls over financial reporting were effective as of 31 March 2021. For additional information, see “Section 3 – Controls and Procedures” of this Annual Report.
Risk Management Committee
The Company maintains management level risk committees that focus on operation-related risks in the regions in which the Company operates and corporate-related risks (the “Risk Management Committees”). The Risk Management Committees comprise a cross-functional group of employees who review and monitor the risks facing the Company from the perspective of their particular business region and area of responsibility. The Risk Management Committee is coordinated by the General Counsel. The Vice President of Internal Audit and the General Counsel also provide quarterly reports to the Audit Committee on key risks and the procedures in place for mitigating them.
| | | | | |
| |
James Hardie 2021 Annual Report on Form 20-F | 88 |
| |
Financial Statements Disclosure Committee
The Financial Statements Disclosure Committee is a management committee comprised of senior finance, accounting, compliance, legal, tax, treasury and investor relations executives in the Company, which meets with the CEO, CFO and General Counsel prior to the Board’s consideration of any quarterly or annual results. The Financial Statements Disclosure Committee is a forum for the CEO, CFO and General Counsel to discuss, and, on the basis of those discussions, report to the Audit Committee, about a range of risk management procedures, policies and controls, covering the draft results materials, business unit financial performance and the current status of legal, tax, treasury, accounting, compliance, internal audit, complaints and disclosure control matters.
Policies for Management of Material Business Risks
Management has put in place a number of key policies, processes and independent controls to provide assurance as to the integrity of the Company’s systems of internal control and risk management. In addition to the measures described elsewhere in this Annual Report, the more significant policies, processes or controls adopted by the Company for oversight and management of material business risks are:
•engagement with members of the Risk Management Committee, at least quarterly, to assess the key strategic, operations, reporting and compliance risks facing the Company, the level of risk and the processes implemented to manage each of these key risks over the upcoming twelve months;
•quarterly reporting to executive management, the Audit Committee, and annual reporting to the Board, of the Risk Management Committee’s assessment regarding the key strategic, operations, reporting and compliance risks facing the Company;
•a program for the Audit Committee to review in detail each year the Company’s general risk tolerance and all items identified by the Risk Management Committee as high focus risks;
•quarterly meetings of the Financial Statements Disclosure Committee to review all quarterly and annual financial statements and results;
•an internal audit department with a direct reporting line to the Chair of the Audit Committee;
•regular monitoring of the liquidity and status of the Company’s finance facilities;
•maintaining an appropriate global insurance program;
•maintaining policies and procedures in relation to treasury operations, including the use of financial derivatives and issuing procedures requiring significant capital and recurring expenditure approvals; and
•implementing and maintaining training programs in relation to legal and regulatory compliance issues such as trade practices/antitrust, insider trading, foreign corrupt practices and anti-bribery, employment law matters, trade secrecy and intellectual property protection.
The Company has a steering committee in place to address matters relating to Environmental, Social and Governance ("ESG"). In 2020 and 2021, in line with the Company's ESG roadmap objectives, targets and initiatives were set, a review of the Company's systems and processes took place and the Company published a Sustainability Overview as part of our Annual Review in August 2020.
Limitations of Control Systems
Due to the inherent limitations in all control systems and the fact that there are resource constraints in the design of any control system, management does not expect that the Company’s internal risk management and control systems will prevent or detect all error and all fraud. No matter how well it is designed and operated, no evaluation of controls can provide absolute assurance that misstatements due to error or fraud will not occur or that all control issues and instances of fraud, if any, within the Company have been detected.
| | | | | |
| |
James Hardie 2021 Annual Report on Form 20-F | 89 |
| |
The inherent limitations in all control systems include the realities that judgments in decision making can be faulty and that breakdowns can occur because of simple error or mistake. Controls can also be circumvented by the individual acts of some persons, by collusion of two or more people, or by management override of the controls. The design of any system of controls is based in part on certain assumptions about the likelihood of future events, and there can be no assurance that any design will succeed in achieving its stated goals under all potential future conditions. Projections of any evaluation of controls’ effectiveness to future periods are subject to risks. Over time, controls may become inadequate because of changes in conditions or deterioration in the degree of compliance with policies or procedures.
Principle 8: Remunerate Fairly and Responsibly
Remuneration Committee
| | | | | | | | |
| Director | Committee tenure | Independence |
David Harrison – Committee Chair | 26 October 2020;
Chair since 26 October 2020 | Independent non-executive director |
| Michael Hammes | 16 November 2009 | Independent non-executive Chair |
| Persio Lisboa | 9 August 2018 | Independent non-executive director |
| Harold Wiens | 1 June 2020 | Independent non-executive director |
| Anne Lloyd | 26 October 2020 | Independent non-executive director |
The Remuneration Committee oversees the Company’s overall remuneration structure, policies and programs, assesses whether the Company’s remuneration structure establishes appropriate incentives for management and employees, and approves any significant changes in the Company’s remuneration structure, policies and programs. Amongst other things, the Remuneration Committee:
•administers and makes recommendations on the Company’s incentive compensation and equity-based remuneration plans for senior management;
•reviews the remuneration framework for the Company; and
•makes recommendations to the Board on the Company’s recruitment, retention and termination policies and procedures for senior management.
A more complete description of these and other Remuneration Committee functions is contained in the Remuneration Committee’s Charter, a copy of which is available in the Corporate Governance section of the Company’s investor relations website (www.ir.jameshardie.com.au), and in “Section 1 – Remuneration Report” of this Annual Report. In addition, details of the Company’s remuneration philosophy, policies, plans and procedures during fiscal year 2021 are disclosed in "Section 1 – Remuneration Report" of this Annual Report.
| | | | | |
| |
James Hardie 2021 Annual Report on Form 20-F | 90 |
| |
SECTION 2
READING THIS REPORT
Forward-Looking Statements
This Annual Report contains forward-looking statements. The Company may from time to time make forward-looking statements in its periodic reports filed with or furnished to the Securities and Exchange Commission, on Forms 20-F and 6-K, in its annual reports to shareholders, in offering circulars, invitation memoranda and prospectuses, in media releases and other written materials and in oral statements made by the Company’s officers, directors or employees to analysts, institutional investors, existing and potential lenders, representatives of the media and others. Statements that are not historical facts are forward-looking statements and such forward-looking statements are statements made pursuant to the safe harbor provisions of the Private Securities Litigation Reform Act of 1995.
Examples of forward-looking statements include:
•statements about the Company’s future performance;
•projections of the Company’s results of operations or financial condition;
•statements regarding the Company’s plans, objectives or goals, including those relating to strategies, initiatives, competition, acquisitions, dispositions and/or its products;
•expectations concerning the costs associated with the suspension or closure of operations at any of the Company’s plants and future plans with respect to any such plants;
•expectations concerning the costs associated with the significant capital expenditure projects at any of the Company’s plants and future plans with respect to any such projects;
•expectations regarding the extension or renewal of the Company’s credit facilities including changes to terms, covenants or ratios;
•expectations concerning dividend payments and share buy-backs;
•statements concerning the Company’s corporate and tax domiciles and structures and potential changes to them, including potential tax charges;
•uncertainty from the expected discontinuance of LIBOR and transition to any other interest rate benchmark;
•statements regarding the effect and consequences of the COVID-19 public health crisis;
•statements regarding tax liabilities and related audits, reviews and proceedings;
•statements regarding the possible consequences and/or potential outcome of legal proceedings brought against us and the potential liabilities, if any, associated with such proceedings;
•expectations about the timing and amount of contributions to AICF, a special purpose fund for the compensation of proven Australian asbestos-related personal injury and death claims;
•expectations concerning the adequacy of the Company’s warranty provisions and estimates for future warranty-related costs;
•statements regarding the Company’s ability to manage legal and regulatory matters (including, but not limited to, product liability, environmental, intellectual property and competition law matters) and to resolve any such pending legal and regulatory matters within current estimates and in anticipation of certain third-party recoveries; and
•statements about economic or housing market conditions in the regions in which we operate, including but not limited to, the levels of new home construction and home renovations, unemployment levels, changes in consumer income, changes or stability in housing values, the availability of mortgages and other financing, mortgage and other interest rates, housing affordability and supply, the levels of foreclosures and home resales, currency exchange rates, and builder and consumer confidence.
| | | | | |
| |
James Hardie 2021 Annual Report on Form 20-F | 91 |
| |
Words such as “believe,” “anticipate,” “plan,” “expect,” “intend,” “target,” “estimate,” “project,” “predict,” “forecast,” “guideline,” “aim,” “will,” “should,” “likely,” “continue,” “may,” “objective,” “outlook” and similar expressions are intended to identify forward-looking statements but are not the exclusive means of identifying such statements. Readers are cautioned not to place undue reliance on these forward-looking statements and all such forward-looking statements are qualified in their entirety by reference to the following cautionary statements.
Forward-looking statements are based on the Company’s current expectations, estimates and assumptions and because forward-looking statements address future results, events and conditions, they, by their very nature, involve inherent risks and uncertainties, many of which are unforeseeable and beyond the Company’s control. Such known and unknown risks, uncertainties and other factors may cause actual results, performance or other achievements to differ materially from the anticipated results, performance or achievements expressed, projected or implied by these forward-looking statements. These factors, some of which are discussed under “Risk Factors” in Section 3 of this Annual Report, include, but are not limited to: all matters relating to or arising out of the prior manufacture of products that contained asbestos by current and former Company subsidiaries; required contributions to AICF, any shortfall in AICF funding and the effect of currency exchange rate movements on the amount recorded in the Company’s financial statements as an asbestos liability; compliance with and changes in tax laws and treatments; competition and product pricing in the markets in which the Company operates; the consequences of product failures or defects; exposure to environmental, asbestos, putative consumer class action or other legal proceedings; general economic and market conditions; the supply and cost of raw materials; possible increases in competition and the potential that competitors could copy the Company’s products; compliance with and changes in environmental and health and safety laws; risks of conducting business internationally; compliance with and changes in laws and regulations; currency exchange risks; dependence on customer preference and the concentration of the Company’s customer base; dependence on residential and commercial construction markets; the effect of adverse changes in climate or weather patterns; use of accounting estimates; risk and uncertainties arising out of the COVID-19 public health crisis, including the impact of COVID-19 on our business, sales, results of operations and financial condition and all other risks identified in the Company’s reports filed with Australian, Irish and US securities regulatory agencies and exchanges (as appropriate). The Company cautions you that the foregoing list of factors is not exhaustive and that other risks and uncertainties may cause actual results to differ materially from those referenced in the Company’s forward-looking statements. Forward-looking statements speak only as of the date they are made and are statements of the Company’s current expectations concerning future results, events and conditions. The Company assumes no obligation to update any forward-looking statements or information except as required by law.
MANAGEMENT’S DISCUSSION AND ANALYSIS
The following discussion of our financial condition and results of operations should be read in conjunction with our consolidated financial statements and the related notes, including the accounting policies affecting our financial condition and results of operations, which are fully described in Note 1 to our consolidated financial statements, presented later in this Annual Report.
In the following discussion and analysis, we intend to provide management’s explanation of the factors that have affected our financial condition and results of operations for the fiscal years covered by the financial statements included in this Annual Report, as well as management’s assessment of the factors and trends which are anticipated to have a material effect on our financial condition and results of operations in future periods.
| | | | | |
| |
James Hardie 2021 Annual Report on Form 20-F | 92 |
| |
Our Management's Discussion and Analysis is presented in the following sections and should be read in conjunction with our consolidated financial statements and the related notes, presented later in this Annual Report:
•Critical Accounting Estimates
•Operating Results
•Liquidity and Capital Allocation
•Outlook and Trend Information
Critical Accounting Estimates
As stated in Note 1 to our consolidated financial statements, the preparation of our financial statements requires management to make estimates and judgments that affect the reported amounts of assets and liabilities, the disclosure of contingent liabilities at the date of the financial statements and the reported revenue and expenses during the periods presented therein.
We have identified the following most critical accounting policies under which significant judgments, estimates and assumptions are made and where actual results may differ from these estimates under different assumptions and conditions and may materially affect financial results or the financial position reported in future periods:
Accounting for the AFFA
The amount of the asbestos liability has been recognized by reference to (but not exclusively based upon) the most recent actuarial estimate of projected future cash flows as calculated by KPMG Actuarial (“KPMGA”). Based on their assumptions, KPMGA arrived at a range of possible total future cash flows and calculated a central estimate, which is intended to reflect a probability-weighted expected outcome of those actuarially estimated future cash flows projected by the actuary to occur through 2073.
We recognize the asbestos liability in the consolidated financial statements on an undiscounted and uninflated basis. We considered discounting when determining the best estimate under US GAAP. We have recognized the asbestos liability by reference to (but not exclusively based upon) the central estimate as undiscounted on the basis that it is our view that the timing and amounts of such cash flows are not fixed or readily determinable. We considered inflation when determining the best estimate under US GAAP. It is our view that there are material uncertainties in estimating an appropriate rate of inflation over the extended period of the AFFA. We view the undiscounted and uninflated central estimate as the best estimate under US GAAP.
Adjustments in the asbestos liability due to changes in the actuarial estimate of projected future cash flows and changes in the estimate of future operating costs of AICF are reflected in the consolidated statements of operations and comprehensive income during the period in which they occur. Claims paid by AICF and claims-handling costs incurred by AICF are treated as reductions in the asbestos liability balances.
In estimating the potential financial exposure, KPMGA has made a number of assumptions, including, but not limited to, assumptions related to the peak period of claims, total number of claims that are reasonably estimated to be asserted through 2073, the typical cost of settlement (which is sensitive to, among other factors, the industry in which a plaintiff claims exposure, the alleged disease type, the age of the claimant and the jurisdiction in which the action is brought), the legal costs incurred in the litigation of such claims, the rate of receipt of claims, the settlement strategy in dealing with outstanding claims and the timing of settlements. Changes to the assumptions may be necessary in future periods should mesothelioma claims reporting escalate or decline.
| | | | | |
| |
James Hardie 2021 Annual Report on Form 20-F | 93 |
| |
An updated actuarial assessment is performed as of 31 March each year. Any changes in the estimate will be reflected as a charge or credit to the consolidated statements of operations for the year then ended.
Inventory
Inventories are recorded at the lower of cost or net realizable value. In order to determine net realizable value, management regularly reviews inventory quantities on hand and evaluates significant items to determine whether they are excess, slow-moving or obsolete. The estimated value of excess, slow-moving and obsolete inventory is recorded as a reduction to inventory and an expense in cost of sales in the period in which it is identified. This estimate requires management to make judgments about the future demand for inventory and is therefore at risk to change from period to period. If our estimate for the future demand for inventory is greater than actual demand and we fail to reduce manufacturing output accordingly, we could be required to record additional inventory reserves, which would have a negative impact on our gross profit.
Accrued Warranty Reserve
We have offered, and continue to offer, various warranties on our products. Because our fiber cement products have only been used in North America since the early 1990s, there is a risk that these products will not perform in accordance with our expectations over an extended period of time. A typical warranty program requires that we replace defective products within a specified time period from the date of sale. We record an estimate for future warranty-related costs based on an analysis by us, which includes the historical relationship of warranty costs to installed product at an estimated remediation cost per standard foot. Based on this analysis and other factors, we adjust the amount of our warranty provisions as necessary. Although our warranty costs have historically been within calculated estimates, if our experience is significantly different from our estimates, it could result in the need for additional reserves.
Accounting for Income Tax
We recognize deferred tax assets and deferred tax liabilities for the expected tax consequences of temporary differences between the tax bases of assets and liabilities and their reported amounts using enacted tax rates in effect for the year in which we expect the differences to reverse. We record a valuation allowance to reduce the deferred tax assets to the amount that we are more likely than not to realize. We must assess whether, and to what extent, we can recover our deferred tax assets. If we cannot satisfy a more-likely-than-not threshold for full or partial recovery, we must increase our income tax expense by recording a valuation allowance against the portion of deferred tax assets that we cannot recover. If facts later indicate that we will be unable to recover all or a portion of our net deferred tax assets, our income tax expense would increase in the period in which we determine that recovery does not meet the more-likely-than-not threshold.
We evaluate our uncertain tax positions in accordance with the guidance for accounting for uncertainty in income taxes. Positions taken by an entity in its income tax returns must satisfy a more-likely-than-not recognition threshold, assuming that the positions will be examined by taxing authorities with full knowledge of all relevant information, in order for the positions to be recognized in the consolidated financial statements. Each quarter we evaluate the income tax positions taken, or expected to be taken, to determine whether these positions meet the more-likely-than-not threshold. We are required to make subjective judgments and assumptions regarding our income tax positions and must consider a variety of factors, including the current tax statutes and the current status of audits performed by tax authorities in each tax jurisdiction. To the extent an uncertain tax position is resolved for an amount that varies from the recorded estimated liability, our income tax expense in a given financial statement period could be materially affected.
| | | | | |
| |
James Hardie 2021 Annual Report on Form 20-F | 94 |
| |
Goodwill and Other Intangible Assets
Goodwill is the excess of purchase price over the fair value of tangible and identifiable intangible net assets acquired in various business combinations. Goodwill is not amortized but is tested at the reporting unit level for impairment annually, or more often if indicators of impairment exist. Factors that could cause an impairment in the future could include, but are not limited to, adverse macroeconomic conditions, deterioration in industry or market conditions, decline in revenue and cash flows or increases in costs and capital expenditures compared to projected results. A goodwill impairment charge is recorded for the amount by which the carrying value of the reporting unit exceeds the fair value of the reporting unit.
Intangible assets from acquired businesses are recognized at their estimated fair values at the date of acquisition and consist of trademarks, customer relationships and other intangible assets. Finite-lived intangibles are amortized to expense over the applicable useful lives, ranging from 2 to 13 years, based on the nature of the asset and the underlying pattern of economic benefit as reflected by future net cash inflows. We perform an impairment test of intangibles annually, or whenever events or changes in circumstances indicate their carrying value may be impaired.
Impairment of Long-Lived Assets
Long-lived assets, such as property, plant and equipment, are evaluated each quarter for events or changes in circumstances that indicate that an asset might be impaired because the carrying amount of the asset may not be recoverable. These include, without limitation, a significant adverse change in the extent or manner in which a long-lived asset or asset group is being used, a current period operating or cash flow loss combined with a history of operating or cash flow losses, a projection or forecast that demonstrates continuing losses associated with the use of a long-lived asset or asset group and/or a current expectation that it is more likely than not that a long-lived asset or asset group will be sold or otherwise disposed of significantly before the end of its previously estimated useful life. Identifying these events and changes in circumstances, and assessing their impact on the appropriate valuation of the affected assets requires us to make judgments, assumptions and estimates.
When such indicators of potential impairment are identified, recoverability is tested by grouping long-lived assets that are used together and represent the lowest level for which cash flows are identifiable and distinct from the cash flows of other long-lived assets, which is typically at the production line or plant facility level, depending on the type of long-lived asset subject to an impairment review.
Recoverability is measured by a comparison of the carrying amount of the asset group to the estimated undiscounted future cash flows expected to be generated by the asset group. If the carrying amount exceeds the estimated undiscounted future cash flows, an impairment charge is recognized at the amount by which the carrying amount exceeds the estimated fair value of the asset group.
The methodology used to estimate the fair value of the asset group is typically based on a discounted cash flow analysis or a relative, market-based approach based on purchase offers or appraisals received from third parties, that considers the asset group’s highest and best use that would maximize the value of the asset group. In addition, the estimated fair value of an asset group also considers, to the extent practicable, a market participant’s expectations and assumptions in estimating the fair value of the asset group. If the estimated fair value of the asset group is less than the carrying value, an impairment loss is recognized at an amount equal to the excess of the carrying value over the estimated fair value of the asset group.
| | | | | |
| |
James Hardie 2021 Annual Report on Form 20-F | 95 |
| |
In estimating the fair value of the asset group, we are required to make certain estimates and assumptions that include forecasting the useful lives of the assets, selecting an appropriate discount rate that reflects the risk inherent in future cash flows, forecasting market demand for our products and recommissioning idle assets to meet anticipated capacity constraints in the future. We have not made any material changes in the accounting methodology we use to assess impairment loss during the past three fiscal years. However, if actual results are not consistent with our estimates and assumptions used in estimating future cash flows and asset fair values, we may be exposed to material impairment losses in future periods.
| | | | | |
| |
James Hardie 2021 Annual Report on Form 20-F | 96 |
| |
Operating Results
Year ended 31 March 2021 compared to year ended 31 March 2020
| | | | | | | | | | | | | | | | | | | | |
| | | | | | |
| US$ Millions (except volume and per share data) | FY21 | FY20 | | Change % |
| Volume (mmsf) | | 4,131.4 | | | 3,841.7 | | | 8 | |
| | | | | | |
| Net sales | | $ | 2,908.7 | | | $ | 2,606.8 | | | 12 | |
| Cost of goods sold | | (1,857.0) | | | (1,673.1) | | | (11) | |
| Gross profit | | 1,051.7 | | | 933.7 | | | 13 | |
| | | | | | |
| Selling, general and administrative expenses | | (389.6) | | | (415.8) | | | 6 | |
| Research and development expenses | | (34.3) | | | (32.8) | | | (5) | |
| Restructuring expenses | | (11.1) | | | (84.4) | | | 87 | |
| Asbestos adjustments | | (143.9) | | | (58.2) | | | |
| Operating income | | 472.8 | | | 342.5 | | | 38 | |
| | | | | | |
| Interest, net | | (47.8) | | | (54.4) | | | 12 | |
| Loss on early debt extinguishment | | (13.1) | | | — | | | |
| Other income (expense) | | 0.1 | | | (0.1) | | | |
| Income before income taxes | | 412.0 | | | 288.0 | | | 43 | |
| Income tax expense | | (149.2) | | | (46.5) | | | |
| Net income | | $ | 262.8 | | | $ | 241.5 | | | 9 | |
| | | | | | |
| Earnings per share - basic | | $ | 0.59 | | | $ | 0.55 | | | |
| Earnings per share - diluted | | $ | 0.59 | | | $ | 0.54 | | | |
Net sales increased 12% to US$2,908.7 million, driven by higher volumes and average net sales price in all of our operating segments.
Gross profit of US$1,051.7 million increased 13%, in line with the 12% increase in our consolidated net sales.
Selling, general and administrative ("SG&A") expenses decreased 6% primarily driven by global cost containment actions, partially offset by higher legal fees and stock compensation expenses.
R&D expenses increased 5%, due to our continued strategic focus on innovation.
Restructuring expenses for fiscal year 2021 consist solely of severance costs incurred in the first quarter related to a reduction in headcount across all regions. Fiscal year 2020 costs primarily relate to impairments of our Penrose, New Zealand and Summerville, USA plants, as
well as impairment expenses for other non-core assets.
Asbestos adjustments primarily reflect the unfavorable effect of foreign exchange on Asbestos net liabilities of US$123.0 million, and the unfavorable movement in the actuarial adjustment.
Interest, net decreased due to the repayment of our revolving credit facility in the first quarter, as well as the voluntary redemption of our 2025 senior unsecured notes in January 2021.
Loss on early debt extinguishment consists solely of costs associated with the voluntary redemption of our 2025 senior unsecured notes, specifically US$9.5 million of call redemption premiums and US$3.6 million related to the acceleration of unamortized financing costs.
| | | | | |
| |
James Hardie 2021 Annual Report on Form 20-F | 97 |
| |
North America Fiber Cement Segment
Operating results for the North America Fiber Cement segment were as follows:
| | | | | | | | | | | | | | | | | | | | |
| |
| US$ Millions unless otherwise noted | FY21 | FY20 | Change |
| Volume (mmsf) | | 2,713.4 | | | 2,481.6 | | | 9 | % |
| Average net sales price per unit (per msf) | | US$745 | | US$725 | | 3 | % |
| | | | | | |
| Fiber cement net sales | | 2,040.2 | | | 1,816.4 | | | 12 | % |
| Gross profit | | | | | | 12 | % |
| Gross margin (%) | | | | | | (0.1 pts) |
| Operating income | | 585.5 | | | 429.3 | | | 36 | % |
| Operating income margin (%) | | 28.7 | | | 23.6 | | | 5.1 pts |
| Restructuring expenses | | 2.5 | | | 41.2 | | | 94 | % |
| Operating income excluding restructuring expenses | | 588.0 | | | 470.5 | | | 25 | % |
| Operating income margin (%) excluding restructuring expenses | | 28.8 | | | 25.9 | | | 2.9 pts |
| | | | | | |
| | | | | | |
| | | | | | |
| | | | | | |
FY21 vs FY20
Net sales increased 12%, primarily driven by strong exteriors volume growth of 11%. The 3% increase in average net sales price was primarily driven by favorable product mix and strategic pricing increases during the year.
The slight decrease in gross margin is comprised of the following components:
| | | | | |
| Higher production and distribution costs | (1.9 | pts) |
| Higher average net sales price | 1.8 | pts |
| Total percentage point change in gross margin | (0.1 | pts) |
Higher production and distribution costs primarily resulted from unfavorable freight costs and start-up costs related to the greenfield expansion in Prattville, Alabama, partially offset by lower pulp costs and lean manufacturing savings.
SG&A expenses decreased, driven by cost containment actions, including lower headcount and reduced travel and marketing spend. As a percentage of sales, SG&A expenses decreased 3.0 percentage points.
Restructuring expenses of US$2.5 million consist solely of severance costs recorded in the first quarter related to a reduction in headcount across the region in order to strategically realign our resources. In the prior year, restructuring expenses of US$41.2 million includes an impairment of US$12.0 million associated with our Summerville plant, as well as US$29.2 million related to a variety of non-core assets.
Operating income margin increased 5.1 percentage points to 28.7%, driven by lower SG&A expenses as a percentage of sales and lower restructuring expenses.
| | | | | |
| |
James Hardie 2021 Annual Report on Form 20-F | 98 |
| |
Asia Pacific Fiber Cement Segment
The Asia Pacific Fiber Cement segment is comprised of the following regions: (i) Australia; (ii) New Zealand; and (iii) the Philippines.
Operating results for the Asia Pacific Fiber Cement segment in US dollars were as follows:
| | | | | | | | | | | | | | | | | | | | |
| |
| US$ Millions unless otherwise noted | FY21 | FY20 | Change |
| Volume (mmsf) | | 542.0 | | | 532.6 | | | 2 | % |
| Average net sales price per unit (per msf) | | US$762 | | US$700 | | 9 | % |
| | | | | | |
| Fiber cement net sales | | 458.2 | | | 418.4 | | | 10 | % |
| Gross profit | | | | | | 18 | % |
| Gross margin (%) | | | | | | 2.7 pts |
| Operating income | | 124.8 | | | 58.5 | | | |
| Operating income margin (%) | | 27.2 | | | 14.0 | | | 13.2 pts |
| Restructuring expenses | | 3.4 | | | 36.3 | | | 91 | % |
| Operating income excluding restructuring expenses | | 128.2 | | | 94.8 | | | 35 | % |
| Operating income margin (%) excluding restructuring expenses | | 28.0 | | | 22.7 | | | 5.3 pts |
Operating results for the Asia Pacific Fiber Cement segment in Australian dollars were as follows:
| | | | | | | | | | | | | | | | | | | | |
| |
| A$ Millions unless otherwise noted | FY21 | FY20 | Change |
| Volume (mmsf) | | 542.0 | | | 532.6 | | | 2 | % |
| Average net sales price per unit (per msf) | | A$1,056 | | A$1,027 | | 3 | % |
| | | | | | |
| Fiber cement net sales | | 635.2 | | | 614.1 | | | 3 | % |
| Gross profit | | | | | | 11 | % |
| Gross margin (%) | | | | | | 2.7 | pts |
| Operating income | | 172.4 | | | 80.8 | | | |
| Operating income margin (%) | | 27.2 | | | 14.0 | | | 13.2 | pts |
| Restructuring expenses | | 4.9 | | | 58.3 | | | 92 | % |
| Operating income excluding restructuring expenses | | 177.3 | | | 139.1 | | | 27 | % |
| Operating income margin (%) excluding restructuring expenses | | 28.0 | | | 22.7 | | | 5.3 | pts |
FY21 vs FY20 (A$)
Net sales increased 3%, as strong results in the last nine months of the fiscal year more than offset the lower volumes in the first quarter due to the COVID-19 government enforced lockdowns in the Philippines and New Zealand. The 3% increase in the average net sales price was driven by product and geographic mix, as well as our strategic price increases in Australia and New Zealand during the first quarter.
| | | | | |
| |
James Hardie 2021 Annual Report on Form 20-F | 99 |
| |
The increase in gross margin can be attributed to the following components:
| | | | | |
| Higher average net sales price | 1.6 | pts |
| Lower production and distribution costs | 1.1 | pts |
| Total percentage point change in gross margin | 2.7 | pts |
Lower production and distribution costs were driven by favorable plant performance, partially offset by the unfavorable absorption of manufacturing costs on lower production volumes due to the idled facilities in the Philippines and New Zealand in the first quarter.
SG&A expenses decreased, primarily driven by cost containment actions, including lower headcount and reduced travel and marketing spend. As a percentage of sales, SG&A expenses decreased 2.5 percentage points.
Restructuring expenses of A$4.9 million consist solely of severance costs, primarily associated with our strategic decision to consolidate Australia and New Zealand regional production to our two Australia based plants, and a reduction in headcount across the region to realign our resources. In the prior year, restructuring expenses of A$58.3 million primarily relates to our decision to close our Penrose, New Zealand plant, as well as our James Hardie Systems business.
Operating income margin of 27.2% represents an increase of 13.2 percentage points, primarily driven by lower restructuring expenses, as well as a higher gross margin and lower SG&A expenses as a percentage of sales.
Europe Building Products Segment
The Europe Building Products segment is comprised of: (i) Europe Fiber Cement and (ii) Europe Fiber Gypsum.
Operating results for the Europe Building Products segment in US dollars were as follows:
| | | | | | | | | | | | | | | | | | | | |
| |
| US$ Millions unless otherwise noted | FY21 | FY20 | Change |
| Volume (mmsf) | | 876.0 | | | 827.5 | | | 6 | % |
| Average net sales price per unit (per msf) | | US$365 | | US$345 | | 6 | % |
| | | | | | |
| Fiber cement net sales | | 55.3 | | | 48.0 | | | 15 | % |
Fiber gypsum net sales1 | | 355.0 | | | 323.4 | | | 10 | % |
| Net sales | | 410.3 | | | 371.4 | | | 10 | % |
| Gross profit | | | | | | 9 | % |
Gross margin (%) | | | | | | (0.3 | pts) |
| Operating income | | 37.6 | | | 11.2 | | | |
| Operating income margin (%) | | 9.2 | | | 3.0 | | | 6.2 | pts |
| Restructuring expenses | | 5.1 | | | 5.5 | | | 7 | % |
| | | | | | |
| Operating income excluding restructuring expenses | | 42.7 | | | 16.7 | | | |
| Operating income margin (%) excluding restructuring expenses | | 10.4 | | | 4.5 | | | 5.9 pts |
____________
1Also includes cement bonded board net sales.
| | | | | |
| |
James Hardie 2021 Annual Report on Form 20-F | 100 |
| |
Operating results for the Europe Building Products segment in Euros were as follows:
| | | | | | | | | | | | | | | | | | | | |
| |
| € Millions unless otherwise noted | FY21 | FY20 | Change |
| Volume (mmsf) | | 876.0 | | | 827.5 | | | 6 | % |
| Average net sales price per unit (per msf) | | €312 | | €311 | | — | % |
| | | | | | |
| Fiber cement net sales | | 47.2 | | | 43.3 | | | 9 | % |
Fiber gypsum net sales1 | | 303.4 | | | 290.9 | | | 4 | % |
| Net sales | | 350.6 | | | 334.2 | | | 5 | % |
| Gross profit | | | | | | 3 | % |
| Gross margin (%) | | | | | | (0.3 | pts) |
| Operating income | | 31.4 | | | 10.0 | | | |
| Operating income margin (%) | | 9.2 | | | 3.0 | | | 6.2 | pts |
| Restructuring expenses | | 4.5 | | | 4.9 | | | 8 | % |
| | | | | | |
| Operating income excluding restructuring expenses | | 35.9 | | | 14.9 | | | |
| Operating income margin (%) excluding restructuring expenses | | 10.4 | | | 4.5 | | | 5.9 | pts |
____________
1Also includes cement bonded board net sales.
FY21 vs FY20 (€)
Net sales increased 5%, driven by increases in fiber cement and fiber gypsum net sales of 9% and 4%, respectively. These increases were primarily driven by our continued execution of our shift to a customer integrated approach in the last nine months, partially offset by the 12% decrease in the first quarter resulting from the COVID-19 government enforced lockdowns.
The decrease in gross margin is attributed to the following components:
| | | | | |
| Higher production and distribution costs | (0.6 | pts) |
| Higher average net sales price | 0.3 | pts |
| Total percentage point change in gross margin | (0.3 | pts) |
Higher production and distribution costs resulted primarily from the unfavorable absorption of manufacturing costs on lower production volumes in the first quarter, including the impact of the COVID-19 related closures of our manufacturing plants in Orejo, Spain and Siglingen, Germany, partially offset by lean manufacturing savings.
SG&A expenses decreased due to lower headcount and reduced travel and marketing spend. As a percentage of sales, SG&A expenses decreased 6.3 percentage points.
Restructuring expenses of €4.5 million consist solely of severance costs, primarily associated with the reduction of headcount across the region to strategically realign our resources. In the prior year, restructuring expenses primarily relate to the impairment of non-core assets.
Operating income margin of 9.2% increased 6.2 percentage points, driven by lower SG&A expenses as a percentage of sales.
| | | | | |
| |
James Hardie 2021 Annual Report on Form 20-F | 101 |
| |
General Corporate
Results for General Corporate were as follows:
| | | | | | | | | | | | | | | | | | | | |
| |
| US$ Millions | FY21 | FY20 | Change % |
| General Corporate SG&A expenses | | $ | (101.1) | | | $ | (68.2) | | | (48) | |
| Asbestos: | | | | | | |
| Asbestos adjustments | | (143.9) | | | (58.2) | | | |
| AICF SG&A expenses | | (1.2) | | | (1.7) | | | 29 | |
| Restructuring expenses | | — | | | (1.4) | | | |
| General Corporate operating loss | | $ | (246.2) | | | $ | (129.5) | | | (90) | |
| | | | | | |
General Corporate SG&A expenses increased US$32.9 million, driven by higher stock compensation expenses due to the increase in our stock price, as well as higher legal fees.
Asbestos adjustments primarily reflect the non-cash foreign exchange re-measurement impact on asbestos related balance sheet items, driven by the change in the AUD/USD spot exchange rate from the beginning balance sheet date to the ending balance sheet date, as well as the annual actuarial adjustment recorded in line with KPMGA's actuarial report.
The AUD/USD spot exchange rates are shown in the table below:
| | | | | | | | | | | | | | | | | | | | | | | |
| | FY21 | FY20 |
| | | | | | 31 March 2020 | | 0.6177 | | 31 March 2019 | | 0.7096 | |
| | | | | | 31 March 2021 | | 0.7601 | | 31 March 2020 | | 0.6177 | |
| | | | | | Change ($) | | 0.1424 | | Change ($) | | (0.0919) | |
| | | | | | Change (%) | | 23 | | Change (%) | | (13) | |
| | | | | | | | | | | |
Asbestos adjustments recorded by the Company were made up of the following components:
| | | | | | | | | | | | | | |
| US$ Millions | FY21 | FY20 |
Increase in actuarial estimate
| | $ | (32.5) | | | $ | (128.0) | |
| Effect of foreign exchange rate movements | | (123.0) | | | 69.0 | |
| Gain on foreign currency forward contracts | | 11.7 | | | 0.8 | |
| Other | | (0.1) | | | — | |
| Asbestos adjustments | | $ | (143.9) | | | $ | (58.2) | |
The increase in the actuarial adjustment for fiscal year 2021 is due to the annual inflation adjustment, partially offset by favorable claims reporting and lower claims sizes.
During fiscal year 2021, mesothelioma claims reporting activity was favorable compared to actuarial expectations and the prior year, primarily driven by lower direct claims which typically cost significantly more than cross claims. In addition, as claimants' ages continue to increase, this has had a favorable effect on average claim size. As a result of these lower mesothelioma claims and lower average claims size, Asbestos gross cash outflows of A$153.7 million for fiscal year 2021 were 10% below the actuarial expectation. Changes to the assumptions may be necessary in future periods should mesothelioma claims reporting escalate or decline.
Potential variation in the estimated peak period of claims has an impact much greater than the other assumptions used to derive the discounted central estimate. In performing the sensitivity assessment of
| | | | | |
| |
James Hardie 2021 Annual Report on Form 20-F | 102 |
| |
the estimated incidence pattern reporting for mesothelioma, if the pattern of incidence was shifted by two years, the central estimate could increase by approximately 21% on a discounted basis.
Readers are referred to Note 12 to our consolidated financial statements for further information on asbestos.
The following is an analysis of claims data for the fiscal years ended 31 March:
| | | | | | | | | | | | | | | | | | | | |
| |
| FY21 | FY20 | Change % |
| Claims received | | 545 | | | 657 | | | 17 | |
| Direct claims | | 392 | | | 449 | | | 13 | |
| Cross claims | | 153 | | | 208 | | | 26 | |
| Actuarial estimate for the period | | 624 | | | 564 | | | (11) | |
| Difference in claims received to actuarial estimate | | 79 | | | (93) | | | |
| | | | | | |
| Average claim settlement (A$) | | 248,000 | | | 277,000 | | | 10 | |
| Actuarial estimate for the period (A$) | | 296,000 | | | 306,000 | | | 3 | |
| Difference in claims paid to actuarial estimate | | 48,000 | | | 29,000 | | | |
| | | | | | |
For the fiscal year ended 31 March 2021, we noted the following related to asbestos-related claims:
•Net cash outflow was 13% below actuarial expectations;
•Gross cash outflow was 10% below actuarial expectations;
•Total claims received were 13% below actuarial expectations and 17% below fiscal year 2020;
•Mesothelioma claims reported were 9% below actuarial expectations and 13% below fiscal year 2020;
•Number of claims settled were 8% below actuarial expectations and 3% below fiscal year 2020;
•Average claim settlement was 16% below actuarial expectations and 10% below fiscal year 2020; and
•Average claim settlement sizes were lower than actuarial expectations for all mesothelioma age groups.
Interest, net
| | | | | | | | | | | | | | | | | |
| US$ Millions | FY21 | FY20 | Change % |
| Gross interest expense | | $ | (58.0) | | | $ | (66.9) | | 13 |
| Capitalized interest | | 9.5 | | | 9.5 | | — | |
| Interest income | | 0.2 | | | 1.6 | | (88) |
| Net AICF interest income | | 0.5 | | | 1.4 | | (64) |
| Interest, net | | $ | (47.8) | | | $ | (54.4) | | 12 |
Gross interest expense decreased US$8.9 million, primarily due to the repayment of our revolving credit facility in the first quarter and the redemption of our 2025 senior unsecured notes in the fourth quarter.
| | | | | |
| |
James Hardie 2021 Annual Report on Form 20-F | 103 |
| |
Income Tax Expense
| | | | | | | | | | | | | | | | | | |
| | | | | | | FY21 | | FY20 |
| Income tax expense (US$ Millions) | | | | | | (149.2) | | | (46.5) | |
| Effective tax rate (%) | | | | | | 36.2 | % | | 16.1 | |
The effective tax rate increased 20.1 percentage points, primarily due to Asbestos and tax adjustments and a change in geographic mix.
Year ended 31 March 2020 compared to year ended 31 March 2019
Readers are referred to the "Management's Discussion and Analysis" in Section 2 our fiscal year 2020 Form 20-F filed with the SEC on 19 May 2020 for comparative analysis relating to fiscal years 2020 and 2019.
Liquidity and Capital Allocation
Overview
Our treasury policy regarding liquidity management, foreign exchange risk management, interest rate risk management and cash management is administered by our treasury department which is centralized in Ireland. The policy is reviewed annually and is designed to ensure that we have sufficient liquidity to support our business activities and meet future business requirements in the countries in which we operate. We aim to mitigate certain risks associated with fluctuations in interest rates and foreign currency. Our strategies to reduce such risks may result in us entering into non-speculative interest rate swaps and foreign currency forward contracts. For a more detailed discussion on our financial instruments, see Note 13 to our consolidated financial statements. For a more detailed discussion on foreign currency exchange rate and interest rate risks, see ‘Quantitative and Qualitative Disclosures About Market Risk’ in Section 3 of this document.
Our cash position increased by US$64.1 million, from US$144.4 million at 31 March 2020 to US$208.5 million at 31 March 2021.
Our gross debt balance reduced from US$1,370.7 million at 31 March 2020, to US$868.3 million as of 31 March 2021, primarily a result of our voluntary redemption of our US$400.0 million 2025 senior unsecured notes. In addition, at 31 March 2021, we had no amounts drawn from our US$500.0 million unsecured revolving facility, compared to US$130.0 million at 31 March 2020. Subsequent to 31 March 2021, we drew US$110.0 million under our revolving credit facility to partially fund the payment of the fiscal year 2021 special dividend.
Sources of Liquidity
During fiscal year 2021, we met our liquidity and capital requirements through a mix of external debt facilities, cash reserves and cash flows from operations. These internal and external sources of liquidity were primarily used during fiscal year 2021 to reduce our debt, fund expansion, renovation and maintenance of production capacity, fund our annual contribution to AICF in accordance with the terms of the AFFA, and fund our working capital requirements, consisting primarily of inventory, accounts receivable and accounts payable. While our working capital requirements fluctuate seasonally during months of the year when overall construction and renovation volumes increase, such fluctuations, generally, have not had a significant impact on our short-term or long-term liquidity.
| | | | | |
| |
James Hardie 2021 Annual Report on Form 20-F | 104 |
| |
There are certain restrictions that are either imposed upon us as an Irish plc operating under Irish law, or imposed upon us as a party to the AFFA, which may restrict the ability of subsidiaries to transfer funds to us in the form of cash dividends, loans or advances. For more detailed discussion on these restrictions, see “Section 3 – Risk Factors.” Even with these restrictions, based on our existing cash balances, together with anticipated operating cash flows and unutilized credit facilities, we anticipate we will have sufficient funds to meet our planned working capital and other expected cash requirements for the next twelve months.
Cash Flow
| | | | | | | | | | | | | | | | | | | | | | | |
| | FY21 | | FY20 | | Change | Change % |
| Net cash provided by operating activities | | $ | 786.9 | | | $ | 451.2 | | | $ | 335.7 | | 74 |
| Net cash used in investing activities | | (120.4) | | | (203.8) | | | 83.4 | 41 |
| Net cash used in financing activities | | (540.2) | | | (179.0) | | | (361.2) | |
Significant sources and uses of cash during fiscal year 2021 included:
•Cash provided by operating activities:
◦Higher net sales and profitability in each of our regions led to net income, adjusted for non-cash items, of US$692.4 million;
◦Working capital improvements: US$98.7 million related to a reduction in inventory as we continue to execute our strategy to integrate our supply chain with our customers, and US$6.6 million due to improvements in accounts receivable and accounts payable balances;
◦US Coronavirus Aid, Relief, and Economic Security Act ("CARES Act") tax refund of US$64.8 million; and
◦Asbestos claims paid of US$105.3 million.
•Cash used in investing activities:
◦Capital expenditures of US$110.7 million, primarily related to capacity expansion in Prattville, Alabama and Carole Park, Australia, as well as other maintenance projects.
•Cash used in financing activities:
◦Repayment of entire US$130.0 million balance on our revolving credit facility;
◦Redemption of US$400.0 million 2025 senior unsecured notes; and
◦Payment of US$9.5 million call premium to note holders.
| | | | | |
| |
James Hardie 2021 Annual Report on Form 20-F | 105 |
| |
Borrowings
At 31 March 2021 and 2020, our borrowings were US$858.6 million US$1,354.6 million, respectively. See the following table for a summary of our borrowings:
| | | | | | | | | | | |
| (Millions of US dollars) | 31 March
2021 | | 31 March
2020 |
| Senior unsecured notes: | | | |
Principal amount 4.750% notes due 2025 | $ | — | | | $ | 400.0 | |
Principal amount 3.625% notes due 2026 (€400.0 million) | 468.3 | | | 440.7 | |
Principal amount 5.000% notes due 2028 | 400.0 | | | 400.0 | |
| Total | 868.3 | | | 1,240.7 | |
| | | |
| Unsecured revolving credit facility | — | | | 130.0 | |
| | | |
| Unamortized debt issuance costs | (9.7) | | | (16.1) | |
| Total Long-term debt | $ | 858.6 | | | $ | 1,354.6 | |
| | | |
| Weighted average interest rate of Long-term debt | 4.3 | % | | 4.3 | % |
Interest on our 3.625% notes due 2026 is payable semi-annually in arrears on 1 October and 1 April of each year. Interest on our 5.000% notes due 2028 is payable semi-annually in arrears on 15 January and 15 July of each year.
As of 31 March 2021, we had a US$500.0 million unsecured revolving credit facility (the “Revolving Credit Facility”) which can be drawn in US dollars with variable interest rates based on London Interbank Offered Rate (“LIBOR”) plus margin. The Revolving Credit Facility's amended expiration date is December 2022 and the size of the facility may be increased by up to US$250.0 million. At 31 March 2021, the Company had outstanding borrowings of nil, and US$4.7 million of issued but undrawn letters of credit and bank guarantees. These letters of credit and bank guarantees relate to various operational matters including insurance, performance bonds and other items, leaving the Company with US$495.3 million of available borrowing capacity under the Revolving Credit Facility.
Readers are referred to Note 10 of our 31 March 2021 consolidated financial statements for further information on our borrowings.
Capital Expenditures and Lease Obligations
Our total capital expenditures for fiscal years 2021 and 2020 were US$110.7 million and US$193.8 million, respectively. We expect our capital expenditures to be approximately US$250.0 million annually for the next three fiscal years.
Refer to “Section 1 – Property, Plants and Equipment – Capital Expenditures” for further discussion and a listing of our significant capital expenditures in fiscal years 2021 and 2020.
Refer to Note 8 of our 31 March 2021 consolidated financial statements for our future lease payments for non-cancellable leases at 31 March 2021.
| | | | | |
| |
James Hardie 2021 Annual Report on Form 20-F | 106 |
| |
Capital Management
We periodically review our capital structure and capital allocation objectives and expect the following capital management focus in the short term:
•Preserve strong liquidity position and financial flexibility;
•Invest in capacity expansion and market led innovation to support organic growth;
•Maintain leverage ratio of 1-2x; and
•Return capital to shareholders
◦Returned over US$300 million through special dividend in April 2021
◦Reinstating ordinary dividends in fiscal year 2022, beginning with a half-year dividend to be declared in November 2021.
AICF funding
We funded US$153.3 million to AICF during fiscal year 2021, as provided under the AFFA. From the time AICF was established in February 2007 through the date of this Annual Report, we have contributed approximately A$1,571.0 million to the fund.
We anticipate that we will make contributions totaling approximately US$252.6 million to AICF during fiscal year 2022. This amount represents 35% of our free cash flow of US$721.6 million. Our free cash flow, as defined by the AFFA, is our operating cash flow per US GAAP in effect in December 2004. To reconcile our current year operating cash flow of US$786.9 million to 2004 US GAAP, a US$65.3 million adjustment is required.
Readers are referred to Notes 1 and 12 to our consolidated financial statements for further information on asbestos.
Outlook and Trend Information
James Hardie continues to assess the impacts and the uncertainties of the COVID-19 pandemic on the geographic locations in which we operate, and the continuing impact of the pandemic on James Hardie’s business and future financial performance still remains uncertain.
We expect growth in US residential end markets to continue into fiscal year 2022. A number of external factors will contribute to demand for our products, including improvement in United States’ GDP, lower unemployment level, improvement in consumer confidence levels, sustainable household debt levels, historically low interest rates, stability in home prices and new household formation. Our expanded focus for fiscal year 2022 and beyond is to execute on the three strategic initiatives that we introduced in February 2021. This includes commercializing global product innovation, further penetrating into existing and new market opportunities, and extending the James Hardie brand from a premium professional brand into a market-leading consumer brand. We are on or ahead of plan for each of these initiatives.
We are the largest fiber cement producer in North America with ten plants. The scale of our operations and manufacturing capabilities improves our position with distributors who continue to experience increased demand for fiber cement products and seek a partner whom can manufacture and deliver the volume required on a timely basis. The plants are positioned near attractive markets in the United States to help minimize transportation costs for product distribution and raw material sourcing. Input costs including raw materials, labor and freight costs have fluctuated year over year and we are actively engaged in mitigating actions to moderate any future increases.
In Australia, it is anticipated that our addressable underlying market will increase in fiscal year 2022 compared to fiscal year 2021. Net sales from our Australian business are expected to trend above the
| | | | | |
| |
James Hardie 2021 Annual Report on Form 20-F | 107 |
| |
average growth of the domestic repair and remodel and single family detached housing markets in the eastern states of Australia.
We expect our Europe Building Product segment to achieve year on year net sales and operating income margin growth.
| | | | | |
| |
James Hardie Industries plc - Consolidated Financial Statements | 108 |
| |
INDEX
| | | | | |
| |
| Report of Independent Registered Public Accounting Firm | 109 |
| |
Report of Independent Registered Public Accounting Firm
To the Shareholders and the Board of Directors of James Hardie Industries plc
Opinion on the Financial Statements
We have audited the accompanying consolidated balance sheets of James Hardie Industries plc (the Company) as of 31 March 2021 and 2020, the related consolidated statements of operations and comprehensive income, changes in shareholders' equity (deficit) and cash flows for each of the three years in the period ended 31 March 2021, and the related notes (collectively referred to as the “consolidated financial statements”). In our opinion, the consolidated financial statements present fairly, in all material respects, the financial position of the Company at 31 March 2021 and 2020, and the results of its operations and its cash flows for each of the three years in the period ended 31 March 2021, in conformity with U.S. generally accepted accounting principles.
We also have audited, in accordance with the standards of the Public Company Accounting Oversight Board (United States) (PCAOB), the Company's internal control over financial reporting as of 31 March 2021, based on criteria established in Internal Control-Integrated Framework issued by the Committee of Sponsoring Organizations of the Treadway Commission (2013 framework) and our report dated 18 May 2021 expressed an unqualified opinion thereon.
Basis for Opinion
These financial statements are the responsibility of the Company's management. Our responsibility is to express an opinion on the Company’s financial statements based on our audits. We are a public accounting firm registered with the PCAOB and are required to be independent with respect to the Company in accordance with the U.S. federal securities laws and the applicable rules and regulations of the Securities and Exchange Commission and the PCAOB.
We conducted our audits in accordance with the standards of the PCAOB. Those standards require that we plan and perform the audit to obtain reasonable assurance about whether the financial statements are free of material misstatement, whether due to error or fraud. Our audits included performing procedures to assess the risks of material misstatement of the financial statements, whether due to error or fraud, and performing procedures that respond to those risks. Such procedures included examining, on a test basis, evidence regarding the amounts and disclosures in the financial statements. Our audits also included evaluating the accounting principles used and significant estimates made by management, as well as evaluating the overall presentation of the financial statements. We believe that our audits provide a reasonable basis for our opinion.
Critical Audit Matter
The critical audit matter communicated below is a matter arising from the current period audit of the financial statements that was communicated or required to be communicated to the audit committee and that: (1) relates to accounts or disclosures that are material to the financial statements and (2) involved our especially challenging, subjective or complex judgments. The communication of the critical audit matter does not alter in any way our opinion on the consolidated financial statements, taken as a whole, and we are not, by communicating the critical audit matter below, providing a separate opinion on the critical audit matter or on the accounts or disclosures to which it relates.
| | | | | |
| |
| Report of Independent Registered Public Accounting Firm | 110 |
| |
| | | | | | | | |
| | Asbestos Liability Valuation |
| Description of the Matter | | At 31 March 2021, the aggregate asbestos liability was US$1,135.8 million. As disclosed in Note 12 to the consolidated financial statements, the liability relates to an agreement to provide long-term funding to the Asbestos Injuries Compensation Fund (“AICF”), a special purpose fund established to provide compensation of proven Australian-related personal injuries. Auditing management’s estimate of the asbestos liability is challenging because the estimation process is based on actuarial estimates of projected future cash flows which are inherently uncertain. The projected cash flows are complex and use subjective assumptions including the projected number of claims, estimated cost of settlement per claim, inflation rates, legal costs, and timing of receipt of claims and settlements. |
| How We Addressed the Matter in Our Audit | | We obtained an understanding, evaluated the design and tested the operating effectiveness of the Company's internal controls over the identification of claims, review of calculations performed by the Company’s third-party actuary and management’s review of the use of historical claim data and actuarial assumptions mentioned above to project the future liability. To evaluate the estimate of the asbestos liability, our audit procedures included, among others, testing the underlying claims data used in the calculation to internal and external data on a sample basis. We involved our actuarial specialists to assist in evaluating the methodologies and key assumptions mentioned above to independently develop a range for the asbestos liability and compare that range to management’s recorded liability. We also assessed the adequacy of the related disclosures in the Company’s consolidated financial statements. |
| | |
/s/ Ernst & Young LLP
We have served as the Company’s auditor since 2008.
Irvine, California
18 May 2021
| | | | | |
| |
James Hardie Industries plc - Consolidated Balance Sheets | 111 |
| |
| | | | | | | | | | | |
| (Millions of US dollars) | 31 March
2021 | | 31 March
2020 |
| Assets | | | |
| Current assets: | | | |
| Cash and cash equivalents | $ | 208.5 | | | $ | 144.4 | |
| Restricted cash and cash equivalents | 5.0 | | | 5.0 | |
| Restricted cash and cash equivalents - Asbestos | 104.9 | | | 36.4 | |
| Restricted short-term investments - Asbestos | 26.6 | | | 21.6 | |
| Accounts and other receivables, net | 333.2 | | | 363.3 | |
| Inventories | 218.3 | | | 305.1 | |
| Prepaid expenses and other current assets | 38.9 | | | 26.1 | |
| Insurance receivable - Asbestos | 6.6 | | | 5.0 | |
| Workers’ compensation - Asbestos | 1.6 | | | 1.5 | |
| Total current assets | 943.6 | | | 908.4 | |
| Property, plant and equipment, net | 1,372.3 | | | 1,341.7 | |
| Operating lease right-of-use-assets | 46.4 | | | 40.5 | |
| Finance lease right-of-use-assets | 2.7 | | | 1.7 | |
| Goodwill | 209.3 | | | 196.9 | |
| Intangible assets, net | 173.9 | | | 166.7 | |
| Insurance receivable - Asbestos | 42.9 | | | 38.5 | |
| Workers’ compensation - Asbestos | 20.3 | | | 20.7 | |
| Deferred income taxes | 906.8 | | | 989.4 | |
| Deferred income taxes - Asbestos | 367.4 | | | 319.1 | |
| Other assets | 3.4 | | | 4.7 | |
| Total assets | $ | 4,089.0 | | | $ | 4,028.3 | |
| Liabilities and Shareholders’ Equity | | | |
| Current liabilities: | | | |
| Accounts payable and accrued liabilities | $ | 307.0 | | | $ | 274.7 | |
| Accrued payroll and employee benefits | 112.5 | | | 87.1 | |
| Operating lease liabilities | 7.8 | | | 14.3 | |
| Finance lease liabilities | 1.0 | | | 0.5 | |
| Accrued product warranties | 6.0 | | | 7.0 | |
| Income taxes payable | 6.6 | | | 8.9 | |
| Asbestos liability | 122.2 | | | 103.9 | |
| Workers’ compensation - Asbestos | 1.6 | | | 1.5 | |
| Dividends payable | 303.7 | | | — | |
| Other liabilities | 32.7 | | | 12.1 | |
| Total current liabilities | 901.1 | | | 510.0 | |
| Long-term debt | 858.6 | | | 1,354.6 | |
| Deferred income taxes | 86.3 | | | 81.9 | |
| Operating lease liabilities | 53.3 | | | 41.4 | |
| Finance lease liabilities | 1.9 | | | 1.5 | |
| Accrued product warranties | 33.6 | | | 35.4 | |
| Income taxes payable | 4.7 | | | 21.3 | |
| Asbestos liability | 1,013.6 | | | 882.5 | |
| Workers’ compensation - Asbestos | 20.3 | | | 20.7 | |
| Other liabilities | 54.8 | | | 43.7 | |
| Total liabilities | 3,028.2 | | | 2,993.0 | |
| Commitments and contingencies (Note 14) | | | |
| Shareholders’ equity: | | | |
Common stock, Euro 0.59 par value, 2.0 billion shares authorized; 444,288,874 shares issued and outstanding at 31 March 2021 and 443,144,740 shares issued and outstanding at 31 March 2020 | 231.4 | | | 230.6 | |
| Additional paid-in capital | 224.6 | | | 207.3 | |
| Retained earnings | 611.4 | | | 659.5 | |
| Accumulated other comprehensive loss | (6.6) | | | (62.1) | |
| Total shareholders’ equity | 1,060.8 | | | 1,035.3 | |
| Total liabilities and shareholders’ equity | $ | 4,089.0 | | | $ | 4,028.3 | |
The accompanying notes are an integral part of these consolidated financial statements.
| | | | | |
| |
James Hardie Industries plc - Consolidated Statements of Operations and Comprehensive Income | 112 |
| |
| | | | | | | | | | | | | | | | | |
| | Years Ended 31 March |
| (Millions of US dollars, except per share data) | 2021 | | 2020 | | 2019 |
| Net sales | $ | 2,908.7 | | | $ | 2,606.8 | | | $ | 2,506.6 | |
| Cost of goods sold | (1,857.0) | | | (1,673.1) | | | (1,675.6) | |
| Gross profit | 1,051.7 | | | 933.7 | | | 831.0 | |
| Selling, general and administrative expenses | (389.6) | | | (415.8) | | | (403.6) | |
| Research and development expenses | (34.3) | | | (32.8) | | | (37.9) | |
| Restructuring expenses | (11.1) | | | (84.4) | | | (15.9) | |
| Asbestos adjustments | (143.9) | | | (58.2) | | | (22.0) | |
| Operating income | 472.8 | | | 342.5 | | | 351.6 | |
| Interest, net | (47.8) | | | (54.4) | | | (50.1) | |
| Loss on early debt extinguishment | (13.1) | | | — | | | (1.0) | |
| Other income (expense) | 0.1 | | | (0.1) | | | 0.1 | |
| Income before income taxes | 412.0 | | | 288.0 | | | 300.6 | |
| Income tax expense | (149.2) | | | (46.5) | | | (71.8) | |
| Net income | $ | 262.8 | | | $ | 241.5 | | | $ | 228.8 | |
| Income per share: | | | | | |
| Basic | $ | 0.59 | | | $ | 0.55 | | | $ | 0.52 | |
| Diluted | $ | 0.59 | | | $ | 0.54 | | | $ | 0.52 | |
| Weighted average common shares outstanding (Millions): | | | | | |
| Basic | 443.7 | | | 442.6 | | | 441.9 | |
| Diluted | 445.4 | | | 444.1 | | | 443.0 | |
| Comprehensive income, net of tax: | | | | | |
| Net income | $ | 262.8 | | | $ | 241.5 | | | $ | 228.8 | |
| Cash flow hedges | — | | | — | | | (0.1) | |
| Pension adjustments | (0.4) | | | 0.8 | | | — | |
| Currency translation adjustments | 55.9 | | | (32.6) | | | (28.9) | |
| Comprehensive income | $ | 318.3 | | | $ | 209.7 | | | $ | 199.8 | |
The accompanying notes are an integral part of these consolidated financial statements.
| | | | | |
| |
James Hardie Industries plc – Consolidated Statements of Cash Flows | 113 |
| |
| | | | | | | | | | | | | | | | | |
| | Years Ended 31 March |
| (Millions of US dollars) | 2021 | | 2020 | | 2019 |
| Cash Flows From Operating Activities | | | | | |
| Net income | $ | 262.8 | | | $ | 241.5 | | | $ | 228.8 | |
| Adjustments to reconcile net income to net cash provided by operating activities: | | | | | |
| Depreciation and amortization | 135.0 | | | 131.5 | | | 119.4 | |
| Lease expense | 17.0 | | | 18.1 | | | — | |
| Deferred income taxes | 85.8 | | | 64.0 | | | 12.7 | |
| Stock-based compensation | 18.0 | | | 10.3 | | | 12.5 | |
| Asbestos adjustments | 143.9 | | | 58.2 | | | 22.0 | |
| Excess tax benefits from share-based awards | (3.5) | | | (0.4) | | | — | |
| Restructuring expenses | — | | | 77.4 | | | 15.9 | |
| Loss on early debt extinguishment | 13.1 | | | — | | | 1.0 | |
| Other, net | 20.3 | | | 17.2 | | | 16.3 | |
| Changes in operating assets and liabilities: | | | | | |
| Accounts and other receivables | 46.4 | | | (118.6) | | | (18.1) | |
| Inventories | 98.7 | | | 3.2 | | | (28.6) | |
| Lease assets and liabilities, net | (19.1) | | | (15.6) | | | — | |
| Prepaid expenses and other assets | (14.2) | | | (2.6) | | | (1.7) | |
| Insurance receivable - Asbestos | 5.8 | | | 7.6 | | | 4.8 | |
| Accounts payable and accrued liabilities | 25.0 | | | 45.1 | | | 3.5 | |
| Claims and handling costs paid - Asbestos | (106.4) | | | (105.6) | | | (108.8) | |
| Income taxes payable | (14.7) | | | (11.0) | | | 8.8 | |
| Other accrued liabilities | 73.0 | | | 30.9 | | | 15.5 | |
| Net cash provided by operating activities | $ | 786.9 | | | $ | 451.2 | | | $ | 304.0 | |
| Cash Flows From Investing Activities | | | | | |
| Purchases of property, plant and equipment | $ | (110.7) | | | $ | (193.8) | | | $ | (317.5) | |
| Proceeds from sale of property, plant and equipment | 1.6 | | | 8.0 | | | — | |
| Capitalized interest | (9.5) | | | (9.5) | | | (5.4) | |
| Acquisition of business, net of cash acquired | — | | | — | | | (558.7) | |
| Purchase of restricted short-term investments - Asbestos | (25.0) | | | (75.5) | | | (89.1) | |
| Proceeds from restricted short-term investments - Asbestos | 23.2 | | | 67.0 | | | 106.3 | |
| Net cash used in investing activities | $ | (120.4) | | | $ | (203.8) | | | $ | (864.4) | |
| Cash Flows From Financing Activities | | | | | |
| Proceeds from credit facilities | $ | — | | | $ | 330.0 | | | $ | 230.0 | |
| Repayments of credit facilities | (130.0) | | | (350.0) | | | (180.0) | |
| Proceeds from 364-day term loan facility | — | | | — | | | 492.4 | |
| Repayments of 364-day term loan facility | — | | | — | | | (458.8) | |
| Proceeds from senior unsecured notes | — | | | — | | | 458.8 | |
| Debt issuance costs | — | | | — | | | (6.1) | |
| Repayment of senior unsecured notes | (400.0) | | | — | | | — | |
| Call redemption premium paid to note holders | (9.5) | | | — | | | — | |
| Proceeds from issuance of shares | 0.1 | | | — | | | — | |
| Repayment of finance lease obligations and borrowings | (0.8) | | | (0.4) | | | — | |
| Dividends paid | — | | | (158.6) | | | (172.1) | |
| Net cash (used in) provided by financing activities | $ | (540.2) | | | $ | (179.0) | | | $ | 364.2 | |
| Effects of exchange rate changes on cash and cash equivalents, restricted cash and restricted cash - Asbestos | $ | 6.3 | | | $ | (6.2) | | | $ | 6.6 | |
| Net increase (decrease) in cash and cash equivalents, restricted cash and restricted cash - Asbestos | 132.6 | | | 62.2 | | | (189.6) | |
| Cash and cash equivalents, restricted cash and restricted cash - Asbestos at beginning of period | 185.8 | | | 123.6 | | | 313.2 | |
| Cash and cash equivalents, restricted cash and restricted cash - Asbestos at end of period | $ | 318.4 | | | $ | 185.8 | | | $ | 123.6 | |
| Non-Cash Investing and Financing Activities | | | | | |
| Capital expenditures incurred but not yet paid | $ | 18.0 | | | $ | 8.3 | | | $ | 25.9 | |
| Supplemental Disclosure of Cash Flow Activities | | | | | |
| Cash paid during the year for interest | $ | 56.4 | | | $ | 61.5 | | | $ | 57.0 | |
| Cash (refund) payment during the year for income taxes, net | $ | (3.7) | | | $ | 52.5 | | | $ | 26.3 | |
| Cash paid to AICF | $ | 153.3 | | | $ | 108.9 | | | $ | 103.0 | |
The accompanying notes are an integral part of these consolidated financial statements.
| | | | | |
| |
James Hardie Industries plc – Consolidated Statements of Changes in Shareholders’ Equity (Deficit) | 114 |
| |
| | | | | | | | | | | | | | | | | | | | | | | | | | | | | |
| (Millions of US dollars) | Common
Stock | | Additional
Paid-in
Capital | | Retained
Earnings | | Accumulated
Other
Comprehensive Loss | | Total |
| Balances as of 31 March 2018 | $ | 229.5 | | | $ | 185.6 | | | $ | (635.3) | | | $ | (1.3) | | | $ | (221.5) | |
| Net income | — | | | — | | | 228.8 | | | — | | | 228.8 | |
| Other comprehensive loss | — | | | — | | | — | | | (29.0) | | | (29.0) | |
| Stock-based compensation | 0.5 | | | 12.0 | | | — | | | — | | | 12.5 | |
| Adoption of ASU 2016-16 | — | | | — | | | 1,160.3 | | | — | | | 1,160.3 | |
| Dividends declared | — | | | — | | | (176.7) | | | — | | | (176.7) | |
| Balances as of 31 March 2019 | $ | 230.0 | | | $ | 197.6 | | | $ | 577.1 | | | $ | (30.3) | | | $ | 974.4 | |
| Net income | — | | | — | | | 241.5 | | | — | | | 241.5 | |
| Other comprehensive loss | — | | | — | | | — | | | (31.8) | | | (31.8) | |
| Stock-based compensation | 0.6 | | | 9.7 | | | — | | | — | | | 10.3 | |
| Adoption of ASU 2016-02 | — | | | — | | | 0.2 | | | — | | | 0.2 | |
| Dividends declared | — | | | — | | | (159.3) | | | — | | | (159.3) | |
| Balances as of 31 March 2020 | $ | 230.6 | | | $ | 207.3 | | | $ | 659.5 | | | $ | (62.1) | | | $ | 1,035.3 | |
| Net income | — | | | — | | | 262.8 | | | — | | | 262.8 | |
| Other comprehensive gain | — | | | — | | | — | | | 55.5 | | | 55.5 | |
| Stock-based compensation | 0.8 | | | 17.2 | | | — | | | — | | | 18.0 | |
| Issuance of ordinary shares | — | | | 0.1 | | | — | | | — | | | 0.1 | |
| Dividends declared | — | | | — | | | (310.9) | | | — | | | (310.9) | |
| Balances as of 31 March 2021 | $ | 231.4 | | | $ | 224.6 | | | $ | 611.4 | | | $ | (6.6) | | | $ | 1,060.8 | |
The accompanying notes are an integral part of these consolidated financial statements.
| | | | | |
| |
James Hardie Industries plc – Notes to Consolidated Financial Statements | 115 |
| |
1. Organization and Significant Accounting Policies
Nature of Operations
James Hardie Industries plc ("JHI plc") manufactures and sells fiber cement, fiber gypsum and cement-bonded building products for interior and exterior building construction applications, primarily in the United States, Australia, Europe, New Zealand, the Philippines and Canada.
Basis of Presentation
The consolidated financial statements represent the financial position, results of operations and cash flows of JHI plc and its wholly-owned subsidiaries and variable interest entity (“VIE”). Unless the context indicates otherwise, JHI plc and its direct and indirect wholly-owned subsidiaries and VIE (as of the time relevant to the applicable reference) are collectively referred to as “James Hardie”, the “James Hardie Group” or the “Company”. The consolidated financial statements are prepared in accordance with accounting principles generally accepted in the United States of America (“US GAAP”). All intercompany balances and transactions have been eliminated in consolidation.
Certain prior period amounts have been reclassified to conform to the current period presentation.
Summary of Significant Accounting Policies
Variable Interest Entities
A VIE is an entity that is evaluated for consolidation using more than a simple analysis of voting control. The analysis is based on: (i) what party has the power to direct the most significant activities of the VIE that impact its economic performance; and (ii) what party has rights to receive benefits or is obligated to absorb losses that are significant to the VIE. The analysis of the party that consolidates a VIE is a continual assessment.
In February 2007, the Company’s shareholders approved the Amended and Restated Final Funding Agreement (the “AFFA”), an agreement pursuant to which the Company provides long-term funding to Asbestos Injuries Compensation Fund (“AICF”), a special purpose fund that provides compensation for the Australian-related personal injuries for which certain former subsidiary companies of James Hardie in Australia (being Amaca Pty Ltd (“Amaca”), Amaba Pty Ltd (“Amaba”) and ABN 60 Pty Limited (“ABN 60”) (collectively, the “Former James Hardie Companies”)) are found liable. JHI plc owns 100% of James Hardie 117 Pty Ltd (the “Performing Subsidiary”), which, under the terms of the AFFA, has an obligation to make payments to AICF on an annual basis subject to the provisions of the AFFA. JHI plc guarantees the Performing Subsidiary’s obligation. Additionally, the Company appoints three AICF directors and the New South Wales (“NSW”) Government appoints two AICF directors.
Although the Company has no ownership interest in AICF, for financial reporting purposes, the Company consolidates AICF, which is a VIE as defined under US GAAP, due to its pecuniary and contractual interests in AICF as a result of the funding arrangements outlined in the AFFA. The Company’s consolidation of AICF results in AICF’s assets and liabilities being recorded on its consolidated balance sheets and AICF’s income and expense transactions being recorded in the consolidated statements of operations and comprehensive income. These items are Australian dollar-denominated and are subject to remeasurement into US dollars at each reporting date.
For the fiscal years ended 31 March 2021, 2020 and 2019, the Company did not provide financial or other support to AICF that it was not previously contractually required to provide.
| | | | | |
| |
James Hardie Industries plc – Notes to Consolidated Financial Statements (Continued) | 116 |
| |
Use of Estimates
The preparation of financial statements in conformity with US GAAP requires management to make estimates and assumptions. These estimates and assumptions affect the reported amounts of assets and liabilities and the disclosure of contingent assets and liabilities at the date of the financial statements, and the reported amounts of revenues and expenses during the reporting period. Actual results could differ from these estimates.
Foreign Currency Translation/Remeasurement
All assets and liabilities are translated or remeasured into US dollars at current exchange rates while revenues and expenses are translated or remeasured at average exchange rates in effect for the period. The effects of foreign currency translation adjustments are included directly in other comprehensive income in shareholders’ equity (deficit). Gains and losses arising from foreign currency transactions are recognized in income.
The Company has recorded on its balance sheet certain foreign assets and liabilities, including asbestos-related assets and liabilities under the terms of the AFFA, that are denominated in foreign currencies and subject to translation (foreign entities) or remeasurement (AICF entity and Euro denominated debt) into US dollars at each reporting date. Unless otherwise noted, the Company converts foreign currency denominated assets and liabilities into US dollars at the spot rate at the end of the reporting period; while revenues and expenses are converted using an average exchange rate for the period. The Company records gains and losses on its Euro denominated debt which are economically offset by foreign exchange gains and losses on loans between subsidiaries, resulting in a net immaterial translation gain or loss which is recorded in the Selling, general and administrative expenses in the consolidated statements of operations and comprehensive income.
Restricted Cash and Cash Equivalents
Restricted cash and cash equivalents, other than those amounts directly related to the AICF, generally relate to amounts subject to letters of credit with insurance companies, which restrict the cash from use for general corporate purposes.
Accounts Receivable
The Company evaluates the collectability of accounts receivable on an ongoing basis based on historical bad debts, customer credit-worthiness, current economic trends and changes in the Company's customer payment activity. An allowance for doubtful accounts is provided for known and estimated bad debts. Although credit losses have historically been within expectations, the Company cannot guarantee that it will continue to experience the same credit loss rates that it has had in the past.
Inventories
Inventories are valued at the lower of cost or net realizable value. Cost is generally determined under the first-in, first-out method, except that the cost of raw materials and supplies is determined using actual or average costs. Cost includes the costs of materials, labor and applied factory overhead. On a regular basis, the Company evaluates its inventory balances for excess quantities and obsolescence by analyzing demand, inventory on hand, sales levels and other information. Based on these evaluations, inventory costs are adjusted to net realizable value, if necessary.
| | | | | |
| |
James Hardie Industries plc – Notes to Consolidated Financial Statements (Continued) | 117 |
| |
Property, Plant and Equipment
Property, plant and equipment are stated at cost. Property, plant and equipment of businesses acquired are recorded at their estimated fair value at the date of acquisition. Depreciation of property, plant and equipment is computed using the straight-line method over the following estimated useful lives:
| | | | | |
| | Years |
| Buildings | 5 to 50 |
| Buildings Improvements | 1 to 40 |
| Leasehold Improvements | 1 to 40 |
| Machinery and Equipment | 1 to 30 |
Leases
At lease commencement, which is generally when the Company takes possession of the asset, the Company records a lease liability and a corresponding right-of-use ("ROU") asset. Lease liabilities represent the present value of minimum lease payments over the expected lease term, which includes options to extend the lease when it is reasonably certain those options will be exercised. Determining the lease term and amount of lease payments to include in the calculation of the ROU asset and lease liability for leases containing options requires the use of judgment to determine whether the exercise of an option is reasonably certain, and if the option period and payments should be included in the calculation of the associated ROU asset and liability. In making this determination, the Company considers all relevant economic factors that would compel the Company to exercise an option. The Company’s leases generally do not provide a readily determinable implicit borrowing rate. As such, the discount rate used to calculate present value is the lessee’s incremental borrowing rate, which is primarily based upon the periodic risk-adjusted interest margin and the term of the lease.
Minimum lease payments include base rent as well as fixed escalation of rental payments. In determining minimum lease payments, the Company separates non-lease components such as common area maintenance or other miscellaneous expenses that are updated based on landlord estimates for real estate leases. Additionally, many of the Company’s transportation and equipment leases require additional payments based on the underlying usage of the assets such as mileage and maintenance costs. Due to the variable nature of these costs, the cash flows associated with these costs are expensed as incurred and not included in the lease payments used to determine the ROU asset and associated lease liability.
ROU assets represent the right to control the use of the leased asset during the lease term and are initially recognized as an amount equal to the lease liability. In addition, prepaid rent, initial direct costs, and adjustments for lease incentives are components of the ROU asset. Over the lease term, the lease expense is amortized on a straight-line basis beginning on the lease commencement date. ROU assets are assessed for impairment as part of the impairment of long-lived assets, which is performed whenever events or changes in circumstances indicate that the carrying amount of an asset or asset group may not be recoverable.
A ROU asset and lease liability are not recognized for leases with an initial term of 12 months or less, and the lease expense is recognized on a straight-line basis over the lease term.
Depreciation and Amortization
The Company records depreciation and amortization under both Cost of goods sold and Selling, general and administrative expenses, depending on the asset’s business use. All depreciation and amortization related to plant building, machinery and equipment is recorded in Cost of goods sold.
| | | | | |
| |
James Hardie Industries plc – Notes to Consolidated Financial Statements (Continued) | 118 |
| |
Goodwill and Other Intangible Assets
Goodwill is the excess of purchase price over the fair value of tangible and identifiable intangible net assets acquired in various business combinations. Goodwill is not amortized but is tested at the reporting unit level for impairment annually, or more often if indicators of impairment exist. Factors that could cause an impairment in the future could include, but are not limited to, adverse macroeconomic conditions, deterioration in industry or market conditions, decline in revenue and cash flows or increases in costs and capital expenditures compared to projected results. A goodwill impairment charge is recorded for the amount by which the carrying value of the reporting unit exceeds the fair value of the reporting unit.
Intangible assets from acquired businesses are recognized at their estimated fair values at the date of acquisition and consist of trademarks, customer relationships and other intangible assets. Finite-lived intangibles are amortized to expense over the applicable useful lives, ranging from 2 to 13 years, based on the nature of the asset and the underlying pattern of economic benefit as reflected by future net cash inflows. The Company performs an impairment test of intangibles annually, or whenever events or changes in circumstances indicate their carrying value may be impaired.
Impairment of Long-Lived Assets
Long-lived assets, such as property, plant and equipment, are evaluated each quarter for events or changes in circumstances that indicate that an asset might be impaired because the carrying amount of the asset may not be recoverable. These include, without limitation, a significant adverse change in the extent or manner in which a long-lived asset or asset group is being used, a current period operating or cash flow loss combined with a history of operating or cash flow losses, a projection or forecast that demonstrates continuing losses associated with the use of a long-lived asset or asset group and/or a current expectation that it is more likely than not that a long lived asset or asset group will be sold or otherwise disposed of significantly before the end of its previously estimated useful life.
When such indicators of potential impairment are identified, recoverability is tested by grouping long-lived assets that are used together and represent the lowest level for which cash flows are identifiable and distinct from the cash flows of other long-lived assets, which is typically at the production line or plant facility level, depending on the type of long-lived asset subject to an impairment review.
Recoverability is measured by a comparison of the carrying amount of the asset group to the estimated undiscounted future cash flows expected to be generated by the asset group. If the carrying amount exceeds the estimated undiscounted future cash flows, an impairment charge is recognized at the amount by which the carrying amount exceeds the estimated fair value of the asset group.
The methodology used to estimate the fair value of the asset group is based on a discounted cash flow analysis or a relative, market-based approach based on purchase offers or appraisals received from third parties, that considers the asset group’s highest and best use that would maximize the value of the asset group. In addition, the estimated fair value of an asset group also considers, to the extent practicable, a market participant’s expectations and assumptions in estimating the fair value of the asset group. If the estimated fair value of the asset group is less than the carrying value, an impairment loss is recognized at an amount equal to the excess of the carrying value over the estimated fair value of the asset group.
Accrued Product Warranties
An accrual for estimated future warranty costs is recorded based on an analysis by the Company, which includes the historical relationship of warranty costs to installed product at an estimated remediation cost per standard foot. Based on this analysis and other factors, the adequacy of the Company’s warranty provision is adjusted as necessary.
| | | | | |
| |
James Hardie Industries plc – Notes to Consolidated Financial Statements (Continued) | 119 |
| |
Debt
The Company’s debt consists of an unsecured revolving credit facility and senior unsecured notes. Each of the Company's debt instruments is recorded at cost, net of any original issue discount or premium, where applicable. The related original issue discount, premium and debt issuance costs are amortized over the term of each respective borrowing using the effective interest method. Debt is presented as current if the liability is due to be settled within 12 months after the balance sheet date, unless the Company has the ability and intention to refinance on a long-term basis in accordance with US GAAP. See Fair Value Measurements below and Note 13 for the Company’s fair value considerations.
In addition, the Company consolidates AICF which has a loan facility, which is included in Asbestos-related Accounting Policies below.
Revenue Recognition
The Company recognizes revenues when the requisite performance obligation has been met, that is, when the Company transfers control of its products to customers, which depending on the terms of the underlying contract, is generally upon delivery. The Company records estimated reductions in sales for customer rebates and discounts including volume, promotional, cash and other discounts. Rebates and discounts are recorded based on management’s best estimate when products are sold. The estimates are based on historical experience for similar programs and products. Management reviews these rebates and discounts on an ongoing basis and the related accruals are adjusted, if necessary, as additional information becomes available.
A portion of the Company’s revenue is made through distributors under a vendor managed inventory agreement whereby revenue is recognized upon the transfer of title and risk of loss to the distributors.
Income Taxes
The Company accounts for income taxes under the asset and liability method. Under this method, deferred income taxes are recognized by applying enacted statutory rates applicable to future years to differences between the tax bases and financial reporting amounts of existing assets and liabilities. The effect on deferred taxes of a change in tax rates is recognized in income in the period that includes the enactment date. The realization of the US deferred tax assets is affected primarily by the continued profitability of the US business. A valuation allowance is provided when it is more likely than not that all or some portion of deferred tax assets will not be realized.
Income taxes payable represents taxes currently payable which are computed at statutory income tax rates applicable to taxable income derived in each jurisdiction in which the Company conducts business. Interest and penalties related to uncertain tax positions are recognized in Income tax expense on the consolidated statements of operations and comprehensive income.
The Company accrues for tax contingencies based upon its best estimate of the taxes ultimately expected to be paid, which it updates over time as more information becomes available. Such amounts are included in taxes payable or other non-current liabilities, as appropriate. If the Company ultimately determines that payment of these amounts is unnecessary, the Company reverses the liability and recognizes a tax benefit during the period in which the Company determines that the liability is no longer necessary. The Company records additional tax expense in the period in which it determines that the recorded tax liability is less than the ultimate assessment it expects.
| | | | | |
| |
James Hardie Industries plc – Notes to Consolidated Financial Statements (Continued) | 120 |
| |
Taxing authorities from various jurisdictions in which the Company operates are in the process of reviewing and auditing the Company’s respective jurisdictional tax returns for various ranges of years. The Company accrues tax liabilities in connection with ongoing audits and reviews based on knowledge of all relevant facts and circumstances, taking into account existing tax laws, its experience with previous audits and settlements, the status of current tax examinations and how the tax authorities view certain issues.
Financial Instruments
The Company calculates the fair value of financial instruments and includes this additional information in the notes to the consolidated financial statements. The estimated fair value amounts have been determined by the Company using available market information and appropriate valuation methodologies. However, considerable judgment is required in interpreting market data to develop the estimates of fair value. Accordingly, the estimates presented herein are not necessarily indicative of the amounts that the Company could realize in a current market exchange. The use of different market assumptions and/or estimation methodologies may have a material effect on the estimated fair value amounts.
Periodically, interest rate swaps, commodity swaps and forward exchange contracts are used to manage market risks and reduce exposure resulting from fluctuations in interest rates, commodity prices and foreign currency exchange rates. Changes in the fair value of financial instruments that are not designated as hedges are recorded in earnings within Asbestos adjustments, Other income (expense) and Selling, general and administrative expenses at each measurement date. The Company does not use derivatives for trading purposes.
Fair Value Measurements
Assets and liabilities of the Company that are carried or disclosed at fair value are classified in one of the following three categories:
| | | | | |
| Level 1 | Quoted market prices in active markets for identical assets and liabilities that the Company has the ability to access at the measurement date; |
| | | | | |
| Level 2 | Observable market-based inputs or unobservable inputs that are corroborated by market data for the asset or liability at the measurement date; |
| | | | | |
| Level 3 | Unobservable inputs that are not corroborated by market data used when there is minimal market activity for the asset or liability at the measurement date. |
Fair value measurements of assets and liabilities are assigned a level within the fair value hierarchy based on the lowest level of any input that is significant to the fair value measurement in its entirety.
The carrying amounts of Cash and Cash Equivalents, Restricted cash and cash equivalents, Trade receivables, Trade payables and the Revolving Credit Facility approximates their respective fair values due to the short-term nature of these instruments.
Stock-based Compensation
Stock-based compensation expense represents the estimated fair value of equity-based and liability-classified awards granted to employees and is recognized as an expense over the vesting period. Forfeitures of stock-based awards are accounted for as they occur. Stock-based compensation expense is included in the line item Selling, general and administrative expenses on the consolidated statements of operations and comprehensive income.
| | | | | |
| |
James Hardie Industries plc – Notes to Consolidated Financial Statements (Continued) | 121 |
| |
Equity awards with vesting based solely on a service condition are typically subject to graded vesting, in that the awards outstanding generally vest as follows: 25% at the first anniversary date of the grant; 25% at the second anniversary date of the grant; and 50% at the third anniversary date of the grant. For equity awards subject to graded vesting, the Company has elected to use the accelerated recognition method. Accordingly, each vesting tranche is valued separately, and the recognition of stock-based compensation expense is more heavily weighted earlier in the vesting period. Stock-based compensation expense for equity awards that are subject to performance or market vesting conditions are based upon an estimate of the number of awards that are expected to vest and typically recognized ratably over the vesting period. The Company issues new shares to award recipients when the vesting condition for restricted stock units (“RSUs”) has been satisfied.
For RSUs subject to a service vesting condition, the fair value is equal to the market value of the Company’s common stock on the date of grant, adjusted for the fair value of estimated dividends as the restricted stock holder is not entitled to dividends over the vesting period.
For RSUs subject to a performance vesting condition, the vesting of these units is subject to a return on capital employed (“ROCE”) performance hurdle being met and is subject to negative discretion by the Board. The Board’s discretion will reflect the Board’s judgment of the quality of the returns balanced against management’s delivery of market share growth and a scorecard of key qualitative and quantitative performance objectives.
For RSUs subject to a market vesting condition, the vesting of these units is based on James Hardie’s performance against its Peer Group for the 20 trading days preceding the test date. The fair value of each of these units is estimated using a binomial lattice model that incorporates a Monte Carlo simulation (the “Monte Carlo” method).
For cash settled units ("CSUs"), compensation expense is recognized based upon an estimate of the number of awards that are expected to vest and the fair market value of JHI plc’s common stock on the date of the grant. The expense is recognized ratably over the vesting period and the liability is adjusted for subsequent changes in JHI plc’s common stock price at each balance sheet date adjusted for the fair value of estimated dividends as the restricted stock unit holder is not entitled to dividends over the vesting period.
Loss Contingencies
The Company recognizes a liability for asserted and unasserted claims in the period in which a loss becomes probable and estimable. The amount of a reasonably probable loss is dependent on a number of factors including, without limitation, the specific facts and circumstances unique to each claim, the existence of any co-defendants involved in defending the claim, the solvency of such co-defendants (including the ability of such co-defendants to remain solvent until the related claim is ultimately resolved), and the availability of claimant compensation under a government compensation scheme.
To the extent that it is probable and estimable, the estimated loss for these matters, incorporates assumptions that are subject to the foregoing uncertainties and are principally derived from, but not exclusively based on, historical claims experience together with facts and circumstances unique to each claim. If the nature and extent of claims in future periods differ from historical claims experience, the Company's assessment of probable and estimable liability with respect to current asserted claims changes and/or actual liability is different to the estimates, then the actual amount of loss may be materially higher or lower than estimated losses accrued.
| | | | | |
| |
James Hardie Industries plc – Notes to Consolidated Financial Statements (Continued) | 122 |
| |
Asbestos-related Accounting Policies
Asbestos Liability
The amount of the asbestos liability has been recognized by reference to (but not exclusively based upon) the most recent actuarial estimate of projected future cash flows as calculated by KPMG Actuarial (“KPMGA”), who are engaged and appointed by AICF under the terms of the AFFA. Based on their assumptions, KPMGA arrived at a range of possible total future cash flows and calculated a central estimate, which is intended to reflect a probability-weighted expected outcome of those actuarially estimated future cash flows projected by KPMGA to occur through 2073.
The Company recognizes the asbestos liability in the consolidated financial statements by reference to (but not exclusively based upon) the undiscounted and uninflated central estimate. The Company considered discounting when determining the best estimate under US GAAP. The Company has recognized the asbestos liability by reference to (but not exclusively based upon) the central estimate as undiscounted on the basis that the timing and amounts of such cash flows are not fixed or readily determinable. The Company considered inflation when determining the best estimate under US GAAP. It is the Company’s view that there are material uncertainties in estimating an appropriate rate of inflation over the extended period of the AFFA. The Company views the undiscounted and uninflated central estimate as the best estimate under US GAAP.
Adjustments in the asbestos liability due to changes in the actuarial estimate of projected future cash flows and changes in the estimate of future operating costs of AICF are reflected in the consolidated statements of operations and comprehensive income during the period in which they occur. Claims paid by AICF and claims-handling costs incurred by AICF are treated as reductions in the Asbestos liability balances.
Insurance Receivable
The insurance receivable recorded by the Company has been recognized by reference to (but not exclusively based upon) the most recent actuarial estimate of recoveries expected from insurance policies and insurance companies with exposure to the asbestos claims, as calculated by KPMGA. The assessment of recoveries is based on the expected pattern of claims against such policies less an allowance for credit risk based on credit agency ratings. The insurance receivable generally includes these cash flows as undiscounted and uninflated, however, where the timing of recoveries has been agreed with the insurer, the receivables are recorded on a discounted basis. The Company records insurance receivables that are deemed probable of being realized.
Adjustments in the insurance receivable due to changes in the actuarial estimate, or changes in the Company’s assessment of recoverability are reflected in the consolidated statements of operations and comprehensive income during the period in which they occur. Insurance recoveries are treated as a reduction in the insurance receivable balance.
Workers’ Compensation
An estimate of the liability related to workers’ compensation claims is prepared by KPMGA as part of the annual actuarial assessment. This estimate contains two components - amounts that will be met by a workers’ compensation scheme or policy and amounts that will be met by the Former James Hardie Companies.
| | | | | |
| |
James Hardie Industries plc – Notes to Consolidated Financial Statements (Continued) | 123 |
| |
The estimated liability is included as part of the asbestos liability and adjustments to the estimate are reflected in the consolidated statements of operations and comprehensive income during the period in which they occur. Amounts that are expected to be paid by the workers’ compensation schemes or policies are recorded as workers’ compensation receivable. Adjustments to the workers’ compensation liability result in an equal adjustment in the workers’ compensation receivable recorded by the Company and have no effect on the consolidated statements of operations and comprehensive income.
Restricted Cash and Cash Equivalents
Cash and cash equivalents of AICF are reflected as restricted assets, as the use of these assets is restricted to the settlement of asbestos claims and payment of the operating costs of AICF. Since cash and cash equivalents are highly liquid, the Company classifies these amounts as a current asset on the consolidated balance sheets.
Restricted Short-Term Investments
Restricted short-term investments of AICF consist of highly liquid investments held in the custody of major financial institutions and are classified as available for sale. These restricted short-term investments are recorded in the financial statements at fair value based on quoted market prices using the specific identification method. Unrealized gains and losses on the fair value of these investments are included as a separate component of Accumulated other comprehensive loss. Realized gains and losses on these investments are recognized in Asbestos adjustments on the consolidated statements of operations and comprehensive income.
Short-Term Debt
AICF has access to a secured loan facility (the “AICF Loan Facility”) made available by the NSW Government, which can be used by AICF to fund the payment of asbestos claims and certain operating and legal costs of AICF and Former James Hardie Companies (together, the “Obligors”).
Interest accrues daily on amounts outstanding, is calculated based on a 365-day year and is payable monthly. AICF may, at its discretion, elect to accrue interest payable on amounts outstanding under the AICF Loan Facility on the date interest becomes due and payable.
Deferred Income Taxes
The Performing Subsidiary can claim a tax deduction for its contributions to AICF over a five-year period commencing in the year the contribution is incurred. Consequently, a deferred tax asset has been recognized equivalent to the anticipated tax benefit over the life of the AFFA.
Adjustments are made to the deferred income tax asset as adjustments to the asbestos-related assets and liabilities are recorded.
| | | | | |
| |
James Hardie Industries plc – Notes to Consolidated Financial Statements (Continued) | 124 |
| |
Asbestos Adjustments
The Asbestos adjustments reflected in the consolidated statements of operations and comprehensive income reflect the net change in the actuarial estimate of the asbestos liability and insurance receivables, and the change in the estimate of AICF claims handling costs. Additionally, as the asbestos-related assets and liabilities are denominated in Australian dollars, the reported values of these asbestos-related assets and liabilities in the Company’s consolidated balance sheets in US dollars are subject to adjustment depending on the closing exchange rate between the two currencies at the balance sheet dates, the effect of which is also included in Asbestos adjustments in the consolidated statements of operations and comprehensive income. Further, changes in the fair value of forward exchange contracts entered into to reduce exposure to the change in foreign currency exchange rates associated with AICF payments are recorded in Asbestos adjustments.
Business combinations
The Company accounts for acquired businesses using the acquisition method of accounting. This method requires that the purchase price be allocated to the identifiable assets acquired and liabilities assumed at their estimated fair values at the date of acquisition. The excess of the purchase price over the identifiable assets acquired and liabilities assumed is recorded as goodwill.
The fair values are determined by management, taking into consideration information supplied by management of the acquired entities, and other relevant information. Such information typically includes valuations obtained from independent appraisal experts, which management reviews and considers in its estimates of fair values. The valuations are generally based upon future cash flow projections for the acquired assets, discounted to present value. The determination of fair values requires significant judgment by management, particularly with respect to the value of identifiable intangible assets. This judgment could result in either a higher or lower value assigned to amortizable or depreciable assets. The impact could result in either higher or lower amortization and/or depreciation expense. Management’s estimates of fair value are based upon assumptions believed to be reasonable, but due to the inherent uncertainty during the measurement period, which may be up to one year from the acquisition date, the Company records adjustments to the assets acquired and liabilities assumed, with the corresponding offset to goodwill.
Accounting Pronouncements
Adopted in Fiscal Year 2021
In June 2016, the Financial Accounting Standards Board ("FASB") issued Accounting Standards Update ("ASU") No. 2016-13, Financial Instruments - Credit Losses: Measurement of Credit Losses on Financial Instruments, which amends the impairment model by requiring entities to use a forward-looking approach based on expected losses to estimate credit losses on certain types of financial instruments, including trade receivables. As required, the Company adopted the standard starting with the fiscal year beginning 1 April 2020 using a modified retrospective approach noting no material differences to the consolidated financial statements for the fiscal year ended 31 March 2021. The Company estimates its allowance for credit losses on the trade receivables as described in the Accounts Receivables policy above.
| | | | | |
| |
James Hardie Industries plc – Notes to Consolidated Financial Statements (Continued) | 125 |
| |
Recently Issued
In December 2019, the FASB issued ASU No. 2019-12, Income taxes (Topic 740). The amendments in the standard are being issued to simplify the accounting for income taxes and are effective for fiscal years and interim periods within those fiscal years, beginning after 15 December 2020 with early adoption permitted. The Company will adopt ASU No. 2019-12 starting with the fiscal year beginning 1 April 2021 and does not expect the adoption of this standard to have a material impact on its consolidated financial statements.
Earnings Per Share
Basic earnings per share ("EPS") is calculated using net income divided by the weighted average number of common shares outstanding during the period. Diluted EPS is similar to basic EPS except that the weighted average number of common shares outstanding is increased to include the number of additional common shares calculated using the treasury method that would have been outstanding if the dilutive potential common shares, such as stock options and RSUs, had been issued.
Basic and dilutive common shares outstanding used in determining net income per share are as follows:
| | | | | | | | | | | | | | | | | |
| | Years Ended 31 March |
| (Millions of shares) | 2021 | | 2020 | | 2019 |
| Basic common shares outstanding | 443.7 | | | 442.6 | | | 441.9 | |
| Dilutive effect of stock awards | 1.7 | | | 1.5 | | | 1.1 | |
| Diluted common shares outstanding | 445.4 | | | 444.1 | | | 443.0 | |
There were no potential common shares which would be considered anti-dilutive for the fiscal years ended 31 March 2021, 2020 and 2019.
Unless they are anti-dilutive, RSUs which vest solely based on continued employment are considered to be outstanding as of their issuance date for purposes of computing diluted EPS and are included in the calculation of diluted EPS using the Treasury Method. Once these RSUs vest, they are included in the basic EPS calculation on a weighted-average basis.
RSUs which vest based on performance or market conditions are considered contingent shares. At each reporting date prior to the end of the contingency period, the Company determines the number of contingently issuable shares to include in the diluted EPS calculation, as the number of shares that would be issuable under the terms of the RSU arrangement, if the end of the reporting period were the end of the contingency period. Once these RSUs vest, they are included in the basic EPS calculation on a weighted-average basis.
Potential common shares of 0.9 million, 1.5 million and 2.2 million for the fiscal years ended 31 March 2021, 2020 and 2019, respectively, have been excluded from the calculation of diluted common shares outstanding as they are considered contingent shares which are not expected to vest.
| | | | | |
| |
James Hardie Industries plc – Notes to Consolidated Financial Statements (Continued) | 126 |
| |
2. Revenues
The following represents the Company's disaggregated revenues for the fiscal years ended 31 March 2021, 2020 and 2019:
| | | | | | | | | | | | | | | | | | | | | | | |
| Year Ended 31 March 2021 |
| (Millions of US dollars) | North America
Fiber Cement | | Asia Pacific
Fiber Cement | | Europe Building
Products | | Consolidated |
| Fiber cement revenues | $ | 2,040.2 | | | $ | 458.2 | | | $ | 55.3 | | | $ | 2,553.7 | |
| Fiber gypsum revenues | — | | | — | | | 355.0 | | | 355.0 | |
| Total revenues | $ | 2,040.2 | | | $ | 458.2 | | | $ | 410.3 | | | $ | 2,908.7 | |
| | | | | | | | | | | | | | | | | | | | | | | | | | | | | |
| Year Ended 31 March 2020 |
| (Millions of US dollars) | North America
Fiber Cement | | Asia Pacific
Fiber Cement | | Europe Building
Products | | Other
Businesses | | Consolidated |
| Fiber cement revenues | $ | 1,816.4 | | | $ | 418.4 | | | $ | 48.0 | | | $ | — | | | $ | 2,282.8 | |
| Fiber gypsum revenues | — | | | — | | | 323.4 | | | — | | | 323.4 | |
| Other revenues | — | | | — | | | — | | | 0.6 | | | 0.6 | |
| Total revenues | $ | 1,816.4 | | | $ | 418.4 | | | $ | 371.4 | | | $ | 0.6 | | | $ | 2,606.8 | |
| | | | | | | | | | | | | | | | | | | | | | | | | | | | | |
| Year Ended 31 March 2019 |
| (Millions of US dollars) | North America
Fiber Cement | | Asia Pacific
Fiber Cement | | Europe Building
Products | | Other
Businesses | | Consolidated |
| Fiber cement revenues | $ | 1,676.9 | | | $ | 446.8 | | | $ | 35.8 | | | $ | — | | | $ | 2,159.5 | |
| Fiber gypsum revenues | — | | | — | | | 332.5 | | | — | | | 332.5 | |
| Other revenues | — | | | — | | | — | | | 14.6 | | | 14.6 | |
| Total revenues | $ | 1,676.9 | | | $ | 446.8 | | | $ | 368.3 | | | $ | 14.6 | | | $ | 2,506.6 | |
The process by which the Company recognizes revenues is similar across each of the Company's reportable segments. Fiber cement and fiber gypsum revenues are primarily generated from the sale of siding and various boards used in external and internal applications, as well as accessories. Fiber gypsum revenues also includes the sale of cement-bonded boards in the Europe Building Products segment. Other revenues were generated from the sale of fiberglass products and windows in the Other Businesses segment, which no longer qualified as a reportable operating segment as of 31 March 2020.
The Company recognizes revenues when the requisite performance obligation has been met, that is, when the Company transfers control of its products to customers, which depending on the terms of the underlying contract, is generally upon delivery. The Company considers shipping and handling activities that it performs as activities to fulfill the sales of its products, with amounts billed for such costs included in net sales and the associated costs incurred for such services recorded in cost of sales, in accordance with the practical expedient provided by Accounting Standards Codification ("ASC") 606.
Certain of the Company's customers receive discounts and rebates as sales incentives, amounts which are recorded as a reduction to revenue at the time the revenue is recognized. These amounts are an estimate recorded by the Company based on historical experience and contractual obligations, the underlying assumptions of which are periodically reviewed and adjusted by the Company, as necessary.
The Company’s contracts are generally short-term in nature, generally not exceeding twelve months, with payment terms varying by the type and location of products or services offered; however, the period between invoicing and when payment is due is not significant.
| | | | | |
| |
James Hardie Industries plc – Notes to Consolidated Financial Statements (Continued) | 127 |
| |
3. Cash and Cash Equivalents, Restricted Cash and Restricted Cash - Asbestos
The following table provides a reconciliation of Cash and cash equivalents, Restricted cash and Restricted cash - Asbestos reported within the consolidated balance sheets that sum to the total of the same such amounts shown in the consolidated statements of cash flows:
| | | | | | | | | | | | | | | |
| | 31 March |
| (Millions of US dollars) | 2021 | | 2020 | | | | |
| Cash and cash equivalents | $ | 208.5 | | | $ | 144.4 | | | | | |
| Restricted cash | 5.0 | | | 5.0 | | | | | |
| Restricted cash - Asbestos | 104.9 | | | 36.4 | | | | | |
| Total cash and cash equivalents, restricted cash and restricted cash - Asbestos | $ | 318.4 | | | $ | 185.8 | | | | | |
4. Accounts and Other Receivables
Accounts and other receivables consist of the following components:
| | | | | | | | | | | |
| | 31 March |
| (Millions of US dollars) | 2021 | | 2020 |
| Trade receivables | $ | 296.7 | | | $ | 268.4 | |
| Income taxes receivable | 25.4 | | | 84.7 | |
| Other receivables and advances | 17.2 | | | 14.6 | |
| Provision for doubtful trade receivables | (6.1) | | | (4.4) | |
| Total accounts and other receivables | $ | 333.2 | | | $ | 363.3 | |
The following are changes in the provision for doubtful trade receivables:
| | | | | | | | | | | | | | | | | |
| | 31 March |
| (Millions of US dollars) | 2021 | | 2020 | | 2019 |
| Balance at beginning of period | $ | 4.4 | | | $ | 2.9 | | | $ | 1.3 | |
| Adjustment to provision | 3.1 | | | 1.7 | | | 2.8 | |
| Write-offs, net of recoveries | (1.4) | | | (0.2) | | | (1.2) | |
| Balance at end of period | $ | 6.1 | | | $ | 4.4 | | | $ | 2.9 | |
| | | | | |
| |
James Hardie Industries plc – Notes to Consolidated Financial Statements (Continued) | 128 |
| |
5. Inventories
Inventories consist of the following components:
| | | | | | | | | | | |
| | 31 March |
| (Millions of US dollars) | 2021 | | 2020 |
| Finished goods | $ | 149.9 | | | $ | 224.4 | |
| Work-in-process | 17.9 | | | 25.2 | |
| Raw materials and supplies | 60.4 | | | 69.9 | |
| Provision for obsolete finished goods and raw materials | (9.9) | | | (14.4) | |
| Total inventories | $ | 218.3 | | | $ | 305.1 | |
The Company identified an immaterial classification error in its 31 March 2020 Inventories footnote which included an understatement in Work-in-process and an overstatement in the Raw materials and supplies balance of US$17.1 million. As such, the prior year amounts above have been reclassified to conform with the current year presentation.
6. Goodwill and Other Intangible Assets
All long-lived intangible assets are reviewed for impairment at least annually, or more frequently if an event occurs indicating the potential for impairment. The Company performed the annual assessment for impairment in the third quarter of fiscal year 2021, noting no impairment.
Goodwill
The following are the changes in the carrying value of goodwill for the fiscal years ended 31 March 2021 and 2020:
| | | | | | | | | | | | | | | | | |
| (Millions of US dollars) | Europe Building Products | | Asia Pacific Fiber Cement | | Total |
| Balance - 31 March 2019 | $ | 200.8 | | | $ | 0.3 | | | $ | 201.1 | |
| Impairment | — | | | (0.2) | | | (0.2) | |
| Foreign exchange impact | (3.9) | | | (0.1) | | | (4.0) | |
| Balance - 31 March 2020 | $ | 196.9 | | | $ | — | | | $ | 196.9 | |
| Foreign exchange impact | 12.4 | | | — | | | 12.4 | |
| Balance - 31 March 2021 | $ | 209.3 | | | $ | — | | | $ | 209.3 | |
Intangible Assets
The following are the net carrying amount of indefinite lived intangible assets other than goodwill for the fiscal years ended 31 March 2021 and 2020:
| | | | | | | | | | | |
| | 31 March |
| (Millions of US dollars) | 2021 | | 2020 |
| Tradenames | $ | 120.6 | | | $ | 113.5 | |
| Other | 7.4 | | | 7.4 | |
| Total | $ | 128.0 | | | $ | 120.9 | |
| | | | | |
| |
James Hardie Industries plc – Notes to Consolidated Financial Statements (Continued) | 129 |
| |
The following are the net carrying amount of amortizable intangible assets for the fiscal years ended 31 March 2021 and 2020:
| | | | | | | | | | | | | | | | | |
| Year Ended 31 March 2021 |
| (Millions of US dollars) | Gross Carrying Amount | | Accumulated Amortization | | Net Carrying Amount |
| Customer Relationships | $ | 55.2 | | | $ | (9.3) | | | $ | 45.9 | |
| Other | 10.9 | | | (10.9) | | | — | |
| Total | $ | 66.1 | | | $ | (20.2) | | | $ | 45.9 | |
| | | | | | | | | | | | | | | | | |
| Year Ended 31 March 2020 |
| (Millions of US dollars) | Gross Carrying Amount | | Accumulated Amortization | | Net Carrying Amount |
| Customer Relationships | $ | 51.4 | | | $ | (6.4) | | | $ | 45.0 | |
| Other | 11.6 | | | (10.8) | | | 0.8 | |
| Total | $ | 63.0 | | | $ | (17.2) | | | $ | 45.8 | |
The amortization of intangible assets was US$2.6 million, US$3.1 million and US$6.1 million for the fiscal years ended 31 March 2021, 2020 and 2019, respectively.
At 31 March 2021, the estimated future amortization of intangible assets is as follows:
| | | | | |
| Years ended 31 March (Millions of US dollars): | |
| 2022 | $ | 3.5 | |
| 2023 | 4.3 | |
| 2024 | 4.7 | |
| 2025 | 4.8 | |
| 2026 | 5.0 | |
7. Property, Plant and Equipment
Property, plant and equipment consist of the following components:
| | | | | | | | | | | |
| | 31 March |
| (Millions of US dollars) | 2021 | | 2020 |
| Land | $ | 85.2 | | | $ | 79.0 | |
| Buildings | 512.8 | | | 432.5 | |
| Machinery and equipment | 1,775.5 | | | 1,511.4 | |
| Construction in progress | 91.8 | | | 267.6 | |
| Property, plant and equipment, at cost | 2,465.3 | | | 2,290.5 | |
| Less accumulated depreciation | (1,093.0) | | | (948.8) | |
| Property, plant and equipment, Net | $ | 1,372.3 | | | $ | 1,341.7 | |
Depreciation expense for the fiscal years ended 31 March 2021, 2020 and 2019 was US$129.6 million, US$125.4 million and US$109.6 million, respectively.
| | | | | |
| |
James Hardie Industries plc – Notes to Consolidated Financial Statements (Continued) | 130 |
| |
Impairment of Property, Plant & Equipment
The Company performs an asset impairment review on a quarterly basis in connection with its assessment of production capabilities and the Company’s ability to meet market demand. The following table summarizes the impairment charges:
| | | | | | | | | | | | | | | | | |
| | Years Ended 31 March |
| (Millions of US dollars) | 2021 | | 2020 | | 2019 |
| North America Fiber Cement | $ | 2.0 | | | $ | 44.0 | | | $ | 3.0 | |
| Asia Pacific Fiber Cement | — | | | 15.0 | | | — | |
| Europe Building Products | — | | | 5.5 | | | — | |
| Other Businesses | — | | | — | | | 6.1 | |
| $ | 2.0 | | | $ | 64.5 | | | $ | 9.1 | |
Charges recorded to Restructuring expenses
North America Fiber Cement segment
For the fiscal year ended 31 March 2020, impairment charges of US$41.2 million were recorded in the North America Fiber Cement segment. Included in this total is US$12.0 million related to the Company's decision to shut down its Summerville, South Carolina facility. This decision resulted from the potential impact of COVID-19 on future fiber cement sales volume. Assets are grouped and evaluated for impairment at the level for which there are identifiable cash flows, which in the case of the Summerville plant included the manufacturing equipment, land, building and right of use assets. In accordance with the applicable accounting guidance, the Company recorded an impairment charge for the difference between the carrying value of the asset group of US$22.1 million and the fair value, based on a third party appraisal of land and buildings, less costs to sell of US$10.1 million.
The remaining impairment charges of US$29.2 million is related to a variety of non-core assets located at four plants across the network which will no longer be used and will be disposed. Due to the unique nature of the non-core fixed assets and the lack of history of selling manufacturing assets, management believes that there will be no future cash flows nor salvage value related to these assets and fully impaired them as of 31 March 2020.
For the fiscal year ended 31 March 2019, the Company recorded impairment charges of US$2.6 million in the North America Fiber Cement segment related to the discontinuance of its MCT product line.
Asia Pacific Fiber Cement segment
For the fiscal year ended 31 March 2020, the Company recorded impairment charges of US$14.0 million in the Asia Pacific Fiber Cement segment due to the decision to shift to an import sales model rather than continue manufacturing in New Zealand, and US$1.0 million due to its decision to exit the James Hardie Systems business on the determination that it no longer fits within the Company's core business. The US$14.0 million charge relates to the full write-down of most of the machinery and equipment at the Penrose plant and the related excess spare parts which will not be utilized prior to shutdown. All the equipment and spare parts are unique to the Company and have immaterial resale or salvage values. The remaining net book value of the Penrose plant’s assets at 31 March 2020 is US$2.6 million.
Europe Building Products segment
For the fiscal year ended 31 March 2020, impairment charges of US$5.5 million were recorded in the Europe Building Products segment relating to a variety of non-core assets which no longer provide economic benefit to the Company.
| | | | | |
| |
James Hardie Industries plc – Notes to Consolidated Financial Statements (Continued) | 131 |
| |
Other Businesses segment
For the fiscal year ended 31 March 2019, the Company recorded impairment charges of US$6.1 million in the Other Businesses segment to due to the Company's decision to cease production of its fiberglass windows business.
Charges recorded to Cost of goods sold
Other impairment charges in the North America Fiber Cement segment related to individual assets totaled US$2.0 million, US$2.8 million and US$0.4 million during fiscal years ended 31 March 2021, 2020 and 2019, respectively.
8. Leases
The Company's lease portfolio consists primarily of real estate, forklifts at its manufacturing facilities and a fleet of vehicles primarily for sales representatives. The lease term for all of its leases includes the non-cancellable period of the lease plus any additional periods covered by either an option to extend (or not to terminate) the lease that the Company is reasonably certain to exercise, or an option to extend (or not to terminate) the lease controlled by the lessor. ASC 842 requires a lessee to discount its unpaid lease payments using the interest rate implicit in the lease or, if that rate cannot be readily determined, its incremental borrowing rate.
The following table represents the Company's ROU assets and lease liabilities:
| | | | | | | | | | | |
| 31 March |
| (Millions of US dollars) | 2021 | | 2020 |
| Assets: | | | |
| Operating leases, net | $ | 46.4 | | | $ | 40.5 | |
| Finance leases, net | 2.7 | | | 1.7 | |
| Total right-of-use assets | $ | 49.1 | | | $ | 42.2 | |
| | | |
| Liabilities: | | | |
| Operating leases: | | | |
| Current | $ | 7.8 | | | $ | 14.3 | |
| Non-Current | 53.3 | | | 41.4 | |
| Total operating lease liabilities | $ | 61.1 | | | $ | 55.7 | |
| | | |
| Finance leases: | | | |
| Current | $ | 1.0 | | | $ | 0.5 | |
| Non-Current | 1.9 | | | 1.5 | |
| Total finance lease liabilities | $ | 2.9 | | | $ | 2.0 | |
| | | |
| Total lease liabilities | $ | 64.0 | | | $ | 57.7 | |
| | | | | |
| |
James Hardie Industries plc – Notes to Consolidated Financial Statements (Continued) | 132 |
| |
The following table represents the Company's lease expense:
| | | | | | | | | | | |
| Years Ended 31 March |
| (Millions of US dollars) | 2021 | | 2020 |
| Operating leases | $ | 17.0 | | | $ | 18.4 | |
| Short-term leases | 2.1 | | | 1.0 | |
| Variable leases | — | | | 0.1 | |
| Finance leases | 0.9 | | | 0.3 | |
| Interest on lease liabilities | 0.1 | | | 0.1 | |
| Total lease expense | $ | 20.1 | | | $ | 19.9 | |
The weighted-average remaining lease term of the Company's leases is as follows:
| | | | | | | | | | | |
| 31 March |
| (In Years) | 2021 | | 2020 |
| Operating leases | 7.8 | | 5.4 |
| Finance leases | 3.5 | | 4.4 |
The weighted-average discount rate of the Company's leases is as follows:
| | | | | | | | | | | |
| 31 March |
| 2021 | | 2020 |
| Operating leases | 4.6 | % | | 4.4 | % |
| Finance leases | 4.5 | % | | 4.4 | % |
The following are future lease payments for non-cancellable leases at 31 March 2021:
| | | | | | | | | | | | | | | | | |
| Years ended 31 March (Millions of US dollars): | Operating
Leases | | Finance
Leases | | Total |
| 2022 | $ | 9.6 | | | $ | 1.0 | | | $ | 10.6 | |
| 2023 | 14.3 | | | 1.0 | | | 15.3 | |
| 2024 | 10.5 | | | 0.5 | | | 11.0 | |
| 2025 | 7.2 | | | 0.3 | | | 7.5 | |
| 2026 | 6.1 | | | 0.2 | | | 6.3 | |
| Thereafter | 30.9 | | | — | | | 30.9 | |
| Total | $ | 78.6 | | | $ | 3.0 | | | $ | 81.6 | |
| Less: imputed interest | | | | | 17.6 | |
| Total lease liabilities | | | | | $ | 64.0 | |
Supplemental cash flow and other information related to leases were as follows:
| | | | | | | | | | | |
| Years Ended 31 March |
| (Millions of US dollars) | 2021 | | 2020 |
| Cash paid for amounts included in the measurement of lease liabilities: | | | |
| Operating cash flows used for operating leases | $ | 19.2 | | | $ | 18.0 | |
| Operating cash flows used for finance leases | 0.1 | | | 0.1 | |
| Financing cash flows used for finance leases | 0.8 | | | 0.4 | |
| Non-cash ROU assets obtained in exchange for new lease liabilities | 26.0 | | | 12.9 | |
| Non-cash remeasurements reducing ROU assets and lease liabilities | (5.1) | | | (19.4) | |
| | | | | |
| |
James Hardie Industries plc – Notes to Consolidated Financial Statements (Continued) | 133 |
| |
9. Accounts Payable and Accrued Liabilities
Accounts payable and accrued liabilities consist of the following components:
| | | | | | | | | | | |
| | 31 March |
| (Millions of US dollars) | 2021 | | 2020 |
| Trade creditors | $ | 174.0 | | | $ | 151.3 | |
| Accrued interest | 4.5 | | | 8.6 | |
| Accrued customer rebates | 80.0 | | | 65.5 | |
| Other creditors and accruals | 48.5 | | | 49.3 | |
| Total accounts payable and accrued liabilities | $ | 307.0 | | | $ | 274.7 | |
10. Long-Term Debt
| | | | | | | | | | | |
| (Millions of US dollars) | 31 March
2021 | | 31 March
2020 |
| Senior unsecured notes: | | | |
Principal amount 4.750% notes due 2025 | $ | — | | | $ | 400.0 | |
Principal amount 3.625% notes due 2026 (€400.0 million) | 468.3 | | | 440.7 | |
Principal amount 5.000% notes due 2028 | 400.0 | | | 400.0 | |
| Total | 868.3 | | | 1,240.7 | |
| | | |
| Unsecured revolving credit facility | — | | | 130.0 | |
| | | |
| Unamortized debt issuance costs: | | | |
Principal amount 4.750% notes due 2025 | — | | | (4.3) | |
Principal amount 3.625% notes due 2026 (€400.0 million) | (4.2) | | | (5.0) | |
Principal amount 5.000% notes due 2028 | (4.3) | | | (4.9) | |
| Unsecured revolving credit facility | (1.2) | | | (1.9) | |
| Total Long-term debt | $ | 858.6 | | | $ | 1,354.6 | |
| | | |
| Weighted average interest rate of Long-term debt | 4.3 | % | | 4.3 | % |
| Weighted average term of available Long-term debt | 4.5 years | | 5.3 years |
| | | |
Fair value of Senior unsecured notes (Level 1) | $ | 904.7 | | | $ | 1,147.7 | |
Senior Unsecured Notes
2025 Senior Unsecured Notes
On 15 January 2021, the Company redeemed US$400.0 million aggregate principal amount of its 4.750% senior notes due 2025 (the “2025 Notes”) and recorded a loss on early debt extinguishment of US$13.1 million, which included US$9.5 million of call redemption premiums and US$3.6 million of unamortized financing costs associated with these notes.
On 18 January 2021, the 2025 Notes were delisted from the Global Exchange Market which is operated by Euronext Dublin.
| | | | | |
| |
James Hardie Industries plc – Notes to Consolidated Financial Statements (Continued) | 134 |
| |
2026 Senior Unsecured Notes
In October 2018, JHIF completed the sale of €400.0 million aggregate principal amount of 3.625% senior notes at par due 1 October 2026 (the “2026 Notes”) with interest payable semi-annually in arrears on 1 October and 1 April of each year. The proceeds from the offering were used to repay €400.0 million outstanding borrowings under a 364-day term loan facility (the "Term Loan Facility") which was used to complete the Fermacell acquisition. On 3 October 2018, JHIF repaid all €400.0 million aggregate principal amount and accrued interest of its Term Loan Facility following the completion of the sale of €400.0 million 2026 Notes (US$458.8 million, based on the exchange rate at 3 October 2018). In connection with this repayment, the Company recorded a loss on early debt extinguishment of US$1.0 million during the fiscal year ended 31 March 2019 associated with the unamortized portion of the deferred financing fees.
2028 Senior Unsecured Notes
In December 2017, JHIF completed the sale of US$400.0 million aggregate principal amount of 5.000% senior notes at par due 15 January 2028 (the “2028 Notes”) with interest payable semi-annually in arrears on 15 January and 15 July of each year.
Unsecured Revolving Credit Facility
In December 2015, James Hardie International Finance Designated Activity Company (“JHIF”) and James Hardie Building Products Inc. (“JHBP”), each a wholly-owned subsidiary of JHI plc, entered into a US$500.0 million unsecured revolving credit facility (the “Revolving Credit Facility”) with certain commercial banks and HSBC Bank USA, National Association, as administrative agent. In December 2017, the Revolving Credit Facility was amended to, among other things, extend the maturity date to December 2022. Debt issuance costs in connection with the Revolving Credit Facility are being amortized as interest expense over the stated term of five years.
Borrowings under the Revolving Credit Facility bear interest at per annum rates equal to, at the borrower’s option, either: (i) the London Interbank Offered Rate (“LIBOR”) plus an applicable margin for LIBOR loans; or (ii) a base rate plus an applicable margin for base rate loans. For LIBOR Loans, the applicable margin ranges from 1.25% to 2.00%, and for base rate loans it ranges from 0.25% to 1.00%. The Company also pays a commitment fee of between 0.20% and 0.35% on the actual daily amount of the unutilized revolving loans.
Guarantees and Compliance
The indenture governing the senior unsecured notes contain covenants that, among other things, limit the ability of the guarantors and their restricted subsidiaries to incur liens on assets, make certain restricted payments, engage in certain sale and leaseback transactions and merge or consolidate with or into other companies. These covenants are subject to certain exceptions and qualifications as described in the indenture. At 31 March 2021, the Company was in compliance with all of its requirements under the indenture related to the senior unsecured notes.
The senior unsecured notes are guaranteed by JHIGL, JHBP and JHTL, each of which are wholly-owned subsidiaries of JHI plc.
| | | | | |
| |
James Hardie Industries plc – Notes to Consolidated Financial Statements (Continued) | 135 |
| |
The Revolving Credit Facility agreement contains certain covenants that, among other things, restrict JHIGL and its restricted subsidiaries’ ability to incur indebtedness and grant liens other than certain types of permitted indebtedness and permitted liens, make certain restricted payments, and undertake certain types of mergers or consolidations actions. At 31 March 2021, the Company was in compliance with all covenants contained in the Revolving Credit Facility agreement.
The Revolving Credit Facility is guaranteed by each of JHIGL and James Hardie Technology Limited ("JHTL"), each of which are wholly-owned subsidiaries of JHI plc.
Off Balance Sheet Arrangements
As of 31 March 2021, the Company had a total borrowing base capacity under the Revolving Credit Facility of US$500.0 million with outstanding borrowings of nil, and US$4.7 million of issued but undrawn letters of credit and bank guarantees. These letters of credit and bank guarantees relate to various operational matters including insurance, performance bonds and other items, leaving the Company with US$495.3 million of available borrowing capacity under the Revolving Credit Facility.
Subsequent Event
As of 18 May 2021, the Company had US$110.0 million drawn under its revolving credit facility, which was used to partially fund the payment of the fiscal year 2021 special dividend.
11. Product Warranties
The Company offers various warranties on its products, including a 30-year limited warranty on certain fiber cement siding products in the United States. A typical warranty program requires the Company to replace defective products within a specified time period from the date of sale. It is possible that future warranty costs could differ from those estimates.
The following are the changes in the product warranty provision:
| | | | | | | | | | | | | | | | | |
| | 31 March |
| (Millions of US dollars) | 2021 | | 2020 | | 2019 |
| Balance at beginning of period | $ | 42.4 | | | $ | 46.6 | | | $ | 52.8 | |
| Increase (Decrease) in accrual | 2.4 | | | 0.8 | | | (0.8) | |
| Acquired during the period | — | | | — | | | 0.5 | |
| Settlements made in cash or in kind | (5.2) | | | (5.0) | | | (5.9) | |
| Balance at end of period | $ | 39.6 | | | $ | 42.4 | | | $ | 46.6 | |
| | | | | |
| |
James Hardie Industries plc – Notes to Consolidated Financial Statements (Continued) | 136 |
| |
12. Asbestos
The AFFA was approved by shareholders in February 2007 to provide long-term funding to AICF. For a discussion of the AFFA and the accounting policies utilized by the Company related to the AFFA and AICF, see Note 1.
Asbestos Adjustments
The Asbestos adjustments included in the consolidated statements of operations and comprehensive income comprise the following:
| | | | | | | | | | | | | | | | | |
| | Years Ended 31 March |
| (Millions of US dollars) | 2021 | | 2020 | | 2019 |
| Change in estimates: | | | | | |
| Change in actuarial estimate - asbestos liability | $ | (33.0) | | | $ | (133.8) | | | $ | (73.8) | |
| Change in actuarial estimate - insurance receivable | 2.0 | | | 5.7 | | | — | |
| Change in estimate - AICF claims-handling costs | (1.5) | | | 0.1 | | | 1.1 | |
| Subtotal - Change in estimates | (32.5) | | | (128.0) | | | (72.7) | |
| Effect of foreign exchange on Asbestos net liabilities | (123.0) | | | 69.0 | | | 49.5 | |
| Gain (loss) on foreign currency forward contracts | 11.7 | | | 0.8 | | | (0.8) | |
| Adjustments in insurance receivable | — | | | — | | | 2.0 | |
| Other | (0.1) | | | — | | | — | |
| Total Asbestos Adjustments | $ | (143.9) | | | $ | (58.2) | | | $ | (22.0) | |
Actuarial Study; Claims Estimate
AICF commissioned an updated actuarial study of potential asbestos-related liabilities as of 31 March 2021. Based on KPMGA’s assumptions, KPMGA arrived at a range of possible total cash flows and calculated a central estimate, which is intended to reflect a probability-weighted expected outcome of those actuarially estimated future cash flows.
The following table sets forth the central estimates, net of insurance recoveries, calculated by KPMGA as of 31 March 2021:
| | | | | | | | | | | |
| Year Ended 31 March 2021 |
| (Millions of US and Australian dollars, respectively) | US$ | | A$ |
| Central Estimate – Discounted and Inflated | 1,339.8 | | | 1,762.6 | |
| Central Estimate – Undiscounted but Inflated | 1,545.8 | | | 2,033.7 | |
| Central Estimate – Undiscounted and Uninflated | 1,027.6 | | | 1,351.9 | |
The asbestos liability has been revised to reflect the most recent undiscounted and uninflated actuarial estimate prepared by KPMGA as of 31 March 2021.
In estimating the potential financial exposure, KPMGA has made a number of assumptions, including, but not limited to, assumptions related to the peak period of claims, total number of claims that are reasonably estimated to be asserted through 2073, the typical cost of settlement (which is sensitive to, among other factors, the industry in which a plaintiff claims exposure, the alleged disease type, the age of the claimant and the jurisdiction in which the action is brought), the legal costs incurred in the litigation of such claims, the rate of receipt of claims, the settlement strategy in dealing with outstanding claims and the timing of settlements. Changes to the assumptions may be necessary in future periods should mesothelioma claims reporting escalate or decline.
| | | | | |
| |
James Hardie Industries plc – Notes to Consolidated Financial Statements (Continued) | 137 |
| |
Due to inherent uncertainties in the legal and medical environment, the number and timing of future claim notifications and settlements, the recoverability of claims against insurance contracts, and estimates of future trends in average claim awards, as well as the extent to which the above named entities will contribute to the overall settlements, the actual liability could differ materially from that which is currently recorded.
The potential range of costs as estimated by KPMGA is affected by a number of variables such as nil settlement rates, peak year of claims, past history of claims numbers, average settlement rates, past history of Australian asbestos-related medical injuries, current number of claims, average defense and plaintiff legal costs, base wage inflation and superimposed inflation. The potential range of losses disclosed includes both asserted and unasserted claims.
A sensitivity analysis was performed by KPMGA to determine how the actuarial estimates would change if certain assumptions (i.e., the rate of inflation and superimposed inflation, the average costs of claims and legal fees, and the projected numbers of claims) were different from the assumptions used to determine the central estimates. The sensitivity analysis performed in the actuarial report is directly related to the discounted but inflated central estimate and the undiscounted but inflated central estimate. The actual cost of the liabilities could be outside of that range depending on the results of actual experience relative to the assumptions made.
The following table summarizes the results of the analysis:
| | | | | | | | | | | |
| As of 31 March 2021 |
| (Millions of US and Australian dollars, respectively) | US$ | | A$ |
Discounted (but inflated) - Low | 990.7 | | | 1,303.4 | |
Discounted (but inflated) - High | 2,229.6 | | | 2,933.2 | |
| | | |
Undiscounted (but inflated) - Low | 1,119.4 | | | 1,472.7 | |
Undiscounted (but inflated) - High | 2,694.4 | | | 3,544.8 | |
Potential variation in the estimated peak period of claims has an impact much greater than the other assumptions used to derive the discounted central estimate. In performing the sensitivity assessment of the estimated incidence pattern reporting for mesothelioma, if the pattern of incidence was shifted by two years, the central estimate could increase by approximately 21% on a discounted basis.
| | | | | |
| |
James Hardie Industries plc – Notes to Consolidated Financial Statements (Continued) | 138 |
| |
Claims Data
The following table shows the activity related to the numbers of open claims, new claims and closed claims during each of the past five years and the average settlement per settled claim and case closed:
| | | | | | | | | | | | | | | | | | | | | | | | | | | | | |
| | For the Years Ended 31 March |
| | 2021 | | 2020 | | 2019 | | 2018 | | 2017 |
| Number of open claims at beginning of period | 393 | | | 332 | | | 336 | | | 352 | | | 426 | |
| Number of new claims | | | | | | | | | |
| Direct claims | 392 | | | 449 | | | 430 | | | 422 | | | 402 | |
| Cross claims | 153 | | | 208 | | | 138 | | | 140 | | | 155 | |
| Number of closed claims | 578 | | | 596 | | | 572 | | | 578 | | | 631 | |
| Number of open claims at end of period | 360 | | | 393 | | | 332 | | | 336 | | | 352 | |
| Average settlement amount per settled claim | A$248,000 | | A$277,000 | | A$262,000 | | A$253,000 | | A$224,000 |
| Average settlement amount per case closed | A$225,000 | | A$245,000 | | A$234,000 | | A$217,000 | | A$168,000 |
| | | | | | | | | |
| Average settlement amount per settled claim | US$178,000 | | US$189,000 | | US$191,000 | | US$196,000 | | US$168,000 |
| Average settlement amount per case closed | US$162,000 | | US$167,000 | | US$171,000 | | US$168,000 | | US$126,000 |
During fiscal year 2021, mesothelioma claims reporting activity was favorable compared to actuarial expectations and the prior corresponding period, primarily driven by lower direct claims which typically cost significantly more than the cross claims. Consistent with prior years, the claimants ages are increasing which also has had a favorable effect on average claim size.
Under the terms of the AFFA, the Company has rights of access to actuarial information produced for AICF by the actuary appointed by AICF, which is currently KPMGA. The Company’s disclosures with respect to claims statistics are subject to it obtaining such information, however, the AFFA does not provide the Company an express right to audit or otherwise require independent verification of such information or the methodologies to be adopted by the approved actuary. As such, the Company relies on the accuracy and completeness of the information provided by AICF to the approved actuary and the resulting information and analysis of the approved actuary when making disclosures with respect to claims statistics.
| | | | | |
| |
James Hardie Industries plc – Notes to Consolidated Financial Statements (Continued) | 139 |
| |
The following is a detailed rollforward of the Net Unfunded AFFA liability, net of tax, for the fiscal year ended 31 March 2021:
| | | | | | | | | | | | | | | | | | | | | | | | | | | | | | | | | | | | | | | | | | | | | | | |
| (Millions of US dollars) | Asbestos Liability | | Insurance
Receivables | | Restricted
Cash and Investments | | Other
Assets
and Liabilities | | Net Unfunded AFFA Liability | | Deferred Tax
Assets | | Income
Tax
Payable | | Net Unfunded AFFA Liability, net of tax |
| Opening Balance - 31 March 2020 | $ | (986.4) | | | $ | 43.5 | | | $ | 58.0 | | | $ | (2.0) | | | $ | (886.9) | | | $ | 319.1 | | | $ | 23.4 | | | $ | (544.4) | |
Asbestos claims paid1 | 105.3 | | | — | | | (105.3) | | | — | | | — | | | — | | | — | | | — | |
Payment received in accordance with AFFA2 | — | | | — | | | 153.3 | | | — | | | 153.3 | | | — | | | — | | | 153.3 | |
AICF claims-handling costs incurred (paid) | 1.1 | | | — | | | (1.1) | | | — | | | — | | | — | | | — | | | — | |
AICF operating costs paid - non claims-handling | — | | | — | | | (1.2) | | | — | | | (1.2) | | | — | | | — | | | (1.2) | |
| Change in actuarial estimate | (33.0) | | | 2.0 | | | — | | | — | | | (31.0) | | | — | | | — | | | (31.0) | |
Change in claims handling cost estimate | (1.5) | | | — | | | — | | | — | | | (1.5) | | | — | | | — | | | (1.5) | |
Impact on deferred income tax due to change in actuarial estimate | — | | | — | | | — | | | — | | | — | | | 9.7 | | | — | | | 9.7 | |
| Insurance recoveries | — | | | (5.8) | | | 5.8 | | | — | | | — | | | — | | | — | | | — | |
| Movement in income tax payable | — | | | — | | | — | | | — | | | — | | | (33.5) | | | 7.4 | | | (26.1) | |
| Other movements | — | | | — | | | 9.5 | | | 0.4 | | | 9.9 | | | 0.2 | | | — | | | 10.1 | |
| Effect of foreign exchange | (221.3) | | | 9.8 | | | 12.5 | | | (0.3) | | | (199.3) | | | 71.9 | | | 4.4 | | | (123.0) | |
| Closing Balance - 31 March 2021 | $ | (1,135.8) | | | $ | 49.5 | | | $ | 131.5 | | | $ | (1.9) | | | $ | (956.7) | | | $ | 367.4 | | | $ | 35.2 | | | $ | (554.1) | |
____________
1Claims paid of US$105.3 million reflects A$146.5 million converted at the average exchange rate for the period based on the assumption that these transactions occurred evenly throughout the period.
AICF Funding
During the fiscal year ending 31 March 2022, the Company anticipates that it will contribute approximately US$252.6 million to AICF. This amount represents 35% of the Company's fiscal year 2021 free cash flow which is equivalent to operating cash flows of US$786.9 million less an adjustment of US$65.3 million, resulting in free cash flow of US$721.6 million for fiscal year 2021, as defined by the AFFA.
During the fiscal years ended 31 March 2021, 2020 and 2019, the Company contributed US$153.3 million (A$220.9 million), US$108.9 million (A$156.7 million) and US$103.0 million (A$138.4 million), respectively, to AICF.
Restricted Short-Term Investments
AICF invests its excess cash in time deposits, which are classified as available-for-sale investments until maturity. The following table represents the investments entered into or maturing during the fiscal year ended 31 March 2021:
| | | | | | | | | | | | | | | | | | | | |
| Date Invested | | Maturity Date | | Interest Rate | | A$ Millions |
| October 2020 | | 2 July 2021 | | 0.59% | | 35.0 |
| July 2019 | | 30 April 2020 | | 1.70% | | 20.0 |
| July 2019 | | 1 June 2020 | | 1.70% | | 15.0 |
| | | | | |
| |
James Hardie Industries plc – Notes to Consolidated Financial Statements (Continued) | 140 |
| |
At 31 March 2021, AICF’s short-term investments were revalued resulting in a mark-to-market fair value adjustment of nil.
AICF – NSW Government Secured Loan Facility
AICF may borrow, subject to certain conditions, up to an aggregate amount of A$320.0 million (US$243.2 million, based on the exchange rate at 31 March 2021). The AICF Loan Facility is guaranteed by the Former James Hardie Companies and is available to be drawn for the payment of claims through 1 November 2030, at which point, all outstanding borrowings must be repaid. Borrowings made under the AICF Loan Facility are classified as current, as AICF intends to repay the debt within one year. At 31 March 2021 and 2020, AICF had no amounts outstanding under the AICF Loan Facility.
13. Derivative Instruments
Foreign Currency Forward Contracts
The Company’s foreign currency forward contracts are valued using models that maximize the use of market observable inputs including interest rate curves and both forward and spot prices for currencies and are categorized as Level 2 within the fair value hierarchy.
Interest Rate Swaps
The fair value of interest rate swap contracts is calculated based on the fixed rate, notional principal, settlement date and present value of the future cash inflows and outflows based on the terms of the agreement and the future floating interest rates as determined by a future interest rate yield curve. The model used to value the interest rate swap contracts is based upon well recognized financial principles, and interest rate yield curves can be validated through readily observable data by external sources. Although readily observable data is used in the valuations, different valuation methodologies could impact the estimated fair value. Accordingly, the interest rate swap contracts are categorized as Level 2 within the fair value hierarchy. Gain and loss on interest rate swap contracts are immaterial and included in Other income (expense).
Derivative Balances
The following table sets forth the total outstanding notional amount and the fair value of the Company’s derivative instruments held at 31 March 2021 and 2020:
| | | | | | | | | | | | | | | | | | | | | | | | | | | | | | | | | | | |
| | | | | Fair Value as of |
| (Millions of US dollars) | Notional Amount | | 31 March 2021 | | 31 March 2020 |
| Derivatives not accounted for as hedges | 31 March 2021 | | 31 March 2020 | | Assets | | Liabilities | | Assets | | Liabilities |
| Foreign currency forward contracts | $ | 456.1 | | | $ | — | | | $ | 5.5 | | | $ | 8.3 | | | $ | — | | | $ | — | |
| Interest rate swap contracts | — | | | 25.0 | | | — | | | — | | | — | | | 0.1 | |
| Total | $ | 456.1 | | | $ | 25.0 | | | $ | 5.5 | | | $ | 8.3 | | | $ | — | | | $ | 0.1 | |
| | | | | |
| |
James Hardie Industries plc – Notes to Consolidated Financial Statements (Continued) | 141 |
| |
The following table sets forth the gain and loss on the Company’s foreign currency forward contracts recorded in the Company's consolidated statements of operations and comprehensive income as follows:
| | | | | | | | | | | | | | | | | |
| 31 March |
| (Millions of US dollars) | 2021 | | 2020 | | 2019 |
| Asbestos adjustments (gain) loss | $ | (11.7) | | | $ | (0.8) | | | $ | 0.8 | |
| Selling, general and administrative expenses | 7.2 | | | 1.3 | | | 3.9 | |
| Total | $ | (4.5) | | | $ | 0.5 | | | $ | 4.7 | |
14. Commitments and Contingencies
Legal Matters
The Company is involved from time to time in various legal proceedings and administrative actions related to the normal conduct of its business, including general liability claims, putative class action lawsuits and litigation concerning its products.
Although it is impossible to predict the outcome of any pending legal proceeding, management believes that such proceedings and actions should not, individually or in the aggregate, have a material adverse effect on the Company’s consolidated financial position, results of operations or cash flows, except as they relate to asbestos and New Zealand product liability claims as described in these consolidated financial statements.
New Zealand Weathertightness Claims
Since fiscal year 2002, the Company’s New Zealand subsidiaries have been joined in a number of weathertightness claims in New Zealand that relate to residential buildings (single dwellings and apartment complexes) and a small number of non-residential buildings, primarily constructed from 1998 to 2004. The claims often involve multiple parties and allege that losses were incurred due to excessive moisture penetration of the buildings’ structures. The claims typically include allegations of poor building design, inadequate certification of plans, inadequate construction review and compliance certification and deficient work by sub-contractors.
Historically, the Company’s New Zealand subsidiaries have been joined to these claims as one of several co-defendants, including local government entities responsible for enforcing building codes and practices, resulting in the Company’s New Zealand subsidiaries becoming liable for only a portion of each claim. In addition, the Company’s New Zealand subsidiaries have had access to third-party recoveries to defray a portion of the costs incurred in resolving such claims.
In 2015, the Company and/or its subsidiaries were named as the sole defendants in four claims on behalf of multiple defendants, three of which are still pending and each of which allege that the New Zealand subsidiaries’ products were inherently defective. The Company believes it has substantial factual and legal defenses to these claims and is defending the claims vigorously.
| | | | | |
| |
James Hardie Industries plc – Notes to Consolidated Financial Statements (Continued) | 142 |
| |
Cridge, et al. (Case Nos. CIV-2015-485-594 and CIV-2015-485-773), In the High Court of New Zealand, Wellington Registry (hereinafter the “Cridge litigation”). In August 2020, trial of phase one of the Cridge litigation commenced in Wellington, New Zealand solely to determine whether the Company’s New Zealand subsidiaries had a duty to the plaintiffs and breached that duty. This phase of the trial concluded in December 2020, and a decision by the Wellington High Court is expected to be announced late in the first quarter of FY 2022. We believe we have substantial factual and legal defenses to the claims in the Cridge litigation. While an unfavorable outcome in this phase is possible as litigation is inherently unpredictable, management does not believe that the outcome of this phase of the litigation will have a material adverse effect on the Company’s financial position. As of 31 March 2021, the Company has not recorded a reserve related to the Cridge litigation as the chance of loss is not probable and the amount of loss, if any, cannot be reasonably estimated. If an adverse decision is reached by the Wellington High Court, certain factors anticipated to be included in the decision may allow the Company to estimate a reasonable range of liability in the Cridge litigation.
White, et al. (Case No. CIV-2015-404-2981 [2021] NZHC 930), In the High Court of New Zealand, Auckland Registry (hereinafter the “White litigation”). The trial of phase one of the White litigation is scheduled to commence on 17 May 2021 in Auckland, New Zealand solely to determine whether the Company’s New Zealand subsidiaries, along with three non-New Zealand Group entities, had a duty to the plaintiffs and breached that duty. As of 31 March 2021, the Company has not recorded a reserve related to the White litigation as the chance of loss is not probable and the amount of loss, if any, cannot be reasonably estimated.
Waitakere, et al. (Case No. CIV-2015-404-3080), In the High Court of New Zealand, Auckland Registry (hereinafter the “Waitakere litigation”). The trial in the Waitakere litigation is currently not scheduled to begin until May 2023 in Auckland, New Zealand. As of 31 March 2021, the Company has not recorded a reserve related to the Waitakere litigation as the chance of loss is not probable and the amount of loss, if any, cannot be reasonably estimated.
A court’s decision in one or more of the litigation matters has the potential to impact the accounting treatment regarding the probability of a potential loss and the Company’s ability to reasonably estimate a reserve with regards to the other litigation matters discussed above. Furthermore, an adverse judgement in one or more of these litigation matters could have a material adverse impact on our consolidated financial position, results of operations or cash flows.
Readers are referred to Note 1 for further information related to our policies related to asserted and unasserted claims.
Environmental and Legal
The operations of the Company, like those of other companies engaged in similar businesses, are subject to several laws and regulations on air and water quality, waste handling and disposal. The Company’s policy is to accrue for environmental costs when it is determined that it is probable that an obligation exists and the amount can be reasonably estimated.
| | | | | |
| |
James Hardie Industries plc – Notes to Consolidated Financial Statements (Continued) | 143 |
| |
15. Income Taxes
Income tax expense includes income taxes currently payable and those deferred because of temporary differences between the financial statement and tax bases of assets and liabilities. Income tax expense consists of the following components:
| | | | | | | | | | | | | | | | | | | | |
| | | Years Ended 31 March |
| (Millions of US dollars) | | 2021 | | 2020 | | 2019 |
| Income before income taxes: | | | | | | |
| Domestic | | $ | 241.9 | | | $ | 209.6 | | | $ | 196.4 | |
| Foreign | | 170.1 | | | 78.4 | | | 104.2 | |
| Income before income taxes: | | $ | 412.0 | | | $ | 288.0 | | | $ | 300.6 | |
| Income tax expense: | | | | | | |
| Current: | | | | | | |
| Domestic | | $ | (38.5) | | | $ | (31.1) | | | $ | (26.6) | |
| Foreign | | 8.6 | | | 39.8 | | | (6.5) | |
| Current income tax (expense) benefit | | (29.9) | | | 8.7 | | | (33.1) | |
| Deferred: | | | | | | |
| Domestic | | (1.4) | | | (4.5) | | | (1.3) | |
| Foreign | | (117.9) | | | (50.7) | | | (37.4) | |
| Deferred income tax expense | | (119.3) | | | (55.2) | | | (38.7) | |
| Total income tax expense | | $ | (149.2) | | | $ | (46.5) | | | $ | (71.8) | |
Income tax expense computed at the statutory rates represents taxes on income applicable to all jurisdictions in which the Company conducts business, calculated at the statutory income tax rate in each jurisdiction multiplied by the pre-tax income attributable to that jurisdiction.
Income tax expense is reconciled to the tax at the statutory rates as follows:
| | | | | | | | | | | | | | | | | | | | |
| | | Years Ended 31 March |
| (Millions of US dollars) | | 2021 | | 2020 | | 2019 |
| Income tax expense computed at the statutory tax rates | | $ | (58.1) | | | $ | (38.7) | | | $ | (48.9) | |
| US state income taxes, net of the federal benefit | | (8.0) | | | (5.7) | | | (3.1) | |
| Asbestos - effect of foreign exchange | | (36.8) | | | 20.9 | | | 14.9 | |
| Expenses not deductible | | (2.0) | | | (5.5) | | | (4.0) | |
| Stock and executive compensation | | (5.5) | | | (1.7) | | | (1.3) | |
| Foreign taxes on domestic income | | (49.8) | | | (43.5) | | | (34.5) | |
| Prior year tax adjustments | | 5.9 | | | (0.4) | | | (0.3) | |
| Taxes on foreign income | | (1.6) | | | 2.7 | | | 4.5 | |
| US net operating loss carryback | | 4.9 | | | 25.5 | | | — | |
| Other items | | 1.8 | | | (0.1) | | | 0.9 | |
| Total income tax expense | | $ | (149.2) | | | $ | (46.5) | | | $ | (71.8) | |
| Effective tax rate | | 36.2 | % | | 16.1 | % | | 23.9 | % |
| | | | | |
| |
James Hardie Industries plc – Notes to Consolidated Financial Statements (Continued) | 144 |
| |
Deferred tax balances consist of the following components:
| | | | | | | | | | | | | | |
| | | 31 March |
| (Millions of US dollars) | | 2021 | | 2020 |
| Deferred tax assets: | | | | |
| Intangible assets | | $ | 1,038.7 | | | $ | 1,126.4 | |
| Asbestos liability | | 367.4 | | | 319.1 | |
| Other provisions and accruals | | 62.2 | | | 54.1 | |
| Net operating loss carryforwards | | 61.0 | | | 41.3 | |
| Foreign and research tax credit carryforwards | | 122.1 | | | 114.2 | |
| Total deferred tax assets | | 1,651.4 | | | 1,655.1 | |
| Valuation allowance | | (262.7) | | | (262.9) | |
| Total deferred tax assets net of valuation allowance | | 1,388.7 | | | 1,392.2 | |
| Deferred tax liabilities: | | | | |
| Depreciable and amortizable assets | | (151.7) | | | (117.5) | |
| Other | | (49.1) | | | (48.1) | |
| Total deferred tax liabilities | | (200.8) | | | (165.6) | |
| Total deferred taxes, net | | $ | 1,187.9 | | | $ | 1,226.6 | |
Deferred income taxes include net operating loss carry-forwards. At 31 March 2021, the Company had tax loss carry-forwards in Australia, New Zealand, Europe and the US of approximately US$61.0 million, that are available to offset future taxable income in the respective jurisdiction.
The Australian net operating loss carry-forwards primarily result from current and prior year tax deductions for contributions to AICF. James Hardie 117 Pty Limited, the performing subsidiary under the AFFA, is able to claim a tax deduction for its contributions to AICF over a five-year period commencing in the year the contribution is incurred. At 31 March 2021, the Company recognized a tax deduction of US$110.9 million (A$154.3 million) for the current year relating to total contributions to AICF of US$558.5 million (A$771.7 million) incurred in tax years 2017 through 2021.
The Company establishes a valuation allowance against a deferred tax asset if it is more likely than not that some portion or all of the deferred tax asset will not be realized.
At 31 March 2021, the Company had foreign tax credit carry-forwards of US$119.5 million and research credits of US$2.6 million that are available to offset future taxes payable. At 31 March 2021, the Company had a 100% valuation allowance against the foreign tax credit carry-forwards.
In determining the need for and the amount of a valuation allowance in respect of the Company’s asbestos related deferred tax asset, management reviewed the relevant empirical evidence, including the current and past core earnings of the Australian business and forecast earnings of the Australian business considering current trends. Although realization of the deferred tax asset will occur over the life of the AFFA, which extends beyond the forecast period for the Australian business, Australia provides an unlimited carry-forward period for tax losses. Based upon managements’ review, the Company believes that it is more likely than not that the Company will realize its asbestos related deferred tax asset and that no valuation allowance is necessary as of 31 March 2021. In the future, based on review of the empirical evidence by management at that time, if management determines that realization of its asbestos related deferred tax asset is not more likely than not, the Company may need to provide a valuation allowance to reduce the carrying value of the asbestos related deferred tax asset to its realizable value.
| | | | | |
| |
James Hardie Industries plc – Notes to Consolidated Financial Statements (Continued) | 145 |
| |
At 31 March 2021, the Company had prepaid and refundable income taxes of US$30.5 million. During the fiscal year ended 31 March 2021, total income tax refunds received, net of withholding tax paid was US$3.7 million.
The US Coronavirus Aid, Relief, and Economic Security Act ("CARES Act") was enacted in March 2020 providing wide ranging economic relief for individuals and businesses. One component of the CARES Act provides the Company with an opportunity to carryback US net operating losses (“NOLs”) arising during the years ended 31 March 2021 and 2020 to the prior five tax years. The Company has previously valued its NOLs at the US federal corporate income tax rate of 21%. However, the provisions of the CARES Act provide for NOL carryback claims to be calculated based on a rate of 35%, which was the US federal corporate tax rate in effect in the carryback years. The Company intends to utilize these carryback provisions to obtain an estimated refund of US$42.3 million. At 31 March 2021 the Company recorded current taxes receivable of US$25.3 million, a reduction of US$17.0 million in non-current taxes payable associated with the deferred deemed repatriation tax and an income tax benefit of US$4.9 million resulting from tax losses being utilized at the higher US federal corporate tax rate applying in the carryback years.
The Company or its subsidiaries files income tax returns in various jurisdictions including Ireland, the United States, Australia and various jurisdictions in Europe and Asia Pacific. Due to the size and nature of its business, the Company is subject to ongoing audits and reviews by taxing jurisdictions on various tax matters. The Company is no longer subject to general tax examinations in Ireland for the tax years prior to tax year 2017, Australia for tax years prior to tax year 2016 and in the US for tax years prior to tax year 2014.
Unrecognized Tax Benefits
For the fiscal years ended 31 March 2021, 2020, and 2019, the total amount of penalties and interest recorded in Income tax expense related to unrecognized tax benefits were immaterial. The liabilities associated with uncertain tax benefits are included in Other liabilities on the Company’s consolidated balance sheets. At 31 March 2021, the total amount of unrecognized tax benefits and the total amount of interest and penalties accrued by the Company that, if recognized, would affect the effective tax rate were US$0.5 million.
16. Stock-Based Compensation
Total stock-based compensation expense consists of the following:
| | | | | | | | | | | | | | | | | |
| | Years Ended 31 March |
| (Millions of US dollars) | 2021 | | 2020 | | 2019 |
| Liability Awards | $ | 21.7 | | | $ | 2.8 | | | $ | (0.6) | |
| Equity Awards | 18.0 | | | 10.3 | | | 12.5 | |
| Total stock-based compensation expense | $ | 39.7 | | | $ | 13.1 | | | $ | 11.9 | |
As of 31 March 2021, the unrecorded future stock-based compensation expense related to outstanding equity awards was US$17.1 million and will be recognized over an estimated weighted average amortization period of 1.8 years.
| | | | | |
| |
James Hardie Industries plc – Notes to Consolidated Financial Statements (Continued) | 146 |
| |
2001 Equity Incentive Plan
Under the Company’s 2001 Equity Incentive Plan (the “2001 Plan”), which was reapproved to continue until September 2021, the Company can grant equity awards in the form of nonqualified stock options, performance awards, restricted stock grants, stock appreciation rights, dividend equivalent rights, phantom stock or other stock-based benefits such as restricted stock units.
Long-Term Incentive Plan 2006
The Company’s shareholders approved the establishment of a Long-Term Incentive Plan in 2006 (the “LTIP”) to provide incentives to certain members of senior management (“Executives”). The Company determines the conditions or restrictions of any awards, which may include requirements of continued employment, individual performance or the Company’s financial performance or other criteria. Currently, the plan only allows for RSUs to be granted under the LTIP.
The following table summarizes the Company’s shares available for grant as options, RSUs or other equity instruments under the LTIP and 2001 Plan:
| | | | | |
| Shares
Available for
Grant |
| Balance at 31 March 2019 | 23,744,816 | |
| Granted | (800,437) | |
| Balance at 31 March 2020 | 22,944,379 | |
| Granted | (856,756) | |
| Balance at 31 March 2021 | 22,087,623 | |
RSUs
The Company estimates the fair value of RSUs on the date of grant and recognizes this estimated fair value as compensation expense over the periods in which the RSU vests.
The following table summarizes the Company’s RSU activity:
| | | | | | | | | | | | | | | | | | | | | | | | | | | | | |
| (Units) | Service
Vesting
(2001 Plan) | | Performance
Vesting
(LTIP) | | Market
Conditions (LTIP) | | Total | | Weighted
Average Fair
Value at Grant
Date (A$) |
| Outstanding at 31 March 2019 | 910,386 | | | 1,148,022 | | | 2,203,100 | | | 4,261,508 | | | 14.47 | |
| Granted | 24,006 | | | 273,258 | | | 503,173 | | | 800,437 | | | 18.08 | |
| Vested | (304,591) | | | (207,271) | | | (362,973) | | | (874,835) | | | 16.21 | |
| Forfeited | (109,169) | | | (349,844) | | | (565,660) | | | (1,024,673) | | | 15.21 | |
| Outstanding at 31 March 2020 | 520,632 | | | 864,165 | | | 1,777,640 | | | 3,162,437 | | | 14.64 | |
| Granted | 371,806 | | | 190,376 | | | 294,574 | | | 856,756 | | | 26.56 | |
| Vested | (245,385) | | | (174,356) | | | (722,156) | | | (1,141,897) | | | 13.03 | |
| Forfeited | (53,567) | | | (153,897) | | | (63,136) | | | (270,600) | | | 17.05 | |
| Outstanding at 31 March 2021 | 593,486 | | | 726,288 | | | 1,286,922 | | | 2,606,696 | | | 19.01 | |
| | | | | |
| |
James Hardie Industries plc – Notes to Consolidated Financial Statements (Continued) | 147 |
| |
The following table includes the assumptions used for RSU grants (market condition) valued:
| | | | | | | | | | | | | | | | | | | | | | | | | | | | | |
| Vesting Condition: | Market | | Market | | Market | | Market | | Market |
| | FY21 | | FY21 | | FY20 | | FY20 | | FY20 |
Date of grant1 | 15 Sep 2020 | | 5 Nov 2020 | | 25 Feb 2020 | | 20 Sep 2019 | | 9 Aug 2019 |
| Dividend yield (per annum) | — | % | | 1.3 | % | | 2.9 | % | | 3.1 | % | | 3.1 | % |
| Expected volatility | 39.2 | % | | 40.1 | % | | 26.6 | % | | 26.6 | % | | 27.8 | % |
| Risk free interest rate | 0.2 | % | | 0.2 | % | | 1.2 | % | | 1.6 | % | | 1.6 | % |
| Expected life in years | 2.9 | | 2.8 | | 2.5 | | 2.9 | | 2.0 |
| JHX stock price at grant date (A$) | 30.33 | | 37.24 | | 29.54 | | 24.69 | | 21.68 |
| Number of restricted stock units | 167,491 | | 127,083 | | 6,676 | | 477,979 | | 18,518 |
Scorecard LTI – CSUs
Under the terms of the LTIP, the Company grants scorecard LTI CSUs to executives and the vesting of awards is based on the individual's performance measured over a three year period against certain performance targets. These awards provide recipients a cash incentive based on an average 20 trading-day closing price of JHI plc’s common stock price and each executive’s scorecard rating.
The following represents the activity related to the CSUs:
| | | | | | | | | | | | | | |
| | FY21 | | FY20 |
| Granted | | 571,132 | | | 791,217 | |
| Vested | | 377,506 | | | 129,549 | |
| Cancelled | | 607,253 | | | 328,935 | |
For the fiscal years ending 31 March 2021, 2020 and 2019, US$8.2 million, US$2.0 million and US$2.4 million, respectively, was paid in cash upon vesting of CSU units.
17. Dividends
The following table summarizes the dividends declared or paid during the fiscal years 2021, 2020 and 2019:
| | | | | | | | | | | | | | | | | | | | | | | | | | | | | |
| (Millions of US dollars) | US
Cents/Security | | US$ Millions
Total Amount | | Announcement Date | | Record Date | | Payment Date |
| FY 2021 special dividend | 0.70 | | 309.6 | | 10 February 2021 | | 19 February 2021 | | 30 April 2021 |
FY 2020 first half dividend 1 | 0.10 | | 44.7 | | 7 November 2019 | | 18 November 2019 | | 20 December 2019 |
| FY 2019 second half dividend | 0.26 | | 113.9 | | 21 May 2019 | | 6 June 2019 | | 2 August 2019 |
| FY 2019 first half dividend | 0.10 | | 43.6 | | 8 November 2018 | | 12 December 2018 | | 22 February 2019 |
| FY 2018 second half dividend | 0.30 | | 128.5 | | 22 May 2018 | | 7 June 2018 | | 3 August 2018 |
| | | | | |
| |
James Hardie Industries plc – Notes to Consolidated Financial Statements (Continued) | 148 |
| |
18. Operating Segment Information and Concentrations of Risk
The Company reports its operating segment information in the format that the operating segment information is available to and evaluated by the Chief Operating Decision Maker. The North America Fiber Cement segment manufactures fiber cement interior linings, exterior siding products and related accessories in the United States; these products are sold in the United States and Canada. The Asia Pacific Fiber Cement segment includes all fiber cement products manufactured in Australia and the Philippines, and sold in Australia, New Zealand, Asia, the Middle East and various Pacific Islands. The Europe Building Products segment includes the Fermacell business and fiber cement product manufactured in the United States that is sold in Europe. The Other Businesses segment ceased to be an operating and reportable segment effective 31 March 2020 due to the Company's completion of its exit of its non-fiber cement manufacturing and sales activities in North America, including fiberglass windows. The Research and Development segment represents the cost incurred by the research and development centers. General Corporate primarily consist of Asbestos adjustments, officer and employee compensation and related benefits, professional and legal fees, administrative costs and rental expense, net of rental income, on the Company’s corporate offices. The Company does not report net interest expense for each segment as the segments are not held directly accountable for interest expense.
Operating Segments
The following is the Company’s operating segment information:
| | | | | | | | | | | | | | | | | | | | |
| | | Net Sales
Years Ended 31 March |
| (Millions of US dollars) | | 2021 | | 2020 | | 2019 |
| North America Fiber Cement | | $ | 2,040.2 | | | $ | 1,816.4 | | | $ | 1,676.9 | |
| Asia Pacific Fiber Cement | | 458.2 | | | 418.4 | | | 446.8 | |
| Europe Building Products | | 410.3 | | | 371.4 | | | 368.3 | |
| Other Businesses | | — | | | 0.6 | | | 14.6 | |
| Worldwide total | | $ | 2,908.7 | | | $ | 2,606.8 | | | $ | 2,506.6 | |
| | | | | | |
| | | | | | |
| | | Income Before Income Taxes
Years Ended 31 March |
| (Millions of US dollars) | | 2021 | | 2020 | | 2019 |
| North America Fiber Cement | | $ | 585.5 | | | $ | 429.3 | | | $ | 382.5 | |
| Asia Pacific Fiber Cement | | 124.8 | | | 58.5 | | | 99.8 | |
| Europe Building Products | | 37.6 | | | 11.2 | | | 10.0 | |
| Other Businesses | | — | | | — | | | (30.9) | |
| Research and Development | | (28.9) | | | (27.0) | | | (29.0) | |
| Segments total | | 719.0 | | | 472.0 | | | 432.4 | |
| General Corporate | | (246.2) | | | (129.5) | | | (80.8) | |
| Total operating income | | 472.8 | | | 342.5 | | | 351.6 | |
| | | | | | |
| | | | | | |
| | | | | | |
| | | | | | |
| | | | | |
| |
James Hardie Industries plc – Notes to Consolidated Financial Statements (Continued) | 149 |
| |
| | | | | | | | | | | | | | | | | | | | |
| | Depreciation and Amortization Years ended 31 March |
| (Millions of US dollars) | | 2021 | | 2020 | | 2019 |
| North America Fiber Cement | | $ | 89.1 | | | $ | 88.7 | | | $ | 80.2 | |
| Asia Pacific Fiber Cement | | 13.9 | | | 12.7 | | | 12.8 | |
| Europe Building Products | | 28.0 | | | 25.6 | | | 18.7 | |
| Other Businesses | | — | | | 0.2 | | | 2.3 | |
| General Corporate | | 2.8 | | | 3.2 | | | 4.3 | |
| Research and Development | | 1.2 | | | 1.1 | | | 1.1 | |
| Total | | $ | 135.0 | | | $ | 131.5 | | | $ | 119.4 | |
| | | | | | | | | | | | | | |
| | | Total Identifiable Assets
31 March |
| (Millions of US dollars) | | 2021 | | 2020 |
| North America Fiber Cement | | $ | 1,273.9 | | | $ | 1,320.0 | |
| Asia Pacific Fiber Cement | | 371.0 | | | 314.3 | |
| Europe Building Products | | 762.1 | | | 748.5 | |
| Research and Development | | 10.3 | | | 8.6 | |
| Segments total | | 2,417.3 | | | 2,391.4 | |
General Corporate 1 | | 1,671.7 | | | 1,636.9 | |
| Worldwide total | | $ | 4,089.0 | | | $ | 4,028.3 | |
The following is the Company’s geographical information:
| | | | | | | | | | | | | | | | | | | | |
| | | Net Sales
Years Ended 31 March |
| (Millions of US dollars) | | 2021 | | 2020 | | 2019 |
North America 2 | | $ | 2,040.2 | | | $ | 1,817.0 | | | $ | 1,691.5 | |
| Australia | | 321.9 | | | 290.4 | | | 315.1 | |
| Germany | | 143.0 | | | 135.7 | | | 137.1 | |
| New Zealand | | 81.9 | | | 72.2 | | | 79.1 | |
Other Countries 3 | | 321.7 | | | 291.5 | | | 283.8 | |
| Worldwide total | | $ | 2,908.7 | | | $ | 2,606.8 | | | $ | 2,506.6 | |
| | | | | | |
| | | | | | |
| | | | Total Identifiable Assets
31 March |
| (Millions of US dollars) | | | | 2021 | | 2020 |
North America 2 | | | | $ | 1,279.4 | | | $ | 1,324.8 | |
| Australia | | | | 256.7 | | | 220.0 | |
| Germany | | | | 527.6 | | | 519.3 | |
| New Zealand | | | | 46.3 | | | 32.4 | |
Other Countries 3 | | | | 307.3 | | | 294.9 | |
| Segments total | | | | 2,417.3 | | | 2,391.4 | |
General Corporate 1 | | | | 1,671.7 | | | 1,636.9 | |
| Worldwide total | | | | $ | 4,089.0 | | | $ | 4,028.3 | |
| | | | | |
| |
James Hardie Industries plc – Notes to Consolidated Financial Statements (Continued) | 150 |
| |
____________
1.Included in General Corporate are deferred tax assets for each operating segment that are not held directly accountable for deferred income taxes and Asbestos-related assets.
2.The amounts disclosed for North America are substantially all related to the USA.
3.Included are all other countries that account for less than 5% of net sales and total identifiable assets individually, primarily in the Philippines, Switzerland and other European countries.
Research and development expenditures are expensed as incurred and are summarized by segment in the following table. Research and development segment operating income also includes Selling, general and administrative expenses of US$2.9 million, US$3.0 million and US$2.3 million in fiscal years 2021, 2020 and 2019, respectively.
| | | | | | | | | | | | | | | | | | | | |
| | | Years Ended 31 March |
| (Millions of US dollars) | | 2021 | | 2020 | | 2019 |
| North America Fiber Cement | | $ | 5.6 | | | $ | 5.3 | | | $ | 6.5 | |
| Asia Pacific Fiber Cement | | 1.1 | | | 1.8 | | | 2.1 | |
| Europe Building Products | | 1.6 | | | 1.7 | | | 2.6 | |
| Research and Development | | 26.0 | | | 24.0 | | | 26.7 | |
| | $ | 34.3 | | | $ | 32.8 | | | $ | 37.9 | |
The following represents the Asset impairments by segment for the fiscal year ended 31 March 2020:
| | | | | | | | | | | | | | | | | | | | | | | | | | | | | | | | |
| (Millions of US dollars) | | North America Fiber Cement | | Asia Pacific Fiber Cement | | Europe Building Products | | General Corporate | | Total |
Property, plant and equipment 1 | | $ | 41.2 | | | $ | 15.0 | | | $ | 5.5 | | | $ | — | | | $ | 61.7 | |
Right-of-use assets 2 | | — | | | 11.2 | | | — | | | — | | | 11.2 | |
| Intangible assets | | — | | | — | | | — | | | 1.4 | | | 1.4 | |
Inventories 3 | | — | | | 2.9 | | | — | | | — | | | 2.9 | |
| Goodwill | | — | | | 0.2 | | | — | | | — | | | 0.2 | |
Asset Retirement Obligations 4 | | — | | | 5.8 | | | — | | | — | | | 5.8 | |
| Other | | — | | | 1.2 | | | — | | | — | | | 1.2 | |
| | $ | 41.2 | | | $ | 36.3 | | | $ | 5.5 | | | $ | 1.4 | | | $ | 84.4 | |
1 Excludes US$2.8 million of impairment charges in North America Fiber Cement segment on individual assets that were included in Cost of goods sold. Refer to Note 7 for further details. |
2 Relates to the closure of the Penrose, New Zealand plant |
3 The US$2.9 million charge primarily relates to the estimated costs associated with pallets and raw materials, with the closing of the New Zealand plant and exit of James Hardie Systems. |
4 The total Asset Retirement Obligation balance at 31 March 2020 of US$8.0 million is recorded in the Asia Pacific Fiber Cement segment in Other liabilities - non-current and relates to the New Zealand plant. This balance is inclusive of the impairment amount above. |
| | | | | |
| |
James Hardie Industries plc – Notes to Consolidated Financial Statements (Continued) | 151 |
| |
Concentrations of Risk
The distribution channels for the Company’s fiber cement products are concentrated. The Company has one customer who has contributed greater than 10% of net sales in each of the past three fiscal years. The following is net sales generated by this customer, which is from the North America Fiber Cement segment:
| | | | | | | | | | | | | | | | | | | | | | | | | | | | | | | | | | | | | | |
| | | Years Ended 31 March |
| (Millions of US dollars) | | 2021 | | 2020 | | 2019 |
| Customer A | | $ | 347.3 | | | 12.0 | % | | $ | 306.0 | | | 12.0 | % | | $ | 260.5 | | | 10.4 | % |
Approximately 33%, 34% and 36% of the Company’s net sales in fiscal year 2021, 2020 and 2019, respectively, were from outside the United States. Consequently, changes in the value of foreign currencies could significantly affect the consolidated financial position, results of operations and cash flows of the Company’s non-US operations on translation into US dollars.
19. Accumulated Other Comprehensive Loss
Accumulated other comprehensive loss is comprised of the following at 31 March 2021:
| | | | | | | | | | | | | | | | | | | | | | | | | | |
| (Millions of US dollars) | | Cash Flow
Hedges | | Pension
Actuarial Gain | | Foreign
Currency
Translation
Adjustments | | Total |
| Balance at 31 March 2020 | | $ | 0.2 | | | $ | 0.8 | | | $ | (63.1) | | | $ | (62.1) | |
| Other comprehensive (loss) gain | | — | | | (0.4) | | | 55.9 | | | 55.5 | |
| Balance at 31 March 2021 | | $ | 0.2 | | | $ | 0.4 | | | $ | (7.2) | | | $ | (6.6) | |
20. Employee Benefit Plan
In the United States, the Company sponsors a defined contribution plan, the James Hardie Retirement and Profit Sharing Plan (the “401(k) Plan”) which is a tax-qualified retirement and savings plan covering all US employees, including the Senior Executive Officers, subject to certain eligibility requirements. In addition, the Company matches employee's contributions dollar for dollar up to a maximum of the first 6% of an employee’s eligible compensation.
For the fiscal years ended 31 March 2021, 2020 and 2019, the Company made matching contributions of US$11.1 million, US$11.1 million and US$10.6 million, respectively.
In January 2021, the Company established a deferred compensation plan for its executives whereby the plan assets are held in a rabbi trust. The deferred compensation is funded to the rabbi trust which holds investments directed by the participants and are accounted for as held for sale. The Company will match up to a maximum of the first 6% of an employee's eligible compensation that would not be eligible in the 401(k) Plan due to internal revenue service contribution limits so long as the participant defers eligible compensation to the deferred compensation plan. As of 31 March 2021, the assets held in trust and related deferred compensation liability recorded in the accompanying consolidated balance sheets are immaterial.
| | | | | |
| |
James Hardie 2021 Annual Report on Form 20-F | 152 |
| |
REMUNERATION OF INDEPENDENT REGISTERED PUBLIC ACCOUNTING FIRM
(UNAUDITED, NOT FORMING PART OF THE CONSOLIDATED FINANCIAL STATEMENTS)
Fees billed for each of the last three fiscal years for professional services provided by our independent registered public accounting were as follows:
| | | | | | | | | | | | | | | | | |
| | US$ Millions |
| Description of Service | FY21 | | FY20 | | FY19 |
Audit fees1 | $ | 5.6 | | | $ | 5.7 | | | $ | 5.7 | |
Audit-related fees2 | — | | | — | | | — | |
| Tax fees | — | | | — | | | — | |
| All other fees | $ | — | | | $ | — | | | $ | — | |
____________
1Audit Fees include the aggregate fees for professional services rendered by our independent registered public accounting firm. Professional services include the audit of our annual financial statements and services that are normally provided in connection with statutory and regulatory filings.
2Audit-Related Fees include the aggregate fees billed for assurance and related services rendered by our independent registered public accounting firm. Our independent registered public accounting firm did not engage any temporary employees to conduct any portion of the audit of our consolidated financial statements for the fiscal years ended 31 March 2021, 2020 and 2019.
Audit Committee Pre-Approval Policies and Procedures
In accordance with our Audit Committee’s policy and the requirements of the law, all services provided by our independent registered public accounting firm are pre-approved from time to time by the Audit Committee. Pre-approval includes a list of specific audit and non-audit services in the following categories: audit services, audit-related services, tax services and other services. Any additional services that we may ask our independent registered public accounting firm to perform will be set forth in a separate document requesting Audit Committee approval in advance of the service being performed.
All of the services pre-approved by the Audit Committee are permissible under the SEC’s auditor independence rules. To avoid potential conflicts of interest, the law prohibits a publicly traded company from obtaining certain non-audit services from its independent registered public accounting firm. We obtain these services from other service providers as needed.
| | | | | |
| |
James Hardie 2021 Annual Report on Form 20-F | 153 |
| |
SECTION 3
RISK FACTORS
Our business, operations and financial condition are subject to various risks and uncertainties. We have described below significant factors that may adversely affect our business, operations, financial performance and condition or industry. Readers should be aware that the occurrence of any of the events described in these risk factors, elsewhere in or incorporated by reference into this Annual Report, and other events that we have not predicted or assessed, could have a material adverse effect on our financial position, liquidity, results of operations and cash flows.
Business and Operational Risks
The outbreak of COVID-19 may adversely impact on our business, sales, results of operations and financial condition.
Our operations expose us to risks associated with pandemics and other public health emergencies, such as the continuing COVID-19 pandemic. In March 2020, the World Health Organization ("WHO") characterized the outbreak of COVID-19 as a global pandemic and recommended containment and mitigation measures. There have been extraordinary and wide-ranging actions taken by international, federal, state and local public health and governmental authorities to contain and combat the outbreak and spread of COVID-19 in regions across the United States and the world, including quarantines, “stay-at-home” orders and similar mandates. Although some restrictions have eased in some jurisdictions, regions across the United States and the world continue to impose or are re-imposing closures and other restrictions.
We operate facilities around the world that are being affected by this pandemic. In the U.S., we are a company operating in a critical infrastructure industry and we continue to operate across our North America footprint. In Europe and Asia Pacific, governmental measures to slow and limit the spread of COVID-19 have previously resulted in the temporary closure of certain of our facilities, however, as of the date of this Annual Report, all of our facilities remain fully operational. Notwithstanding our level of continued operations, COVID-19 could negatively impact our future manufacturing operations, including additional facility closures, as well as adversely affect our supply chain and transportation networks. Our business is also dependent on the continued health and productivity of our employees throughout this crisis and we have incurred and will continue to incur additional costs to ensure we abide by all applicable health and safety regulations at each location that we operate.
In addition, COVID-19 may continue to adversely affect global economic activity. Our business may be negatively impacted if the disruptions related to COVID-19 decrease new home building and remodeling activity, precipitate a prolonged economic downturn and/or lead to an extended rise in unemployment, any of which could lower demand for our products. The inherent uncertainty surrounding COVID-19 makes it more challenging for our management to estimate the future performance of our business and the economic impact of the COVID-19 pandemic. Accordingly, future developments in the COVID-19 pandemic may materially impact our business and current estimates. The impact of COVID-19 could also have the effect of heightening certain of the other risks described in the “Risk Factors” section of this Annual Report. Individually and collectively, the consequences of the COVID-19 outbreak could have a material adverse effect on our business, sales, results of operations and financial condition.
| | | | | |
| |
James Hardie 2021 Annual Report on Form 20-F | 154 |
| |
Our business is dependent on the residential and commercial construction markets.
Demand for our products depends in large part on the residential construction markets and, to a lesser extent, on commercial construction markets. The level of activity in residential construction markets depends on residential remodeling projects and new housing starts, which are a function of many factors outside our control, including general economic conditions, the availability of financing, regulatory changes, mortgage and other interest rates, inflation, household income and wage growth, unemployment, the inventory of unsold homes, the level of foreclosures, home resale rates, housing affordability, demographic trends, gross domestic product growth and consumer confidence in each of the countries and regions in which we operate.
Any slowdown in the markets we serve would likely result in decreased demand for our products and cause us to experience decreased sales and operating income. In addition, deterioration or continued weaknesses in general economic conditions, such as higher interest rates, high levels of unemployment, restrictive lending practices, restricted covenants, heightened regulation and increased foreclosures, could have a material adverse effect on our financial position, liquidity, results of operations and cash flows.
Substantial and increasing competition in the building products industry would likely materially adversely affect our business.
Competition in the building products industry is based largely on price, quality, performance and service. Our products compete with products manufactured from natural and engineered wood, vinyl, stucco, masonry, brick, gypsum and other materials, as well as fiber cement and fiber gypsum products offered by other manufacturers. Some of our competitors may have greater product diversity, greater financial and other resources, and better access to raw materials than we do and, among other factors, may be less affected by reductions in margins resulting from price competition.
Increased competition in any of the markets in which we compete would likely cause pricing pressures in those markets. Any of these factors would likely have a material adverse effect on our financial position, liquidity, results of operations and cash flows.
We may experience unforeseen delays and/or cost overruns in our planned capital expenditures in future periods, and such delays and/or cost overruns could result in additional expenses and impairment charges. Unforeseen delays may also impact our ability to add additional manufacturing capacity at the appropriate time.
We have incurred significant levels of capital expenditures in the past and we expect to incur significant capital expenditures in future periods on facility upgrades and expansions, equipment to ensure regulatory compliance, the implementation of new technologies and to improve efficiency. We may incur unforeseen delays and/or cost overruns due to a variety of factors, including, but not limited to, a decline in general economic conditions, a downturn in the principal markets in which we operate, the entrance of a key competitor, increased costs resulting from tariffs or other international trade disputes or an adverse change in the regulatory environment impacting our business. Any one or combination of these or other factors could have a significant adverse effect on the nature, timing, extent and amount of our planned capital expenditures, and may also result in potential additional expenses and a write-down in the carrying value of our capital projects and other existing production assets. Such delays, cost overruns and asset impairment charges could have a material adverse effect on our financial position, results of operations and liquidity.
As a result of unforeseen delays, we may also fail to achieve the levels of additional manufacturing capacity we have forecasted for our plants, as described elsewhere in this Annual Report. We cannot
| | | | | |
| |
James Hardie 2021 Annual Report on Form 20-F | 155 |
| |
provide assurances that these additional manufacturing capacities will be achieved or that the related projects will be completed as anticipated or at all or that such additional capacities will operate at their expected utilization rate. These projections are based on our current estimates, but they involve risks, uncertainties, assumptions and other factors that may cause actual results to be materially different from our estimates. Neither our independent auditors nor any other independent auditors have examined, compiled or performed any procedures with respect to these projections, nor have they expressed any opinion or any other form of assurance on such information or their achievability. Although management believes these estimates and the assumptions underlying them to be reasonable, they could be inaccurate, and investors should not place undue reliance upon them.
We may experience adverse fluctuations in the supply and cost of raw materials and energy supply necessary to our business, which could have a material adverse effect on our business.
Cellulose fiber (wood-based pulp), silica, cement and water are the principal raw materials used in the production of fiber cement, and the availability and cost of such raw materials are critical to our operations. Our fiber cement business periodically experiences fluctuations in the supply and costs of raw materials, and some of our supply markets are concentrated.
Gypsum, paper, water and cement are the principal raw materials used in the production of fiber gypsum, and the availability and cost of such raw materials are critical to our operations. Our fiber gypsum business periodically experiences fluctuations in the supply and costs of raw materials, and some of our supply markets are concentrated.
Price fluctuations or material delays may occur in the future due to lack of raw materials, suppliers, or supply chain disruptions. The loss or deterioration of our relationship with a major supplier, an increase in demand by third parties for a particular supplier’s products or materials, delays in obtaining materials, or significant increases in fuel and energy costs could have a material adverse effect on our financial position, liquidity, results of operations and cash flows.
Our reliance on third-party distribution channels could impact our business.
We offer our products directly and through a variety of third-party distributors and dealers. Changes in the financial or business condition of these distributors and dealers could subject us to losses and affect our ability to bring our products to market and could have a material adverse effect on our business, financial position, liquidity, results of operations and cash flows. Further, our ability to effectively manage inventory levels at distributor locations may be impaired under such arrangements, which could increase expenses associated with excess and obsolete inventory and negatively impact cash flows.
Severe weather, natural disasters and climate change could have an adverse effect on our overall business.
Our plants and other facilities are located in places that could be affected by natural disasters, such as hurricanes, typhoons, cyclones, earthquakes, floods, tornados and others. Natural disasters and widespread adverse climate changes that directly impact our plants or other facilities could materially adversely affect our manufacturing or other operations and, thereby, harm our overall financial position, liquidity, results of operations and cash flows.
In the manufacture of our products, we rely on a continuous and uninterrupted supply of electric power, water and, in some cases, natural gas, as well as the availability of water, waste and emissions discharge facilities. Any future shortages or discharge curtailments of a material nature could significantly disrupt our operations and increase our expenses. We currently do not have backup generators on our sites with the capability of maintaining all of a site’s full operational power needs and we do not have alternate
| | | | | |
| |
James Hardie 2021 Annual Report on Form 20-F | 156 |
| |
sources of power in the event of a sustained blackout. While our insurance includes coverage for certain “business interruption” losses (i.e., lost profits) and for certain “service interruption” losses, such as an accident at our supplier’s facility, any losses in excess of the insurance policy’s coverage limits or any losses not covered by the terms of the insurance policy could have a material adverse effect on our financial condition. If blackouts interrupt our power supply, we would be temporarily unable to continue operations at the affected facilities. Any future material and sustained interruptions in our ability to continue operations at our facilities could damage our reputation, harm our ability to retain existing customers or obtain new customers and could result in lost revenue, any of which could have a material adverse effect on our financial position, liquidity, results of operations and cash flows.
Financial Risks
Warranty claims relating to our products and exceeding our warranty reserves could have a material adverse effect on our business.
We have offered, and continue to offer, various warranties on our products, including offering a prorated 50-year limited warranty until 2009 after which time we offered a non-prorated 30-year limited warranty for certain of our fiber cement siding products in the United States. In total, as of 31 March 2021, we have accrued US$39.6 million for such warranties within “Accrued product warranties” on our consolidated balance sheet and have disclosed the movements in our consolidated warranty reserves in Note 11 to our consolidated financial statements in Section 2. Although we maintain reserves for warranty-related claims and legal proceedings that we believe are adequate, we cannot assure you that warranty expense levels or the results of any warranty-related legal proceedings will not exceed our reserves. If our warranty reserves are significantly exceeded, the costs associated with such warranties could have a material adverse effect on our financial position, liquidity, results of operations and cash flows.
Because we have significant operations outside the United States and report our earnings in US dollars, unfavorable fluctuations in currency values and exchange rates could have a material adverse effect on our business.
Because our reporting currency is the US dollar, our non-US operations face the additional risk of fluctuating currency values and exchange rates. Such operations may also face hard currency shortages and controls on currency exchange. Approximately 33%, 34% and 36% of our net sales in fiscal years 2021, 2020 and 2019, respectively, were from sales outside the United States. Consequently, changes in the value of foreign currencies (principally Australian dollars, New Zealand dollars, Philippine pesos, euros, UK pounds and Canadian dollars) could have a material adverse effect on our business, results of operations and financial condition. We evaluate and consider foreign exchange risk mitigation by entering into contracts that require payment in local currency, hedging transactional risk, where appropriate, and having non-US operations borrow in local currencies. We enter into such financial instruments from time to time to manage our foreign exchange risks. At 31 March 2021 we had foreign currency forward contracts with a notional value of US$302.9 million related to the upcoming dividend payments and US$153.2 million related to the upcoming AICF payments. There can be no assurance that we will be successful in these mitigation strategies, or that fluctuation in foreign currencies and other foreign exchange risks will not have a material adverse effect on our financial position, liquidity, results of operations and cash flows.
Our business is subject to customer concentration risk and the loss of any major customer could materially adversely affect our businesses.
We have one customer who contributed greater than 10% of our net sales in each of the past three fiscal years. We generally do not have long-term contracts with our large customers. Accordingly, if we were to lose one or more of our large customers because our competitors were able to offer customers more
| | | | | |
| |
James Hardie 2021 Annual Report on Form 20-F | 157 |
| |
favorable pricing terms or for any other reason, we may not be able to replace customers in a timely manner or on reasonable terms. The loss of one or more of our large customers could have a material adverse effect on our financial position, liquidity, results of operations and cash flows.
Legal and Regulatory Risks
Our ability to sell our products in certain markets is influenced by building codes and ordinances in effect in the related localities and states and may limit our ability to compete effectively in certain markets and our ability to increase or maintain our current market share for our products.
Most countries, states and localities in the markets in which we sell our products maintain building codes and ordinances that determine the requisite qualities of materials that may be used to construct homes and buildings for which our products are intended. Our products may not qualify under building codes and ordinances in certain markets, prohibiting our customers from using our products in those markets. This may limit our ability to sell our products in certain markets. In addition, ordinances and codes may change over time and any such changes may, from the time they are implemented, prospectively limit or prevent the use of our products in those markets, causing us to lose market share for our products. Although we keep up to date on the current and proposed building codes and ordinances of the markets in which we sell or plan to sell our products and, when appropriate, seek to become involved in the ordinance and code setting process, our efforts may be ineffective, which could have a material adverse effect on our financial condition, liquidity, results of operations and cash flows.
Losses and expenses relating to ongoing New Zealand product liability litigation could have a material adverse effect on our business.
Since 2015, our New Zealand subsidiaries (as well as certain other members of the James Hardie Group) have been and continue to be involved in a number of construction defect and/or product liability claims in New Zealand that relate to weathertightness claims in residential buildings (single and multi-family dwellings) and a number of non-residential buildings, primarily constructed from 1998 to 2004. The claims allege generic defects in certain fiber cement products and systems supplied by our New Zealand subsidiaries and breach of duties including the failure to conduct appropriate testing of these products and systems, failure to warn and misleading and deceptive conduct in relation to the marketing and sale of the products and systems.
We recognize a liability for both asserted and unasserted New Zealand weathertightness claims in the period in which a loss becomes probable and estimable. The amount of a reasonably probable loss is dependent on a number of factors including, without limitation, the specific facts and circumstances unique to each claim (for which we could be subject to joint and several liability), the availability of claimant compensation under a government compensation scheme, the extent of any contributory negligence on the part of the claimants and the extent to which we have access to third-party recoveries to cover a portion of the costs incurred in defending and resolving such actions.
The provision for New Zealand weathertightness claims and any estimated loss incorporates assumptions that are subject to the foregoing uncertainties and are principally derived from, but not exclusively based on, historical claims experience. If our assessment of probable and estimable liability with respect to current asserted claims changes and/or actual liability varies from our estimates, then the actual amount of losses incurred may be materially higher or lower than the Company's estimates. Accordingly, losses incurred in connection with defending and resolving asserted and unasserted New Zealand product liability claims in the future could have a material adverse effect on our financial position, liquidity, results of operations and cash flows.
| | | | | |
| |
James Hardie 2021 Annual Report on Form 20-F | 158 |
| |
In addition, the actual or alleged existence of defects in any of our products could subject us to significant product liability or recall claims, including potential putative class or representative action claims. Although we do not have insurance coverage for damage to, or defects in, our products, we do have (for some time periods) product liability insurance coverage for bodily injury or property damage which may arise from the use of our products. Although we believe this coverage (where available) is generally adequate and we intend to maintain this coverage in the future, we cannot assure you that this coverage remains or will be sufficient to cover all future product liability claims based on the date of loss or that this coverage will be available at reasonable rates in the future. In some jurisdictions, we are subject to joint and several liability. The successful assertion of one or more claims against us, or a co-defendant, that exceed our insurance coverage could require us to incur significant expenses to pay these damages. These additional expenses could have a material adverse effect on our financial position, liquidity, results of operations and cash flows.
For additional information, see Notes 1 and 14 to our consolidated financial statements in Section 2 and Legal Proceedings in Section 3.
We may incur significant costs, including capital expenditures, in complying with applicable environmental and health and safety laws and regulations.
In each jurisdiction in which we operate, we are subject to environmental, health and safety laws and regulations governing our operations, including, among other matters: (i) the air, soil, and water quality of our plants; and (ii) the use, handling, storage, disposal and remediation of certain regulated materials currently or formerly used by us or any of our affiliates. Under these laws and regulations, we may be held jointly and severally responsible for the remediation of certain regulated materials at our or our predecessors’ past or present facilities and at third-party waste disposal sites. We may also be held liable for any claims, penalties or fines arising out of human exposure to certain regulated materials or other environmental damage, including damage to natural resources, and our failure to comply with air, water, waste, and other environmental regulations.
In particular, many of our products contain crystalline silica, which can be released in a respirable form in connection with the manufacturing of our fiber cement products or while cutting our fiber cement products during installation or demolition. The inhalation of respirable crystalline silica at high and prolonged exposure levels is identified as a carcinogen by certain governmental entities and is associated with certain lung diseases, including silicosis, which has been the subject of extensive tort litigation.
Many jurisdictions where we operate, including the United States, Australia and New Zealand, have recently adopted regulations that significantly reduce the occupational exposure limit to respirable crystalline silica, as well as imposing additional training, exposure monitoring and recordkeeping requirements. It is possible that these regulations could have an impact on our business as a result of increased compliance efforts and associated costs, if any, for our manufacturing operations, as well as those of our business partners (e.g., suppliers, home builders, distributors, installers, etc.); and, as such, the rule change may possibly have a material adverse effect on our financial position, liquidity, results of operations, and cash flows.
The costs of complying with environmental and health and safety laws relating to our operations or the liabilities arising from past or future releases of, or exposure to, certain regulated materials, greenhouse gases, or product liability matters, or our failure to comply with air, water, waste, and other then-existing environmental regulations may result in us making future expenditures that could have a material adverse effect on our financial position, liquidity, results of operations and cash flows. Such regulations and laws may increase the cost to procure energy or other products necessary to our operation, thereby increasing our operating costs. In addition, we cannot make any assurances that the laws currently in place that directly or indirectly relate to environmental liability will not change. If, for example, applicable laws or
| | | | | |
| |
James Hardie 2021 Annual Report on Form 20-F | 159 |
| |
judicial interpretations related to successor liability or “piercing the corporate veil” were to change, such changes could have a material adverse effect on our financial position, liquidity, results of operations and cash flows.
Because our intellectual property and other proprietary information may become publicly available, we are subject to the risk that competitors could copy our products or processes.
Our success depends, in part, on the proprietary nature of our technology, including non-patentable intellectual property, such as our process technology. To the extent that a competitor is able to reproduce or otherwise capitalize on our technology, it may be difficult, expensive or impossible for us to obtain adequate legal or equitable relief. Also, the laws of some foreign countries may not protect our intellectual property to the same extent as do the laws of the United States. In addition to patent protection of intellectual property rights, we consider elements of our product designs and processes to be proprietary and confidential and/or trade secrets. To safeguard our confidential information, we rely on employee, consultant and vendor nondisclosure agreements and contractual provisions and a system of internal and technical safeguards to protect our proprietary information. However, any of our registered or unregistered intellectual property rights may be subject to challenge or possibly exploited by others in the industry, which could materially adversely affect our financial position, liquidity, results of operations, cash flows and competitive position.
Cybersecurity risks related to the technology used in our operations, as well as security breaches of company, customer, employee, or vendor information, could result in a major disruption or failure of our information technology systems, which could adversely affect our business and operations.
We rely on information systems to run most aspects of our business, including manufacturing, sales and distribution, raw material procurement, accounting and managing data and records for employees and other parties. Despite the significant investments we have made to maintain our information systems and careful security and controls design, implementation, updating, and internal and independent third-party assessments, our systems and facilities, as well as those of third parties with which we do business, may be vulnerable to security breaches, cyber-attacks, employee theft or misconduct, computer viruses, misplaced or lost data, programming and/or human errors or other similar events. Network, system, and data breaches could result in misappropriation of sensitive data or operational disruptions, including interruption to systems availability and denial of access to and misuse of applications required by our customers to conduct business with us. In addition, misuse of internal applications, theft of intellectual property, trade secrets, or other corporate assets, and inappropriate disclosure of confidential information could stem from such incidents. Theft of personal or other confidential data and sensitive proprietary information could also occur as a result of a breach in cybersecurity, exposing us to costs and liabilities associated with privacy and data security laws in the jurisdictions in which we operate. Furthermore, we face additional cybersecurity risks related to some of our employees continuing to work remotely as a result of the COVID-19 pandemic.
Although we strive to have appropriate security controls in place, prevention of security breaches cannot be assured. Any security breach involving the misappropriation, loss or other unauthorized disclosure of our confidential information, whether by us or by third parties with which we do business, could result in losses, damage to our reputation, risk of litigation, disrupt our operations and have a material adverse effect on our business, results of operations and financial condition. We may be required to expend additional resources to continue to enhance our security measures or to investigate and remediate any security vulnerabilities.
| | | | | |
| |
James Hardie 2021 Annual Report on Form 20-F | 160 |
| |
Privacy and data security concerns and regulation could result in additional costs and liabilities.
As a global organization, we are subject to various regulations regarding privacy, data protection and data security, including those set forth in the European Union’s General Data Protection Regulation (“GDPR”) and the California Consumer Privacy Act ("CCPA"). The GDPR became effective in May 2018 and provides substantial regulation for the handling, processing and transfer of personal data and imposes substantial penalties for non-compliance. The CCPA, which took effect on 1 January 2020, gives California consumers certain rights similar to those provided by the GDPR.
Regulations and initiatives such as the GDPR and CCPA place limitations on how companies can use customer data and impose obligations on companies in their management of such data, which ultimately increases compliance complexity and related costs. Our efforts to comply with GDPR, the CCPA and other privacy and data protection laws may impose significant costs and challenges that are likely to increase over time, and we could incur costs, penalties or litigation related to violation of existing or future data privacy laws and regulations.
Asbestos-Related Risks
Our wholly-owned Australian Performing Subsidiary is required to make payments to a special purpose fund that provides compensation for Australian asbestos-related personal injury and death claims for which certain Former James Hardie Companies are found liable. These payments may affect our ability to grow the Company.
On 21 November 2006, JHI plc, AICF, the NSW Government and the Performing Subsidiary entered into the AFFA to provide long-term funding to AICF, a special purpose fund that provides compensation for Australian asbestos-related personal injury and death claims for which the Former James Hardie Companies are found liable.
We have recorded a gross asbestos liability of US$1,135.8 million in our consolidated financial statements as of 31 March 2021, based on the AFFA governing our anticipated future payments to AICF. The net unfunded AFFA liability, net of tax, was US$$554.1 million at 31 March 2021. The initial funding was made to AICF in February 2007 and annual or quarterly payments are to be made each year, subject to the terms of the AFFA. The amounts of these annual payments are dependent on several factors, including our free cash flow (as defined in the AFFA), actuarial estimations, actual claims paid, operating expenses of AICF and the Annual Cash Flow Cap set forth in the AFFA. From the time AICF was established in February 2007 through the date of this Annual Report, we have contributed A$1,571.0 million to the fund. Our obligation to make future payments to AICF continues to be linked under the terms of the AFFA to our long-term financial success, especially our ability to generate net operating cash flow.
As a result of our obligation to make payments under the AFFA, our funds available for capital expenditures (either with respect to our existing business or new business opportunities), repayments of debt, payments of dividends or other distributions have been, and will be, reduced by the amounts paid to AICF, and consequently, our financial position, liquidity and cash flows have been, and will be, reduced or materially adversely affected. Our obligation to make these payments could also affect or restrict our ability to access equity or debt capital markets.
Potential escalation in proven claims made against, and associated costs of AICF could require an extension of the period of time that the Company is obliged to make annual funding payments of up to 35% of its free cash flow, as defined in the AFFA, beyond the currently anticipated expiration date of that obligation, which may cause us to have to increase our asbestos liability in the future.
| | | | | |
| |
James Hardie 2021 Annual Report on Form 20-F | 161 |
| |
The amount of our asbestos liability is based, in part, on actuarially determined, anticipated (estimated) future annual funding payments to be made to AICF on an undiscounted and uninflated basis. Future annual payments to AICF are based on updated actuarial assessments that are to be performed as of 31 March of each year to determine expected asbestos-related personal injury and death claims to be funded under the AFFA for the financial year in which the payment is made and the next two financial years. Estimates of actuarial liabilities are based on many assumptions, which may not prove to be correct, and which are subject to considerable uncertainty, since the ultimate number and cost of claims are subject to the outcome of events that have not yet occurred, including social, legal and medical developments, as well as future economic conditions.
If future proven claims are more numerous, the liabilities arising from them are larger than that currently estimated by AICF’s actuary, KPMGA, or if AICF investments decline in value, it is possible that pursuant to the terms of the AFFA, we will be required to pay to AICF our current annual funding payments of up to 35% of our free cash flow, as defined in the AFFA and on which our asbestos liability is based, for an extended period of time. If this occurs, we may be required to increase our asbestos liability, which would be reflected as a charge in our consolidated statements of operations and comprehensive income at that date. Any such changes to actuarial estimates which require us to increase our asbestos liability could have a material adverse effect on our financial position, liquidity, results of operations and cash flows.
Even though the AFFA has been implemented, we may be subject to potential additional liabilities (including claims for compensation or property remediation outside the arrangements reflected in the AFFA), because certain current and former companies of the James Hardie Group previously manufactured products that contained asbestos.
Prior to 1987, ABN 60, which is now owned and controlled by AICF, manufactured products in Australia that contained asbestos. In addition, prior to 1987, two former subsidiaries of ABN 60, Amaca and Amaba, which are now also owned and controlled by AICF, manufactured products in Australia that contained asbestos. ABN 60 also held shares in companies that manufactured asbestos-containing products in Indonesia and Malaysia, and held minority shareholdings in companies that conducted asbestos-mining operations based in Canada and Southern Africa. Former ABN 60 subsidiaries also exported asbestos-containing products to various countries. AICF is designed to provide compensation only for certain claims and to meet certain related expenses and liabilities, and legislation in New South Wales, Australia in connection with the AFFA seeks to defer all other claims against the Former James Hardie Companies. The funds contributed to AICF will not be available to meet any asbestos-related claims made outside Australia, or claims made arising from exposure to asbestos occurring outside Australia, or any claim for pure property loss or pure economic loss or remediation of property. In these circumstances, it is possible that persons with such excluded claims may seek to pursue those claims directly against us. Defending any such litigation could be costly and time consuming, and consequently, our financial position, liquidity, results of operations and cash flows could be materially adversely affected.
Prior to 1988, a New Zealand subsidiary in the James Hardie Group manufactured products in New Zealand that contained asbestos. In New Zealand, the majority of asbestos-related disease compensation claims are managed by the state-run Accident Compensation Corporation (“ACC”). Our New Zealand subsidiary that manufactured products that contained asbestos contributed financially to the ACC fund as required by law via payment of an annual levy while it carried on business. All decisions relating to the amount and allocation of payments to such claimants in New Zealand are made by the ACC in accordance with New Zealand law. The Injury Prevention, Rehabilitation and Compensation Act 2001 (NZ) bars compensatory damages for claims that are covered by the legislation which may be made against the ACC fund. However, we may be subject to potential liability if any of these claims are found not to be covered by the legislation and are later brought against us, and consequently, our financial position, liquidity, results of operations and cash flows could be materially adversely affected.
| | | | | |
| |
James Hardie 2021 Annual Report on Form 20-F | 162 |
| |
Because our revenues are primarily from sales in US dollars and the actuarially assessed asbestos liability is denominated in Australian dollars and payments pursuant to the AFFA are made in Australian dollars, we may experience unpredictable volatility in our reported results due to changes in the US dollar (and other currencies from which we derive our sales) compared to the Australian dollar.
Payments pursuant to the AFFA are required to be made to AICF in Australian dollars. In addition, annual payments to AICF include calculations based on various estimates that are denominated in Australian dollars. To the extent that our future obligations exceed Australian dollar cash flows from our Australian operations and we do not hedge this foreign exchange exposure, we will need to convert US dollars or other foreign currency into Australian dollars in order to meet our obligations pursuant to the AFFA.
In addition, because our results of operations are reported in US dollars and the asbestos liability is based on estimated payments denominated in Australian dollars, fluctuations in the AUD/USD exchange rate will cause unpredictable volatility in our reported results. For example, during fiscal years 2021, 2020 and 2019, we recorded an unfavorable adjustment of US$123.0 million, a favorable adjustment of US$69.0 million, a favorable adjustment of US$49.5 million, respectively, due to fluctuations in the US dollar compared to the Australian dollar.
The AFFA imposes certain non-monetary obligations.
Under the AFFA, we are also subject to certain non-monetary obligations that could prove onerous or otherwise materially adversely affect our ability to undertake proposed transactions or pay dividends. For example, the AFFA contains certain restrictions that generally prohibit us from undertaking transactions that would have a material adverse effect on the relative priority of AICF as a creditor, or that would materially impair our legal or financial capacity and that of the Performing Subsidiary, in each case such that we and the Performing Subsidiary would cease to be likely to be able to meet the funding obligations that would have arisen under the AFFA had the relevant transaction not occurred. Those restrictions apply to dividends and other distributions, reorganizations of, or dealings in, share capital which create or vest rights in such capital in third parties, and non-arm’s length transactions. While the AFFA contains certain exemptions from such restrictions (including, for example, exemptions for arm’s-length dealings; transactions in the ordinary course of business; certain issuances of equity securities or bonds; and certain transactions provided certain financial ratios are met and certain amounts of dividends), implementing such restrictions could materially adversely affect our ability to enter into transactions that might otherwise be favorable to us and could materially adversely affect our financial position, liquidity, results of operations and cash flows.
The AFFA does not eliminate the risk of adverse action being taken against us.
There is a possibility that, despite certain covenants agreed to by the NSW Government in the AFFA, adverse action could be directed against us by one or more of the NSW Government, the government of the Commonwealth of Australia, governments of the other states or territories of Australia or any other governments, unions or union representative groups, or asbestos disease groups, with respect to the asbestos liabilities of the Former James Hardie Companies or other current and former companies of the James Hardie Group. Any such adverse action could materially adversely affect our financial position, liquidity, results of operations and cash flows.
| | | | | |
| |
James Hardie 2021 Annual Report on Form 20-F | 163 |
| |
The complexity and long-term nature of the AFFA and related legislation and agreements may result in litigation as to their interpretation.
Certain legislation, the AFFA and related agreements, which govern the implementation and performance of the AFFA, are complex and have been negotiated over the course of extended periods between various parties. There is a risk that, over the term of the AFFA, as has already occurred, some or all parties may become involved in disputes as to the interpretation of such legislation, the AFFA or related agreements or the terms of the AFFA may change. We cannot guarantee that no party will commence litigation seeking remedies with respect to such a dispute, nor can we guarantee that a court will not order other remedies not previously anticipated which may materially adversely affect us.
There is no certainty that the AICF Loan Facility will remain in place for its entire term.
Drawings under the AICF Loan Facility are subject to satisfaction of certain specified conditions precedent and the NSW Government (as lender) has the right to cancel the AICF Loan Facility, require repayment of money advanced and enforce security granted to support the loan in the various circumstances prescribed in the facility agreement and related security documentation. There are also certain positive covenants given by, and restrictions on the activities of, AICF and the Former James Hardie Companies which apply during the term of the loan. A breach of any of these covenants or restrictions may also lead to cancellation of the AICF Loan Facility, early repayment of the loan and/or enforcement of the security. As such, there can be no certainty that the facility will remain in place for its intended term.
If the AICF Loan Facility does not remain in place for its intended term, AICF may experience a short-term funding shortfall. A short-term funding shortfall for AICF could subject us to negative publicity. Such negative publicity could materially adversely affect our financial position, liquidity, results of operations and cash flows, as well as employee morale and the market prices of our publicly traded securities.
We may have insufficient Australian taxable income to utilize tax deductions.
We may not have sufficient Australian taxable income to utilize the tax deductions resulting from the funding payments under the AFFA to AICF. Further, if as a result of making such funding payments we incur tax losses, we may not be able to fully utilize such tax losses in future years of income. Any inability to utilize such deductions or losses could materially adversely affect our financial position, liquidity, results of operations and cash flows.
Certain AFFA tax conditions may not be satisfied.
Despite Australian Taxation Office (“ATO”) rulings for the expected life of the AFFA, it is possible that new (and adverse) tax legislation could be enacted in the future. It is also possible that the facts and circumstances relevant to operation of the ATO rulings could change over the life of the AFFA. We may elect to terminate the AFFA if certain tax conditions are not satisfied for more than 12 months. However, we do not have a right to terminate the AFFA if, among other things, the tax conditions are not satisfied as a result of the actions of a member of the James Hardie Group.
Under certain circumstances, we may still have an obligation to make annual funding payments on an adjusted basis if the tax conditions remain unsatisfied for more than 12 months. If the tax conditions are not satisfied in a manner which does not permit us to terminate the AFFA, our financial position, liquidity, results of operations and cash flows may be materially adversely affected. The extent of this adverse effect will be determined by the nature of the tax condition which is not satisfied.
| | | | | |
| |
James Hardie 2021 Annual Report on Form 20-F | 164 |
| |
Risks Related to Ireland
Irish law contains provisions that could delay or prevent a change of control that may otherwise be beneficial to you.
Irish law contains several provisions that could have the effect of delaying or preventing a change of control of our ownership. The Irish Takeover Rules would generally (subject to certain very limited exceptions) require a mandatory cash offer to be made for our entire issued share capital if, because of an acquisition of a relevant interest (including interests held in the form of shares of our common stock, CUFS or ADSs) in such shares, the voting rights of the shares in which a person (including persons acting in concert with that person) holds relevant interests increase: (i) from below 30% to 30% or more; or (ii) from a starting point that is above 30% and below 50%, by more than 0.05% in a 12-month period. However, this prohibition is subject to exceptions, including acquisitions that result from acceptances under a mandatory takeover bid made in compliance with the Irish Takeover Rules. Although the Irish Takeover Rules may help to ensure that no person acquires voting control of us without making an offer to all shareholders, they may also have the effect of delaying or preventing a change of control that may otherwise be beneficial to you. In addition to the operation of the Irish Takeover Rules, we may, from time to time, put in place appropriate retention arrangements to ensure that we retain our key employees during periods of corporate change.
Our ability to pay dividends and conduct share buy-backs is dependent on Irish law and may be limited in the future if we are not able to maintain sufficient levels of distributable profits.
Under Irish law, in order to pay dividends and/or conduct a buy-back of shares, an Irish company requires sufficient distributable profits which are determined under the Irish Companies Act 2014 and applicable accounting practices generally accepted in Ireland. We believe that our current corporate structure has allowed us to maintain sufficient levels of distributable profits to continue paying dividends in accordance with our publicly disclosed dividend policy, which is updated from time to time, and to conduct share buy-backs. However, transactions or events could cause a reduction in our distributable profits, resulting in our inability to pay dividends on our securities or to conduct share buy-backs, which could have a material adverse effect on the market value of our securities.
Risks Related to Taxation
We are subject to risks related to taxation in multiple jurisdictions.
We operate in multiple jurisdictions and pay tax on our income according to the tax laws of these jurisdictions. Various factors, some of which are beyond our control, determine our effective tax rate. The primary drivers of our effective tax rate are the tax rates of the jurisdictions in which we operate, the level and geographic mix of pre-tax earnings, intra-group royalties, interest rates and the level of debt which gives rise to interest expense on external debt and intra-group debt, and the value of adjustments for timing differences and permanent differences, including the non-deductibility of certain expenses, all of which are subject to change and which could result in a material increase in our effective tax rate. Such changes to our effective tax rate could materially adversely affect our financial position, liquidity, results of operations and cash flows.
Tax laws are dynamic and subject to change as new or revised laws and treaties are passed and new interpretations are issued or applied. Due to the nature of our historic and current operations, we are exposed to potential tax risks in a number of jurisdictions, including, without limitation, Ireland, the United States, Australia, New Zealand, the Netherlands and various parts of Europe. For example, many countries, including Ireland and the Netherlands, have made or are actively considering making changes to existing tax laws and treaties, which could alter or increase our tax obligations, could materially affect
| | | | | |
| |
James Hardie 2021 Annual Report on Form 20-F | 165 |
| |
our business, financial condition or results of operations and could potentially have a material adverse impact on holders of our securities.
Exposure to additional tax liabilities due to audits and reviews could materially adversely affect our business.
Due to our size and the nature of our business, we are subject to ongoing reviews and audits by authorities in taxing jurisdictions on various tax matters, including challenges to various positions we assert on our income tax and withholding tax returns. We accrue for tax contingencies based upon our best estimate of the taxes ultimately expected to be paid, which we update over time as more information becomes available. Such amounts are included in taxes payable or other non-current liabilities, as appropriate.
We record additional tax expense in the period in which we determine that the recorded tax liability is less than the ultimate assessment we expect. The amounts ultimately paid on resolution of reviews by taxing jurisdictions could be materially different from the amounts included in taxes payable or other non-current liabilities and result in additional tax expense which could materially adversely affect our financial position, liquidity, results of operations and cash flows.
Tax benefits are available under the US-Ireland Income Tax Treaty to US and Irish taxpayers that qualify for those benefits. Our eligibility for benefits under the US-Ireland Income Tax Treaty is determined on an annual basis and we could be audited by the Internal Revenue Service (“IRS”) for this issue. If during a subsequent tax audit or related process, the IRS determines that we are not eligible for benefits under the US-Ireland Income Tax Treaty, we may not qualify for treaty benefits. As a result, our effective tax rate could significantly increase and we could be subject to a 30% US withholding tax rate on payments of interest and dividends from our US subsidiaries to our Irish resident subsidiaries.
We believe that interest and dividends paid by our US subsidiaries to our Irish resident subsidiaries qualify for treaty benefits in the form of reduced withholding tax under the US-Ireland Income Tax Treaty.
We believe that, under the limitation on benefits (“LOB”) provision of the US-Ireland Treaty, no US withholding tax applies to interest that our US subsidiaries paid to our Irish resident subsidiaries. The LOB provision has various conditions of eligibility for reduced US withholding tax rates and other treaty benefits, all of which we believe are satisfied. If, however, we do not qualify for benefits under the US-Ireland Income Tax Treaty, those interest payments would be subject to a 30% US withholding tax.
We believe that, under the US-Ireland Income Tax Treaty, a 5% US withholding tax applies to dividends paid by our US subsidiaries to our Irish resident subsidiaries. The LOB provision of the US-Ireland Income Tax Treaty has various conditions of eligibility for reduced US withholding tax rates and other treaty benefits, all of which we believe we have satisfied. If, however, we do not qualify for benefits under the US-Ireland Treaty, dividend payments by our US subsidiaries would be subject to a 30% US withholding rate.
Our eligibility for benefits under the US-Ireland Tax Treaty is determined on an annual basis and we could be audited by the IRS for this issue. If during a subsequent tax audit or related process, the IRS determines that we are not eligible for benefits under the US-Ireland Income Tax Treaty, we may not qualify for treaty benefits. As a result, our effective tax rate could significantly increase beginning in the fiscal year that such determination is made and we could be liable for taxes owing for calendar year 2017 and subsequent periods, which could adversely affect our financial position, liquidity, results of operations and cash flows.
| | | | | |
| |
James Hardie 2021 Annual Report on Form 20-F | 166 |
| |
LEGAL PROCEEDINGS
The Company is involved from time to time in various legal proceedings and administrative actions related to the normal conduct of its business, including general liability claims, putative class and representative action lawsuits and mass plaintiff litigation concerning our products and services. Although it is impossible to predict the outcome of any pending legal proceeding, management believes that such proceedings and actions should not, individually or in the aggregate, have a material adverse effect on the Company’s consolidated financial position, results of operations or cash flows, except as they relate to asbestos, tax contingencies, New Zealand weathertightness claims and the matters described in the sections below. For further details, see “Section 3 – Risk Factors” of this Annual Report.
Tax Contingencies
Due to our size and the nature of our business, we are subject to ongoing reviews by taxing jurisdictions on various tax matters. We accrue for tax contingencies based upon our best estimate of the taxes ultimately expected to be paid, which we update over time as more information becomes available. Such amounts are included in taxes payable or other non-current liabilities, as appropriate. If we ultimately determine that payment of these amounts is unnecessary, we reverse the liability and recognize a tax benefit during the period in which we determine that the liability is no longer necessary. We record additional tax expense in the period in which we determine that the recorded tax liability is less than the ultimate assessment we expect.
We file income tax returns in various jurisdictions, including Ireland, the United States, Germany, the Netherlands, Spain, Australia, New Zealand and the Philippines.
New Zealand Weathertightness Claims
Since fiscal year 2002, the Company’s New Zealand subsidiaries have been joined in a number of weathertightness claims in New Zealand that relate to residential buildings (single dwellings and apartment complexes) and a small number of non-residential buildings, primarily constructed from 1998 to 2004. The claims often involve multiple parties and allege that losses were incurred due to excessive moisture penetration of the buildings’ structures. The claims typically include allegations of poor building design, inadequate certification of plans, inadequate construction review and compliance certification and deficient work by sub-contractors.
Historically, the Company’s New Zealand subsidiaries have been joined to these claims as one of several co-defendants, including local government entities responsible for enforcing building codes and practices, resulting in the Company’s New Zealand subsidiaries becoming liable for only a portion of each claim. In addition, the Company’s New Zealand subsidiaries have had access to third-party recoveries to defray a portion of the costs incurred in resolving such claims.
In 2015, the Company and/or its subsidiaries were named as the sole defendants in four claims on behalf of multiple defendants, three of which are still pending and each of which allege that the New Zealand subsidiaries’ products were inherently defective. The Company believes it has substantial factual and legal defenses to these claims and is defending the claims vigorously.
Cridge, et al. (Case Nos. CIV-2015-485-594 and CIV-2015-485-773), In the High Court of New Zealand, Wellington Registry (hereinafter the “Cridge litigation”). In August 2020, trial of phase one of the Cridge litigation commenced in Wellington, New Zealand solely to determine whether the Company’s New Zealand subsidiaries had a duty to the plaintiffs and breached that duty. This phase of the trial concluded in December 2020, and a decision by the Wellington High Court is expected to be announced late in the first quarter of FY 2022. We believe we have substantial factual and legal defenses to the claims in the
| | | | | |
| |
James Hardie 2021 Annual Report on Form 20-F | 167 |
| |
Cridge litigation. While an unfavorable outcome in this phase is possible as litigation is inherently unpredictable, management does not believe that the outcome of this phase of the litigation will have a material adverse effect on the Company’s financial position. As of 31 March 2021, the Company has not recorded a reserve related to the Cridge litigation as the chance of loss is not probable and the amount of loss, if any, cannot be reasonably estimated. If an adverse decision is reached by the Wellington High Court, certain factors anticipated to be included in the decision may allow the Company to estimate a reasonable range of liability in the Cridge litigation.
White, et al. (Case No. CIV-2015-404-2981 [2021] NZHC 930), In the High Court of New Zealand, Auckland Registry (hereinafter the “White litigation”). The trial of phase one of the White litigation is scheduled to commence on 17 May 2021 in Auckland, New Zealand solely to determine whether the Company’s New Zealand subsidiaries, along with three non-New Zealand Group entities, had a duty to the plaintiffs and breached that duty. As of 31 March 2021, the Company has not recorded a reserve related to the White litigation as the chance of loss is not probable and the amount of loss, if any, cannot be reasonably estimated.
Waitakere, et al. (Case No. CIV-2015-404-3080), In the High Court of New Zealand, Auckland Registry (hereinafter the “Waitakere litigation”). The trial in the Waitakere litigation is currently not scheduled to begin until May 2023 in Auckland, New Zealand. As of 31 March 2021, the Company has not recorded a reserve related to the Waitakere litigation as the chance of loss is not probable and the amount of loss, if any, cannot be reasonably estimated.
A court’s decision in one or more of the litigation matters has the potential to impact the accounting treatment regarding the probability of a potential loss and the Company’s ability to reasonably estimate a reserve with regards to the other litigation matters discussed above. Furthermore, an adverse judgement in one or more of these litigation matters could have a material adverse impact on our consolidated financial position, results of operations or cash flows.
For further information, see Note 14 to our consolidated financial statements in Section 2.
Environmental
Our operations, like those of other companies engaged in similar businesses, are subject to a number of laws and regulations on air, soil and water quality, waste handling and disposal. Our policy is to accrue for environmental costs when it is determined that it is probable that an obligation exists, and the amount can be reasonably estimated.
| | | | | |
| |
James Hardie 2021 Annual Report on Form 20-F | 168 |
| |
CONTROLS AND PROCEDURES
Management’s Annual Report on Internal Control Over Financial Reporting
Evaluation of Disclosure Controls and Procedures
We carried out an evaluation, under the supervision and with the participation of management, including our Chief Executive Officer and Chief Financial Officer, of the effectiveness of the design and operation of our disclosure controls and procedures (as defined in Rule 13a-15(e) under the Exchange Act) as of the end of the period covered by this Annual Report. In designing and evaluating our disclosure controls and procedures, our management recognizes that any controls and procedures, no matter how well designed and operated, can provide only reasonable assurance of achieving the desired control objectives and are subject to certain limitations, including the exercise of judgment by individuals, the difficulty in identifying unlikely future events, and the difficulty in eliminating misconduct completely. Based upon that evaluation, our Chief Executive Officer and Chief Financial Officer have concluded that, our disclosure controls and procedures were effective at a reasonable assurance level as of 31 March 2021, to ensure the information required to be disclosed in the reports that we file or submit under the Exchange Act were recorded, processed, summarized and reported within the time periods specified in the rules and forms of the SEC and that such information was accumulated and communicated to our management, including our Chief Executive Officer and Chief Financial Officer, to allow for timely decisions regarding required disclosures.
Management’s Report on Internal Control over Financial Reporting
Management is responsible for establishing and maintaining adequate internal control over financial reporting as defined in Rule 13a-15(f) of the Exchange Act. Because of its inherent limitations, internal control over financial reporting may not prevent or detect all misstatements. Also, projections of any evaluation of effectiveness to future periods are subject to the risk that controls may become inadequate because of changes in conditions, or that the degree of compliance with the policies or procedures may deteriorate.
We assessed the effectiveness of our internal control over financial reporting as of 31 March 2020. In making this assessment, we used the criteria set forth by the Committee of Sponsoring Organizations of the Treadway Commission in Internal Control – Integrated Framework (2013). Based on our assessment using those criteria, we concluded that our internal control over financial reporting was effective as of 31 March 2021.
The effectiveness of our internal control over financial reporting as of 31 March 2021 has been audited by Ernst & Young LLP, an independent registered public accounting firm, as stated in their report below.
Changes in Internal Control over Financial Reporting
There were no changes in our internal controls over financial reporting that occurred during the period covered by this Annual Report that have materially affected, or are reasonably likely to materially affect, our internal control over financial reporting.
| | | | | |
| |
James Hardie 2021 Annual Report on Form 20-F | 169 |
| |
Report of Independent Registered Public Accounting Firm
To the Shareholders and the Board of Directors of James Hardie Industries plc
Opinion on Internal Control Over Financial Reporting
We have audited James Hardie Industries plc’s internal control over financial reporting as of 31 March 2021, based on criteria established in Internal Control-Integrated Framework issued by the Committee of Sponsoring Organizations of the Treadway Commission (2013 framework) (the COSO criteria). In our opinion, James Hardie Industries plc (the Company) maintained, in all material respects, effective internal control over financial reporting as of 31 March 2021, based on the COSO criteria.
We also have audited, in accordance with the standards of the Public Company Accounting Oversight Board (United States) (PCAOB), the consolidated balance sheets of the Company as of 31 March 2021 and 2020, the related consolidated statements of operations and comprehensive income, changes in shareholders’ equity (deficit) and cash flows for each of the three years in the period ended 31 March 2021, and the related notes and our report dated 18 May 2021 expressed an unqualified opinion thereon.
Basis for Opinion
The Company’s management is responsible for maintaining effective internal control over financial reporting and for its assessment of the effectiveness of internal control over financial reporting included in the accompanying Management’s Report on Internal Control over Financial Reporting. Our responsibility is to express an opinion on the Company’s internal control over financial reporting based on our audit. We are a public accounting firm registered with the PCAOB and are required to be independent with respect to the Company in accordance with the U.S. federal securities laws and the applicable rules and regulations of the Securities and Exchange Commission and the PCAOB.
We conducted our audit in accordance with the standards of the PCAOB. Those standards require that we plan and perform the audit to obtain reasonable assurance about whether effective internal control over financial reporting was maintained in all material respects.
Our audit included obtaining an understanding of internal control over financial reporting, assessing the risk that a material weakness exists, testing and evaluating the design and operating effectiveness of internal control based on the assessed risk, and performing such other procedures as we considered necessary in the circumstances. We believe that our audit provides a reasonable basis for our opinion.
Definition and Limitations of Internal Control Over Financial Reporting
A company’s internal control over financial reporting is a process designed to provide reasonable assurance regarding the reliability of financial reporting and the preparation of financial statements for external purposes in accordance with generally accepted accounting principles. A company’s internal control over financial reporting includes those policies and procedures that (1) pertain to the maintenance of records that, in reasonable detail, accurately and fairly reflect the transactions and dispositions of the assets of the company; (2) provide reasonable assurance that transactions are recorded as necessary to permit preparation of financial statements in accordance with generally accepted accounting principles, and that receipts and expenditures of the company are being made only in accordance with authorizations of management and directors of the company; and (3) provide reasonable assurance regarding prevention or timely detection of unauthorized acquisition, use, or disposition of the company’s assets that could have a material effect on the financial statements.
Because of its inherent limitations, internal control over financial reporting may not prevent or detect misstatements. Also, projections of any evaluation of effectiveness to future periods are subject to the risk that controls may become inadequate because of changes in conditions, or that the degree of compliance with the policies or procedures may deteriorate.
/s/ Ernst & Young LLP
Irvine, California
18 May 2021
| | | | | |
| |
James Hardie 2021 Annual Report on Form 20-F | 170 |
| |
EMPLOYEES
During each of the last three fiscal years, we employed the following average number of people:
| | | | | | | | | | | | | | | | | |
| | Fiscal Years Ended 31 March |
| | 2021 | | 2020 | | 2019 |
| Fiber Cement United States and Canada | 2,662 | | | 2,563 | | | 2,592 | |
Europe Building Products1 | 937 | | | 972 | | | 994 | |
| Fiber Cement Australia | 580 | | | 597 | | | 603 | |
Fiber Cement New Zealand2 | 116 | | | 180 | | | 186 | |
| Fiber Cement Philippines | 348 | | | 340 | | | 304 | |
| Other Businesses – United States | — | | | — | | | 19 | |
| Research & Development, including Technology | 155 | | | 156 | | | 159 | |
| General Corporate | 63 | | | 61 | | | 59 | |
| Total Employees | 4,861 | | | 4,869 | | | 4,916 | |
____________
1On 3 April 2018, we completed the Fermacell acquisition. As such, the total number of employees for the fiscal year ended 31 March 2019 for Europe Building Products represent the actual number of people employed for the fiscal year ended 31 March 2019 and not the average number of people employed.
2In fiscal year 2021, based on our strategic decision to move to a regional model for the manufacture and supply of fiber cement products for the New Zealand market, we ceased all manufacturing of products in New Zealand and shifted manufacturing from New Zealand to Australia.
As of the end of 31 March 2021, of the 4,861 average number of people employed, approximately 680 employees have their employment conditions determined by collective agreements negotiated with labor unions (approximately 596 and 84 employees in Europe and Australia, respectively). Under European law, employees that are part of a collective agreement are not required to inform their employer if they are a member of a labor union. In Australia, it is a matter of individual choice whether an employee in a collective agreement is a member of a union. As such, it is possible that some of our employees covered by collective agreements in Europe and Australia may not be members of a union. In accordance with Australian law, we do not keep records of union membership. Our management believes that we have a satisfactory relationship with these unions and there are currently no ongoing labor disputes. We currently have no employees who are members of a union in the United States.
LISTING DETAILS
Trading Markets
As a company incorporated under the laws of Ireland, we have listed our securities for trading on the ASX, through the Clearing House Electronic Subregister System (“CHESS”), via CHESS Units of Foreign Securities (“CUFS”). CUFS are a form of depositary security that represent a beneficial ownership interest in the securities of a non-Australian corporation. Each of our CUFS represents the beneficial ownership of one share of common stock of JHI plc, the legal ownership of which is held by CHESS Depositary Nominees Pty Ltd ("CDN"). The CUFS are listed and traded on the ASX under the symbol “JHX.”
We have also listed our securities for trading on the NYSE. We sponsor an ADS program, whereby beneficial ownership of CUFS is represented by ADS. These ADSs trade on the NYSE in the form of ADRs, under the symbol “JHX.” Deutsche Bank Trust Company Americas (“Deutsche Bank“) has acted as the depository for our ADS program. Unless the context indicates otherwise, when we refer to ADSs,
| | | | | |
| |
James Hardie 2021 Annual Report on Form 20-F | 171 |
| |
we are referring to ADRs or ADSs and when we refer to our common stock we are referring to the shares of our common stock that are represented by CUFS.
We cannot predict the prices at which our shares and ADSs will trade or the volume of trading for such securities, nor can we assure you that these securities will continue to meet the applicable listing requirements of these exchanges.
Trading on the Australian Securities Exchange
The ASX is headquartered in Sydney, Australia, with branches located in each Australian state capital. Our CUFS trade on the ASX under the symbol “JHX.” The ASX is a publicly listed company with trading being undertaken by brokers licensed under the Australian Corporations Act. Trading principally takes place between the hours of 10:00 a.m. and 4:00 p.m. Australian Eastern Standard Time on each weekday (excluding Australian public holidays). Settlement of trades in uncertificated securities listed on the ASX is generally effected electronically. This is undertaken through CHESS, which is the clearing and settlement system operated by the ASX.
Trading on the New York Stock Exchange
In the United States, our ADSs trade on the NYSE under the symbol “JHX.” Trading principally takes place between the hours of 9:30 a.m. and 4:00 p.m. Eastern Time on each weekday (excluding US public holidays). All inquiries and correspondence regarding ADSs should be directed to Deutsche Bank, 60 Wall Street, New York, New York 10005, United States. To speak directly to a Deutsche Bank representative, please call 1-212-250-9100. You may also send an e-mail inquiry to adr@db.com or visit the Deutsche Bank website at https:\\www.adr.db.com.
Fees and Charges Payable by Holders of our ADSs
The following is a summary of the fee provisions of our deposit agreement with Deutsche Bank. For more complete information regarding our ADS program, investors are directed to read the entire amended deposit agreement, a copy of which has been filed as Exhibit 2.1 and 2.2 to this Annual Report.
| | | | | |
| Service | Fees |
| Issuance of ADSs, including issuances resulting from a distribution of shares or rights or other property | Up to US$0.05 per ADS issued |
| Cancellation of ADSs | Up to US$0.05 per ADS issued |
| Distribution of cash dividends or other cash distributions | Up to US$0.05 per ADS issued |
| Operational and maintenance costs | An annual fee of US $0.05 per ADS held on the applicable record date established by the depositary |
Additionally, under the terms of our deposit agreement, Deutsche Bank is entitled to charge each registered holder the following:
•taxes and other governmental charges;
•registration fees as may from time to time be in effect for the registration of transfers of CUFS generally on the CHESS;
•expenses for cable, telex and fax transmissions and delivery services;
•expenses incurred for converting foreign currency into US dollars;
•fees and expenses incurred in connection with compliance with exchange control regulations and other regulatory requirements applicable to CUFS, deposited securities, ADSs and ADRs; and
•fees and expenses incurred in connection with the delivery or servicing of CUFS on deposit.
| | | | | |
| |
James Hardie 2021 Annual Report on Form 20-F | 172 |
| |
If any tax or other governmental charge becomes payable with respect to any security on deposit, such tax or other governmental charge is payable by the ADS holder to Deutsche Bank. Deutsche Bank may refuse to affect any transfer or withdrawal of a deposited security until such payment is made. Deutsche Bank may withhold any dividends or other distributions or may sell for the account of the ADS holder any part or all of the deposited securities, and may apply such dividends, other distributions, or proceeds of any such sale in payment of such tax or other governmental charge and the ADS holder will remain liable for any deficiency.
Generally, Deutsche Bank collects its fees for delivery and surrender of ADSs directly from investors depositing shares or surrendering ADSs for the purpose of withdrawal or from intermediaries acting for them. Additionally, Deutsche Bank collects fees for making distributions to investors by deducting those fees from the amounts distributed or by selling a portion of distributable property to pay the fees. Deutsche Bank may collect its annual fee for depositary services by deductions from cash distributions or by directly billing investors or by charging the book-entry system of accounts of participants acting for them. Deutsche Bank may generally refuse to provide fee-attracting services until its fees for those services are paid.
As part of its service as depositary, Deutsche Bank has agreed: (i) to arrange for the local custody of the underlying shares and absorb the costs of servicing the same; (ii) to make certain annual reimbursements to us based on a percentage of net revenues collected for ADS issuance and cancellation fees, net of custody costs, which we will use toward investor relations expenses and other expenses related to the maintenance of the ADS program (we received US$35,458 in reimbursements of this type in fiscal year 2021); (iii) to waive the cost associated with administrative and reporting services under the ADS program, such costs being valued at US$60,000 per year; and (iv) to waive the access charges to www.adr.db.com, such costs being valued at US$10,000 per year.
| | | | | |
| |
James Hardie 2021 Annual Report on Form 20-F | 173 |
| |
CONSTITUTION
Our corporate domicile is in Ireland and our registered office is located at Europa House, 2nd Floor, Harcourt Centre, Harcourt Street, Dublin 2, D02 WR20, Ireland. We are registered at the Companies Registration Office of the Department of Jobs, Enterprise and Innovation in Dublin, Ireland under number 485719. Copies of our Memorandum of Association and our Articles of Association are filed as Exhibits 1.1 and 1.2 to this Annual Report. A description of each class of securities registered under Section 12 of the Securities Exchange Act of 1934 is included in Exhibit 2.19 to this Annual Report and is incorporated herein by reference.
MATERIAL CONTRACTS
Other than the contracts that are described elsewhere in this Annual Report, including, without limitation, the AFFA and related agreements, our Revolving Credit Facility, the indentures governing our senior unsecured notes, the deposit agreement governing our ADS program, our executive compensation and equity incentive plans and certain material employment contracts described in “Section 1 – Remuneration Report” and any material contracts that have been entered into in the ordinary course of business, the Company does not have any material contracts otherwise requiring disclosure in this Annual Report.
EXCHANGE CONTROLS
The European Commission has imposed financial sanctions on a number of countries throughout the world that are suspected of being involved in activities such as terrorism or repression of its citizens. Ireland has given effect to these sanctions through the implementation of regulations and statutory instruments. We do not have any subsidiaries located in countries with imposed financial sanctions by the European Commission. In addition, we do not conduct business or other revenue-generating activities in these countries.
Except for restrictions contained in the regulations or statutory instruments referred to above, there are no legislative or other legal provisions currently in force in Ireland or arising under our Constitution restricting the import or export of capital, including the availability of cash and cash equivalents for use by JHI plc and its wholly owned subsidiaries, or remittances to our security holders not resident in Ireland. In addition, except for restrictions contained in the regulations or statutory instruments referred to above, cash dividends payable in US dollars on our common stock may be officially transferred from Ireland and converted into any other convertible currency.
There are no limitations, either by Irish law or in our Constitution, on the right of non-residents of Ireland to hold or vote our common stock.
TAXATION
The following summarizes the material US and Irish tax consequences of an investment in shares of our common stock. This summary does not address every aspect of taxation relevant to a particular investor subject to special treatment under any applicable law and is not intended to apply in all respects to all categories of investors. In addition, except for the matters discussed under “Irish Taxation”, this summary does not consider the effect of other foreign tax laws or any state, local or other tax laws that may apply to an investment in shares of our common stock. This summary assumes that we will conduct our business in the manner described in this Annual Report. Changes in our organizational structure or the manner in which we conduct our business may invalidate all or parts of this summary. The laws on which this summary is based could change, perhaps with retroactive effect, and any law changes could
| | | | | |
| |
James Hardie 2021 Annual Report on Form 20-F | 174 |
| |
invalidate all or parts of this summary. We will not update this summary for any law changes after the date of this Annual Report.
This discussion does not bind either the US or Irish tax authorities or the courts of those jurisdictions. Except where outlined below, we have not sought a ruling nor will we seek a ruling of the US or Irish tax authorities about matters in this summary. We cannot assure you that those tax authorities will concur with the views in this summary concerning the tax consequences of the purchase, ownership or disposition of our common stock or that any reviewing judicial body in the United States or Ireland would likewise concur.
Prospective investors should consult their tax advisors regarding the particular tax consequences of acquiring, owning and disposing of shares of our common stock, including the effect of any foreign, state or local taxes.
United States Taxation
The following is a summary of the material US federal income tax consequences generally applicable to “US Shareholders” (as defined below) who beneficially own shares of our common stock and hold the shares as capital assets. For purposes of this summary, a “US Shareholder” means a beneficial owner of our common stock that is: (1) an individual who is a citizen or resident of the United States (as defined for US federal income tax purposes); (2) a corporation or other entity created or organized in or under the law of the United States or any of its political subdivisions; (3) an estate whose income is subject to US federal income taxation regardless of its source; or (4) a trust if (i) a court in the United States can exercise primary supervision over the administration of the trust, and one or more United States persons can control all of the substantial decisions of the trust, or (ii) the trust has in effect a valid election to be treated as a United States person for US federal income tax purposes. If a partnership (including for this purpose any entity treated as a partnership for US federal tax purposes) is a beneficial owner of a share of our common stock, the US federal tax treatment of a partner in the partnership generally will depend on the status of the partner and the activities of the partnership. A holder of our common stock that is a partnership and partners in that partnership should consult their own tax advisers regarding the US federal income tax consequences of holding and disposing of those shares.
This summary does not comprehensively describe all possible tax issues that could influence a current or prospective US Shareholder’s decision to buy or sell shares of our common stock. In particular, this summary does not discuss: (1) the tax treatment of special classes of US Shareholders, like financial institutions, life insurance companies, tax exempt organizations, tax-qualified employer plans and other tax-qualified or qualified accounts, investors liable for the alternative minimum tax, dealers in securities, shareholders who hold shares of our common stock as part of a hedge, straddle or other risk reduction arrangement, or shareholders whose functional currency is not the US dollar; (2) the tax treatment of US Shareholders who own (directly or indirectly by attribution through certain related parties) 10% or more of our voting stock; and (3) the application of other US federal taxes, like the US federal estate tax. The summary is based on the Internal Revenue Code (the “Code”), applicable US Department of Treasury regulations, judicial decisions and administrative rulings and practice, all as of the date of this Annual Report.
Treatment of ADSs
For US federal income tax purposes, a holder of an ADS is considered the owner of the shares of stock represented by the ADS. Accordingly, except as otherwise noted, references in this summary to ownership of shares of our common stock includes ownership of the shares of our common stock underlying the corresponding ADSs.
| | | | | |
| |
James Hardie 2021 Annual Report on Form 20-F | 175 |
| |
Taxation of Distributions
Subject to the passive foreign investment company rules discussed below, the tax treatment of a distribution on shares of our common stock held by a US Shareholder depends on whether the distribution is from our current or accumulated earnings and profits (as determined under US federal income tax principles). To the extent a distribution is from our current or accumulated earnings and profits, a US Shareholder will include the amount of the distribution in gross income as a dividend. To the extent a distribution exceeds our current and accumulated earnings and profits, a US Shareholder will treat the excess first as a non-taxable return of capital to the extent of the US Shareholder’s tax basis in those shares and thereafter as capital gain. See the discussion of “Capital Gain Rates” below. Notwithstanding the foregoing described treatment, we do not intend to maintain calculations of our current and accumulated earnings and profits. Dividends received on shares of our common stock will not qualify for the inter-corporate dividends received deduction.
Distributions to US Shareholders that are treated as “qualified dividend income” are generally subject to a maximum rate of 20%. “Qualified dividend income” includes dividends received from a “qualified foreign corporation.” A “qualified foreign corporation” includes (1) a foreign corporation that is eligible for the benefits of a comprehensive income tax treaty with the United States that contains an exchange of information program and (2) a foreign corporation that pays dividends with respect to shares of its stock that are readily tradable on an established securities market in the United States. We believe that we are, and will continue to be, a “qualified foreign corporation” and that dividends we pay with respect to our shares will qualify as “qualified dividend income.” To be eligible for the 20% tax rate, a US Shareholder must hold our shares un-hedged for a minimum holding period (generally, 61 days during the 121-day period beginning on the date that is 60 days before the ex-dividend date of the distribution). Although we believe we presently are, and will continue to be, a “qualified foreign corporation,” we cannot guarantee that we will so qualify. For example, we will not constitute a “qualified foreign corporation” if we are classified as a “passive foreign investment company” (discussed below) in either the taxable year of the distribution or the preceding taxable year. In addition, the net investment income (including dividend income) of certain taxpayers are subject to an additional 3.8% tax rate.
Distributions to US Shareholders that are treated as dividends are generally considered income from sources outside the United States and, for purposes of computing the limitations on foreign tax credits that apply separately to specific categories of income, foreign source “passive category” income or, in the case of certain holders, “general category” income. In addition, special rules will apply to determine a US Shareholder’s foreign tax credit limitation if a dividend distributed with respect to our shares constitutes “qualified dividend income” (as described above). See the discussion of “Credit of Foreign Taxes Withheld” below.
The amount of any distribution we make on shares of our common stock in foreign currency generally will equal the fair market value in US dollars of that foreign currency on the date a US Shareholder receives it. A US Shareholder will have a tax basis in the foreign currency equal to its US dollar value on the date of receipt and will recognize ordinary US source gain or loss when it sells or exchanges the foreign currency. US Shareholders who are individuals will not recognize gain upon selling or exchanging foreign currency if the gain does not exceed US$200 in a taxable year and the sale or exchange constitutes a “personal transaction” under the Code. The amount of any distribution we make with respect to shares of our common stock in property other than money will equal the fair market value of that property on the date of distribution.
| | | | | |
| |
James Hardie 2021 Annual Report on Form 20-F | 176 |
| |
Credit of Foreign Taxes Withheld
Under certain conditions, including a requirement to hold shares of our common stock un-hedged for a certain period, and subject to limitations, a US Shareholder may claim a credit against the US Shareholder’s federal income tax liability for the foreign tax owed and withheld or paid with respect to distributions on our shares. Alternatively, a US Shareholder may deduct the amount of withheld foreign taxes, but only for a year for which the US Shareholder elects to deduct all foreign income taxes. Complex rules determine how and when the foreign tax credit applies, and US Shareholders should consult their tax advisers to determine whether and to what extent they may claim foreign tax credits.
Sale or Other Disposition of Shares
Subject to the passive foreign investment company rules discussed below, a US Shareholder will recognize capital gain or loss on the sale or other taxable disposition of shares of our common stock, equal to the difference between the US Shareholder’s adjusted tax basis in the shares sold or disposed of and the amount realized on the sale or disposition. Individual US Shareholders may benefit from lower marginal tax rates on capital gains recognized on shares sold, depending on the US Shareholder’s holding period for the shares. See the discussion of “Capital Gain Rates” below. Capital losses that do not offset capital gains are subject to limitations on deductibility. The gain or loss from the sale or other disposition of shares of our common stock generally will be treated as income from sources within the United States for foreign tax credit purposes, unless the US Shareholder is a US citizen residing outside the United States and certain other conditions are met.
Capital Gain Rates
Long-term capital gains of certain US individual Shareholders are subject to a maximum rate of 20%. In addition, the “net investment income” (including long and short-term capital gain income) of certain taxpayers is subject to an additional tax of 3.8%.
Passive Foreign Investment Company (“PFIC”) Status
Special US federal income tax rules apply to US Shareholders owning capital stock of a PFIC. A foreign corporation will be a PFIC for any taxable year in which 75% or more of its gross income is passive income or in which 50% or more of the average value of its assets is “passive assets” (generally assets that generate passive income or assets held for the production of passive income). For these purposes, passive income excludes certain interest, dividends or royalties from related parties. If we were a PFIC, each US Shareholder would likely face increased tax liabilities upon the sale or other disposition of shares of our common stock or upon receipt of “excess distributions,” unless the US Shareholder elects (1) to be taxed currently on its pro rata portion of our income, regardless of whether the income was distributed in the form of dividends or otherwise (provided we furnish certain information to our shareholders), or (2) to mark its shares to market by accounting for any difference between the shares’ fair market value and adjusted basis at the end of the taxable year by either an inclusion in income or a deduction from income (provided our ADSs, CUFS or common shares satisfy a test for being regularly traded on a qualified exchange or other market). Because of the manner in which we operate our business, we are not, nor do we expect to become, a PFIC.
Controlled Foreign Corporation Status
If more than 50% of either the voting power of all classes of our voting stock or the total value of our stock is owned, directly or indirectly, by citizens or residents of the United States, United States domestic partnerships and corporations or estates or trusts other than foreign estates or trusts, each of which owns 10% or more of the total combined voting power of all classes of our stock entitled to vote, which we refer
| | | | | |
| |
James Hardie 2021 Annual Report on Form 20-F | 177 |
| |
to as “10-Percent Shareholders,” we could be treated as a Controlled Foreign Corporation (“CFC”), under the Code. This classification would, among other consequences, require 10-Percent Shareholders to include in their gross income their pro rata shares of our “Subpart F income” (as specifically defined by the Code) and our earnings invested in US property (as specifically defined by the Code).
In addition, gain from the sale or exchange of our common shares by a United States person who is or was a 10-Percent Shareholder at any time during the five-year period ending with the sale or exchange is treated as dividend income to the extent of the earnings and profits attributable to the stock sold or exchanged. Under certain circumstances, a corporate shareholder that directly owns 10% or more of our voting shares may be entitled to an indirect foreign tax credit for income taxes we paid in connection with amounts so characterized as dividends under the Code.
US Federal Income Tax Provisions Applicable to Non-United States Holders
A Non-US Holder means a beneficial owner of our common stock that is (1) a non-resident alien of the United States for US federal income tax purposes; (2) a corporation created or organized in or under the law of a country, or any of its political subdivisions, other than the United States; or (3) an estate or trust that is not a US Shareholder. A Non-US Shareholder generally will not be subject to US federal income taxes, including US withholding taxes, on any dividends paid on our shares or on any gain realized on a sale, exchange or other disposition of the shares unless the dividends or gain is effectively connected with the conduct by the Non-US Shareholder of trade or business in the United States (and is attributable to a permanent establishment or fixed base the Non-US Shareholder maintains in the United States if an applicable income tax treaty so requires as a condition for the Non-US Shareholder to be subject to US taxation on a net income basis on income related to the common stock). A corporate Non-US Shareholder under certain circumstances may also be subject to an additional “branch profits tax” on that type of income, the rate of which may be reduced pursuant to an applicable income tax treaty. In addition, gain recognized on a sale, exchange or other disposition of our shares by a Non-US Shareholder who is an individual generally will be subject to US federal income taxes if the Non-US Shareholder is present in the United States for 183 days or more in the taxable year in which the sale, exchange or other disposition occurs and certain other conditions are met.
US Information Reporting and Backup Withholding
Dividend payments on shares of our common stock and proceeds from the sale, exchange or redemption of shares of our common stock may be subject to information reporting to the Internal Revenue Service and possible US backup withholding at a current rate of 24%. Backup withholding will not apply to a shareholder who furnishes a correct taxpayer identification number or certificate of foreign status and makes any other required certification or who is otherwise exempt from backup withholding. United States persons who are required to establish their exempt status generally must provide that certification on a properly completed Internal Revenue Service Form W-9 (Request for Taxpayer Identification Number and Certification). Non-US Shareholders generally will not be subject to US information reporting or backup withholding. However, Non-US Shareholders may be required to provide certification of non-US status in connection with payments received in the United States or through certain US related financial intermediaries.
Backup withholding is not an additional tax. Amounts withheld as backup withholding may be credited against a shareholder’s US federal income tax liability, and a shareholder may obtain a refund of any excess amounts withheld under the backup withholding rules by filing the appropriate claim for refund with the Internal Revenue Service and furnishing any required information.
| | | | | |
| |
James Hardie 2021 Annual Report on Form 20-F | 178 |
| |
Irish Taxation
The following is a summary of the material Irish tax consequences generally applicable to shareholders who invest in shares of our common stock, who are neither tax resident, nor ordinarily resident in, Ireland. This summary does not contain a detailed description of all of the Irish tax consequences for all shareholders, which depend on that shareholder’s particular circumstances, and should not be a substitute for advice from an appropriate professional adviser in relation to all of the possible tax issues that could influence a prospective shareholder’s decision to acquire shares of our common stock. This summary is based on Irish tax legislation, relevant Irish case law, other Irish Revenue guidance and published opinions and administrative pronouncements of the Irish tax authorities, income tax treaties to which Ireland is a party, and such other authorities as we have considered relevant, all as in effect and available as at the date of this Annual Report, any of which may change possibly with retroactive effect.
Treatment of ADSs
In general, for Irish tax purposes, an owner of depositary receipts is considered the owner of the shares of stock represented by depositary receipts. Accordingly, except as otherwise noted, references in this Annual Report to ownership of shares of our common stock includes ownership of the shares underlying the corresponding ADSs.
Irish Dividend Withholding Tax
Distributions made by us to non-Irish resident shareholders will, subject to certain exceptions, be subject to Irish dividend withholding tax at a standard rate of income tax (which, from 1 January 2020 is 25% and prior to this was 20%) unless you are a shareholder who falls within one of the categories of exempt shareholders referred to below. Where dividend withholding tax applies, we will be responsible for withholding the dividend withholding tax at source. For dividend withholding tax purposes, a dividend includes any distribution made by us to our shareholders, including cash dividends, non-cash dividends and additional shares taken in lieu of a cash dividend.
Dividend withholding tax is not payable where an exemption applies provided that we have received all necessary documentation required by the relevant legislation from our shareholders prior to payment of the dividend.
Certain of our non-Irish tax resident shareholders (both individual and corporate) are entitled to an exemption from dividend withholding tax. In particular, a non-Irish tax resident shareholder is not subject to dividend withholding tax on dividends received from us where the shareholder is:
•an individual shareholder resident for tax purposes in either a member state of the EU (apart from Ireland) or in a country with which Ireland has a double tax treaty, and the individual is neither resident nor ordinarily resident in Ireland;
•a corporate shareholder not resident for tax purposes in Ireland nor ultimately controlled, directly or indirectly, by persons so resident and which is resident for tax purposes in either a member state of the EU (apart from Ireland) or a country with which Ireland has a double tax treaty;
•a corporate shareholder that is not resident for tax purposes in Ireland and which is ultimately controlled, directly or indirectly, by persons resident in either a member state of the EU (apart from Ireland) or in a country with which Ireland has a double tax treaty;
•a corporate shareholder that is not resident for tax purposes in Ireland and whose principal class of shares (or those of its 75% parent) is substantially and regularly traded on a recognized stock exchange in either a member state of the EU (including Ireland where the Company trades only on the Irish stock exchange) or in a country with which Ireland has a double tax treaty or on an exchange approved by the Irish Minister for Finance; or
| | | | | |
| |
James Hardie 2021 Annual Report on Form 20-F | 179 |
| |
•a corporate shareholder that is not resident for tax purposes in Ireland and is wholly-owned, directly or indirectly, by two or more companies the principal class of shares of each of which is substantially and regularly traded on a recognized stock exchange in either a member state of the EU (including Ireland where the Company trades only on the Irish stock exchange) or in a country with which Ireland has a double tax treaty or on an exchange approved by the Irish Minister for Finance; and
•provided that, in all cases noted above, the shareholder has made the appropriate non-resident declaration to us prior to payment of the dividend.
Where the shareholder is not the beneficial owner, we will be required to withhold Irish dividend withholding tax at an income tax rate of 25% unless the shareholder is a qualifying intermediary under Irish law and that shareholder has received all necessary documentation required by the relevant legislation, as described above, from the beneficial owner prior to payment of the dividend.
Where our shareholders hold ADSs, they may not be required to submit an appropriate declaration in order to receive dividends without deduction of Irish dividend withholding tax provided their registered address is in the US.
Shareholders must complete and send to us a non-resident declaration form in order to avoid Irish dividend withholding tax. If the appropriate declaration is not made, these shareholders will be liable for Irish dividend withholding tax of 25% on dividends paid by us and may not be entitled to offset this tax. In this case, it will be necessary for shareholders to apply for a refund of the withholding tax directly from the Irish Revenue authorities.
Shareholders that do not fulfill the documentation requirements or otherwise do not qualify for one of the withholding tax exemptions outlined above may be able to claim treaty benefits under a double taxation convention. In this regard, where a double taxation convention is in effect between Ireland and the country of residence of a non-resident shareholder, depending on the terms of that double taxation convention, such a non-resident shareholder may be eligible for a full or partial exemption resulting in a lower dividend withholding tax rate than 25%.
For example, under the US-Ireland Treaty, certain US corporate shareholders owning directly at least 10% of our voting power, are eligible for a reduction in withholding tax to 5% with respect to dividends that we pay, unless the shares of common stock held by such residents form part of the business property of a business carried on through a permanent establishment in Ireland. The same exception applies if the beneficial owner of the shares, being a citizen or resident of the United States, performs independent personal services from a fixed base situated in Ireland and the holding of the shares of common stock in respect of which the dividends are paid pertains to such fixed base in Ireland. A shareholder of our common stock, other than an individual, will be ineligible for the benefits of the US-Irish Treaty unless the shareholder satisfies certain tests under the LOB provisions of Article 23 of the US-Ireland Treaty. To prevent so-called dividend stripping, Irish law generally denies the treaty benefit of a reduced dividend withholding tax rate for any dividend paid to a recipient who is not the “beneficial owner” of the dividend.
| | | | | |
| |
James Hardie 2021 Annual Report on Form 20-F | 180 |
| |
Irish Taxes on Income and Capital Gains
Shareholders who are neither tax resident of, nor ordinarily resident in, Ireland should not be subject to any Irish taxes in respect of dividends distributed by us (other than the dividend withholding tax described above) or capital gains realized on the disposition of shares of our common stock unless such shares are used, held or acquired for the purposes of a trade carried on in Ireland through a branch or an agency. An individual who is temporarily a non-resident of Ireland at the time of the disposal may, under anti-avoidance legislation, still be liable to Irish taxation on any chargeable gains realized (subject to the availability of exemptions).
Capital Acquisitions Tax
Irish capital acquisitions tax (“CAT”) applies to gifts and inheritances. Subject to certain tax-free thresholds (which are determined by the relationship between the donor and successor or donee), gifts and inheritances are liable to tax at the rate of 33%. Gifts and inheritances passing between spouses are exempt from CAT.
Where a gift or inheritance is taken under a disposition made on or after 1 December 1999, it will be within the charge of CAT:
•to the extent that the property of which the gift or inheritance consists is situated in Ireland at the date of the gift or inheritance;
•where the person making the gift or inheritance is or was resident or ordinarily resident in Ireland at the date of the disposition under which the gift or inheritance is taken; or
•where the person receiving the gift or inheritance is resident or ordinarily resident in Ireland at the date of the gift or inheritance.
Please note that the charge to CAT in respect of appointments from a discretionary trust can be different and as a result, specific advice should be taken in this regard.
A non-Irish domiciled individual will not be regarded as resident or ordinarily resident in Ireland for CAT purposes on a particular date unless they are resident or ordinarily resident in Ireland on that date and have been resident in Ireland for the five consecutive tax years immediately preceding the year of assessment in which the date falls.
A gift or inheritance of our common stock will be within the charge of CAT, notwithstanding that the person from whom or by whom the gift or inheritance is received is domiciled or resident outside Ireland.
The Estate Tax Convention between Ireland and the United States generally provides for CAT paid on inheritances in Ireland to be credited against US federal estate tax payable in the United States and for tax paid in the United States to be credited against tax payable in Ireland, based on priority rules set forth in the Estate Tax Convention. The Estate Tax Convention does not apply to CAT paid on gifts. Irish domestic legislation also provides for a general relief from double taxation in respect of gifts and inheritances.
Irish Stamp Duty
Any electronic transfers of shares through the CHESS or the ADR system will not be regarded as transfers of interests in securities and will not be brought within the charge to Irish stamp duty. If a shareholder undertakes an off-market transaction involving a transfer of the underlying shares, this will be subject to Irish stamp duty at a rate of 1% of market value or consideration paid, whichever is greater and will not be able to be registered until duly stamped. An off-market transfer of CUFS will also, where evidenced in writing, be subject to the 1% Irish stamp duty. In addition, a conversion of shares into CUFS
| | | | | |
| |
James Hardie 2021 Annual Report on Form 20-F | 181 |
| |
or ADSs or a conversion of CUFS or ADSs into underlying shares will be liable to 1% Irish stamp duty where the conversion is on a sale or in contemplation of a sale. In each case, payment of this stamp duty will be the responsibility of the person receiving the transfer.
Documents Available for Review
We are subject to the reporting requirements of the Exchange Act applicable to “foreign private issuers” and in accordance therewith file reports, including annual reports, and other information with the SEC. Such reports and other information have been filed electronically with the SEC since 4 November 2002. The SEC maintains a site on the Internet, at www.sec.gov, which contains reports and other information regarding issuers that file electronically with the SEC. In addition, such reports may be obtained, upon written request, from our company secretary at our corporate headquarters in Ireland or our Investor Relations department in Australia. Such reports and other information filed with the SEC prior to November 2002 may be inspected and copied at prescribed rates at the public reference facilities maintained by the SEC at 100 F Street N.E., Washington, D.C. 20549, or obtained by written request to our company secretary. Although, as a foreign private issuer, we are exempt from the rules under the Exchange Act prescribing the furnishing and content of proxy statements and annual reports to shareholders and the quarterly reporting requirements of the Exchange Act, we:
•furnish our shareholders with annual reports containing consolidated financial statements examined by an independent registered public accounting firm; and
•furnish quarterly reports for the first three quarters of each fiscal year containing unaudited consolidated financial information in filings with the SEC under Form 6-K.
| | | | | |
| |
James Hardie 2021 Annual Report on Form 20-F | 182 |
| |
QUANTITATIVE AND QUALITATIVE DISCLOSURES ABOUT MARKET RISK
Cash and cash equivalents include amounts on deposit in banks and cash invested temporarily in various highly liquid financial instruments with original maturities of three months or less when acquired.
We have operations in foreign countries and, as a result, are exposed to foreign currency exchange rate risk inherent in purchases, sales, assets and liabilities denominated in currencies other than the US dollar. We also are exposed to interest rate risk associated with our long-term debt, foreign exchange risk relative to our AFFA liability and our Euro denominated long-term debt and commodity price risk relative to changes in prices of commodities we use in production.
Periodically, interest rate swaps, commodity swaps and forward exchange contracts are used to manage market risks and reduce exposure resulting from fluctuations in interest rates, commodity prices and foreign currency exchange rates. Our policy is to enter into derivative instruments solely to mitigate risks in our business and not for trading or speculative purposes. There can be no assurance that we will be successful in these mitigation strategies or that fluctuation in interest rates, commodity prices and foreign currency exchange rates will not have a material adverse effect on our financial position, liquidity, results of operations and cash flows.
Foreign Currency Exchange Rate Risk
We have significant operations outside of the United States and, as a result, are exposed to changes in exchange rates which affect our financial position, results of operations and cash flow. In addition, payments to AICF are required to be made in Australian dollars which, because the majority of our revenues are produced in US dollars, exposes us to risks associated with fluctuations in the US dollar/Australian dollar exchange rate. See “Section 3 – Risk Factors” of this Annual Report.
For our fiscal year ended 31 March 2021, the following currencies comprised the following percentages of our net sales, expenses and liabilities:
| | | | | | | | | | | | | | | | | | | | | | | | | | | | | | | | |
| | US$ | | A$ | | Euros | | NZ$ | | Other1 |
| Net sales | | 66.5 | % | | 11.1 | % | | 14.1 | % | | 2.8 | % | | 5.5 | % |
Expenses2 | | 61.0 | % | | 15.7 | % | | 15.4 | % | | 3.4 | % | | 4.5 | % |
Liabilities (excluding borrowings)2 | | 32.2 | % | | 55.6 | % | | 9.2 | % | | 2.3 | % | | 0.7 | % |
For our fiscal year ended 31 March 2020, the following currencies comprised the following percentages of our net sales, expenses and liabilities:
| | | | | | | | | | | | | | | | | | | | | | | | | | | | | | | | |
| | US$ | | A$ | | Euros | | NZ$ | | Other1 |
| Net sales | | 66.4 | % | | 11.1 | % | | 14.2 | % | | 2.8 | % | | 5.5 | % |
Expenses2 | | 63.4 | % | | 12.6 | % | | 16.3 | % | | 3.1 | % | | 4.6 | % |
Liabilities (excluding borrowings)2 | | 21.0 | % | | 64.2 | % | | 12.0 | % | | 2.0 | % | | 0.8 | % |
____________
1Comprised of Philippine pesos and Canadian dollars.
2Liabilities include A$ denominated asbestos liability, which was initially recorded in the fourth quarter of fiscal year 2006. Expenses include cost of goods sold, SG&A expenses, R&D expenses and adjustments to the asbestos liability. See “Section 3 – Risk Factors,” and Note 12 to our consolidated financial statements further information regarding the asbestos liability.
| | | | | |
| |
James Hardie 2021 Annual Report on Form 20-F | 183 |
| |
We purchase raw materials and fixed assets and sell some finished product for amounts denominated in currencies other than the functional currency of the business in which the related transaction is generated. Further, in order to protect against foreign exchange rate movements, we may enter into forward exchange contracts timed to mature when settlement of the underlying transaction is due to occur. For further information, see Note 13 to our consolidated financial statements in Section 2.
Funding Under the AFFA
The Australian dollar to US dollar assets and liabilities rate moved from 0.6177 as of 31 March 2020 to 0.7601 as of 31 March 2021, a 23% movement, resulting in a US$123.0 million unfavorable impact on our fiscal year 2021 net income. Assuming that our unfunded net AFFA liability in Australian dollars remains unchanged at A$729.0 million and that we do not hedge this foreign exchange exposure, a 10% movement in the Australian dollar to US dollar exchange rate (at the 31 March 2021 exchange rate of 0.7601) would have approximately a US$55.4 million favorable or unfavorable impact on our net income.
For fiscal year 2020, assuming that our unfunded net AFFA liability in Australian dollars remains unchanged at A$881.4 million and that we do not hedge this foreign exchange exposure, a 10% movement in the Australian dollar to US dollar exchange rate (at the 31 March 2020 exchange rate of 0.6177) would have approximately a US$54.4 million favorable or unfavorable impact on our net income.
Interest Rate Risk
We have market risk from changes in interest rates, primarily related to our revolving credit facility. As of 31 March 2021 and 2020, our revolving credit facility was subject to variable interest rates. The interest rate is calculated two business days prior to the commencement of each draw-down period based on the London Interbank Offered Rate (“LIBOR”) plus the bank margin and is payable at the end of each draw-down period or interest period in the case of a continuation of a loan. If interest rates increase, our debt service obligations on such variable rate indebtedness would increase even though the amount borrowed remained the same, and our net income and cash flows, including cash available for servicing our indebtedness, would correspondingly decrease. Assuming all loans were fully drawn, each one percentage point change in interest rates would result in a US$5.1 million change in annual cash interest expense under the revolving credit facility.
From time to time, we may enter into interest rate swap contracts in an effort to mitigate interest rate risk. These contracts were entered into to protect against upward movements in LIBOR and the associated interest the Company pays on its external debt. For further information, see Note 13 to our consolidated financial statements in Section 2.
At 31 March 2021 and 31 March 2020, we had nil and US$130.0 million outstanding under our revolving credit facility exposing us to market risk due to changes in the rate at which interest accrues.
| | | | | |
| |
James Hardie 2021 Annual Report on Form 20-F | 184 |
| |
Commodity Price Risk
We are exposed to changes in prices of commodities used in our operations, primarily associated with energy, fuel and raw materials such as pulp and cement. While we expect to continue operating in tight markets for these commodities, we do enter into various sourcing arrangements in an effort to minimize additional working capital requirements caused by rising prices. These arrangements provide discounts on the prices of such commodities in relation to market prices and indices, however, if such commodity prices do not continue to rise, these fixed pricing arrangements may negatively impact our cost of sales over the longer-term.
We have assessed the market risk of our core commodities (pulp, cement and silica) and believe that, a +/- 10% change in the average cost of these materials for the year ended 31 March 2021 would have resulted in +/- US$32.8 million or 1.8% impact on our cost of sales for fiscal year 2021.
For fiscal year 2020, we have assessed the market risk of our core commodities (pulp, cement and silica) and believe that, a +/- 10% change in the average cost of these materials for the year ended 31 March 2020 would have resulted in +/- US$31.8 million or 1.9% impact on our cost of sales for fiscal year 2020.
| | | | | |
| |
James Hardie 2021 Annual Report on Form 20-F | 185 |
| |
SECTION 4
SHARE/CHESS UNITS OF FOREIGN SECURITIES INFORMATION
As of 30 April 2021, JHI plc had 444,288,874 CUFS issued over ordinary shares listed on the ASX and held by CHESS Depositary Nominees Pty Ltd (“CDN”) on behalf of 27,534 CUFS holders. Each CUFS represents the beneficial ownership of one ordinary share and carries the right to one vote. Each CUFS holder can direct CDN on how to vote the ordinary shares on a one vote per CUFS basis. RSUs issued by the Company carry no voting rights.
At 30 April 2021, to our knowledge, we are not directly or indirectly owned or controlled by another corporation, by a foreign government or by any other natural or legal persons severally or jointly, and we are not aware of any arrangements the operation of which may at a subsequent date result in a change in control of the Company.
Geographic Distribution of Beneficial Ownership of James Hardie Industries plc
The following table shows the geographic distribution of the beneficial holders of our CUFS at 31 March 2021 and 2020:
| | | | | | | | | | | | | | |
| Geographic Region | | 31 March
2021 | | 31 March
2020 |
| Australia | | 60.32 | % | | 61.38 | % |
| United States | | 15.93 | % | | 14.65 | % |
| United Kingdom | | 3.65 | % | | 4.50 | % |
| Europe (excluding the United Kingdom) | | 6.26 | % | | 6.27 | % |
| Asia | | 4.49 | % | | 5.08 | % |
| Other | | 9.35 | % | | 8.12 | % |
As of 30 April 2021, 0.29% of the outstanding shares of our common stock was held by 80 CUFS holders with registered addresses in the United States. In addition, as of 30 April 2021, 1.22% of the outstanding shares of our common stock was represented by ADSs held by 8 holders, all of whom have registered addresses in the United States, except 2 holders having registered addresses in Germany and the United Kingdom. A total of 1.51% of our outstanding capital stock was registered to 86 US holders as of 30 April 2021.
Distribution Schedule of James Hardie Industries plc
The following table shows a distribution of the holders of our CUFS at 30 April 2021:
| | | | | | | | | | | | | | | | | | | | | | | | | | | | | |
| Size of Holding Range | | CUFS | | Options |
| Holders | | Holdings | Total % | | Holders | | Holdings |
| 1-1,000 | | 20,271 | | | 6,630,331 | | 1.49 | | | - | | - |
| 1,001-5,000 | | 6,052 | | | 12,770,759 | | 2.87 | | | - | | - |
| 5,001-10,000 | | 723 | | | 5,151,774 | | 1.16 | | | - | | - |
| 10,001-100,000 | | 432 | | | 9,782,187 | | 2.20 | | | - | | - |
| 100,001 and over | | 56 | | | 409,953,823 | | 92.28 | | | - | | - |
| Totals | | 27,534 | | | 444,288,874 | | 100.00 | | | - | | - |
Based on the closing price of A$42.90 on 30 April 2021, there were 274 CUFS holders that held less than a marketable parcel of shares.
| | | | | |
| |
James Hardie 2021 Annual Report on Form 20-F | 186 |
| |
Substantial CUFS holders of James Hardie Industries plc
As at 30 April 2021, the Company had received notification of the following interests in its share capital, which were equal to, or in excess of, 3%:
| | | | | | | | | | | | | | | | | | | | | | | |
| CUFS holder | | Shares
Beneficially
Owned | | Percentage
of Shares
Outstanding | | Date became substantial shareholder | |
| AustralianSuper Pty Ltd | | 31,173,374 | | | 7.02 | % | | 2 September 2019 | |
| Blackrock, Inc | | 26,109,637 | | | 5.88 | % | | 16 October 2014 | |
| The Vanguard Group, Inc. | | 25,402,152 | | | 5.72 | % | | 17 August 2018 | |
| Bennelong Funds Management Group Pty Ltd | | 25,018,691 | | | 5.63 | % | | 16 December 2020 | |
| OppenheimerFunds, Inc. | | 23,564,091 | | | 5.30 | % | | 30 June 2016 | |
| Commonwealth Bank of America | | 22,894,697 | | | 5.15 | % | | 15 August 2014 | |
| Pinnacle Investment Management Group Limited | | 22,274,919 | | | 5.01 | % | | 14 April 2021 | |
| Challenger Limited | | 18,918,753 | | | 4.26 | % | | 23 May 2018 | |
| Mitsubishi UFJ Financial Group, Inc. | | 17,451,381 | | | 3.93 | % | | 2 August 2019 | |
| Schroders plc | | 14,529,189 | | | 3.27 | % | | 1 June 2015 | |
James Hardie Industries plc 20 largest CUFS holders and their holdings as of 30 April 2021
| | | | | | | | | | | | | | | | | | | | |
| Name | | CUFS Holdings | | Percentage | | Rank |
| HSBC Custody Nominees (Australia) Limited | | 155,689,528 | | | 35.04 | % | | 1 | |
| J P Morgan Nominees Australia Pty Limited | | 104,425,642 | | | 23.50 | % | | 2 | |
| Citicorp Nominees Pty Limited | | 52,951,959 | | | 11.92 | % | | 3 | |
| National Nominees Limited | | 26,360,328 | | | 5.93 | % | | 4 | |
| BNP Paribas Nominees Pty Ltd | | 19,612,718 | | | 4.41 | % | | 5 | |
| Citicorp Nominees Pty Limited | | 11,212,924 | | | 2.52 | % | | 6 | |
| BNP Paribas Noms Pty Ltd | | 9,125,151 | | | 2.05 | % | | 7 | |
| Australian Foundation Investment Company Limited | | 4,400,000 | | | 0.99 | % | | 8 | |
| HSBC Custody Nominees (Australia) Limited | | 3,064,669 | | | 0.69 | % | | 9 | |
| HSBC Custody Nominees (Australia) Limited | | 2,800,599 | | | 0.63 | % | | 10 | |
| BNP Paribas Nominees Pty Ltd | | 2,662,685 | | | 0.60 | % | | 11 | |
| BNP Paribas Nominees Pty Ltd | | 1,633,212 | | | 0.37 | % | | 12 | |
| Netwealth Investments Limited | | 1,119,321 | | | 0.25 | % | | 13 | |
| Argo Investments Limited | | 946,000 | | | 0.21 | % | | 14 | |
| HSBC Custody Nominees (Australia) Limited | | 871,579 | | | 0.20 | % | | 15 | |
| HSBC Custody Nominees (Australia) Limited | | 825,509 | | | 0.19 | % | | 16 | |
| BNP Paribas Noms (NZ) Ltd | | 754,054 | | | 0.17 | % | | 17 | |
| Mutual Trust Pty Ltd | | 681,576 | | | 0.15 | % | | 18 | |
| Millenium Pty Ltd | | 630,000 | | | 0.14 | % | | 19 | |
| Carlton Hotel Limited | | 625,362 | | | 0.14 | % | | 20 | |
| TOTAL | | 400,392,816 | | | 90.12 | % | | |
| | | | | |
| |
James Hardie 2021 Annual Report on Form 20-F | 187 |
| |
GLOSSARY OF ABBREVIATIONS AND DEFINITIONS
Abbreviations
| | | | | | | | |
| 2001 Plan | | 2001 Equity Incentive Plan |
| ADR | | American Depositary Receipt |
| ADS | | American Depositary Share |
| AFFA | | Amended and Restated Final Funding Agreement, as amended from time to time |
| AGM | | Annual General Meeting |
| AICF | | Asbestos Injuries Compensation Fund |
| ASC | | Accounting Standards Codification |
| ASIC | | Australian Securities and Investments Commission |
| ASU | | Accounting Standards Update |
| ASX | | Australian Securities Exchange |
| ATO | | Australian Taxation Office |
| CARES Act | | US Coronavirus Aid, Relief, and Economic Security Act |
| CCPA | | California Consumer Privacy Act |
| CDN | | CHESS Depositary Nominees Pty Ltd |
| CEO | | Chief Executive Officer |
| CFO | | Chief Financial Officer |
| CHESS | | Clearing House Electronic Subregister System |
| CHRO | | Chief Human Resources Officer |
| CP Plan | | Company Performance Plan |
| CUFS | | CHESS Units of Foreign Securities |
| EPS | | Earnings Per Share |
| ESG | | Environmental, Social and Governance |
| FASB | | Financial Accounting Standards Board |
| GDPR | | General Data Protection Regulation |
| IP Plan | | Individual Performance Plan |
| IRS | | Internal Revenue Service |
| KPMGA | | KPMG Actuarial |
| LIBOR | | London Interbank Offered Rate |
| LOB | | Limitation on Benefits |
| LTI | | Long-Term Incentive |
| LTIP | | Long-Term Incentive Plan 2006 |
| NOLs | | US net operating losses |
| NSW | | New South Wales |
| NYSE | | New York Stock Exchange |
| OSB | | Oriented Strand Board |
| PDG | | Primary Demand Growth |
| R&D | | Research and Development |
| ROCE | | Return on Capital Employed |
| | | | | |
| |
James Hardie 2021 Annual Report on Form 20-F | 188 |
| |
| | | | | | | | |
| RSU | | Restricted Stock Unit |
| SEC | | United States Securities and Exchange Commission |
SG&A | | Selling, General and Administrative |
STI | | Short-Term Incentive |
| TSR | | Total Shareholder Return |
Definitions
This Annual Report contains financial measures that are considered to be non-US GAAP, but are consistent with those used by Australian companies. Because the Company prepares its consolidated financial statements in accordance with US GAAP, the following cross-references each US GAAP financial measure as used in the Company’s consolidated financial statements to the equivalent non-US GAAP financial measure listed.EBIT - Earnings before interest and tax is equivalent to the US GAAP financial statement line item Operating income (loss).
EBIT margin - EBIT margin is defined as EBIT as a percentage of net sales. EBIT margin is equivalent to the US GAAP terminology Operating income (loss) margin.
EBITDA - Earnings before interest, tax, depreciation and amortization is equivalent to the US GAAP financial statement line item Operating income (loss), plus depreciation and amortization expenses.
EBITDA margin - EBITDA margin is defined as EBITDA as a percentage of net sales.
Other Financial Measures
mmsf – million square feet, where a square foot is defined as a standard square foot of 5/16” thickness
msf – thousand square feet, where a square foot is defined as a standard square foot of 5/16” thickness
| | | | | |
| |
James Hardie 2021 Annual Report on Form 20-F | 189 |
| |
Non-GAAP Financial Information Derived from GAAP Measures
This Annual Report includes certain financial information to supplement the Company’s consolidated financial statements which are prepared in accordance with accounting principles generally accepted in the United States (“US GAAP”). These financial measures are designed to provide investors with an alternative method for assessing our performance from on-going operations, capital efficiency and profit generation. Management uses these financial measures for the same purposes. These financial measures include:
•Adjusted operating income;
•Adjusted net income;
•Adjusted diluted earnings per share;
•Adjusted Return on Capital Employed ("ROCE");
•North America Fiber Cement Segment Adjusted operating income;
•Asia Pacific Fiber Cement Segment Adjusted operating income;
•Europe Building Products Segment Adjusted operating income;
•North America Fiber Cement Segment Adjusted operating income margin;
•Asia Pacific Fiber Cement Segment Adjusted operating income margin;
•Europe Building Products Segment Adjusted operating income margin;
•North America Fiber Cement Segment Adjusted EBITDA margin;
•Asia Pacific Fiber Cement Segment Adjusted EBITDA margin; and
•Europe Building Products Segment Adjusted EBITDA margin.
These financial measures are or may be non-US GAAP financial measures as defined in the rules of the U.S. Securities and Exchange Commission and may exclude or include amounts that are included or excluded, as applicable, in the calculation of the most directly comparable financial measures calculated in accordance with US GAAP. These financial measures are not meant to be considered in isolation or as a substitute for comparable US GAAP financial measures and should be read only in conjunction with the
Company’s consolidated financial statements prepared in accordance with US GAAP. In evaluating these
financial measures, investors should note that other companies reporting or describing similarly titled financial measures may calculate them differently and investors should exercise caution in comparing the Company’s financial measures to similar titled measures by other companies.
Adjusted operating income
| | | | | | | | | | | | | | | | | | | | | | | |
| | | | | |
| (Millions of US dollars) | FY21 | FY20 | FY19 | FY18 | FY17 | FY16 | FY15 |
| Operating income | $ | 472.8 | | $ | 342.5 | | $ | 351.6 | | $ | 229.2 | | $ | 393.2 | | $ | 354.0 | | $ | 335.0 | |
| Excluding: | | | | | | | |
| Asbestos: | | | | | | | |
| Asbestos adjustments | 143.9 | | 58.2 | | 22.0 | | 156.4 | | (40.4) | | (5.5) | | (33.4) | |
| AICF SG&A expenses | 1.2 | | 1.7 | | 1.5 | | 1.9 | | 1.5 | | 1.7 | | 2.5 | |
| Restructuring and product line discontinuation expenses | 11.1 | | 84.4 | | 29.5 | | — | | — | | — | | — | |
| Fermacell acquisition costs | — | | — | | — | | 10.0 | | — | | — | | — | |
| New Zealand weathertightness claims | — | | — | | — | | — | | — | | 0.5 | | (4.3) | |
| Non-recurring stamp duty | — | | — | | — | | — | | — | | — | | 4.2 | |
| Adjusted operating income | $ | 629.0 | | $ | 486.8 | | $ | 404.6 | | $ | 397.5 | | $ | 354.3 | | $ | 350.7 | | $ | 304.0 | |
| | | | | | | |
| | | | | |
| |
James Hardie 2021 Annual Report on Form 20-F | 190 |
| |
Adjusted net income
| | | | | | | | | | | | | | | | | | | | | | | |
| | | | | |
| (Millions of US dollars) | FY21 | FY20 | FY19 | FY18 | FY17 | FY16 | FY15 |
| Net income | $ | 262.8 | | $ | 241.5 | | $ | 228.8 | | $ | 146.1 | | $ | 276.5 | | $ | 244.4 | | $ | 291.3 | |
| Excluding: | | | | | | | |
| Asbestos: | | | | | | | |
| Asbestos adjustments | 143.9 | | 58.2 | | 22.0 | | 156.4 | | (40.4) | | (5.5) | | (33.4) | |
| AICF SG&A expenses | 1.2 | | 1.7 | | 1.5 | | 1.9 | | 1.5 | | 1.7 | | 2.5 | |
| AICF interest income, net | (0.5) | | (1.4) | | (2.0) | | (1.9) | | 1.1 | | 0.3 | | (1.4) | |
| Restructuring and product line discontinuation expenses | 11.1 | | 84.4 | | 29.5 | | — | | — | | — | | — | |
| Fermacell acquisition costs | — | | — | | — | | 10.0 | | — | | — | | — | |
| New Zealand weathertightness claims | — | | — | | — | | — | | — | | 0.5 | | (4.3) | |
| Loss on early debt extinguishment | — | | — | | 1.0 | | 26.1 | | — | | — | | — | |
| Non-recurring stamp duty | — | | — | | — | | — | | — | | — | | 4.2 | |
Tax adjustments1 | 39.5 | | (31.6) | | 19.7 | | (47.3) | | 9.9 | | 1.5 | | (37.5) | |
| Adjusted net income | $ | 458.0 | | $ | 352.8 | | $ | 300.5 | | $ | 291.3 | | $ | 248.6 | | $ | 242.9 | | $ | 221.4 | |
| | | | | | | |
| | | | | | | |
| | | | | | | |
| | | | | | | |
| | | | | | | |
1.Includes tax adjustments related to the amortization benefit of certain US intangible assets, asbestos, and other tax adjustments |
Adjusted diluted earnings per share
| | | | | | | | | | | | | | | | | | | | | | | |
| | | | | |
| FY21 | FY20 | FY19 | FY18 | FY17 | FY16 | FY15 |
| Adjusted net income (millions of US dollars) | $ | 458.0 | | $ | 352.8 | | $ | 300.5 | | $ | 291.3 | | $ | 248.6 | | $ | 242.9 | | $ | 221.4 | |
| Weighted average common shares outstanding - Diluted (millions) | 445.4 | 444.1 | 443.0 | 442.3 | 443.9 | 447.2 | 446.4 |
| Adjusted diluted earnings per share (US dollars) | 1.03 | 0.79 | 0.68 | 0.66 | 0.56 | 0.54 | 0.50 |
| | | | | | | |
| | | | | | | |
| | | | | | | |
| | | | | | | |
| | | | | |
| |
James Hardie 2021 Annual Report on Form 20-F | 191 |
| |
Adjusted Return on Capital Employed ("Adjusted ROCE")
| | | | | | | | | | | | | | | | | | | | | | | |
| | | | | |
| (Millions of US dollars) | FY21 | FY20 | FY19 | FY18 | FY17 | FY16 | FY15 |
| Numerator | | | | | | | |
| Adjusted operating income | $ | 629.0 | | $ | 486.8 | | $ | 404.6 | | $ | 397.5 | | $ | 354.3 | | $ | 350.7 | | $ | 304.0 | |
Adjustments to operating income1 | — | | — | | (7.3) | | — | | — | | — | | — | |
| Adjusted operating income for ROCE | 629.0 | | 486.8 | | 397.3 | | 397.5 | | 354.3 | | 350.7 | | 304.0 | |
| Denominator | | | | | | | |
| Gross capital employed (GCE) | 1,780.8 | | 1,753.7 | | 1,492.7 | | 1,272.0 | | 1,107.6 | | 1,102.7 | | 1,042.1 | |
Adjustments to GCE2 | (193.6) | | (195.5) | | (77.4) | | (24.3) | | 50.3 | | 40.5 | | 20.0 | |
| Adjusted gross capital employed | $ | 1,587.2 | | $ | 1,558.2 | | $ | 1,415.3 | | $ | 1,247.7 | | $ | 1,157.9 | | $ | 1,143.2 | | $ | 1,062.1 | |
| Adjusted ROCE | 39.6% | 31.2% | 28.1% | 31.9% | 30.6% | 30.7% | 28.6% |
| | | | | | | |
1Adjustments as calculated according to ROCE stock compensation plan documents 2Calculated as Total Assets minus Current Liabilities as reported in our financial results; adjusted by (i) excluding balance sheet items related to legacy issues (such as asbestos adjustments) dividends payables and deferred taxes; (ii) adding back asset impairment charges in the relevant period, unless otherwise determined by the renumeration committee; (iii) adding back leasehold assets for manufacturing facilities and other material leased assets (FY15-FY19) and (iv) deducting all greenfield construction-in-progress, and any brownfield construction-in-progress projects involving capacity expansion that are individually greater than US$20 million, until such assets reach commercial production and are transferred to the fixed asset register |
| | | | | | | |
North America Fiber Cement Segment Adjusted operating income
| | | | | | | | | | | | | | | | | |
| | | |
| (Millions of US dollars) | FY21 | FY20 | FY19 | FY18 | FY17 |
| Operating income | $ | 585.5 | | $ | 429.3 | | $ | 382.5 | | $ | 381.9 | | $ | 343.9 | |
| Excluding: | | | | | |
| Restructuring and product line discontinuation expenses | 2.5 | | 41.2 | | 5.4 | | — | | — | |
| North America Fiber Cement Segment Adjusted operating income | $ | 588.0 | | $ | 470.5 | | $ | 387.9 | | $ | 381.9 | | $ | 343.9 | |
| North America Fiber Cement segment net sales | 2,040.2 | | 1,816.4 | | 1,676.9 | | 1,578.1 | | 1,493.4 | |
| North America Fiber Cement Segment Adjusted operating income margin | 28.8% | 25.9% | 23.1% | 24.2% | 23.0% |
| | | | | |
Asia Pacific Fiber Cement Segment Adjusted operating income
| | | | | | | | | | | | | | | | | |
| | | |
| (Millions of Australian dollars) | FY21 | FY20 | FY19 | FY18 | FY17 |
| Operating income | A$ | 172.4 | | A$ | 80.8 | | A$ | 136.5 | | A$ | 139.8 | | A$ | 125.0 | |
| Excluding: | | | | | |
| Restructuring expenses | 4.9 | | 58.3 | | — | | — | | — | |
| Asia Pacific Fiber Cement Segment Adjusted operating income | A$ | 177.3 | | A$ | 139.1 | | A$ | 136.5 | | A$ | 139.8 | | A$ | 125.0 | |
| Asia Pacific Fiber Cement segment net sales | 635.2 | | 614.1 | | 612.2 | | 549.7 | | 493.5 | |
| Asia Pacific Fiber Cement Segment Adjusted operating income margin | 28.0% | 22.7% | 22.3% | 25.4% | 25.3% |
| | | | | |
| | | | | |
| |
James Hardie 2021 Annual Report on Form 20-F | 192 |
| |
Europe Building Products Segment Adjusted operating income
| | | | | | | | | | | |
| | |
| (Millions of Euros) | FY21 | FY20 | FY19 |
| Operating income | € | 31.4 | | € | 10.0 | | € | 9.1 | |
| Excluding: | | | |
| Restructuring expenses | 4.5 | | 4.9 | | — | |
| Europe Building Products Segment Adjusted operating income | € | 35.9 | | € | 14.9 | | € | 9.1 | |
| Europe Building Products segment net sales | 350.6 | | 334.2 | | 318.0 | |
| Europe Building Products Segment Adjusted operating income margin | 10.4% | 4.5% | 2.7% |
| | | |
FY21 Segment Adjusted EBITDA margins
| | | | | | | | | | | |
| | |
| (In Millions) | North America Fiber Cement | Asia Pacific Fiber Cement | Europe Building Products |
| Operating income | $ | 585.5 | | A$ | 172.4 | | € | 31.4 | |
| Excluding: | | | |
| Restructuring expenses | 2.5 | | 4.9 | | 4.5 | |
| Depreciation and amortization | 89.1 | | 19.1 | | 23.9 | |
| Segment Adjusted EBITDA | $ | 677.1 | | A$ | 196.4 | | € | 59.8 | |
| Segment net sales | 2,040.2 | | 635.2 | | 350.6 | |
| Segment Adjusted EBITDA margin | 33.2% | 30.9% | 17.1% |
| | | |
| | | | | |
| |
James Hardie 2021 Annual Report on Form 20-F | 193 |
| |
EXHIBIT LIST
| | | | | | | | |
Exhibit
Number | | Exhibit Description |
| | Memorandum of Association of James Hardie Industries plc, as amended |
| | Articles of Association of James Hardie Industries plc |
| | Amended and Restated Deposit Agreement, by and among James Hardie Industries plc, Deutsche Bank Trust Company Americas, as depositary, and the holders and beneficial owners of American depositary shares evidenced by American depositary receipts issued thereunder (filed as Exhibit 99.A to the Company’s Registration Statement on Form F-6 filed on 25 September 2014 (Commission File Number 333-198928) and incorporated by reference herein)
|
| | Form of Amendment No. 1 to Amended and Restated Deposit Agreement (filed as Exhibit 99(A)(2) to the Company’s Post-Effective Amendment No. 1 to Form F-6 filed on 03 September 2015 (Commission File Number 333-198928) and incorporated by reference herein)
|
| | Guarantee Trust Deed, dated 19 December 2006, by and between James Hardie Industries N.V. and AET Structured Finance Services Pty Limited (filed as Exhibit 4.12 to the Company’s Post-Effective No. 1 to Form F-4 filed on 17 June 2010 (Commission File Number 333-165531) and incorporated by reference herein)
|
| | Performing Subsidiary Undertaking and Guarantee Trust Deed, dated 19 December 2006, by and between James Hardie 117 Pty Limited and AET Structured Finance Services Pty Limited (filed as Exhibit 4.14 to the Company’s Post-Effective No. 1 to Form F-4 filed on 17 June 2010 (Commission File Number 333-165531) and incorporated by reference herein)
|
| | Intercreditor Deed, dated 19 December 2006, by and among The State of New South Wales, James Hardie Industries N.V., Asbestos Injuries Compensation Fund Limited and AET Structured Finance Services Pty Limited (filed as Exhibit 10.34 to the Company’s Post-Effective No. 1 to Form F-4 filed on 17 June 2010 (Commission File Number 333-165531) and incorporated by reference herein)
|
| | Letter Agreement, dated 21 March 2007, amending the Intercreditor Deed, dated 19 December 2006, by and among The State of New South Wales, James Hardie Industries N.V., Asbestos Injuries Compensation Fund Limited and AET Structured Finance Services Pty Limited (filed as Exhibit 10.35 to the Company’s Post-Effective No. 1 to Form F-4 filed on 17 June 2010 (Commission File Number 333-165531) and incorporated by reference herein)
|
| | Performing Subsidiary Intercreditor Deed, dated 19 December 2006, by and among The State of New South Wales, James Hardie 117 Pty Limited, Asbestos Injuries Compensation Fund Limited and AET Structured Finance Services Pty Limited (filed as Exhibit 10.37 to the Company’s Post-Effective No. 1 to Form F-4 filed on 17 June 2010 (Commission File Number 333-165531) and incorporated by reference herein)
|
| | Letter Agreement, dated 21 March 2007, amending the Performing Subsidiary Intercreditor Deed, dated 19 December 2006, by and among The State of New South Wales, James Hardie 117 Pty Limited, Asbestos Injuries Compensation Fund Limited and AET Structured Finance Services Pty Limited (filed as Exhibit 10.38 to the Company’s Post-Effective No. 1 to Form F-4 filed on 17 June 2010 (Commission File Number 333-165531) and incorporated by reference herein) |
| | |
| | |
| | |
| | |
| | | | | |
| |
James Hardie 2021 Annual Report on Form 20-F | 194 |
| |
| | | | | | | | |
Exhibit
Number | | Exhibit Description |
| | Amending Deed to Guarantee Trust Deed, dated 6 October 2009, by and between James Hardie Industries N.V. and AET Structured Finance Services Pty Limited (filed as Exhibit 2.10 to the Company’s Annual Report on Form 20-F filed on 30 June 2010 (Commission File 001-15240) and incorporated by reference herein)
|
| | Amending Deed to Performing Subsidiary Undertaking and Guarantee Trust Deed, dated 6 October 2009, by and between James Hardie 117 Pty Limited and AET Structured Finance Services Pty Limited (filed as Exhibit 2.12 to the Company’s Annual Report on Form 20-F filed on 30 June 2010 (Commission File 001-15240) and incorporated by reference herein)
|
| | Amending Deed (Intercreditor Deed), dated 23 June 2009, by and among The State of New South Wales, James Hardie Industries N.V., Asbestos Injuries Compensation Fund Limited and AET Structured Finance Services Pty Limited (filed as Exhibit 4.36 to the Company’s Annual Report on Form 20-F filed on 30 June 2010 (Commission File 001-15240) and incorporated by reference herein)
|
| | Amending Deed (Performing Subsidiary Intercreditor Deed), dated 23 June 2009, by and among The State of New South Wales, James Hardie 117 Pty Limited, Asbestos Injuries Compensation Fund Limited and AET Structured Finance Services Pty Limited (filed as Exhibit 4.39 to the Company’s Annual Report on Form 20-F filed on 30 June 2010 (Commission File 001-15240) and incorporated by reference herein) |
| | Indenture, dated 13 December 2017, by and among James Hardie International Finance Designated Activity Company, the guarantors named therein and Deutsche Bank Trust Company Americas (filed as Exhibit 2.13 to the Company’s Annual Report on Form 20-F filed on 22 May 2018 (Commission File 001-15240) and incorporated by reference herein)
|
| | Form of 5.000% Senior Note due 2028 (filed as Exhibit 2.15 to the Company’s Annual Report on Form 20-F filed on 22 May 2018 (Commission File 001-15240) and incorporated by reference herein)
|
| | Amended and Restated Credit and Guaranty Agreement, dated 13 December 2017, by and among James Hardie International Finance Designated Activity Company and James Hardie Building Products Inc., as borrowers, James Hardie International Group Limited and James Hardie Technology Limited, as guarantors, James Hardie Industries plc, as parent, HSBC Bank USA, National Association, as administrative agent, and the other lender parties thereto (filed as Exhibit 2.16 to the Company’s Annual Report on Form 20-F filed on 22 May 2018 (Commission File 001-15240) and incorporated by reference herein)
|
| | 364-Day Term Loan and Guaranty Agreement, dated 13 December 2017, by and among James Hardie International Finance Designated Activity Company and James Hardie Building Products Inc., as borrowers, James Hardie International Group Limited and James Hardie Technology Limited, as guarantors, James Hardie Industries plc, as parent, HSBC Bank USA, National Association, as administrative agent, and the other lender parties thereto (filed as Exhibit 2.17 to the Company’s Annual Report on Form 20-F filed on 22 May 2018 (Commission File 001-15240) and incorporated by reference herein)
|
| | |
| | |
| | |
| | | | | |
| |
James Hardie 2021 Annual Report on Form 20-F | 195 |
| |
| | | | | | | | |
Exhibit
Number | | Exhibit Description |
| | Indenture, dated 4 October 2018, among James Hardie International Finance Designated Activity Company, the guarantors listed therein, Deutsche Bank Trust Company Americas, as Trustee and Registrar and Deutsche Bank AG, London Branch, as Paying Agent and Transfer Agent (filed as Exhibit 99.8 to the Company’s Report on Form 6-K filed 8 November 2018 (Commission File Number 001-15240 and incorporated by reference herein)
|
| | Form of 3.625% Senior Notes due 2026 ((filed as Exhibit 99.8 to the Company’s Report on Form 6-k filed 8 November 2018 (Commission File Number 001-15240 and incorporated by reference herein)
|
| | Description of Securities Registered Under Section 12 of the Securities Exchange Act of 1934 |
| | Amended and Restated James Hardie Industries SE 2001 Equity Incentive Plan (filed as Exhibit 4.1 to the Company’s Annual Report on Form 20-F filed on 2 July 2012 (Commission File 001-15240) and incorporated by reference herein)
|
| | Amended and Restated James Hardie Industries plc Long Term Incentive Plan 2006 (filed as Exhibit 99.5 to the Company’s Report on Form 6-K filed 14 August 2018 (Commission File Number 001-15240 and incorporated by reference herein)
|
| | Form of Joint and Several Indemnity Agreement among James Hardie N.V., James Hardie (USA) Inc. and certain indemnitees thereto (filed as Exhibit 4.15 to the Company’s Annual Report on Form 20-F filed on 7 July 2005 (Commission File 001-15240) and incorporated by reference herein)
|
| | Form of Joint and Several Indemnity Agreement among James Hardie Industries N.V., James Hardie Inc. and certain indemnitees thereto (filed as Exhibit 4.16 to the Company’s Annual Report on Form 20-F filed on 7 July 2005 (Commission File 001-15240) and incorporated by reference herein)
|
| | Form of Deed of Access, Insurance and Indemnity between James Hardie Industries N.V. and supervisory board directors and managing board directors (filed as Exhibit 4.9 to the Company’s Annual Report on Form 20-F filed on 8 July 2008 (Commission File 001-15240) and incorporated by reference herein)
|
| | Form of Indemnity Agreement between James Hardie Building Products, Inc. and supervisory board directors, managing board directors and certain executive officers (filed as Exhibit 4.10 to the Company’s Annual Report on Form 20-F filed on 8 July 2008 (Commission File 001-15240) and incorporated by reference herein)
|
| | Form of Irish law-governed Deed of Access, Insurance and Indemnity between James Hardie Industries SE, a European Company registered in Ireland, and its directors, company secretary and certain senior employees thereto (filed as Exhibit 10.10 to the Company’s Registration Statement on Form F-4 filed on 23 June 2009 (Commission File 333-160177) and incorporated by reference herein)
|
| | Form of Deed of Access, Insurance and Indemnity between James Hardie Industries plc, and certain indemnitees thereto (filed as Exhibit 4.9 to the Company’s Annual Report on Form 20-F filed on 21 May 2015 (Commission File 001-15240) and incorporated by reference herein)
|
| | |
| | |
| | |
| | |
| | | | | |
| |
James Hardie 2021 Annual Report on Form 20-F | 196 |
| |
| | | | | | | | |
Exhibit
Number | | Exhibit Description |
| | Deed of Release - Unions and Banton, dated 21 December 2005, by and among James Hardie Industries N.V., Australian Council of Trade Unions, Unions New South Wales, and Bernard Douglas Banton (filed as Exhibit 4.23 to the Company’s Annual Report on Form 20-F filed on 29 September 2006 (Commission File 001-15240) and incorporated by reference herein)
|
| | Deed of Release, dated 22 June 2006, by and between James Hardie Industries N.V. and The State of New South Wales (filed as Exhibit 4.25 to the Company’s Annual Report on Form 20-F filed on 29 September 2006 (Commission File 001-15240) and incorporated by reference herein)
|
| | Amended and Restated Final Funding Agreement, dated 21 November 2006, by and among James Hardie Industries N.V., James Hardie 117 Pty Ltd, The State of New South Wales and Asbestos Injuries Compensation Fund Limited in its capacity as trustee of the Asbestos Injuries Compensation Fund (filed as Exhibit 99.4 to the Company’s Report on Form 6-K filed on 05 January 2007 (Commission File 001-15240) and incorporated by reference herein)
|
| | Asbestos Injuries Compensation Fund Amended and Restated Trust Deed, dated 14 December 2006, by and between James Hardie Industries N.V. and Asbestos Injuries Compensation Fund Limited (filed as Exhibit 4.22 to the Company’s Annual Report on Form 20-F filed on 6 July 2007 (Commission File 001-15240) and incorporated by reference herein)
|
| | Second Irrevocable Power of Attorney, dated 14 December 2006, by and between Asbestos Injuries Compensation Fund Limited and The State of New South Wales (filed as Exhibit 4.26 to the Company’s Annual Report on Form 20-F filed on 6 July 2007 (Commission File 001-15240) and incorporated by reference herein)
|
| | Deed of Accession, dated 14 December 2006, by and among Asbestos Injuries Compensation Fund Limited, James Hardie Industries N.V., James Hardie 117 Pty Limited and The State of New South Wales (filed as Exhibit 4.27 to the Company’s Annual Report on Form 20-F filed on 6 July 2007 (Commission File 001-15240) and incorporated by reference herein)
|
| | Amendment to Amended and Restated Final Funding Agreement, dated 6 August 2007, by and among, James Hardie Industries NV, James Hardie 117 Pty Limited, The State of New South Wales and Asbestos Injuries Compensation Fund Limited in its capacity as trustee of the Asbestos Injuries Compensation Fund (filed as Exhibit 4.22 to the Company’s Annual Report on Form 20-F filed on 8 July 2008 (Commission File 001-15240) and incorporated by reference herein)
|
| | Deed Poll, dated 11 June 2008, amendment of the Asbestos Injuries Compensation Fund Amended and Restated Trust Deed (filed as Exhibit 4.27 to the Company’s Annual Report on Form 20-F filed on 8 July 2008 (Commission File 001-15240) and incorporated by reference herein)
|
| | |
| | |
| | |
| | |
| | | | | |
| |
James Hardie 2021 Annual Report on Form 20-F | 197 |
| |
| | | | | | | | |
Exhibit
Number | | Exhibit Description |
| | Amendment to Amended and Restated Final Funding Agreement, dated 8 November 2007, by and among, James Hardie Industries NV, James Hardie 117 Pty Limited, The State of New South Wales and Asbestos Injuries Compensation Fund Limited in its capacity as trustee of the Asbestos Injuries Compensation Fund (filed as Exhibit 4.23 to the Company’s Annual Report on Form 20-F filed on 8 July 2008 (Commission File 001-15240) and incorporated by reference herein)
|
| | Amendment to Amended and Restated Final Funding Agreement, dated 11 June 2008, by and among, James Hardie Industries NV, James Hardie 117 Pty Limited, The State of New South Wales and Asbestos Injuries Compensation Fund Limited in its capacity as trustee of the Asbestos Injuries Compensation Fund (filed as Exhibit 4.24 to the Company’s Annual Report on Form 20-F filed on 8 July 2008 (Commission File 001-15240) and incorporated by reference herein)
|
| | Amended and Restated Final Funding Agreement - Address for Service of Notice on Trustee, dated 13 June 2008 (filed as Exhibit 4.25 to the Company’s Annual Report on Form 20-F filed on 8 July 2008 (Commission File 001-15240) and incorporated by reference herein)
|
| | Amendment to Amended and Restated Final Funding Agreement, dated 17 July 2008, by and among, James Hardie Industries NV, James Hardie 117 Pty Limited, The State of New South Wales and Asbestos Injuries Compensation Fund Limited in its capacity as trustee of the Asbestos Injuries Compensation Fund (filed as Exhibit 10.27 to the Company’s Registration Statement on Form F-4 filed on 23 June 2009 (Commission File 333-160177) and incorporated by reference herein)
|
| | Deed of Confirmation, dated 23 June 2009, by and among James Hardie Industries N.V, James Hardie 117 Pty Limited, The State of New South Wales and Asbestos Injuries Compensation Fund Limited in its capacity as trustee of the Asbestos Injuries Compensation Fund (filed as Exhibit 10.37 to the Company’s Registration Statement on Form F-4/A filed on 10 July 2009 (Commission File 333-160177) and incorporated by reference herein)
|
| | Amending Agreement (Parent Guarantee), dated 23 June 2009, by and among Asbestos Injuries Compensation Fund Limited, The State of New South Wales and James Hardie Industries N.V. (filed as Exhibit 4.30 to the Company’s Annual Report on Form 20-F filed on 30 June 2010 (Commission File 001-15240) and incorporated by reference herein)
|
| | Deed to amend the Amended and Restated Final Funding Agreement and facilitate the Authorized Loan Facility, dated 9 December 2010, by and among James Hardie Industries SE, James Hardie 117 Pty Limited, The State of New South Wales and Asbestos Injuries Compensation Fund Limited in its capacity as trustee of each of the Compensation Funds (filed as Exhibit 4.25 to the Company’s Annual Report on Form 20-F filed on 29 June 2011 (Commission File 001-15240) and incorporated by reference herein)
|
| | AICF facility agreement, dated 9 December 2010, by and among Asbestos Injuries Compensation Fund Limited, ABN 60 Pty Limited, Amaca Pty Ltd, Amaba Pty Ltd and The State of New South Wales (filed as Exhibit 4.40 to the Company’s Annual Report on Form 20-F filed on 29 June 2011 (Commission File 001-15240) and incorporated by reference herein)
|
| | |
| | |
| | |
| | |
| | | | | |
| |
James Hardie 2021 Annual Report on Form 20-F | 198 |
| |
| | | | | | | | |
Exhibit
Number | | Exhibit Description |
| | Fixed and Floating Charge, dated 9 December 2010, by and among Asbestos Injuries Compensation Fund Limited, ABN 60 Pty Limited, Amaca Pty Ltd, Amaba Pty Ltd and The State of New South Wales (filed as Exhibit 4.41 to the Company’s Annual Report on Form 20-F filed on 29 June 2011 (Commission File 001-15240) and incorporated by reference herein)
|
| | Deed to amend the Amended and Restated Final Funding Agreement, dated 29 February 2012, by and among James Hardie Industries SE, James Hardie 117 Pty Limited, The State of New South Wales and Asbestos Injuries Compensation Fund Limited in its capacity as trustee of each of the Compensation Funds (filed as Exhibit 4.27 to the Company’s Annual Report on Form 20-F filed on 2 July 2012 (Commission File 001-15240) and incorporated by reference herein)
|
| | Deed to amend the Amended and Restated Final Funding Agreement, dated 28 March 2012, by and among James Hardie Industries SE, James Hardie 117 Pty Limited, The State of New South Wales and Asbestos Injuries Compensation Fund Limited in its capacity as trustee of each of the Compensation Funds (filed as Exhibit 4.28 to the Company’s Annual Report on Form 20-F filed on 2 July 2012 (Commission File 001-15240) and incorporated by reference herein)
|
| | Summary of Amendments to Amended and Restated Final Funding Agreement, dated 20 December 2013, by and among, James Hardie Industries NV, James Hardie 117 Pty Limited, The State of New South Wales and Asbestos Injuries Compensation Fund Limited in its capacity as trustee of the Asbestos Injuries Compensation Fund (filed as Exhibit 4.37 to the Company’s Annual Report on Form 20-F filed on 26 June 2014 (Commission File 001-15240) and incorporated by reference herein)
|
| | Deed of Amendment, dated 27 February 2015, by and among Asbestos Injuries Compensation Fund Limited, ABN 60 Pty Limited, Amaca Pty Ltd, Amaba Pty Ltd and The State of New South Wales (filed as Exhibit 4.32 to the Company’s Annual Report on Form 20-F filed on 21 May 2015 (Commission File Number 001-15240) and incorporated by reference herein)
|
| | Sale and Purchase Agreement related to XI (DL) Holdings GmbH, dated 7 November 2017, by and among Xella International S.A., as seller, Platin 1391. GmbH (now known as James Hardie Germany GmbH) as purchaser, and James Hardie International Group Limited, as guarantor (filed as Exhibit 4.30 to the Company’s Annual Report on Form 20-F filed on 22 May 2018 (Commission File 001-15240) and incorporated by reference herein)
|
| | Deed of Amendment, Amended and Restated Final Funding Agreement, dated 19 December 2017, by and among James Hardie Industries plc, James Hardie 117 Pty Limited, The State of New South Wales and Asbestos Injuries Compensation Fund Limited in its capacity as trustee for each of the Compensation Fund (filed as Exhibit 4.31 to the Company’s Annual Report on Form 20-F filed on 22 May 2018 (Commission File 001-15240) and incorporated by reference herein)
|
| | Amendment to Sale and Purchase Agreement, dated 13 December 2017, by and among Xella International S.A., as seller, Platin 1391. GmbH (now known as James Hardie Germany GmbH) as purchaser, and James Hardie International Group Limited, as guarantor (filed as Exhibit 4.32 to the Company’s Annual Report on Form 20-F filed on 22 May 2018 (Commission File 001-15240) and incorporated by reference herein)
|
| | |
| | |
| | |
| | | | | |
| |
James Hardie 2021 Annual Report on Form 20-F | 199 |
| |
| | | | | | | | |
Exhibit
Number | | Exhibit Description |
| | Second Amendment and Accession Agreement to the Sale and Purchase Agreement related to XI (DL) Holdings GmbH, dated 3 April 2018, by and among Xella International S.A., James Hardie Germany GmbH, James Hardie International Group Limited and James Hardie International Finance Designated Activity Company (filed as Exhibit 4.33 to the Company’s Annual Report on Form 20-F filed on 22 May 2018 (Commission File 001-15240) and incorporated by reference herein) |
| | James Hardie Industries plc 2020 Non-Executive Director Equity Plan |
| | List of significant subsidiaries of James Hardie Industries plc |
| | Certification of the Chief Executive Officer pursuant to Section 302 of the Sarbanes-Oxley Act of 2002 |
| | Certification of the Chief Financial Officer pursuant to Section 302 of the Sarbanes-Oxley Act of 2002 |
| | Certification of the Chief Executive Officer and Chief Financial Officer pursuant to Section 906 of the Sarbanes-Oxley Act of 2002 |
| | Consent of Ernst & Young LLP, independent registered public accounting firm |
| | Consent of KPMG Actuarial |
| 101.INS* | | Inline XBRL Instance Document (the instance document does not appear in the Interactive Data File because its XBRL tags are embedded within the Inline XBRL document) |
| 101.SCH* | | Inline XBRL Taxonomy Extension Schema Document |
| 101.CAL* | | Inline XBRL Taxonomy Extension Calculation Linkbase Document |
| 101.DEF* | | Inline XBRL Taxonomy Extension Definition Linkbase Document |
| 101.LAB* | | Inline XBRL Taxonomy Extension Labels Linkbase Document |
| 101.PRE* | | Inline XBRL Taxonomy Extension Presentation Linkbase Document |
| 104* | | Cover Page Interactive Data File (formatted as Inline XBRL and included as part of the Exhibit 101 Inline XBRL Document Set) |
____________
* Filed herewith
| | | | | |
| |
James Hardie 2021 Annual Report on Form 20-F | 200 |
| |
SIGNATURES
The registrant hereby certifies that it meets all of the requirements for filing on Form 20-F and that it has duly caused and authorized the undersigned to sign this Annual Report on its behalf.
| | | | | | | | | | | | | | |
| | | | |
| | JAMES HARDIE INDUSTRIES plc |
| | | | |
| | By: | | /s/ JACK TRUONG |
| | | | Jack Truong |
Date: 18 May 2021 | | | | Chief Executive Officer |
This Annual Report has been approved by the Board of Directors of James Hardie Industries plc.
| | | | | | | | | | | | | | |
| | | | |
| | JAMES HARDIE INDUSTRIES plc |
| | | | |
| | By: | | /s/ MICHAEL N. HAMMES |
| | | | Michael N. Hammes |
Date: 18 May 2021 | | | | Chairman |
End of
Appendix to the
Directors’ Report
INDEPENDENT AUDITOR'S REPORT TO THE MEMBERS OF JAMES HARDIE INDUSTRIES PLC
Report on the audit of the financial statements
Opinion
We have audited the financial statements of James Hardie Industries plc (the ‘Parent Company’) and its subsidiaries (the ‘Group’) for the year ended 31 March 2021 which comprise the Consolidated Statements of Operations and Comprehensive Income, the Consolidated Balance Sheets, the Consolidated Statements of Cash Flows, the Consolidated Reconciliation of Movement in Shareholders' Equity (Deficit), the Company Balance Sheet, the Company Statement of Changes in Equity, the related notes 1 to 36 in respect of the Group financial statements (and solely that information explicitly incorporated by reference therefrom) and the related notes 1 to 15 in respect to the Parent Company financial statements, including a summary of significant accounting policies as set out therein. The financial reporting framework that has been applied in the preparation of the Group financial statements is Irish law and US Generally Accepted Accounting Principles (US GAAP), as defined in section 279 of Part 6 of the Companies Act 2014, to the extent that the use of those principles in the preparation of the financial statements does not contravene any provision of that Part of the Companies Act 2014. The financial reporting framework that has been applied in the preparation of the Parent Company financial statements is applicable Irish law and accounting standards, including FRS 101 Reduced Disclosure Framework issued in the United Kingdom by the Financial Reporting Council.
In our opinion:
•the Group financial statements give a true and fair view of the assets, liabilities and financial position of the Group as at 31 March 2021 and of the profit for the Group for the year then ended, and have been properly prepared in accordance with US Generally Accepted Accounting Principles (US GAAP), as defined in section 279 of Part 6 of the Companies Act 2014, to the extent that the use of those principles in the preparation of the financial statements does not contravene any provision of that Part of the Companies Act 2014;
•the Parent Company financial statements gives a true and fair view of the assets, liabilities and financial position of the Parent Company as at 31 March 2021, and has been properly prepared in accordance with FRS 101 Reduced Disclosure Framework; and
•the financial statements have been properly prepared in accordance with the requirements of the Companies Act 2014.
Basis for opinion
We conducted our audit in accordance with International Standards on Auditing (Ireland) (ISAs (Ireland)) and applicable law. Our responsibilities under those standards are described in the Auditor's Responsibilities for the Audit of the Financial Statements section of our report. We are independent of the Group and the Parent Company in accordance with ethical requirements that are relevant to our audit of financial statements in Ireland, including the Ethical Standard issued by the Irish Accounting and Auditing Supervisory Authority (IAASA), as applied to listed entities, and we have fulfilled our other ethical responsibilities in accordance with these requirements.
We believe that the audit evidence we have obtained is sufficient and appropriate to provide a basis for our opinion.
…/continued
| | | | | | | | |
| FY 2021 Irish Statutory Accounts | | 9 |
INDEPENDENT AUDITOR'S REPORT TO THE MEMBERS OF JAMES HARDIE INDUSTRIES PLC (Continued)
Conclusions relating to going concern
In auditing the financial statements, we have concluded that the directors’ use of the going concern basis of accounting in the preparation of the financial statements is appropriate. Our evaluation of the directors’ assessment of the group and parent company’s ability to continue to adopt the going concern basis of accounting included:
•In conjunction with our walkthrough of the Group’s financial close process, we confirmed our understanding of management’s Going Concern assessment process and also engaged with management early to ensure all key factors were considered in their assessment;
•We obtained and evaluated management’s going concern assessment and the cash forecast for the going concern period which covers a year from the date of signing this audit opinion. The assessment included an analysis of the Group’s cash position, the Group’s available credit facility and historical and current year significant cash provided by operations;
•We reviewed the Group’s going concern disclosures included in the annual report in order to assess that the disclosures were appropriate and in conformity with the reporting standards.
Conclusion
Based on the work we have performed, we have not identified any material uncertainties relating to events or conditions that, individually or collectively, may cast significant doubt on the Group and Parent Company’s ability to continue as a going concern for a period of at least twelve months from when the financial statements are authorised for issue.
Our responsibilities and the responsibilities of the directors with respect to going concern are described in the relevant sections of this report. However, because not all future events or conditions can be predicted, this statement is not a guarantee as to the Group and Parent Company’s ability to continue as a going concern.
Key audit matters
Key audit matters are those matters that, in our professional judgement, were of most significance in our audit of the financial statements of the current period and include the most significant assessed risks of material misstatement (whether or not due to fraud) we identified. These matters include those which had the greatest effect on: the overall audit strategy, the allocation of resources in the audit, and directing the efforts of the engagement team. These matters were addressed in the context of our audit of the financial statements as a whole, and in forming our opinion thereon, and we do not provide a separate opinion on these matters.
…/continued
| | | | | | | | |
| FY 2021 Irish Statutory Accounts | | 10 |
INDEPENDENT AUDITOR'S REPORT TO THE MEMBERS OF JAMES HARDIE INDUSTRIES PLC (Continued)
| | | | | | | | |
| Risk | Our response to the risk | Key observations communicated to the Audit Committee |
Asbestos liability valuation
As more fully described in Note 14 to the consolidated financial statements, the Company has an asbestos liability of $1.135.8 million (2020: $986.4 million). The liability relates to an agreement to provide long-term funding to the Asbestos Injuries Compensation Fund (“AICF”), a special purpose fund established to provide compensation for proven Australian-related personal injuries.
The asbestos liability is significant to our audit because the assessment process, which includes actuarial estimates of projected future cash flows to reflect a probability-weighted expected outcome of those future cash flows, involves inherent uncertainty, is complex, uses subjective assumptions and the amounts involved are material to the financial statements taken as a whole.
|
We tested the underlying claims data used in the actuarial estimate calculated by KPMG Actuarial (KPMGA), who was engaged and appointed by the AICF, by comparing the inputs to internal and external data and substantively testing the data on a sample basis. We involved our valuation specialists locally in Australia, as well as in the United States, to assist in evaluating the methodologies and key assumptions related to the total projected number of claims, the typical cost of settlement, inflation rates, the legal costs incurred in the litigation of such claims, the rate of receipt of claims, the settlement strategy in dealing with outstanding claims, the estimate for overseas claim exposure, and the timing of settlements used in the calculation of the asbestos liability. With the support of our valuation specialists, we independently developed a range for the asbestos liability and compared that to management’s carried liability. We obtained an understanding, evaluated the design, and tested the operating effectiveness of the Company’s controls over the asbestos liability and their oversight of KPMGA.
We have also assessed the adequacy of the related disclosures in the James Hardie Industries plc consolidated financial statements.
|
Our communication included the results of our procedures as well as observations from the actuarial report and the resulting impact of the asbestos valuation on the consolidated financial statements and related footnotes. |
In the prior year, our auditor’s report included a key audit matter in relation to the Impairment of Long-Lived Assets. In the current year, this is no longer considered a key audit matter as the long-lived assets to which it related were fully written off in 2020.
…/continued
| | | | | | | | |
| FY 2021 Irish Statutory Accounts | | 11 |
INDEPENDENT AUDITOR'S REPORT TO THE MEMBERS OF JAMES HARDIE INDUSTRIES PLC (Continued)
Our application of materiality
We apply the concept of materiality in planning and performing the audit, in evaluating the effect of identified misstatements on the audit and in forming our audit opinion.
Materiality
Materiality is the magnitude of an omission or misstatement that, individually or in the aggregate, could reasonably be expected to influence the economic decisions of the users of the financial statements. Materiality provides a basis for determining the nature and extent of our audit procedures.
We determined materiality for the Group to be $27.0 million (2020: $18.0 million), which is approximately 5% of the Group’s profit before tax of $412.0 million, adjusted for the add-back of asbestos adjustments of $143.9 million (2020: 5% of Group’s profit before tax adjusted for the add-back of asbestos adjustments and certain one off impairment charges). We consider adjusted profit before tax to be the most appropriate performance metric on which to base our materiality calculation as we consider it to be the most relevant performance measure to the main stakeholders of the Group.
During the course of our audit, we reassessed initial materiality and the only change in final materiality was to reflect the actual reported performance of the Group in the year.
Performance materiality
Performance materiality is the application of materiality at the individual account or balance level. It is set at an amount to reduce to an appropriately low level the probability that the aggregate of uncorrected and undetected misstatements exceeds materiality.
On the basis of our risk assessments, together with our assessment of the Group’s overall control environment, our judgement was that performance materiality should be set at 50% of our planning materiality, namely $13.5 million (2020: $9 million). We have set performance materiality at this percentage due to our past history of a low number of misstatements, our ability to assess the likelihood of misstatements, both corrected and uncorrected, the effectiveness of the control environment and other factors affecting the entity and its financial reporting.
Audit work at component locations for the purpose of obtaining audit coverage over significant financial statement accounts is undertaken based on a percentage of total performance materiality. The performance materiality set for each component is based on the relative scale and risk of the component to the Group as a whole and our assessment of the risk of misstatement at that component. In the current year, the range of performance materiality allocated to components was $2.7 million to $13.5 million.
Reporting threshold
Reporting Threshold is the amount below which identified misstatements are considered as being clearly trivial.
…/continued
| | | | | | | | |
| FY 2021 Irish Statutory Accounts | | 12 |
INDEPENDENT AUDITOR'S REPORT TO THE MEMBERS OF JAMES HARDIE INDUSTRIES PLC (Continued)
We agreed with the Audit Committee that we would report to them all uncorrected audit differences in excess of $1.35 million (2020: $0.9 million), which is set at approximately 5% of planning materiality, as well as differences below that threshold that, in our view, warranted reporting on qualitative grounds. We evaluate any uncorrected misstatements against both the quantitative measures of materiality discussed above and in light of other relevant qualitative considerations in forming our opinion.
Audit Scope
•We performed an audit of the complete financial information of 5 full-scope components and performed audit procedures on specific balances for a further 3 components.
•The components where we performed either full or specific audit procedures accounted for 95.5% of the Group’s Adjusted Profit Before Tax, 95.3% of the Group’s Revenue and 94.5% of the Group’s Total Assets.
•‘Components’ represent business units across the Group considered for audit scoping purposes.
An overview of the scope of our audit
Tailoring the scope
Our assessment of audit risk, our evaluation of materiality and our allocation of performance materiality determine our audit scope for each entity within the Group. Taken together, this enables us to form an opinion on the Consolidated Financial Statements. We take into account size, risk profile, the organisation of the Group and effectiveness of group-wide controls and other factors when assessing the level of work to be performed at each entity.
In assessing the risk of material misstatement to the Group financial statements, and to ensure we had adequate quantitative coverage of significant accounts in the financial statements, of the 17 (2020: 17) reporting components of the group, we selected 8 components covering entities across the Americas, APAC and Europe, which represent the principal business units within the Group.
Of the 8 (2020: 8) components selected, we performed an audit of the complete financial information of 5 (2020: 5) components (“full scope components”) which were selected based on their size or risk characteristics. Of the 5 full scope components selected, 2 such components relate to U.S. Corporate Headquarters and other corporate entities as well as the Group’s consolidation functions. For the 3 (2020: 3) components (“specific scope” and “specified procedures” components), we performed audit procedures on specific accounts within that component that we considered had the potential for the greatest impact on the significant accounts in the financial statements either because of the size of these accounts or their risk profile.
The reporting components where we performed audit procedures accounted for 95.5% (2020: 92.3%) of the Group’s adjusted profit before tax, 95.3% (2020: 94.0%) of the Group’s revenue and 94.5% (2020: 93.8%) of the Group’s total assets.
…/continued
| | | | | | | | |
| FY 2021 Irish Statutory Accounts | | 13 |
INDEPENDENT AUDITOR'S REPORT TO THE MEMBERS OF JAMES HARDIE INDUSTRIES PLC (Continued)
For the current year, the full scope components contributed 102.5% (2020: 118.9%) of the Group’s adjusted profit before tax, 92.5% (2020: 91.2%) of the Group’s revenue and 83.6% (2020: 80.2%) of the Group’s total assets. The specific scope and specified procedures components contributed -7.0% (2020: -26.6) of the Group’s adjusted profit before tax, 2.8% (2020: 2.8%) of the Group’s revenue and 10.9% (2020: 13.6%) of the Group’s total assets. The audit scope of these components may not have included testing of all significant accounts of the component but will have contributed to the coverage of significant accounts tested for the Group.
Of the remaining 9 (2029: 9) components that together represent 4.5% of the Group’s adjusted profit before tax, none are individually greater than 2% (2020: 2%) of the Group’s adjusted profit before tax. For these components, we performed other procedures, including assigning “review scope” to 5 (2020: 5) components representing 4.5% (2020: 2.5%) of the Group’s adjusted profit before tax and performing analytical review, testing of consolidation journals and intercompany eliminations and foreign currency translation recalculations to respond to any potential risks of material misstatement to the Group financial statements.
Involvement with component teams
In establishing our overall approach to the Group audit, we determined the type of work that needed to be undertaken at each of the components by us, EY Dublin, as the primary audit engagement team, or by component auditors from other EY global network firms operating under our instruction. For one specific scope component, audit procedures were performed directly by the primary audit team. For the 5 full scope components and the 2 specific scope and specified procedures components where the work was performed by component auditors, we determined the appropriate level of involvement to enable us to determine that sufficient audit evidence had been obtained as a basis for our opinion on the Group as a whole. The primary team interacted with component teams where appropriate during various stages of the audit, most particularly the full scope component teams, reviewed key working papers and were responsible for the scope and direction of the audit process. This, together with the additional procedures performed at a group level, gave us appropriate evidence for our opinion on the Group financial statements.
Other information
The directors are responsible for the other information. The other information comprises the information included in the Directors’ Report other than the financial statements and our auditor’s report thereon. Our opinion on the financial statements does not cover the other information and, except to the extent otherwise explicitly stated in our report, we do not express any form of assurance conclusion thereon.
Our responsibility is to read the other information and, in doing so, consider whether the other information is materially inconsistent with the financial statements or our knowledge obtained in the audit or otherwise appears to be materially misstated. If we identify such material inconsistencies or apparent material misstatements, we are required to determine whether there is a material misstatement in the financial statements or a material misstatement of the other information. If, based on the work we have performed, we conclude that there is a material misstatement of this other information, we are required to report that fact.
We have nothing to report in this regard.
…/continued
| | | | | | | | |
| FY 2021 Irish Statutory Accounts | | 14 |
INDEPENDENT AUDITOR'S REPORT TO THE MEMBERS OF JAMES HARDIE INDUSTRIES PLC (Continued)
Opinions on other matters prescribed by the Companies Act 2014
In our opinion, based solely on the work undertaken in the course of the audit, we report that:
•the information given in the directors' report, other than those parts dealing with the non-financial disclosure pursuant to the requirements of the European Union (Disclosure of non-financial and diversity Information by certain large undertakings and groups) Regulations 2017 (as amended) on which we are not required to report, for the financial year for which the statutory financial statements are prepared is consistent with the statutory financial statements in respect of the financial year concerned; and
•the directors' report, other than those parts dealing with the non-financial disclosure pursuant to the requirements of the European Union (Disclosure of non-financial and diversity Information by certain large undertakings and groups) Regulations 2017 (as amended) on which we are not required to report, has been prepared in accordance with applicable legal requirements.
We have obtained all the information and explanations which we consider necessary for the purposes of our audit.
In our opinion the accounting records of the Parent Company were sufficient to permit the financial statements to be readily and properly audited and the Parent Company Balance Sheet is in agreement with the accounting records.
Matters on which we are required to report by exception
Based on the knowledge and understanding of the Company and its environment obtained in the course of the audit, we have not identified material misstatements in the directors' report. The Companies Act 2014 requires us to report to you if, in our opinion, the disclosures of directors’ remuneration and transactions required by sections 305 to 312, which relate to disclosures of directors’ remuneration and transactions, are not complied with by the Company. We have nothing to report in this regard.
We have nothing to report in respect of section 13 of the European Union (Disclosure of Non-Financial and Diversity Information by certain large undertakings and groups) Regulations 2017 (as amended), which require us to report to you if, in our opinion, the Company has not provided in the non-financial disclosure the information required by Section 5(2) to (7) of those Regulations, in respect of year ended 31 March 2020.
Respective responsibilities
Responsibilities of directors for the financial statements
As explained more fully in the directors’ responsibilities statement set out on page 7, the directors are responsible for the preparation of the financial statements in accordance with the applicable financial reporting framework and for being satisfied that they give a true and fair view, and for such internal control as they determine is necessary to enable the preparation of financial statements that are free from material misstatement, whether due to fraud or error.
…/continued
| | | | | | | | |
| FY 2021 Irish Statutory Accounts | | 15 |
INDEPENDENT AUDITOR'S REPORT TO THE MEMBERS OF JAMES HARDIE INDUSTRIES PLC (Continued)
In preparing the financial statements, the directors are responsible for assessing the Group and Parent Company’s ability to continue as a going concern, disclosing, as applicable, matters related to going concern and using the going concern basis of accounting unless management either intends to liquidate the Group or the Parent Company or to cease operations, or has no realistic alternative but to do so.
Auditor’s responsibilities for the audit of the financial statements
Our objectives are to obtain reasonable assurance about whether the financial statements as a whole are free from material misstatement, whether due to fraud or error, and to issue an auditor’s report that includes our opinion. Reasonable assurance is a high level of assurance, but is not a guarantee that an audit conducted in accordance with ISAs (Ireland) will always detect a material misstatement when it exists. Misstatements can arise from fraud or error and are considered material if, individually or in the aggregate, they could reasonably be expected to influence the economic decisions of users taken on the basis of these financial statements.
A further description of our responsibilities for the audit of the financial statements is located on the IAASA's website at:
http://www.iaasa.ie/getmedia/b2389013-1cf6-458b-9b8f-a98202dc9c3a/Description_of_auditors_responsibilities_for_audit.pdf.
This description forms part of our auditor's report.
The purpose of our audit work and to whom we owe our responsibilities
This report is made solely to the Parent Company's members, as a body, in accordance with section 391 of the Companies Act 2014. Our audit work has been undertaken so that we might state to the Parent Company's members those matters we are required to state to them in an auditor's report and for no other purpose. To the fullest extent permitted by law, we do not accept or assume responsibility to anyone other than the Parent Company and the Parent Company's members as a body, for our audit work, for this report, or for the opinions we have formed.
| | |
| /s/ Ian Venner |
| Ian Venner |
| For and on behalf of Ernst & Young |
| Chartered Accountants and Statutory Audit Firm |
| Dublin |
| 18 May 2021 |
| | | | | | | | |
| FY 2021 Irish Statutory Accounts | | 16 |
James Hardie Industries plc
Consolidated Statements of Operations and Comprehensive Income
| | | | | | | | | | | | | | | | | | | | |
| | Years Ended 31 March |
| (Millions of US dollars, except per share data) | Notes | 2021 | | 2020 | | 2019 |
| Net sales | 3, 20 | $ | 2,908.7 | | | $ | 2,606.8 | | | $ | 2,506.6 | |
| Cost of goods sold | | (1,857.0) | | | (1,673.1) | | | (1,675.6) | |
| Gross profit | | 1,051.7 | | | 933.7 | | | 831.0 | |
| Selling, general and administrative expenses | | (389.6) | | | (415.8) | | | (397.8) | |
| Research and development expenses | 2 | (34.3) | | | (32.8) | | | (37.9) | |
| Restructuring expenses | 7, 8, 9, 20 | (11.1) | | | (84.4) | | | (15.9) | |
| Asbestos adjustments | 14 | (143.9) | | | (58.2) | | | (22.0) | |
| Operating income | | 472.8 | | | 342.5 | | | 357.4 | |
| Interest expense | | (48.5) | | | (57.5) | | | (54.2) | |
| Interest income | | 0.7 | | | 3.1 | | | 4.1 | |
| Loss on early debt extinguishment | | (13.1) | | | — | | | (1.0) | |
| Other income (expense) | 23 | 0.1 | | | (0.1) | | | 0.1 | |
| Income before income taxes | 20 | 412.0 | | | 288.0 | | | 306.4 | |
| Income tax expense | 17 | (149.2) | | | (46.5) | | | (71.8) | |
| Net income | | $ | 262.8 | | | $ | 241.5 | | | $ | 234.6 | |
| | | | | | |
| Income per share: | | | | | | |
| Basic | | $ | 0.59 | | | $ | 0.55 | | | $ | 0.53 | |
| Diluted | | $ | 0.59 | | | $ | 0.54 | | | $ | 0.53 | |
| Weighted average common shares outstanding | | | | | | |
| (Millions): | | | | | | |
| Basic | 2 | 443.7 | | | 442.6 | | | 441.9 | |
| Diluted | 2 | 445.4 | | | 444.1 | | | 443.0 | |
| | | | | | |
| Comprehensive income, net of tax: | | | | | | |
| Net income | | $ | 262.8 | | | $ | 241.5 | | | $ | 234.6 | |
| Cash flow hedges | | — | | | — | | | (0.1) | |
| Pension adjustments | | (0.4) | | | 0.8 | | | — | |
| Currency translation adjustments | | 55.9 | | | (32.6) | | | (28.9) | |
| Comprehensive income | | $ | 318.3 | | | $ | 209.7 | | | $ | 205.6 | |
Net sales and operating income arose solely from continuing operations.
See Glossary of Abbreviations and Terms on pages 38 and 39.
The accompanying notes are an integral part of these consolidated financial statements.
| | | | | | | | |
| FY 2021 Irish Statutory Accounts | | 17 |
James Hardie Industries plc
Consolidated Balance Sheets
| | | | | | | | | | | | | | |
| | 31 March |
| (Millions of US dollars) | Notes | 2021 | | 2020 |
| ASSETS | | | | |
| Fixed Assets | | | | |
| Goodwill | 7 | $ | 215.1 | | | $ | 202.7 | |
| Intangible assets, net | 8 | 173.9 | | | 166.7 | |
| Property, plant and equipment, net | 9 | 1,372.3 | | | 1,342.1 | |
| Operating lease right-of-use assets | 10 | 46.4 | | | 40.5 | |
| Finance lease right-of-use assets | 10 | 2.7 | | | 1.7 | |
| | | | |
| Current Assets | | | | |
| Inventories | 6 | 218.3 | | | 305.1 | |
| Debtors | 24 | 1,721.1 | | | 1,767.9 | |
| Investments | 25 | 136.5 | | | 63.0 | |
| Cash and cash equivalents | 4 | 208.5 | | | 144.4 | |
| TOTAL ASSETS | | $ | 4,094.8 | | | $ | 4,034.1 | |
| | | | |
| LIABILITIES | | | | |
| Shareholders' Equity | | | | |
| Called up share capital presented as equity | 27 | $ | 231.4 | | | $ | 230.6 | |
| Share premium | | 228.6 | | | 211.3 | |
| Capital redemption reserve | | 7.2 | | | 7.2 | |
| Accumulated other comprehensive loss | 21 | (6.6) | | | (62.1) | |
| Retained earnings | | 606.0 | | | 654.1 | |
| Total shareholders' equity | | 1,066.6 | | | 1,041.1 | |
| | | | |
| Provisions for liabilities | | | | |
| Deferred income taxes | 17 | 86.3 | | | 81.9 | |
| Accrued product warranties | 13 | 39.6 | | | 42.4 | |
| Asbestos liability | 14 | 1,135.8 | | | 986.4 | |
| Workers' compensation - asbestos | 14 | 21.9 | | | 22.2 | |
| | | | |
| Creditors (amounts falling due within one year): | | | | |
| Operating lease liabilities | 10 | 7.8 | | | 14.3 | |
| Finance lease liabilities | 10 | 1.0 | | | 0.5 | |
| Creditors | 26 | 762.5 | | | 382.8 | |
| | | | |
| Creditors (amounts falling due after one year): | | | | |
| Debt | 12 | 858.6 | | | 1,354.6 | |
| Operating lease liabilities | 10 | 53.3 | | | 41.4 | |
| Finance lease liabilities | 10 | 1.9 | | | 1.5 | |
| Creditors | 26 | 59.5 | | | 65.0 | |
| Total Provisions and Creditors | | 3,028.2 | | | 2,993.0 | |
| TOTAL LIABILITIES | | $ | 4,094.8 | | | $ | 4,034.1 | |
| | | | | | | | |
| Approved by the Board of Directors and signed on its behalf by: |
| | | | | | | | |
| /s/ Michael Hammes | | /s/ Anne Lloyd |
| Michael Hammes | | Anne Lloyd |
The accompanying notes are an integral part of these consolidated financial statements.
| | | | | | | | |
| FY 2021 Irish Statutory Accounts | | 18 |
James Hardie Industries plc
Consolidated Statements of Cash Flows
| | | | | | | | | | | | | | | | | | | | |
| | Years Ended 31 March |
| (Millions of US dollars) | | 2021 | | 2020 | | 2019 |
| Cash Flows From Operating Activities | | | | | | |
| Net income | | $ | 262.8 | | | $ | 241.5 | | | $ | 234.6 | |
| Adjustments to reconcile net income to net cash provided by operating activities | | | | | | |
| Depreciation and amortisation | | 135.0 | | | 131.5 | | | 119.4 | |
| Lease expense | | 17.0 | | | 18.1 | | | — | |
| Deferred income taxes | | 85.8 | | | 64.0 | | | 12.7 | |
| Stock-based compensation | | 18.0 | | | 10.3 | | | 12.5 | |
| Asbestos adjustments | | 143.9 | | | 58.2 | | | 22.0 | |
| Excess tax benefits from share-based awards | | (3.5) | | | (0.4) | | | — | |
| Restructuring expenses | | — | | | 77.4 | | | 15.9 | |
| Loss on early debt extinguishment | | 13.1 | | | — | | | 1.0 | |
| Other, net | | 20.3 | | | 17.2 | | | 16.3 | |
| Changes in operating assets and liabilities: | | | | | | |
| Accounts and other receivables | | 46.4 | | | (118.6) | | | (18.1) | |
| Inventories | | 98.7 | | | 3.2 | | | (28.6) | |
| Lease assets and liabilities, net | | (19.1) | | | (15.6) | | | — | |
| Prepaid expenses and other assets | | (14.2) | | | (2.6) | | | (7.5) | |
| Insurance receivable - Asbestos | | 5.8 | | | 7.6 | | | 4.8 | |
| Accounts payable and accrued liabilities | | 25.0 | | | 45.1 | | | (12.9) | |
| Claims and handling costs paid - Asbestos | | (106.4) | | | (105.6) | | | (108.8) | |
| Income taxes payable | | (14.7) | | | (11.0) | | | 8.8 | |
| Other accrued liabilities | | 73.0 | | | 30.9 | | | 15.5 | |
| Net cash provided by operating activities | | $ | 786.9 | | | $ | 451.2 | | | $ | 287.6 | |
| Cash Flows From Investing Activities | | | | | | |
| Purchases of property, plant and equipment | | $ | (110.7) | | | $ | (193.8) | | | $ | (301.1) | |
| Proceeds from sale of property, plant and equipment | | 1.6 | | | 8.0 | | | — | |
| Capitalized interest | | (9.5) | | | (9.5) | | | (5.4) | |
| Acquisition of business | | — | | | — | | | (558.7) | |
| Purchases of restricted short-term investments - Asbestos | | (25.0) | | | (75.5) | | | (89.1) | |
| Proceeds from restricted short-term investments - Asbestos | | 23.2 | | | 67.0 | | | 106.3 | |
| Net cash used in investing activities | | $ | (120.4) | | | $ | (203.8) | | | $ | (848.0) | |
| Cash Flows From Financing Activities | | | | | | |
| Proceeds from credit facilities | | $ | — | | | $ | 330.0 | | | $ | 230.0 | |
| Repayments of credit facilities | | (130.0) | | | (350.0) | | | (180.0) | |
| Proceeds from 364-day term loan facility | | — | | | — | | | 492.4 | |
| Repayments of 364-day term loan facility | | — | | | — | | | (458.8) | |
| Proceeds from senior unsecured notes | | — | | | — | | | 458.8 | |
| Debt issuance costs | | — | | | — | | | (6.1) | |
| Repayment of senior unsecured notes | | (400.0) | | | — | | | — | |
| Call redemption premium paid to note holders | | (9.5) | | | — | | | — | |
| Proceeds from issuance of shares | | 0.1 | | | — | | | — | |
| Repayment of finance lease obligations and borrowings | | (0.8) | | | (0.4) | | | — | |
| Dividends paid | | — | | | (158.6) | | | (172.1) | |
| Net cash (used in) provided by financing activities | | $ | (540.2) | | | $ | (179.0) | | | $ | 364.2 | |
| Effects of exchange rate changes on cash and cash equivalents, restricted cash and restricted cash - Asbestos | | $ | 6.3 | | | $ | (6.2) | | | $ | 6.6 | |
| Net increase (decrease) in cash and cash equivalents, restricted cash and restricted cash - Asbestos | | 132.6 | | | 62.2 | | | (189.6) | |
| Cash and cash equivalents, restricted cash and restricted cash - Asbestos at beginning of period | | 185.8 | | | 123.6 | | | 313.2 | |
| Cash and cash equivalents, restricted cash and restricted cash - Asbestos at end of period | | $ | 318.4 | | | $ | 185.8 | | | $ | 123.6 | |
| | | | | | |
| Non-Cash Investing and Financing Activities | | | | | | |
| Capital expenditures incurred but not yet paid | | $ | 18.0 | | | $ | 8.3 | | | $ | 25.9 | |
| | | | | | |
| Supplemental Disclosure of Cash Flow Activities | | | | | | |
| Cash paid during the year for interest, net of amounts capitalised | | $ | 46.9 | | | $ | 52.0 | | | $ | 51.6 | |
| Cash (refund) payment during the year for income taxes, net | | $ | (3.7) | | | $ | 52.5 | | | $ | 26.3 | |
| Cash paid to AICF | | $ | 153.3 | | | $ | 108.9 | | | $ | 103.0 | |
The accompanying notes are an integral part of these consolidated financial statements.
| | | | | | | | |
| FY 2021 Irish Statutory Accounts | | 19 |
James Hardie Industries plc
Consolidated Reconciliation of Movement in Shareholders’ Equity (Deficit)
| | | | | | | | | | | | | | | | | | | | | | | | | | | | | | | | | | | |
| (Millions of US dollars) | Called up
share
capital | | Share
premium | | Capital
redemption
reserve | | Retained earnings (deficit) | | Accumulated
other
comprehensive
loss | | Total |
| Balances as of 31 March 2018 | $ | 229.5 | | | $ | 189.6 | | | $ | 7.2 | | | $ | (646.5) | | | $ | (1.3) | | | $ | (221.5) | |
| | | | | | | | | | | |
| Net income | — | | | — | | | — | | | 234.6 | | | — | | | 234.6 | |
| Other comprehensive loss | — | | | — | | | — | | | — | | | (29.0) | | | (29.0) | |
| Stock-based compensation | 0.5 | | | 12.0 | | | — | | | — | | | — | | | 12.5 | |
Adoption of ASU 2016-16 | — | | | — | | | — | | | 1,160.3 | | | — | | | 1,160.3 | |
| Dividends declared | — | | | — | | | — | | | (176.7) | | | — | | | (176.7) | |
| Balances as of 31 March 2019 | $ | 230.0 | | | $ | 201.6 | | | $ | 7.2 | | | $ | 571.7 | | | $ | (30.3) | | | $ | 980.2 | |
| | | | | | | | | | | |
| Net income | — | | | — | | | — | | | 241.5 | | | — | | | 241.5 | |
| Other comprehensive loss | — | | | — | | | — | | | — | | | (31.8) | | | (31.8) | |
| Stock-based compensation | 0.6 | | | 9.7 | | | — | | | — | | | — | | | 10.3 | |
| Adoption of ASU 2016-02 | — | | | — | | | — | | | 0.2 | | | — | | | 0.2 | |
| Dividends declared | — | | | — | | | — | | | (159.3) | | | — | | | (159.3) | |
| Balances as of 31 March 2020 | $ | 230.6 | | | $ | 211.3 | | | $ | 7.2 | | | $ | 654.1 | | | $ | (62.1) | | | $ | 1,041.1 | |
| | | | | | | | | | | |
| Net income | — | | | — | | | — | | | $ | 262.8 | | | — | | | 262.8 | |
| Other comprehensive gain | — | | | — | | | — | | | — | | | 55.5 | | | 55.5 | |
| Stock-based compensation | 0.8 | | | 17.2 | | | — | | | — | | | — | | | 18.0 | |
| Issuance of ordinary shares | — | | | 0.1 | | | — | | | — | | | — | | | 0.1 | |
| Dividends declared | — | | | — | | | — | | | (310.9) | | | — | | | (310.9) | |
| Balances as of 31 March 2021 | $ | 231.4 | | | $ | 228.6 | | | $ | 7.2 | | | $ | 606.0 | | | $ | (6.6) | | | $ | 1,066.6 | |
The accompanying notes are an integral part of these consolidated financial statements.
| | | | | | | | |
| FY 2021 Irish Statutory Accounts | | 20 |
James Hardie Industries plc
Notes to Consolidated Financial Statements
1. Background and Basis of Presentation
Statement of Compliance
The financial statements of James Hardie Industries plc (“JHI plc” or the "Company") for the year ended 31 March 2021 were authorised for issue by the Board of Directors on 18 May 2021 and the balance sheet was signed on the Board’s behalf by Michael Hammes and Anne Lloyd. The Company is incorporated and domiciled in Ireland and the incorporation number is 485719.
These financial statements were prepared in accordance with the Companies Act 2014 (the “Companies Act”) and accounting principles generally accepted in the United States of America (“US GAAP”), modified to comply with specific provisions of Irish Company Law.
Nature of Operations
JHI plc manufactures and sells fiber cement, fiber gypsum and cement-bonded building products for interior and exterior building construction applications, primarily in the United States, Australia, Europe, New Zealand, the Philippines and Canada. On 3 April 2018, JHI plc completed the acquisition of German-based XI (DL) Holdings GmbH (n/k/a James Hardie Europe Holdings GmbH) and its subsidiaries (including, but not limited to, Fermacell GmbH (n/k/a James Hardie Europe GmbH)) (collectively, "Fermacell"). Fermacell manufactures and sells fiber gypsum and cement-bonded building products primarily in continental Europe.
Basis of Presentation
The consolidated financial statements represent the financial position, results of operations and cash flows of JHI plc and its wholly-owned subsidiaries and variable interest entity (“VIE”). Unless the context indicates otherwise, JHI plc and its direct and indirect wholly-owned subsidiaries and VIE (as of the time relevant to the applicable reference) are collectively referred to as “James Hardie”, the “James Hardie Group” or the “Company”.
The directors have elected to prepare the consolidated financial statements of the Company in accordance with Section 279 of the Companies Act 2014, which provides that a true and fair view of the state of affairs and profit or loss may be given by preparing the financial statements in accordance with US GAAP, as defined in Section 279(1) of the Companies Act 2014, to the extent that the use of those principles in the preparation of the financial statements does not contravene any provision of the Companies Act 2014 or of any regulations made thereunder.
These consolidated financial statements are prepared in accordance with Irish Company Law, to present to the shareholders of the Company and file with the Companies Registration Office in Ireland. Accordingly, these consolidated financial statements include presentation and additional disclosures required by the Republic of Ireland’s Companies Act 2014 in addition to those disclosures required under US GAAP.
| | | | | | | | |
| FY 2021 Irish Statutory Accounts | | 21 |
James Hardie Industries plc
Notes to Consolidated Financial Statements (continued)
Irish Company law requires that goodwill is written off over a period of time which does not exceed its useful economic life. However, we do not believe this gives a true and fair view as not all goodwill and intangible assets decline in value. In addition, since goodwill that does decline in value rarely does so on a straight-line basis, straight-line amortization of goodwill over an arbitrary period does not reflect the economic reality. Consistent with US GAAP, we consider goodwill an indefinite-lived intangible asset that is not amortized over an arbitrary period. Rather, we account for goodwill in accordance with US GAAP. Therefore, in order to present a true and fair view of the economic reality, goodwill is considered indefinite-lived and is not amortized. We are not able to reliably estimate the impact on the financial statements of the true and fair override on the basis that the useful economic life of goodwill cannot be predicted with a satisfactory level of reliability nor can the pattern in which goodwill diminishes be known.
Goodwill represents amounts paid for an acquisition in excess of the fair value of net assets received. We test goodwill for impairment annually, or more frequently if changes in circumstances or the occurrence of events suggest an impairment exists.
Differences in Presentation
The consolidated financial statements included in the Appendix to the Directors’ Report are prepared in accordance with US GAAP, and the Irish Statutory Accounts are modified to comply with Irish Company Law. Accordingly, there are differences in presentation on the consolidated statement of operations and comprehensive income, consolidated balance sheets, consolidated statements of cash flows and consolidated reconciliation of movement in shareholders’ equity (deficit).
Inventories
In connection with the preparation of the consolidated financial statements for the year ended 31 March 2021, the Company determined that the amounts previously reported in the notes to the consolidated financial statements for the year ended 31 March 2020 reflected an immaterial misclassification between work-in-process and raw materials and supplies within the inventories note.
This missclassification did not have an impact on the Company's consolidated balance sheets, statements of operations and comprehensive income, statements of cash flows or statements of changes in shareholders' equity (deficit) as of and for the year ended 31 March 2020.
As such, the Company has reclassified prior year amounts in its US GAAP consolidated financial statements in Section 2 of the Appendix to the Directors’ Report to conform with the current year presentation. No change was made to the inventories note in the Irish Statutory Accounts.
As a result of this adjustment within the inventories note in the Appendix to the Directors Report the 2020 amount for work-in-process is US$17.1 million lower and raw materials and supplies is US$17.1 million higher in the Irish Statutory Accounts compared to the US GAAP Consolidated Financial Statements in Section 2 of the Appendix to the Directors’ Report.
See Note 5 to the US GAAP consolidated financial statements in Section 2 of the Appendix to the Directors’ Report and Note 6 below.
| | | | | | | | |
| FY 2021 Irish Statutory Accounts | | 22 |
James Hardie Industries plc
Notes to Consolidated Financial Statements (continued)
Held for sale classification
In the Company’s US GAAP consolidated financial statements, net assets of US$0.4 million were moved to a held for sale account at 31 March 2020 which are included in current assets on the balance sheet of the US GAAP consolidated financial statements. The held for sale classification is not applicable under Irish Company Law, and as such, the net assets are presented under their relevant headings in the Irish Statutory accounts.
As a result of this adjustment, Property, plant and equipment, net in the Irish Statutory Accounts is higher by US$0.4 million and Debtors is lower by US$0.4 million compared to the US GAAP consolidated balance sheet at 31 March 2020.
Direct acquisition costs
During the year ended 31 March 2019, the Company paid direct costs of US$5.8 million to a third party as part of the acquisition of Fermacell GmbH (n/k/a James Hardie Europe GmbH). In the Company's US GAAP consolidated financial statements, these direct costs were expensed as transaction costs and were recorded in Selling, general and administrative expenses on the US GAAP consolidated statement of operations and comprehensive income. Direct costs directly attributable to an acquisition are required to be capitalized as Goodwill under Irish Company Law, and as such, these costs are being capitalized in the Irish Statutory accounts.
The impact on the consolidated financial statements was as follows:
| | | | | | | | | | | | | | | | | |
| Year ended 31 March 2021 |
| (Millions of US dollars) | As reported in Irish Statutory Accounts1 | | Adjustments | | As reported in US GAAP Consolidated Statement |
Goodwill1 | 215.1 | | 5.8 | | | 209.3 | |
Retained earnings 1,2 | 606.0 | | (5.8) | | | 611.4 | |
1 Difference due to treatment of direct acquisition costs paid by the Company during the year ended 31 March 2019 which will continue to exist in future fiscal years. For additional information, refer to Note 1 of the consolidated financial statements for the year ended 31 March 2019. |
2 The Retained earnings as reported in the Irish Statutory Accounts at 31 March 2021 includes adjustments in prior years of US$11.2 million that were recorded to modify the US GAAP financial statements in accordance with Irish Company Law. |
| | | | | | | | |
| FY 2021 Irish Statutory Accounts | | 23 |
James Hardie Industries plc
Notes to Consolidated Financial Statements (continued)
| | | | | | | | | | | | | | | | | |
| Year ended 31 March 2020 |
| (Millions of US dollars) | As reported in Irish Statutory Accounts1 | | Adjustments | | As reported in US GAAP Consolidated Statement |
Goodwill1 | 202.7 | | 5.8 | | | 196.9 | |
Retained earnings 1,2 | 654.1 | | (5.8) | | | 659.5 | |
1 Difference due to treatment of direct acquisition costs paid by the Company during the year ended 31 March 2019 which will continue to exist in future fiscal years. For additional information, refer to Note 1 of the consolidated financial statements for the year ended 31 March 2019. |
2 The Retained earnings as reported in the Irish Statutory Accounts at 31 March 2020 includes adjustments in prior years of US$11.2 million that were recorded to modify the US GAAP financial statements in accordance with Irish Company Law. |
| | | | | | | | | | | | | | | | | |
| Year ended 31 March 2019 |
| (Millions of US dollars) | As reported in Irish Statutory Accounts1 | | Fiscal Year 2019 Adjustments | | As reported in US GAAP Consolidated Statement |
| Selling, general and administrative expenses | 397.8 | | | (5.8) | | | 403.6 | |
| Net Income | 234.6 | | | 5.8 | | | 228.8 | |
Retained earnings 1,2 | 571.7 | | | (5.8) | | | 577.1 | |
1 Difference due to treatment of direct acquisition costs paid by the Company during the year ended 31 March 2019 which will continue to exist in future fiscal years. For additional information, refer to Note 1 of the consolidated financial statements for the year ended 31 March 2019. |
2 The Retained earnings as reported in the Irish Statutory Accounts at 31 March 2019 includes adjustments in prior years of US$11.2 million that were recorded to modify the US GAAP financial statements in accordance with Irish Company Law. |
Accounts payable and accrued liabilities and Purchases of property, plant and equipment
In connection with the preparation of the consolidated financial statements for the three months ended 30 June 2019, the Company determined that amounts previously reported in its consolidated statement of cash flows for the year ended 31 March 2019 reflected a misclassification which understated net cash used in investing activities with an equal understatement of net cash provided by operating activities for the year ended 31 March 2019.
This misclassification had no effect on the Company's consolidated balance sheets, statements of operations and comprehensive income or statements of changes in shareholders' equity (deficit) as of and for the year ended 31 March 2019.
As a result of this adjustment, the change in Accounts payable and accrued liabilities and Purchases of property, plant and equipment is lower by US$16.4 million for the year ended 31 March 2019, in the Irish Statutory Accounts compared to the US GAAP Consolidated Statements of Cash Flows in Section 2 of the Appendix to this Directors' Report.
| | | | | | | | |
| FY 2021 Irish Statutory Accounts | | 24 |
James Hardie Industries plc
Notes to Consolidated Financial Statements (continued)
2. Summary of Significant Accounting Policies
See Note 1 to the US GAAP consolidated financial statements in Section 2 of the Appendix to the Directors’ Report for the following significant accounting policies:
| | | | | | | | |
● Variable Interest Entities | | ● Accrued Product Warranties |
| |
● Use of Estimates | | ● Debt |
| |
● Foreign Currency Translation/ Remeasurement | | ● Revenue Recognition |
| |
● Restricted Cash and Cash Equivalents | | ● Income Taxes |
| |
● Accounts Receivables | | ● Financial Instruments |
| |
● Inventories | | ● Fair Value Measurements |
| |
● Property, Plant and Equipment | | ● Stock-Based Compensation |
| |
● Leases | | ● Asbestos-related Accounting Policies |
| |
● Depreciation and Amortisation | | ● Business Combination |
| |
● Goodwill and Other Intangible Assets | | ● Recent Accounting Pronouncements |
| |
● Impairment of Long-Lived Assets | | ● Earnings Per Share |
Accounting Principles
All subsidiaries and qualifying VIE are consolidated and all intercompany transactions and balances are eliminated. The US dollar is used as the reporting currency. See Note 1 to the US GAAP consolidated financial statements in Section 2 of the Appendix to the Directors’ Report for basis of presentation.
Distribution Costs
The Company includes distribution costs within cost of goods sold.
Research and Development
The Company expenses research and development costs when incurred. Research and development expenses were US$34.3 million, US$32.8 million and US$37.9 million during the years ended 31 March 2021, 2020 and 2019, respectively.
| | | | | | | | |
| FY 2021 Irish Statutory Accounts | | 25 |
James Hardie Industries plc
Notes to Consolidated Financial Statements (continued)
Asbestos
See Note 1 to the US GAAP consolidated financial statements in Section 2 to the Appendix to the Directors’ Report for all disclosures in this accounting policy with the exception of the disclosures under the Asbestos Injuries Compensation Fund (“AICF”) subheader below.
AICF
In February 2007, the Company’s shareholders approved a proposal pursuant to which the Company provides long-term funding to AICF. The Company owns 100% of the performing subsidiary that funds the AICF subject to the provisions of the Amended and Restated Final Funding Agreement (as amended from time to time, “AFFA”). The Company appoints three of the AICF directors and the NSW Government appoints two of the AICF directors.
Although the Company has no legal ownership in AICF, for financial reporting purposes, our interest in AICF is considered variable and we consolidate AICF since the Company appoints three out of the five AICF directors. The Company’s consolidation of AICF results in certain assets and liabilities being recorded on its consolidated balance sheets and certain income and expense transactions being recorded in the consolidated statements of operations and comprehensive income. These items are Australian dollar-denominated and are subject to remeasurement into US dollars at each reporting date.
For the years ended 31 March 2021 and 2020, the Company did not provide financial or other support to AICF that it was not previously contractually required to provide. Future funding of AICF by the Company continues to be linked under the terms of the AFFA to the Company’s long-term financial success, specifically the Company’s ability to generate net operating cash flow.
AICF has operating costs that are claims related and non-claims related. Claims related costs incurred by AICF are treated as reductions in the accrued asbestos liability balances previously reflected in the consolidated balance sheets. Non-claims related operating costs incurred by AICF are expensed as incurred in the line item Selling, general and administrative expenses in the consolidated statements of operations and comprehensive income. AICF earns interest on its cash and cash equivalents and on its short-term investments, which is included in the line item Interest income in the consolidated statements of operations and comprehensive income.
See Asbestos-related Accounting Policies in Note 1 to the US GAAP consolidated financial statements in Section 2 of the Appendix to the Directors’ Report. See Note 12 to the US GAAP consolidated financial statements in Section 2 of the Appendix to the Directors’ Report for further details on the related assets and liabilities recorded in the Company’s consolidated balance sheets under the terms of the AFFA.
Recent Accounting Pronouncements
See Note 1 to the US GAAP consolidated financial statements in Section 2 to the Appendix to the Directors’ Report.
| | | | | | | | |
| FY 2021 Irish Statutory Accounts | | 26 |
James Hardie Industries plc
Notes to Consolidated Financial Statements (continued)
3. Revenues
See Note 2 to the US GAAP consolidated financial statements in Section 2 of the Appendix to the Directors’ Report.
4. Cash and Cash Equivalents, Restricted Cash and Restricted Cash - Asbestos
See Note 3 to the US GAAP consolidated financial statements in Section 2 of the Appendix to the Directors’ Report and Note 25 below.
5. Accounts and Other Receivables
See Note 4 to the US GAAP consolidated financial statements in Section 2 of the Appendix to the Directors’ Report and Note 24 below.
6. Inventories
Inventories consist of the following components:
| | | | | | | | | | | |
| | 31 March |
| (Millions of US dollars) | 2021 | | 2020 |
| Finished goods | $ | 149.9 | | | $ | 224.4 | |
| Work-in-process | 17.9 | | | 8.1 | |
| Raw materials and supplies | 60.4 | | | 87.0 | |
| Provision for obsolete finished goods and raw materials | (9.9) | | | (14.4) | |
| Total inventories | $ | 218.3 | | | $ | 305.1 | |
7. Goodwill
See Note 1 and Note 6 to the US GAAP consolidated financial statements in Section 2 of the Appendix to the Directors’ Report and Note 1 above.
Irish Company law requires that goodwill is written off over a period of time which does not exceed its useful economic life. However, we do not believe this gives a true and fair view as not all goodwill and intangible assets decline in value. In addition, since goodwill that does decline in value rarely does so on a straight-line basis, straight-line amortization of goodwill over an arbitrary period does not reflect the economic reality. Consistent with US GAAP, we consider goodwill an indefinite-lived intangible asset that is not amortized over an arbitrary period. Rather, we account for goodwill in accordance with US GAAP. Therefore in order to present a true and fair view of the economic reality, goodwill is considered indefinite-lived and is not amortized. We are not able to reliably estimate the impact on the financial statements of the true and fair override on the basis that the useful economic life of goodwill cannot be predicted with a satisfactory level of reliability nor can the pattern in which goodwill diminishes be known.
Goodwill represents amounts paid for an acquisition in excess of the fair value of net assets received. We test goodwill for impairment annually, or more frequently if changes in circumstances or the occurrence of events suggest an impairment exists.
| | | | | | | | |
| FY 2021 Irish Statutory Accounts | | 27 |
James Hardie Industries plc
Notes to Consolidated Financial Statements (continued)
The following are the changes in goodwill:
| | | | | | | | | | | |
| 31 March |
| (Millions of US dollars) | 2021 | | 2020 |
| Balance at beginning of the period | $ | 202.7 | | | $ | 206.9 | |
| Impairment | — | | | (0.2) | |
| Foreign exchange impact | 12.4 | | | (4.0) | |
| Balance at end of period | $ | 215.1 | | | $ | 202.7 | |
During the fiscal year ended 31 March 2020, the Company recorded a US$0.2 million goodwill impairment charge in the Asia Pacific Fiber Cement segment due to Company's decision to exit the Ritek® wall systems business.
8. Intangible Assets
See Note 1 and and Note 6 to the US GAAP consolidated financial statements in Section 2 of the Appendix to the Directors’ Report.
The following are the changes in intangible assets:
| | | | | | | | | | | | | | | | | | | | | | | |
| Cost or Valuation | | | | | | | |
| (Millions of US dollars) | Trade
Names | | Customer
Relationships | | Other | | Total |
| Balance - 31 March 2020 | $ | 113.5 | | | $ | 51.4 | | | $ | 19.0 | | | $ | 183.9 | |
| Transfer | — | | | 0.8 | | | (0.8) | | | — | |
| Foreign exchange impact | 7.1 | | | 3.0 | | | — | | | 10.1 | |
| Balance - 31 March 2021 | $ | 120.6 | | | $ | 55.2 | | | $ | 18.2 | | | $ | 194.0 | |
| | | | | | | |
| Accumulated Depreciation | | | | | | | |
| Balance - 31 March 2020 | $ | — | | | $ | (6.4) | | | $ | (10.8) | | | $ | (17.2) | |
| Amortization | — | | | (2.6) | | | — | | | (2.6) | |
| Foreign exchange impact | — | | | (0.3) | | | — | | | (0.3) | |
| Balance - 31 March 2021 | $ | — | | | $ | (9.3) | | | $ | (10.8) | | | $ | (20.1) | |
| | | | | | | |
| Net carrying amount - 31 March 2020 | $ | 113.5 | | | $ | 45.0 | | | $ | 8.2 | | | $ | 166.7 | |
| | | | | | | |
| Net carrying amount - 31 March 2021 | $ | 120.6 | | | $ | 45.9 | | | $ | 7.4 | | | $ | 173.9 | |
| | | | | | | |
During the fiscal year ended 31 March 2020, the Company recorded total impairment charges on amortizable intangible assets of US$1.4 million in General Corporate costs due to Company's decision to exit the Ritek® wall systems business.
| | | | | | | | |
| FY 2021 Irish Statutory Accounts | | 28 |
James Hardie Industries plc
Notes to Consolidated Financial Statements (continued)
9. Property, Plant and Equipment
The Company capitalizes interest as part of the cost of construction of the property, plant and equipment using the weighted average interest rate of the Company’s debt, which is then depreciated on a straight-line basis over the assets’ useful lives. The amount of capitalized interest was US$9.5 million for the years ended 31 March 2021 and 2020. Further, see Note 7 to the US GAAP consolidated financial statements in Section 2 of the Appendix to the Directors’ Report and Note 1 above.
Property, plant and equipment consist of the following components:
| | | | | | | | | | | | | | | | | | | | | | | | | | | | | |
(Millions of US dollars) Cost or valuation: | Land | | Buildings | | Machinery
and
Equipment | | Construction
in
Progress 1 | | Total |
| At 31 March 2019 | $ | 83.8 | | | $ | 432.8 | | | $ | 1,507.6 | | | $ | 257.2 | | | $ | 2,281.4 | |
| Additions | 0.3 | | | 13.9 | | | 152.3 | | | 19.3 | | | 185.8 | |
| Transfers | — | | | 0.7 | | | 3.1 | | | (4.9) | | | (1.1) | |
Disposals 2 | — | | | (1.7) | | | (55.3) | | | 0.2 | | | (56.8) | |
| Impairments | — | | | (0.1) | | | (10.2) | | | (5.4) | | | (15.7) | |
| Exchange differences | (5.1) | | | (13.1) | | | (86.1) | | | 1.2 | | | (103.1) | |
| At 31 March 2020 | $ | 79.0 | | | $ | 432.5 | | | $ | 1,511.4 | | | $ | 267.6 | | | $ | 2,290.5 | |
| Additions | 1.8 | | | 68.1 | | | 230.8 | | | (170.8) | | | 129.9 | |
Disposals 2 | — | | | (1.3) | | | (41.4) | | | (4.5) | | | (47.2) | |
| Impairment | — | | | — | | | (2.0) | | | — | | | (2.0) | |
Adjustments 3 | (4.4) | | | 7.0 | | | 4.2 | | | 1.0 | | | 7.8 | |
| Exchange differences | 8.8 | | | 6.5 | | | 72.5 | | | (1.5) | | | 86.3 | |
| At 31 March 2021 | $ | 85.2 | | | $ | 512.8 | | | $ | 1,775.5 | | | $ | 91.8 | | | $ | 2,465.3 | |
| | | | | | | | | |
| Accumulated depreciation: | | | | | | | | | |
| At 31 March 2019 | $ | — | | | $ | (143.9) | | | $ | (749.1) | | | $ | — | | | $ | (893.0) | |
| Depreciation | — | | | (15.7) | | | (109.7) | | | — | | | (125.4) | |
| Transfers | — | | | — | | | 0.3 | | | — | | | 0.3 | |
Disposals 2 | — | | | 1.5 | | | 40.3 | | | — | | | 41.8 | |
| Impairments | — | | | (0.6) | | | (48.2) | | | — | | | (48.8) | |
| Exchange differences | — | | | 6.4 | | | 69.9 | | | — | | | 76.3 | |
| At 31 March 2020 | $ | — | | | $ | (152.3) | | | $ | (796.5) | | | $ | — | | | $ | (948.8) | |
| Depreciation | — | | | (15.6) | | | (114.0) | | | — | | | (129.6) | |
Disposals 2 | — | | | 0.9 | | | 31.2 | | | — | | | 32.1 | |
Adjustments 3 | — | | | (1.2) | | | (7.0) | | | — | | | (8.2) | |
| Exchange differences | — | | | (0.1) | | | (38.4) | | | — | | | (38.5) | |
| At 31 March 2021 | $ | — | | | $ | (168.3) | | | $ | (924.7) | | | $ | — | | | $ | (1,093.0) | |
| | | | | | | | | |
| Net book value amount: | | | | | | | | | |
| At 31 March 2020 | $ | 79.0 | | | $ | 280.2 | | | $ | 714.9 | | | $ | 267.6 | | | $ | 1,341.7 | |
| At 31 March 2021 | $ | 85.2 | | | $ | 344.5 | | | $ | 850.8 | | | $ | 91.8 | | | $ | 1,372.3 | |
| | | | | | | | |
| FY 2021 Irish Statutory Accounts | | 29 |
James Hardie Industries plc
Notes to Consolidated Financial Statements (continued)
______________
1Construction in progress is presented net of assets transferred into service. Transfers out of construction in progress in the fiscal year ended 31 March 2021 are primarily related to the commissioning of Prattville's first sheet machine of US$196.0 million.
2Includes US$10.6 million and US$11.7 million of usage of replacement parts for the fiscal years 31 March 2021 and 2020, respectively.
3The adjustments correct immaterial errors identified by management whereby certain amounts were misclassified by asset category.
10. Leases
See Note 1 and Note 8 to the US GAAP consolidated financial statements in Section 2 of the Appendix to the Directors’ Report.
11. Accounts Payable and Accrued Liabilities
See Note 9 to the US GAAP consolidated financial statements in Section 2 of the Appendix to the Directors’ Report and Note 26 below.
12. Long-Term Debt
See Note 10 to the US GAAP consolidated financial statements in Section 2 of the Appendix to the Directors’ Report.
13. Accrued Product Warranties
See Note 11 to the US GAAP consolidated financial statements in Section 2 of the Appendix to the Directors’ Report.
| | | | | | | | | | | |
| 31 March |
| (Millions of US dollars) | 2021 | | 2020 |
| Amounts falling due within one year | $ | 6.0 | | | $ | 7.0 | |
| Amounts falling due after more than one year | 33.6 | | | 35.4 | |
| Accrued product warranties | $ | 39.6 | | | $ | 42.4 | |
14. Asbestos
See Note 12 to the US GAAP consolidated financial statements in Section 2 of the Appendix to the Directors’ Report.
15. Derivative Instruments
See Note 13 to the US GAAP consolidated financial statements in Section 2 of the Appendix to the Directors’ Report.
| | | | | | | | |
| FY 2021 Irish Statutory Accounts | | 30 |
James Hardie Industries plc
Notes to Consolidated Financial Statements (continued)
16. Commitments and Contingencies
See Note 14 to the US GAAP consolidated financial statements in Section 2 of the Appendix to the Directors’ Report and “Legal Proceedings” in Section 3 of the Appendix to the Directors’ Report.
Section 357 Guarantee
Pursuant to the provisions of Section 357 of the Companies Act 2014, the Company has guaranteed the commitments entered into, including amounts shown as liabilities in the statutory financial statements of its wholly-owned subsidiary undertakings James Hardie International Holdings Limited, James Hardie Holdings Limited, James Hardie Technology Holdings 1 Limited and James Hardie Technology Holdings 2 Limited for the financial year ended 31 March 2021 and has met the other conditions set out in that section and, as a result, such subsidiary undertakings have been exempted from the filing provisions of Section 347 of the Companies Act 2014.
17. Income Taxes
See Note 1 and Note 15 to the US GAAP consolidated financial statements in Section 2 of the Appendix to the Directors’ Report.
Deferred tax assets and liabilities are reported in the following consolidated balance sheets captions in the amounts shown:
| | | | | | | | | | | |
| 31 March |
| (Millions of US dollars) | 2021 | | 2020 |
| Deferred income taxes included in debtors | $ | 1,274.2 | | | $ | 1,308.5 | |
| Deferred income taxes included in provisions | (86.3) | | | (81.9) | |
| Net deferred tax assets | $ | 1,187.9 | | | $ | 1,226.6 | |
Deferred income tax liability activity for the year ended 31 March 2021 is as follows:
| | | | | |
| |
| (Millions of US dollars) | |
| Balance as 31 March 2020 | $ | (81.9) | |
| Provisions, net | (4.4) | |
| Balance as 31 March 2021 | $ | (86.3) | |
| |
18. Stock-Based Compensation
See Note 16 to the US GAAP consolidated financial statements in Section 2 of the Appendix to the Directors’ Report.
| | | | | | | | |
| FY 2021 Irish Statutory Accounts | | 31 |
James Hardie Industries plc
Notes to Consolidated Financial Statements (continued)
19. Dividends
See Note 17 to the US GAAP consolidated financial statements in Section 2 of the Appendix to the Directors’ Report.
Dividends paid as disclosed in the consolidated statement of cash flows represents the value of dividends converted to US dollars at the exchange rate on the date of payment. Dividends declared as disclosed in the consolidated reconciliation of movements in shareholders’ equity (deficit) represents the US dollar value of dividends declared on the record date. The difference in the two values represents the change in foreign currency exchange rates between the record and payment dates.
20. Operating Segment Information and Concentrations of Risk
See Note 18 to the US GAAP consolidated financial statements in Section 2 of the Appendix to the Directors’ Report and Note 1 above.
21. Accumulated Other Comprehensive Loss
See Note 19 to the US GAAP consolidated financial statements in Section 2 of the Appendix to the Directors’ Report.
22. Employee Benefit Plan
See Note 20 to the US GAAP consolidated financial statements in Section 2 of the Appendix to the Directors’ Report.
23. Other income (expense)
Other income (expense) consists of the following components:
| | | | | | | | | | | | | | | | | |
| 31 March |
| (Millions of US dollars) | 2021 | | 2020 | | 2019 |
| Gain on interest rate swaps | $ | 0.1 | | | $ | (0.1) | | | $ | 0.1 | |
| | | | | |
| Other income (expense) | $ | 0.1 | | | $ | (0.1) | | | $ | 0.1 | |
| | | | | | | | |
| FY 2021 Irish Statutory Accounts | | 32 |
James Hardie Industries plc
Notes to Consolidated Financial Statements (continued)
24. Debtors
| | | | | | | | | | | | | | | | | |
| | | 31 March |
| (Millions of US dollars) | Notes | | 2021 | | 2020 |
| Amounts falling due within one year: | | | | | |
| Accounts and other receivables, net of allowance for | | | | | |
| doubtful accounts of US$6.1 million and US$4.4 million | | | | | |
| as of 31 March 2021 and 31 March 2020, respectively | 5 | | $ | 333.2 | | | $ | 363.3 | |
| Prepaid expenses and other current assets | | | 38.9 | | | 25.7 | |
| Insurance receivable - Asbestos | 14 | | 6.6 | | | 5.0 | |
| Workers' compensation - Asbestos | 14 | | 1.6 | | | 1.5 | |
| | | 380.3 | | | 395.5 | |
| | | | | |
| Amounts falling due after more than one year: | | | | | |
| Insurance receivable - Asbestos | 14 | | 42.9 | | | 38.5 | |
| Workers' compensation - Asbestos | 14 | | 20.3 | | | 20.7 | |
| Deferred income taxes | 17 | | 906.8 | | | 989.4 | |
| Deferred income taxes - Asbestos | 14,17 | | 367.4 | | | 319.1 | |
| Other assets | | | 3.4 | | | 4.7 | |
| | | 1,340.8 | | | 1,372.4 | |
| | | $ | 1,721.1 | | | $ | 1,767.9 | |
25. Investments
Investments consist of the following components:
| | | | | | | | | | | | | | | | | |
| | | 31 March |
| (Millions of US dollars) | Notes | | 2021 | | 2020 |
| Amounts falling due within one year: | | | | | |
| Restricted cash and cash equivalents | 4 | | $ | 5.0 | | | $ | 5.0 | |
| Restricted cash and cash equivalents - Asbestos | 4,14 | | 104.9 | | | 36.4 | |
Restricted short-term investments - Asbestos1 | 14 | | 26.6 | | | 21.6 | |
| | | $ | 136.5 | | | $ | 63.0 | |
_________________
1 All investments are marked-to-market. See Note 12 to the US GAAP consolidated financial statements in Section 2 of the Appendix to the Directors’ Report for additional information.
| | | | | | | | |
| FY 2021 Irish Statutory Accounts | | 33 |
James Hardie Industries plc
Notes to Consolidated Financial Statements (continued)
26. Creditors
| | | | | | | | | | | | | | | | | |
| | | 31 March |
| (Millions of US dollars) | Notes | | 2021 | | 2020 |
| Amounts falling due within one year: | | | | | |
| Accounts payable and accrued liabilities | 11 | | $ | 307.0 | | | $ | 274.7 | |
| Accrued payroll and employee benefits | | | 112.5 | | | 87.1 | |
| Dividend payable | | | 303.7 | | | — | |
| Income taxes payable | 17 | | 6.6 | | | 8.9 | |
| Other liabilities | | | 32.7 | | | 12.1 | |
| | | 762.5 | | | 382.8 | |
| Amounts falling due after more than one year: | | | | | |
| Income taxes payable | 17 | | 4.7 | | | 21.3 | |
| Other liabilities | | | 54.8 | | | 43.7 | |
| | | $ | 822.0 | | | $ | 447.8 | |
27. Called up Share Capital
At 31 March 2021 and 2020, the Company had 2.0 billion shares of common stock at Euro 0.59 par value authorised. The amount of common stock issued at 31 March 2021 and 2020 was 444,288,874 shares and 443,144,740 shares, respectively.
During fiscal year 2021, the Company issued 1.1 million shares under incentive plans.
28. Employees
The average number of persons employed by the Company, excluding non-executive directors, during each fiscal year was as follows:
| | | | | | | | | | | | | | | | | |
| Years Ended 31 March |
| 2021 | | 2020 | | 2019 |
| North America Fibre Cement | 2,662 | | 2,563 | | 2,592 |
| Asia Pacific Fibre Cement | 1,044 | | 1,117 | | 1,093 |
| Europe Building Products | 937 | | 972 | | 994 |
Other Businesses1 | — | | | — | | 19 |
| Research and Development | 155 | | 156 | | 159 |
| Corporate | 63 | | 61 | | 59 |
| 4,861 | | 4,869 | | 4,916 |
| | | | | |
1 Effective 31 March 2020 the Other Businesses segment no longer qualifies as a reportable segment. |
| | | | | | | | |
| FY 2021 Irish Statutory Accounts | | 34 |
James Hardie Industries plc
Notes to Consolidated Financial Statements (continued)
Employee costs during each fiscal year consist of the following:
| | | | | | | | | | | | | | | | | |
| Years Ended 31 March |
| (Millions of US dollars) | 2021 | | 2020 | | 2019 |
| Wages and salaries | $ | 377.7 | | | $ | 386.5 | | | $ | 376.7 | |
| Equity awards | 39.7 | | | 13.1 | | | 11.9 | |
| Social security costs | 32.4 | | | 31.8 | | | 31.9 | |
| Pension and postretirement costs | 17.7 | | | 18.6 | | | 18.8 | |
| $ | 467.5 | | | $ | 450.0 | | | $ | 439.3 | |
29. Directors’ Remuneration
See “Remuneration – Remuneration for Non-Executive Directors” in Section 1 of the Appendix to the Directors’ Report for details of the director fees to both the executive and non-executive directors.
Employment Agreement with Dr Jack Truong
Dr Truong is the only director with an employment agreement at 31 March 2021. See section “Remuneration – Employment and Severance Arrangements” in Section 1 of the Appendix to the Directors’ Report for details of the terms of the CEO’s employment contract. In addition, Dr Truong also receives ‘Other’ benefits described in the summary of employment agreements for senior executives in “Remuneration” in Section 1 of the Appendix to the Directors’ Report.
30. Auditor’s Remuneration
See “Remuneration of Independent Registered Public Accounting Firm” in Section 2 of the Appendix to the Directors’ Report. In addition, a portion of the total auditor’s remuneration includes amounts paid to the Ernst & Young Irish firm. See Note 14 to the JHI plc company financial statements for further information.
31. Related Party Transactions
Other than the compensation arrangements with our executive officers and directors, the Company has not entered any other related party transactions requiring disclosure during fiscal year 2021. See “Directors, Senior Management and Employees – Remuneration Report” in Section 1 of the Appendix to the Directors’ Report. See also “Corporate Governance Report - Director Independence” in Section 1 of the Appendix to the Directors’ Report for the Company’s consideration of Director Independence.
32. Subsequent Events
Subsequent to 31 March 2021, the Company paid US$309.6 million as a special dividend of US70.0 cents per security which was announced on 10 February 2021.
Subsequent to 31 March 2021, the Company has drawn US$110.0 million from the unsecured revolving credit facility.
| | | | | | | | |
| FY 2021 Irish Statutory Accounts | | 35 |
James Hardie Industries plc
Notes to Consolidated Financial Statements (continued)
33. Investments in Group Undertakings
The Company’s investments in group undertakings are listed below. Unless noted herein, all subsidiaries are wholly-owned by JHI plc, either directly or indirectly as of 31 March 2021.
| | | | | | | | | | | | | | |
| Name | Nature of Business | Registered Address | Country of
Incorporation | Jurisdiction of
Tax Residence |
| Ajempa Holdings Inc. (Minority Interest of 40%) | Trading | Brgy. San Isidro, Cabuyao, Laguna 4025, Philippines | Philippines | Philippines |
| James Hardie 117 Pty Ltd | Non-operating | Level 20, 60 Castlereagh Street, Sydney NSW 2000, Australia | Australia | Australia |
| James Hardie Acquisition Co., LLC | Inactive subsidiary | 26300 La Alameda, Suite 400, Mission Viejo, CA 92691 | USA | USA |
| James Hardie Australia Finance Pty Ltd | Non-operating | Level 20, 60 Castlereagh Street, Sydney NSW 2000, Australia | Australia | Australia |
| James Hardie Australia Pty Ltd | Trading and Manufacturing | Level 20, 60 Castlereagh Street, Sydney NSW 2000, Australia | Australia | Australia |
| James Hardie Bâtiment SAS | Trading | 6, Place de la Madeleine, 75008 Paris, France | France | France |
| James Hardie Building Products Canada Inc | Trading | c/o McMillan LLP, Brookfield Place, 181 Bay Street, Suite 4400 Toronto, Ontario, Canada M5J 2T3 | Canada | Canada |
| James Hardie Building Products Inc | Trading and Manufacturing | 26300 La Alameda, Suite 400, Mission Viejo, CA 92691 | USA | USA |
| James Hardie Building Products Limited | Trading | One Fleet Place, London, EC4M 7WS, United Kingdom | United Kingdom | United Kingdom |
| James Hardie Europe B.V. | Trading | Radarweg 60, 1043 NT Amsterdam, The Netherlands | Netherlands | Netherlands |
| James Hardie Europe Holdings GmbH | Holding | Bennigsen-Platz 1, Düsseldorf, 40474, Germany | Germany | Germany |
| James Hardie Europe GmbH | Trading and Manufacturing | Bennigsen-Platz 1, Düsseldorf, 40474, Germany | Germany | Germany |
| Fermacell B.V. | Trading and Manufacturing | Loonse Waard 20, 6606 KG Niftrik, Netherlands | Netherlands | Netherlands |
| James Hardie France SAS | Trading | 30 rue de L'industrie, 92500 Rueil-Malmaison, France | France | France |
| Fermacell Schraplau GmbH | Manufacturing | Bennigsen-Platz 1, Düsseldorf, 40474, Germany | Germany | Germany |
| James Hardie Spain S.L.U. | Trading and Manufacturing | Barrio de la Estación s/n, Orejo, Marina de Cudeyo 39719, Cantabria, Spain | Spain | Spain |
| James Hardie Holdings Limited | Holding | Europa House, 2nd Floor, Harcourt Centre, Harcourt Street, Dublin 2, D02 WR20, Ireland | Ireland | Ireland |
| James Hardie Insurance Ltd | Insurance | Mill Court, La Charroterie, St. Peter Port, Guernsey, Channel Islands | Guernsey | Guernsey |
| James Hardie International Finance Designated Activity Company | Treasury | Europa House, 2nd Floor, Harcourt Centre, Harcourt Street, Dublin 2, D02 WR20, Ireland | Ireland | Ireland |
| James Hardie International Group Limited | Holding | Europa House, 2nd Floor, Harcourt Centre, Harcourt Street, Dublin 2, D02 WR20, Ireland | Ireland | Ireland |
| James Hardie International Holdings Limited | Holding | Europa House, 2nd Floor, Harcourt Centre, Harcourt Street, Dublin 2, D02 WR20, Ireland | Ireland | Ireland |
| James Hardie New Zealand Limited | Trading and Manufacturing | c/o TMF Group, Level 12, 55 Shortland Street, Auckland, 1010, New Zealand | New Zealand | New Zealand |
| James Hardie NL1 B.V. | Holding | Radarweg 60, 1043 NT Amsterdam, The Netherlands | Netherlands | Netherlands |
| James Hardie NL2 B.V. | Holding | Radarweg 60, 1043 NT Amsterdam, The Netherlands | Netherlands | Netherlands |
| James Hardie NL3 B.V. | Holding | Radarweg 60, 1043 NT Amsterdam, The Netherlands | Netherlands | Netherlands |
| James Hardie North America, Inc | Holding | 26300 La Alameda, Suite 400, Mission Viejo, CA 92691 | USA | USA |
| James Hardie N.V. | Holding | Gustav Mahlerlaan 42, 1082 MC Amsterdam, The Netherlands | Netherlands | Netherlands |
| James Hardie NZ Holdings Limited | Holding | c/o TMF Group, Level 12, 55 Shortland Street, Auckland, 1010, New Zealand | New Zealand | New Zealand |
| James Hardie Philippines Inc | Trading and Manufacturing | Brgy. San Isidro, Cabuyao, Laguna 4025, Philippines | Philippines | Philippines |
| James Hardie Research (Holdings) Pty Ltd | Holding | Level 20, 60 Castlereagh Street, Sydney NSW 2000, Australia | Australia | Australia |
| James Hardie Research Pty Ltd | Research and development | Level 20, 60 Castlereagh Street, Sydney NSW 2000, Australia | Australia | Australia |
| James Hardie Systems Pty Ltd | Trading and Manufacturing | Level 20, 60 Castlereagh Street, Sydney NSW 2000, Australia | Australia | Australia |
| James Hardie Technology Holdings 1 Limited | Holding | Europa House, 2nd Floor, Harcourt Centre, Harcourt Street, Dublin 2, D02 WR20, Ireland | Ireland | Ireland |
| James Hardie Technology Holdings 2 Limited | Holding | Europa House, 2nd Floor, Harcourt Centre, Harcourt Street, Dublin 2, D02 WR20, Ireland | Ireland | Ireland |
| James Hardie Technology Limited | Intellectual Property | c/o Conyers Dill and Pearman, Clarendon House, 2 Church Street, Hamilton HM11, Bermuda | Bermuda | Ireland |
| James Hardie US Investments Sierra Inc. | Holding | 26300 La Alameda, Suite 400, Mission Viejo, CA 92691 | USA | USA |
| JH Research USA, LLC | Research and development | 231 South La Salle Streeet, Suite 2000, Chicago IL 60604 | USA | USA |
| NV Technology Holdings, A Limited Partnership | Intellectual Property | Level 29, 530 Collins Street, Melbourne, VIC 3000, Australia | Australia | Australia |
| RCI Holdings Pty Ltd | Holding | Level 20, 60 Castlereagh Street, Sydney NSW 2000, Australia | Australia | Australia |
| RCI Pty Ltd | Inactive subsidiary | Level 20, 60 Castlereagh Street, Sydney NSW 2000, Australia | Australia | Australia |
| Siding Solutions Center LLC | Inactive subsidiary | 26300 La Alameda, Suite 400, Mission Viejo, CA 92691 | USA | USA |
| Studorp Ltd | Trading | c/o TMF Group, Level 12, 55 Shortland Street, Auckland, 1010, New Zealand | New Zealand | New Zealand |
| Victorville Industrial Minerals LLC | Inactive subsidiary | 26300 La Alameda, Suite 400, Mission Viejo, CA 92691 | USA | USA |
| SNC Parc 3 | Holding | 10 rue de Schumann, Parc d'Activités, 68870 Bartenheim, France | France | France |
| | | | | | | | |
| FY 2021 Irish Statutory Accounts | | 36 |
James Hardie Industries plc
Notes to Consolidated Financial Statements (continued)
34. Profit Attributable to James Hardie Industries plc
In accordance with Section 304 of the Companies Act 2014, the Company is availing of the exemption from presenting the individual Statement of Comprehensive Income to the annual general meeting and from filing it with the Registrar of Companies. JHI plc’s profit for the year ended 31 March 2021 was US$321.3 million (2020: US$155.7 million).
35. Approval of Financial Statements
The consolidated financial statements have been approved and authorised for issue by the Board of Directors of the Company.
36. General information
| | | | | |
Registered No. 485719
Registered Office Europa House, 2nd Floor Harcourt Centre Harcourt Street, Dublin 2 D02 WR20 Ireland
Non-Executive Directors Michael Hammes, USA (Chairman) Andrea Gisle Joosen, Sweden Anne Lloyd, USA Brian Anderson, USA (retired as a director 5 November 2020) David Harrison, USA Dean Seavers, USA (appointed as a director 4 February 2021) Harold Wiens, USA (appointed as a director 14 May 2020) Moe Nozari, USA Nigel Stein, United Kingdom (appointed as a director 14 May 2020) Persio Lisboa, USA Rada Rodriguez, Sweden Russell Chenu, Australia (retired as a director 5 November 2020) Suzanne Rowland, USA (appointed as a director 4 February 2021)
Executive Director Jack Truong, USA
|
Statutory Auditors Ernst & Young Harcourt Centre Harcourt Street Dublin 2 D02 YA40, Ireland
Solicitors Arthur Cox Ten Earlsfort Terrace Dublin 2, D02 T380 Ireland
Company Secretary Joseph C. Blasko |
| | | | | | | | |
| FY 2021 Irish Statutory Accounts | | 37 |
James Hardie Industries plc
Glossary of Abbreviations and Terms
Abbreviations
| | | | | | | | |
| 2001 Plan | | 2001 Equity Incentive Plan |
| ADR | | American Depositary Receipt |
| ADS | | American Depositary Share |
| AFFA | | Amended and Restated Final Funding Agreement, as amended from time to time |
| AGM | | Annual General Meeting |
| AICF | | Asbestos Injuries Compensation Fund |
| ASIC | | Australian Securities and Investments Commission |
| ASU | | Accounting Standards Update |
| ASX | | Australian Securities Exchange |
| ATO | | Australian Taxation Office |
| CDN | | CHESS Depositary Nominees Pty Ltd |
| CEO | | Chief Executive Officer |
| CFO | | Chief Financial Officer |
| CHESS | | Clearing House Electronic Subregister System |
| Commonwealth | | The Commonwealth of Australia |
| CP Plan | | Company Performance Plan |
| CUFS | | CHESS Units of Foreign Securities |
| EPS | | Earnings Per Share |
| FASB | | Financial Accounting Standards Board |
| GEM | | Global Exchange Market |
| IP Plan | | Individual Performance Plan |
| IRS | | United States Internal Revenue Service |
| KPMGA | | KPMG Actuarial |
| LIBOR | | London Interbank Offered Rate |
| LOB | | Limitation on Benefits |
| LTI | | Long-Term Incentive |
| LTIP | | Long-Term Incentive Plan 2006 |
| NAHB | | National Association of Home Builders |
| NBSK | | Northern Bleached Softwood Kraft, the Company’s benchmark grade of pulp relative to our US business |
| NSW | | New South Wales |
| NYSE | | New York Stock Exchange |
| OSHA | | United States Occupational Safety and Health Administration |
| PEL | | Permissible Exposure Limit |
| R&D | | Research and Development |
| ROCE | | Return on Capital Employed |
| RSU | | Restricted Stock Unit |
| SEC | | United States Securities and Exchange Commission |
| SG&A | | Selling, General and Administrative |
| STI | | Short-Term Incentive |
| TSR | | Total Shareholder Return |
Former James Hardie Companies – Consists of Amaca Pty Ltd, Amaba Pty Ltd and ABN 60 Pty Ltd.
| | | | | | | | |
| FY 2021 Irish Statutory Accounts | | 38 |
James Hardie Industries plc
Glossary of Abbreviations and Terms (continued)
Terms
Sales volume
mmsf – million square feet, where a square foot is defined as a standard square foot of 5/16” thickness.
msf – thousand square feet, where a square foot is defined as a standard square foot of 5/16” thickness.
Financial measures – Irish Company Law equivalents
Net sales – is equivalent to the Irish Company Law measure of turnover.
Income (loss) before income taxes – is equivalent to the Irish Company Law measure of Profit (loss) on ordinary activities before taxation.
Income tax benefit (expense) – is equivalent to the Irish Company Law measure of taxation.
Net income (loss) – is equivalent to the Irish Company Law measure of Profit (loss) for the financial year.
Inventories – is equivalent to the Irish Company Law measure of stocks.
Retained earnings (deficit) – is equivalent to the Irish Company Law measure of Profit and loss account under Shareholders’ Equity.
Accumulated other comprehensive income (loss) – is equivalent to the Irish Company Law measure of Other reserves.
| | | | | | | | |
| FY 2021 Irish Statutory Accounts | | 39 |
James Hardie Industries plc
Forward-Looking Statements
This Annual Report contains forward-looking statements. James Hardie Industries plc (the “Company”) may from time to time make forward-looking statements in its periodic reports filed with or furnished to the Securities and Exchange Commission, on Forms 20-F and 6-K, in its annual reports to shareholders, in offering circulars, invitation memoranda and prospectuses, in media releases and other written materials and in oral statements made by the Company’s officers, directors or employees to analysts, institutional investors, existing and potential lenders, representatives of the media and others. Statements that are not historical facts are forward-looking statements and such forward-looking statements are statements made pursuant to the Safe Harbor Provisions of the Private Securities Litigation Reform Act of 1995.
Examples of forward-looking statements include:
▪statements about the Company’s future performance;
▪projections of the Company’s results of operations or financial condition;
▪statements regarding the Company’s plans, objectives or goals, including those relating to strategies, initiatives, competition, acquisitions, dispositions and/or its products;
▪expectations concerning the costs associated with the suspension or closure of operations at any of the Company’s plants and future plans with respect to any such plants;
▪expectations concerning the costs associated with the significant capital expenditure projects at any of the Company’s plants and future plans with respect to any such projects;
▪expectations regarding the extension or renewal of the Company’s credit facilities including changes to terms, covenants or ratios;
▪expectations concerning dividend payments and share buy-backs;
▪statements concerning the Company’s corporate and tax domiciles and structures and potential changes to them, including potential tax charges;
▪uncertainty from the expected discontinuance of LIBOR and transition to any other interest rate benchmark;
▪statements regarding the effect and consequences of the COVID-19 public health crisis;
▪statements regarding tax liabilities and related audits, reviews and proceedings;
▪statements regarding the possible consequences and/or potential outcome of legal proceedings brought against us and the potential liabilities, if any, associated with such proceedings
▪expectations about the timing and amount of contributions to Asbestos Injuries Compensation Fund (AICF), a special purpose fund for the compensation of proven Australian asbestos-related personal injury and death claims;
▪expectations concerning the adequacy of the Company’s warranty provisions and estimates for future warranty-related costs;
▪statements regarding the Company’s ability to manage legal and regulatory matters (including but not limited to product liability, environmental, intellectual property and competition law matters) and to resolve any such pending legal and regulatory matters within current estimates and in anticipation of certain third-party recoveries; and
▪statements about economic or housing market conditions in the regions in which we operate, including but not limited to, the levels of new home construction and home renovations, unemployment levels, changes in consumer income, changes or stability in housing values, the availability of mortgages and other financing, mortgage and other interest rates, housing affordability and supply, the levels of foreclosures and home resales, currency exchange rates, and builder and consumer confidence.
Words such as “believe,” “anticipate,” “plan,” “expect,” “intend,” “target,” “estimate,” “project,” “predict,” “forecast,” “guideline,” “aim,” “will,” “should,” “likely,” “continue,” “may,” “objective,” “outlook” and similar expressions are intended to identify forward-looking statements but are not the exclusive means of identifying such statements. Readers are cautioned not to place undue reliance on these forward-looking statements and all such forward-looking statements are qualified in their entirety by reference to the following cautionary statements.
| | | | | | | | |
| FY 2021 Irish Statutory Accounts | | 40 |
James Hardie Industries plc
Forward-Looking Statements (continued)
Forward-looking statements are based on the Company’s current expectations, estimates and assumptions and because forward-looking statements address future results, events and conditions, they, by their very nature, involve inherent risks and uncertainties, many of which are unforeseeable and beyond the Company’s control. Such known and unknown risks, uncertainties and other factors may cause actual results, performance or other achievements to differ materially from the anticipated results, performance or achievements expressed, projected or implied by these forward-looking statements. These factors, some of which are discussed under “Risk Factors” in Section 3 of the Form 20-F filed with the Securities and Exchange Commission on 18 May 2021, include, but are not limited to: all matters relating to or arising out of the prior manufacture of products that contained asbestos by current and former Company subsidiaries; required contributions to AICF, any shortfall in AICF funding and the effect of currency exchange rate movements on the amount recorded in the Company’s financial statements as an asbestos liability; compliance with and changes in tax laws and treatments; competition and product pricing in the markets in which the Company operates; the consequences of product failures or defects; exposure to environmental, asbestos, putative consumer class action or other legal proceedings; general economic and market conditions; the supply and cost of raw materials; possible increases in competition and the potential that competitors could copy the Company’s products; compliance with and changes in environmental and health and safety laws; risks of conducting business internationally; compliance with and changes in laws and regulations; currency exchange risks; dependence on customer preference and the concentration of the Company’s customer base; dependence on residential and commercial construction markets; the effect of adverse changes in climate or weather patterns; use of accounting estimates; risk and uncertainties arising out of the COVID-19 public health crisis, including the impact of COVID-19 on our business, sales, results of operations and financial condition and all other risks identified in the Company’s reports filed with Australian, Irish and US securities regulatory agencies and exchanges (as appropriate). The Company cautions you that the foregoing list of factors is not exhaustive and that other risks and uncertainties may cause actual results to differ materially from those referenced in the Company’s forward-looking statements. Forward-looking statements speak only as of the date they are made and are statements of the Company’s current expectations concerning future results, events and conditions. The Company assumes no obligation to update any forward-looking statements or information except as required by law.
| | | | | | | | |
| FY 2021 Irish Statutory Accounts | | 41 |
James Hardie Industries plc
Company Balance Sheet
As at 31 March 2021
| | | | | | | | | | | | | | | | | |
| | | | | |
| Notes | | 31 March 2021
US$ millions | | 31 March 2020
US$ millions |
| FIXED ASSETS | | | | | |
| Financial fixed assets | 5 | | 3,375.2 | | | 3,358.7 | |
| | | 3,375.2 | | | 3,358.7 | |
| | | | | |
| CURRENT ASSETS | | | | | |
| Debtors | 6 | | 329.1 | | | 4.9 | |
| Cash at bank and in hand | | | 0.1 | | | 0.1 | |
| | | 329.2 | | | 5.0 | |
| | | | | |
| CREDITORS | | | | | |
| -amounts falling due within one year | 7 | | (318.2) | | | (6.9) | |
| NET CURRENT ASSETS / (LIABILITIES) | | | 11.0 | | | (1.9) | |
| | | | | |
| CREDITORS | | | | | |
| -amounts falling due after more than one year | 7 | | (6.5) | | | (5.6) | |
| NET ASSETS | | | 3,379.7 | | | 3,351.2 | |
| | | | | |
| CAPITAL AND RESERVES | | | | | |
| Called-up share capital presented as equity | 9 | | 231.4 | | | 230.6 | |
| Capital redemption reserve | 9 | | 7.2 | | | 7.2 | |
| Share premium | 9 | | 77.9 | | | 77.8 | |
| Other reserves | 9 | | 127.2 | | | 110.0 | |
| Profit and loss account | 9 | | 2,936.0 | | | 2,925.6 | |
| SHAREHOLDERS' FUNDS | | | 3,379.7 | | | 3,351.2 | |
| | | | | |
| The company profit for the year was US$321.3 million (2020: US$155.7 million). | | |
The financial statements were approved by the Board of Directors on 18 May 2021 and signed on its behalf by:
| | | | | | | | |
| /s/ Michael Hammes | | /s/ Anne Lloyd |
| Michael Hammes | | Anne Lloyd |
| | | | | | | | |
| FY 2021 Irish Statutory Accounts | | 42 |
James Hardie Industries plc
Company Statement of Changes in Equity
As of 31 March 2021
As at 31 March 2021:
| | | | | | | | | | | | | | | | | | | | | | | | | | | | | | | | | | | |
| Called-up share capital US$ millions | | Capital redemption reserve US$ millions | | Share premium US$ millions | | Other reserves US$ millions | | Profit and loss account US$ millions | | Total US$ millions |
| Balance 31 March 2020 | 230.6 | | | 7.2 | | | 77.8 | | | 110.0 | | | 2,925.6 | | | 3,351.2 | |
| Profit for the financial year | — | | | — | | | — | | | — | | | 321.3 | | | 321.3 | |
Other comprehensive income | — | | | — | | | — | | | — | | | — | | | — | |
| Total comprehensive income | — | | | — | | | — | | | — | | | 321.3 | | | 321.3 | |
| Share-based payment transactions | 0.8 | | | — | | | — | | | 17.2 | | | — | | | 18.0 | |
| Issue of ordinary shares | — | | | — | | | 0.1 | | | — | | | — | | | 0.1 | |
| Dividends declared | — | | | — | | | — | | | — | | | (310.9) | | | (310.9) | |
| Balance 31 March 2021 | 231.4 | | | 7.2 | | | 77.9 | | | 127.2 | | | 2,936.0 | | | 3,379.7 | |
As at 31 March 2020:
| | | | | | | | | | | | | | | | | | | | | | | | | | | | | | | | | | | |
| Called-up share capital US$ millions | | Capital redemption reserve US$ millions | | Share premium US$ millions | | Other reserves US$ millions | | Profit and loss account US$ millions | | Total US$ millions |
| Balance 31 March 2019 | 230.0 | | | 7.2 | | | 77.8 | | | 100.3 | | | 2,929.2 | | | 3,344.5 | |
| Profit for the financial year | — | | | — | | | — | | | — | | | 155.7 | | | 155.7 | |
Other comprehensive income | — | | | — | | | — | | | — | | | — | | | — | |
| Total comprehensive income | — | | | — | | | — | | | — | | | 155.7 | | | 155.7 | |
| Share-based payment transactions | 0.6 | | | — | | | — | | | 9.7 | | | — | | | 10.3 | |
| Dividends declared | — | | | — | | | — | | | — | | | (159.3) | | | (159.3) | |
| Balance 31 March 2020 | 230.6 | | | 7.2 | | | 77.8 | | | 110.0 | | | 2,925.6 | | | 3,351.2 | |
| | | | | | | | |
| FY 2021 Irish Statutory Accounts | | 43 |
James Hardie Industries plc
Notes to Company Financial Statements
1. Statement of Compliance
The financial statements of James Hardie Industries plc (“JHI plc” or the “Parent Company”) for the year ended 31 March 2021 were authorised for issue by the Board of Directors on 18 May 2021 and the balance sheet was signed on the Board’s behalf by Michael Hammes and Anne Lloyd. JHI plc is incorporated and domiciled in Ireland and the incorporation number is 485719.
These financial statements were prepared in accordance with Financial Reporting Standard 101 Reduced Disclosure Framework (“FRS 101”) and in accordance with applicable accounting standards.
JHI plc’s financial statements are presented in US Dollar and all values are rounded to the nearest million except when otherwise indicated.
The accounting records are maintained at the Company’s registered office at Europa House, 2nd Floor, Harcourt Centre, Harcourt Street, Dublin 2, D02 WR20.
2. Background and Basis of Presentation
The principal activity of James Hardie Industries plc (JHI plc) is an investment holding company. JHI plc is the ultimate parent company of subsidiaries that manufactures and sells fiber cement, fiber gypsum and cement-bonded building products for interior and exterior building construction applications, primarily in the United States, Australia, Europe, New Zealand, the Philippines and Canada.
JHI plc is registered and domiciled in Ireland and is subject to Irish law as well as relevant European Union Council Regulations and relevant European Union Directives.
JHI plc continues to operate under the regulatory requirements of numerous jurisdictions and organisations, including the Australian Securities Exchange (“ASX”), Australian Securities and Investments Commission (“ASIC”), the New York Stock Exchange (“NYSE”), the United States Securities and Exchange Commission (“SEC”), the Irish Takeovers Panel, and various other rulemaking bodies. The Company became Irish tax resident on 29 June 2010.
JHI plc was in a net current asset position of US$11.0 million and a net currently liability position of US$1.9 million at 31 March 2021 and 2020, respectively. The Parent Company has minimal liabilities other than amounts owed to its wholly-owned subsidiaries and special purpose entity (collectively, the “Company” or the “Group”). These undertakings will not be repaid until all other debts are satisfied. In addition, the Group has cash reserves of US$208.5 million and US$495.3 million of available unused external loan facilities at 31 March 2021 which the Parent Company can access through an inter-company facility with its Treasury subsidiary. The directors are satisfied that the Parent Company will continue to generate adequate cash to meet all its obligations as they fall due. On this basis, and after making inquiries, the directors have reasonable expectations that the Parent Company has adequate resources to continue in operational existence for the foreseeable future. Accordingly, the Parent Company continues to adopt the going concern assumption in preparing the financial statements. These financial statements do not include any adjustments to the carrying amount or classification of assets and liabilities that would result if the Parent Company were unable to continue as a going concern.
| | | | | | | | |
| FY 2021 Irish Statutory Accounts | | 44 |
James Hardie Industries plc
Notes to Company Financial Statements (continued)
These financial statements are prepared in accordance with FRS 101 ‘Reduced Disclosure Framework’ as issued by the Financial Reporting Council.
The following exemptions from the requirements of IFRS have been applied in the preparation of these financial statements, in accordance with FRS 101:
•Paragraphs 45(b) and 46 to 52 of IFRS 2, ‘Share-based payment’ (details of the number and weighted-average exercise prices of share options, and how the fair value of goods or services received was determined)
•IFRS 7, ‘Financial Instruments: Disclosures’ (equivalent disclosures present in the Group Accounts);
•The following paragraphs of IAS 1, ‘Presentation of financial statements’:
(i)10(d), (statement of cash flows)
(ii)10(f) (a statement of financial position as at the beginning of the preceding period when an entity applies an accounting policy retrospectively or makes a retrospective restatement of items in its financial statements, or when it reclassifies items in its financial statements),
(iii)16 (statement of compliance with all IFRS),
(iv)38A (requirement for minimum of two primary statements, including cash flow statements),
(v)111 (cash flow statement information), and
(vi)134-136 (capital management disclosures)
•IAS 7, ‘Statement of cash flows’
•Paragraph 30 and 31 of IAS 8 ‘Accounting policies, changes in accounting estimates and errors’ (requirement for the disclosure of information when an entity has not applied a new IFRS that has been issued but is not yet effective)
•Paragraph 17 of IAS 24, ‘Related party disclosures’ (key management compensation)
•The requirements in IAS 24, ‘Related party disclosures’ to disclose related party transactions entered into between two or more members of a group.
•IFRS 13, “Fair Value Measurement”
The Company has availed of the disclosure exemptions contained in FRS 101 on the basis that relevant, equivalent disclosures have been given in the group accounts of JHI plc. The group accounts of JHI plc are available to the public and can be obtained by accessing the Company’s FY2021 Annual Report on Form 20-F on the SEC’s website at www.sec.gov and on the Investor Relations area of the Company’s website at www.ir.jameshardie.com.au.
The financial statements have been prepared on the going concern basis under the historical cost convention in accordance with the Companies Act 2014 and FRS 101. The accompanying balance sheet of James Hardie Industries plc is presented on a stand-alone basis, including related party transactions.
| | | | | | | | |
| FY 2021 Irish Statutory Accounts | | 45 |
James Hardie Industries plc
Notes to Company Financial Statements (continued)
3. Significant Accounting Policies
Investments
Financial fixed assets are stated at cost less provision for permanent diminution in value.
The carrying value of financial fixed assets is reviewed for impairment if events or changes in circumstances indicate that the carrying amount may not be recoverable. Under IAS 36, impairment is assessed by comparing the carrying value of an asset with its recoverable amount (being the higher of net realisable value and value in use). Net realisable value is defined as the amount at which an asset could be disposed of net of any direct selling costs. Value in use is defined as the present value of the future cash flows obtainable through continued use of an asset including those anticipated to be realised on its eventual disposal.
Foreign currency translation
The financial statements are expressed in US dollars (“US$”), the functional currency of the Company. Transactions denominated in foreign currencies have been translated to US$ at the rates of exchange ruling at the dates of the transactions. Monetary assets and liabilities denominated in foreign currencies are translated to US$ at the rates of exchange ruling at the balance sheet date. The resulting profits and losses are dealt with in the income statement.
Contingencies
The Company has guaranteed certain liabilities of group companies. Financial guarantees are recognised as financial liabilities at the date it becomes probable that the subsidiary company is no longer able to meet its obligations that gave rise to the guarantee issued by the Company.
Share based payments
The cost of equity-settled transactions with employees is measured by reference to the fair value at the date at which they are granted and is recognised as an expense over the vesting period, which ends on the date on which the relevant employees become fully entitled to the award.
The financial effect of equity awards issued by the parent company to employees of subsidiary undertakings is recognised by the parent company in its individual financial statements. In particular, the parent company records an increase in its investment in subsidiaries with a credit to equity equivalent to the IFRS 2 cost in the subsidiary undertakings.
Statement of Comprehensive Income
In accordance with Section 304 of the Companies Act 2014, the Company is availing of the exemption from presenting the individual Statement of Comprehensive Income to the annual general meeting and from filing it with the Registrar of Companies. The Company’s profit for the financial year ended 31 March 2021 was US$321.3 million (2020: US$155.7 million).
| | | | | | | | |
| FY 2021 Irish Statutory Accounts | | 46 |
James Hardie Industries plc
Notes to Company Financial Statements (continued)
Financial Instruments - Financial assets initial recognition and measurement
Financial assets are measured in accordance with IFRS 9 and are classified at initial recognition as financial assets at fair value through profit and loss. Management review the carrying value of financial assets for impairment regularly or if circumstances indicate that the carrying amount may not be recoverable.
The Company’s financial assets comprise amounts due from Group undertakings.
Financial liabilities are measured in accordance with IFRS 9 and are classified at initial recognition as financial liabilities at fair value through profit and loss.
The Company’s financial liabilities comprise amounts owing to Group companies and trade payables.
Judgements and estimates
The preparation of financial statements require management to make judgements, estimates and assumptions that affect the amounts reported for assets and liabilities as at the balance sheet date and the amounts reported for revenues and expenses during the year. However, the nature of estimation means that actual outcomes could differ from those estimates.
Determining whether the Company’s investments in subsidiaries have been impaired requires estimations of the investments’ values in use. The value in use calculations require the entity to estimate the future cash flows expected to arise from the investments and suitable discount rates in order to calculate present values. The carrying value of the investments at 31 March 2021 was US$3,375.2 million and at 31 March 2020 was US$3,358.7 million, respectively, with no impairment recognised in 2021 or 2020.
4. Employees and Directors
The average number of employees during the financial year was 1 employee (2020: 3 employees) (administrative).
The aggregate payroll costs of these persons were as follows:
| | | | | | | | | | | |
| 31 March 2021
US$ millions | | 31 March 2020
US$ millions |
| Wages and salaries | 0.3 | | | 0.5 | |
| Directors' fees | 0.2 | | | 0.2 | |
Wages and salaries comprise of salaries and bonuses US$469,000 (2020: US$642,000), social security costs US$29,000 (2020: US$48,000), and pension costs US$10,000 (2020: US$20,000).
The Company operates a defined contribution pension scheme for its employees. Payments are recognised in the Statement of Comprehensive Income as they fall due and any contributions outstanding at the financial year end are included as an accrual in the Balance Sheet. The Company has no further payment obligations once the contributions have been paid.
| | | | | | | | |
| FY 2021 Irish Statutory Accounts | | 47 |
James Hardie Industries plc
Notes to Company Financial Statements (continued)
5. Financial Fixed Assets
| | | | | | | | | | | |
| 31 March 2021
US$ millions | | 31 March 2020
US$ millions |
| Shares in group companies | 3,375.2 | | | 3,358.7 | |
| 3,375.2 | | | 3,358.7 | |
Shares in group companies at 31 March 2021:
| | | | | | | | | | | | | | | | | |
| Investment in
Shares
US$ millions | | Capital
Contribution
US$ millions | | Total
US$ millions |
| At 31 March 2020, at cost | 3,167.2 | | | 191.5 | | | 3,358.7 | |
| Additions and disposals | | | | | |
| Capital contribution in respect of | | | | | |
| share-based payment transactions | — | | | 16.5 | | | 16.5 | |
| At 31 March 2021, at cost | 3,167.2 | | | 208.0 | | | 3,375.2 | |
Shares in group companies at 31 March 2020:
| | | | | | | | | | | | | | | | | |
| Investment in
Shares
US$ millions | | Capital
Contribution
US$ millions | | Total
US$ millions |
| At 31 March 2019, at cost | 3,167.2 | | | 182.3 | | | 3,349.5 | |
| Additions and disposals | | | | | |
| Capital contribution in respect of | | | | | |
| share-based payment transactions | — | | | 9.2 | | | 9.2 | |
| At 31 March 2020, at cost | 3,167.2 | | | 191.5 | | | 3,358.7 | |
In the opinion of the directors, the recoverable amount of the investments is not less than the carrying value.
The Company’s direct subsidiaries at 31 March 2021 are as follows:
| | | | | | | | | | | |
| Country of | | Holding |
| Subsidiary Company | Incorporation | Nature of Business | % |
| James Hardie International Group Ltd. | Ireland | Holding Company | 100% |
| James Hardie Insurance Ltd. | Guernsey | Insurance Company | 100% |
Refer to Note 33 to the consolidated financial statements where the Company’s directly and indirectly wholly-owned subsidiaries are listed.
| | | | | | | | |
| FY 2021 Irish Statutory Accounts | | 48 |
James Hardie Industries plc
Notes to Company Financial Statements (continued)
6. Debtors
Amounts falling due within one year comprised the following:
| | | | | | | | | | | |
| 31 March 2021
US$ millions | | 31 March 2020
US$ millions |
| | | |
| Amounts owed by group companies | 328.6 | | | 4.3 | |
| Prepayments | 0.3 | | | 0.5 | |
| VAT | 0.2 | | | 0.1 | |
| 329.1 | | | 4.9 | |
All amounts due from group companies are interest bearing and repayable on demand. The current interest rate of 0.01% is the market overnight corporate deposit rate and the deposit is unsecured.
7. Creditors
Amounts falling due within one year comprised the following:
| | | | | | | | | | | |
| 31 March 2021
US$ millions | | 31 March 2020
US$ millions |
| Trade creditors | 0.6 | | | 0.2 | |
| Accruals | 1.6 | | | 2.5 | |
| Dividend payable | 303.7 | | | — | |
| Amounts owed to group undertakings | 12.3 | | | 4.2 | |
| 318.2 | | | 6.9 | |
Amounts falling due after one year comprised the following:
| | | | | | | | | | | |
| 31 March 2021
US$ millions | | 31 March 2020
US$ millions |
| Other creditors | 6.5 | | | 5.6 | |
| 6.5 | | | 5.6 | |
Other creditors consist of share based liability awards payable to employees. The above balance is due within 2 to 4 years.
| | | | | | | | |
| FY 2021 Irish Statutory Accounts | | 49 |
James Hardie Industries plc
Notes to Company Financial Statements (continued)
8. Called-up Share Capital Presented as Equity
The Company’s authorised and called-up share capital at 31 March 2021 and 2020 are detailed in the table below:
| | | | | | | | | | | |
| As of 31 March |
| 2021 Number | | 2020 Number |
| Authorised share capital: | | | |
| Ordinary shares of €0.59 par value | 2,000,000,000 | | | 2,000,000,000 | |
| | | |
| Alloted and Fully Paid: | | | |
| Allotted and fully paid at beginning of financial year | 443,144,740 | | | 442,269,905 | |
| Issue in respect of share-based payment plans | 1,144,134 | | | 874,835 | |
| Allotted and fully paid at end of financial year | 444,288,874 | | | 443,144,740 | |
In addition, refer to Note 16 to the US GAAP consolidated financial statements in Section 2 of the Appendix to the Directors’ Report.
9. Reconciliation of Movement in Shareholders’ Funds
As at 31 March 2021
| | | | | | | | | | | | | | | | | | | | | | | | | | | | | | | | | | | |
| Called-up share capital US$ millions | | Capital redemption reserve US$ millions | | Share premium US$ millions | | Other reserves US$ millions | | Profit and loss account US$ millions | | Total US$ millions |
| Balance 31 March 2020 | 230.6 | | | 7.2 | | | 77.8 | | | 110.0 | | | 2,925.6 | | | 3,351.2 | |
| Profit for the financial year | — | | | — | | | — | | | — | | | 321.3 | | | 321.3 | |
| Other comprehensive income | — | | | — | | | — | | | — | | | — | | | — | |
| Total comprehensive income | — | | | — | | | — | | | — | | | 321.3 | | | 321.3 | |
| Share-based payment transactions | 0.8 | | | — | | | — | | | 17.2 | | | — | | | 18.0 | |
| Issue of ordinary shares | — | | | — | | | 0.1 | | | — | | | — | | | 0.1 | |
| Dividends declared | — | | | — | | | — | | | — | | | (310.9) | | | (310.9) | |
| Balance 31 March 2021 | 231.4 | | | 7.2 | | | 77.9 | | | 127.2 | | | 2,936.0 | | | 3,379.7 | |
On 10 February 2021, the Company declared a special dividend of US70.0 cent per share.
| | | | | | | | |
| FY 2021 Irish Statutory Accounts | | 50 |
James Hardie Industries plc
Notes to Company Financial Statements (continued)
As at 31 March 2020
| | | | | | | | | | | | | | | | | | | | | | | | | | | | | | | | | | | |
| Called-up share capital US$ millions | | Capital redemption reserve US$ millions | | Share premium US$ millions | | Other reserves US$ millions | | Profit and loss account US$ millions | | Total US$ millions |
| Balance 31 March 2019 | 230.0 | | | 7.2 | | | 77.8 | | | 100.3 | | | 2,929.2 | | | 3,344.5 | |
| Profit for the financial year | — | | | — | | | — | | | — | | | 155.7 | | | 155.7 | |
| Other comprehensive income | — | | | — | | | — | | | — | | | — | | | — | |
| Total comprehensive income | — | | | — | | | — | | | — | | | 155.7 | | | 155.7 | |
| Share-based payment transactions | 0.6 | | | — | | | — | | | 9.7 | | | — | | | 10.3 | |
| Dividends declared | — | | | — | | | — | | | | | (159.3) | | | (159.3) | |
| Balance 31 March 2020 | 230.6 | | | 7.2 | | | 77.8 | | | 110.0 | | | 2,925.6 | | | 3,351.2 | |
The Capital Redemption Reserve arose from the financial effect of the cancellation of treasury shares.
Movements in other reserves arise from the financial effect of equity awards issued by the Company, which also includes the IFRS 2 cost in respect of employees of subsidiary undertakings, reflected as an increase in the Company’s investment in subsidiary undertakings (see Note 10 below).
10. Share-Based Payment Transactions
Share-based payment expense of US$16.5 million (2020: US$9.2 million) in respect of share-based payment transactions for the financial year ended 31 March 2021 included in Note 18 to the consolidated financial statements has been included as a capital contribution (see Note 5). Share-based payment expense directly attributable to the Company was US$0.7 million (2020: US$0.5 million).
11. Commitments and Contingencies
At 31 March 2021, the Company has guaranteed certain liabilities of group entities as set forth below. The Company reviews the status of these guarantees at each reporting date and considers whether it is required to make a provision for payment on those guarantees based on the probability of the commitment being called.
Section 357 Guarantee
Pursuant to the provisions of Section 357 of the Companies Act 2014, the Company has guaranteed the commitments entered into, including amounts shown as liabilities in the statutory financial statements of its wholly-owned subsidiary undertakings James Hardie International Holdings Limited, James Hardie Holdings Limited, James Hardie Technology Holdings 1 Limited and James Hardie Technology Holdings 2 Limited for the financial year ended 31 March 2021 and has met the other conditions set out in that section and, as a result, such subsidiary undertakings have been exempted from the filing provisions of Section 357 of the Companies Act 2014.
| | | | | | | | |
| FY 2021 Irish Statutory Accounts | | 51 |
James Hardie Industries plc
Notes to Company Financial Statements (continued)
AFFA
The Amended and Restated Final Funding Agreement (as amended from time to time, “AFFA”) was approved by shareholders in February 2007 to provide long-term funding to Asbestos Injuries Compensation Fund (“AICF”). The Company indirectly owns 100% of the Performing Subsidiary that funds AICF subject to the provisions of the AFFA. Under the terms of the AFFA, the Performing Subsidiary has an obligation to make payments to AICF on an annual basis, depending on the group’s net operating cash flow.
Under the terms of the AFFA, the Company is the ultimate guarantor for payments due to be made by the Performing Subsidiary to AICF. This guarantee is only enforceable by AICF or the NSW Government in the event of any breach of the obligations of the Performing Subsidiary, a wind-up event or a reconstruction event. At 31 March 2021 and 2020, there is no indication that any such breach will occur and, accordingly, there is no liability recorded on the Company’s balance sheet at that date. Refer to Notes 2, 4 and 14 to the consolidated financial statements.
12. Related Party Transactions
The Company has not disclosed any related party transactions as it has availed of the exemption available under the provisions of FRS 101 which exempts disclosure of transactions entered into between two or more members of a group, provided that any subsidiary which is a party to the transaction is wholly owned by a member of that group.
13. Subsequent Events
Subsequent to 31 March 2021, the Company paid US$309.6 million as a special dividend of US70.0 cents per security which was announced on 10 February 2021.
Subsequent to 31 March 2021, the Company has drawn US$110.0 million from the unsecured revolving credit facility.
14. Auditor's Remuneration
Fees paid to the Company’s independent auditor for services provided for fiscal years ended 31 March 2021 and 2020 were as follows:
| | | | | | | | | | | |
| Fiscal Years Ended 31 March |
| 2021 | | 2020 |
| (millions of US dollars) | | | |
| Audit Fees | 0.3 | | | 0.3 | |
| Audit-Related Fees | — | | | 0.1 | |
Audit remuneration to the independent auditor represents the audit remuneration in respect of the Irish statutory audit of the Irish Statutory Accounts. The auditor’s remuneration to the Independent registered public accounting firm disclosed in Note 30 to the consolidated financial statements represents the audit fee disclosures required for registrants of the SEC.
| | | | | | | | |
| FY 2021 Irish Statutory Accounts | | 52 |
James Hardie Industries plc
Notes to Company Financial Statements (continued)
Audit Fees include the aggregate fees for professional services rendered by our independent auditor. Professional services include the audit of the annual financial statements and services that are normally provided in connection with statutory filings.
Audit-Related Fees include the aggregate fees billed for assurance and related services rendered by the Company’s independent auditor.
15. Approval of Financial Statements
The financial statements have been approved and authorised for issue by the Board of Directors of the Company.
| | | | | | | | |
| FY 2021 Irish Statutory Accounts | | 53 |