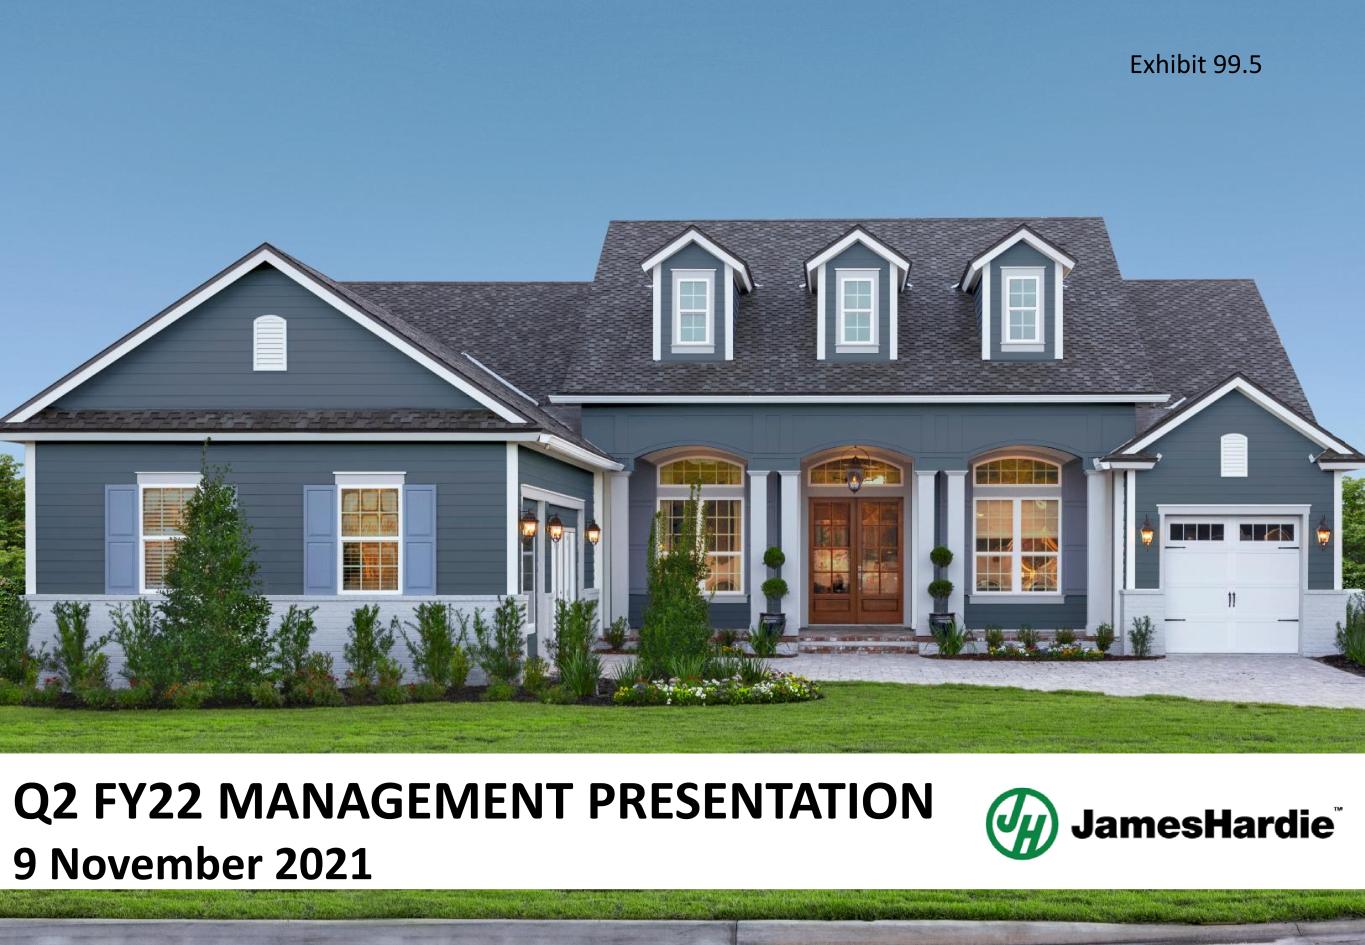
Q2 FY22 MANAGEMENT PRESENTATION 9 November 2021 Exhibit 99.5
Page 2 James Hardie Q2 FY22 Results CAUTIONARY NOTE ON FORWARD-LOOKING STATEMENTS This Management Presentation contains forward looking statements within the meaning of the Private Securities Litigation Reform Act of 1995. James Hardie Industries plc (the “Company”) may from time to time make forward-looking statements in its periodic reports filed with or furnished to the Securities and Exchange Commission on Forms 20-F and 6-K, in its annual reports to shareholders, in media releases and other written materials and in oral statements made by the Company’s officers, directors or employees to analysts, institutional investors, representatives of the media and others. Words such as “believe,” “anticipate,” “plan,” “expect,” “intend,” “target,” “estimate,” “project,” “predict,” “forecast,” “guideline,” “aim,” “will,” “should,” “likely,” “continue,” “may,” “objective,” “outlook” and similar expressions are intended to identify forward-looking statements but are not the exclusive means of identifying such statements. These forward-looking statements are based upon management's current expectations, estimates, assumptions and beliefs concerning future events and conditions. Readers are cautioned not to place undue reliance on any forward- looking statements. Forward-looking statements are necessarily subject to risks, uncertainties and other factors, many of which are unforeseeable and beyond the Company’s control. Many factors could cause actual results, performance or achievements to be materially different from those expressed or implied in this Management Presentation, including, among others, the risks and uncertainties set forth in Section 3 “Risk Factors” in James Hardie’s Annual Report on Form 20-F for the year ended 31 March 2021; changes in general economic, political, governmental and business conditions globally and in the countries in which the Company does business, including the impact of COVID-19; changes in interest rates; changes in inflation rates; changes in exchange rates; the level of construction generally; changes in cement demand and prices; changes in raw material and energy prices; changes in business strategy and various other factors. Should one or more of these risks or uncertainties materialize, or should underlying assumptions prove incorrect, actual results may vary materially from those described herein. James Hardie assumes no obligation to update or correct the information contained in this Management Presentation except as required by law. This Management Presentation includes financial measures that are not considered a measure of financial performance under generally accepted accounting principles in the United States (GAAP). These financial measures are designed to provide investors with an alternative method for assessing our performance from on-going operations, capital efficiency and profit generation. Management uses these financial measures for the same purposes. These financial measures are or may be non-GAAP financial measures as defined in the rules of the U.S. Securities and Exchange Commission and may exclude or include amounts that are included or excluded, as applicable, in the calculation of the most directly comparable financial measures calculated in accordance with GAAP. These non-GAAP financial measures should not be considered to be more meaningful than the equivalent GAAP measure. Management has included such measures to provide investors with an alternative method for assessing its operating results in a manner that is focused on the performance of its ongoing operations and excludes the impact of certain legacy items, such as asbestos adjustments. Additionally, management uses such non-GAAP financial measures for the same purposes. However, these non-GAAP financial measures are not prepared in accordance with GAAP, may not be reported by all of the Company’s competitors and may not be directly comparable to similarly titled measures of the Company’s competitors due to potential differences in the exact method of calculation. For additional information regarding the non-GAAP financial measures presented in this Management Presentation, including a reconciliation of each non-GAAP financial measure to the equivalent GAAP measure, see the slide titled “Non-GAAP Financial Measures” included in the Appendix to this Management Presentation. In addition, this Management Presentation includes financial measures and descriptions that are considered to not be in accordance with GAAP, but which are consistent with financial measures reported by Australian companies, such as operating profit, EBIT and EBIT margin. Since the Company prepares its Consolidated Financial Statements in accordance with GAAP, the Company provides investors with definitions and a cross-reference from the non-GAAP financial measure used in this Management Presentation to the equivalent GAAP financial measure used in the Company’s Consolidated Financial Statements. See the section titled “Non-GAAP Financial Measures” included in the Appendix to this Management Presentation. CAUTIONARY NOTE ON FORWARD-LOOKING STATEMENTS USE OF NON-GAAP FINANCIAL INFORMATION; AUSTRALIAN EQUIVALENT TERMINOLOGY
Page 3 James Hardie Q2 FY22 Results AGENDA • Strategy Update • Q2 FY22 Financial Results • Questions and Answers Dr. Jack Truong Chief Executive Officer Jason Miele Chief Financial Officer
STRATEGY UPDATE
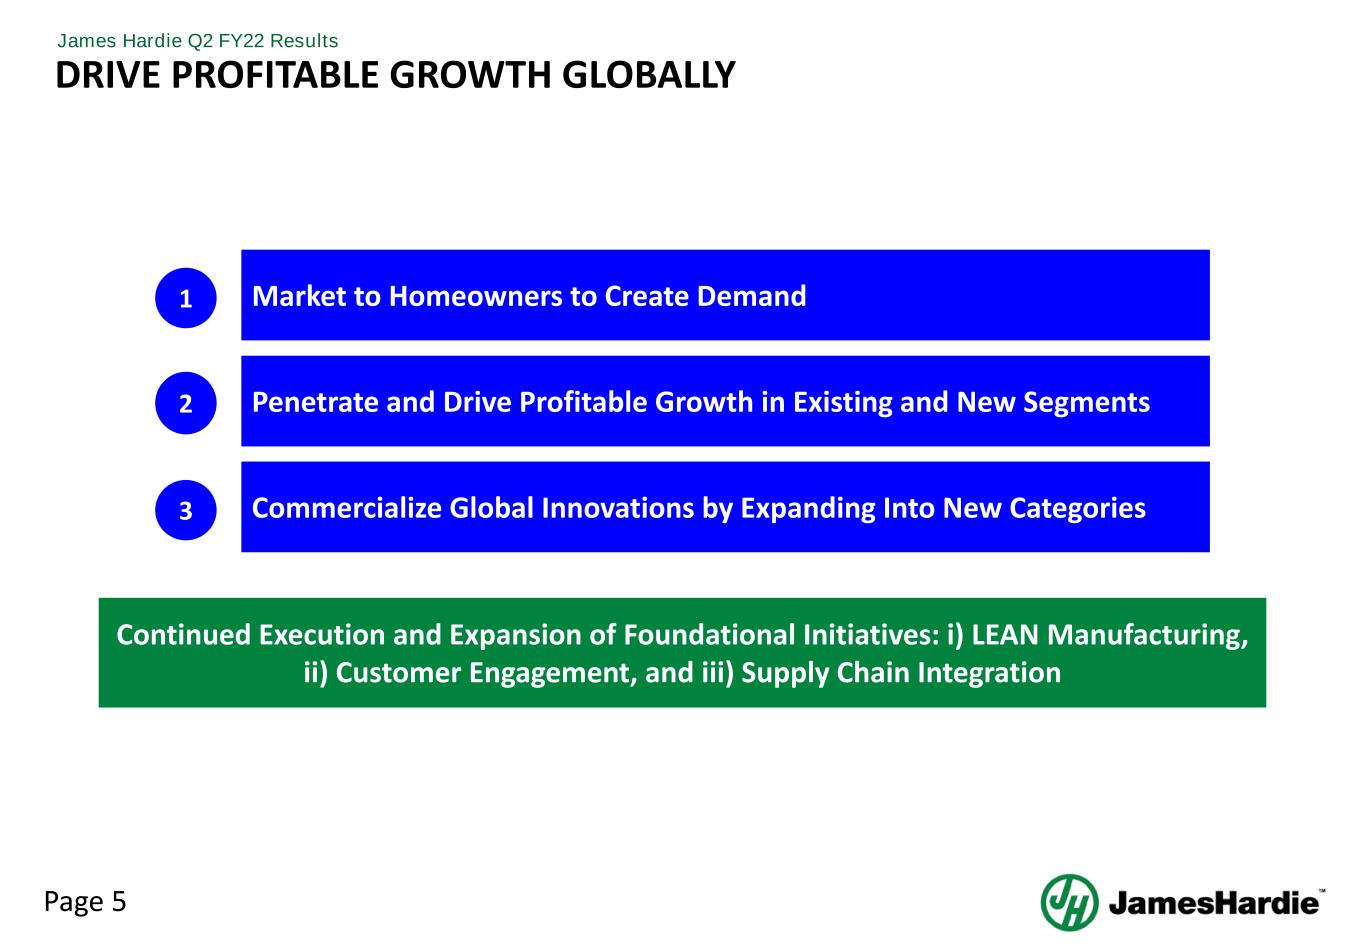
Page 5 James Hardie Q2 FY22 Results DRIVE PROFITABLE GROWTH GLOBALLY Market to Homeowners to Create Demand Penetrate and Drive Profitable Growth in Existing and New Segments Commercialize Global Innovations by Expanding Into New Categories Continued Execution and Expansion of Foundational Initiatives: i) LEAN Manufacturing, ii) Customer Engagement, and iii) Supply Chain Integration 1 2 3
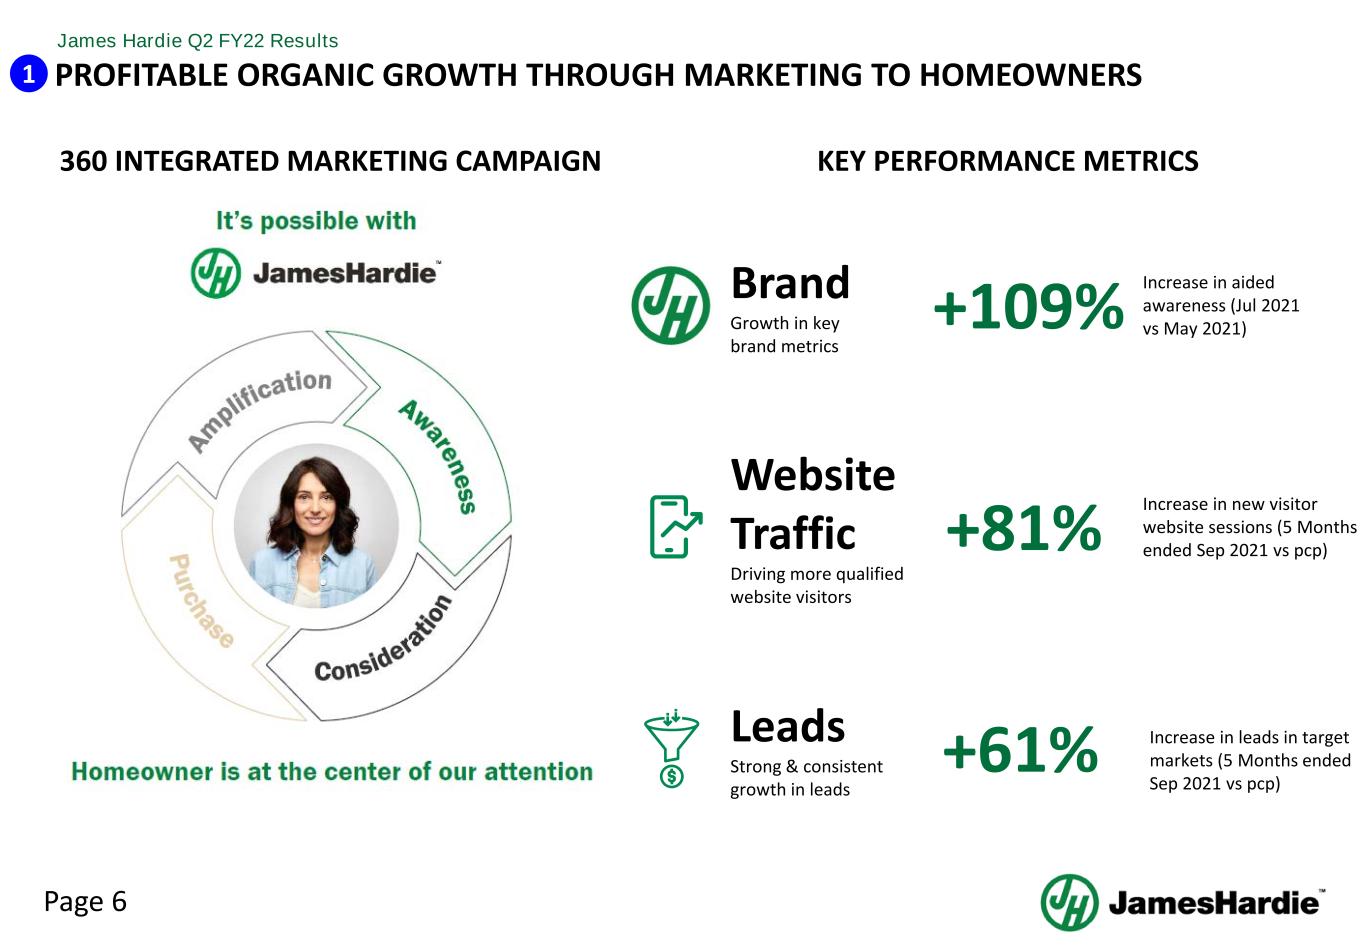
Page 6 James Hardie Q2 FY22 Results PROFITABLE ORGANIC GROWTH THROUGH MARKETING TO HOMEOWNERS 360 INTEGRATED MARKETING CAMPAIGN 1 KEY PERFORMANCE METRICS Brand Growth in key brand metrics +109% Increase in aided awareness (Jul 2021 vs May 2021) Website Traffic Driving more qualified website visitors +81% Increase in new visitor website sessions (5 Months ended Sep 2021 vs pcp) Leads Strong & consistent growth in leads +61% Increase in leads in target markets (5 Months ended Sep 2021 vs pcp)

Page 7 James Hardie Q2 FY22 Results PROFITABLE ORGANIC GROWTH THROUGH MARKETING TO HOMEOWNERS1 RECENT MEDIA PARTNERSHIPS BEFORE AFTER Episode 9 “Minty Green” aired 6 August 2021 Episode 6 aired 9 July 2021 Magnolia Journal back cover ad, Fall 2021 issue Photos © 2021 Discovery or its subsidiaries and affiliates. Used with permission; all rights reserved. Photos © 2021 Discovery or its subsidiaries and affiliates. Used with permission; all rights reserved.
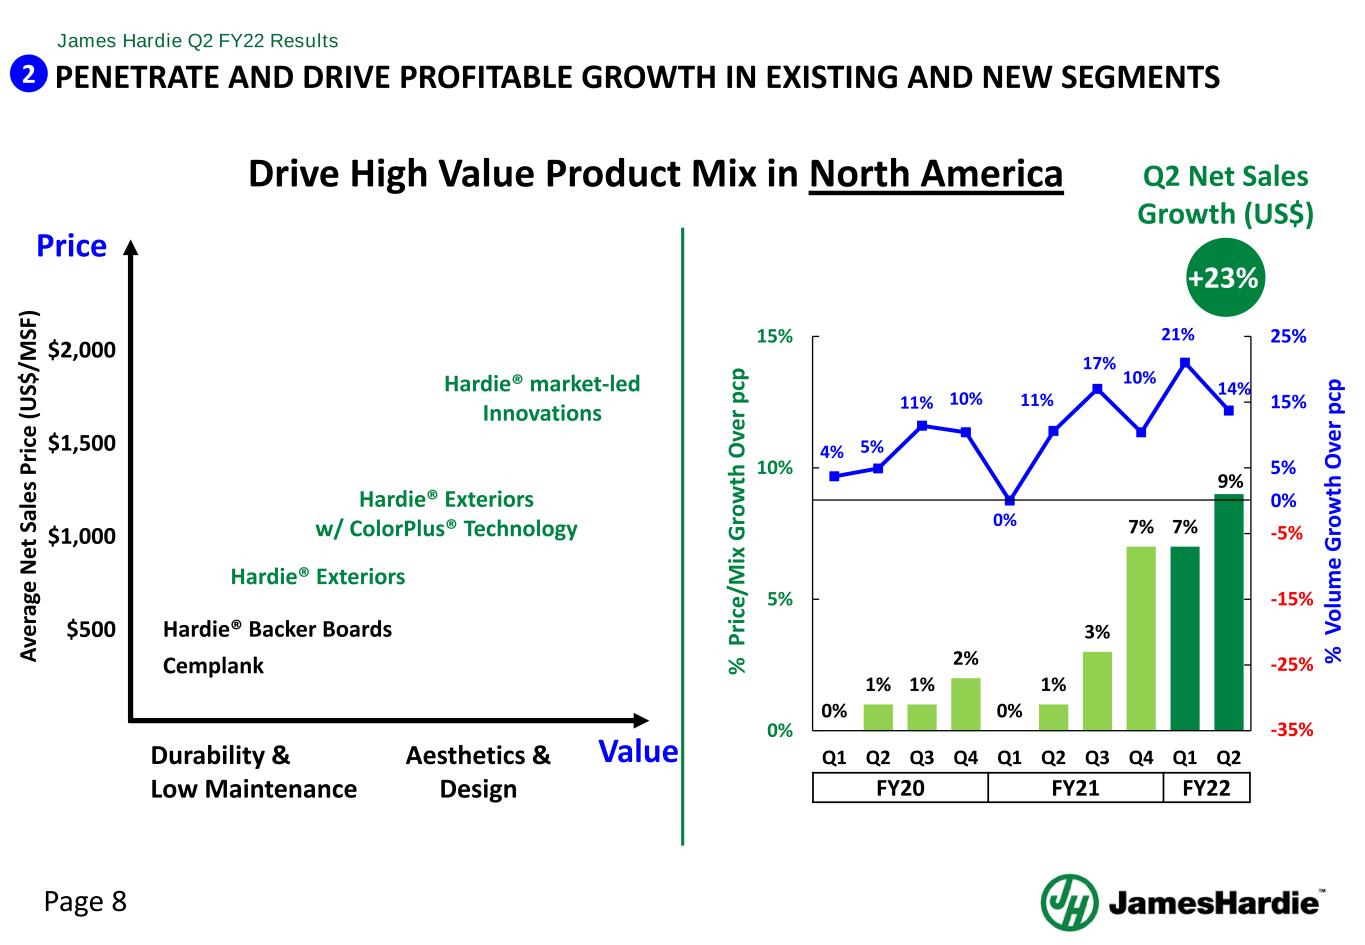
Page 8 James Hardie Q2 FY22 Results 0% 1% 1% 2% 0% 1% 3% 7% 7% 9% 4% 5% 11% 10% 0% 11% 17% 10% 21% 14% -35% -25% -15% -5% 5% 15% 25% 0% 5% 10% 15% Q1 Q2 Q3 Q4 Q1 Q2 Q3 Q4 Q1 Q2 PENETRATE AND DRIVE PROFITABLE GROWTH IN EXISTING AND NEW SEGMENTS % V ol um e G ro w th O ve r p cp Hardie® Backer Boards Cemplank Hardie® Exteriors Hardie® Exteriors w/ ColorPlus® Technology Hardie® market-led Innovations Av er ag e N et S al es P ric e (U S$ /M SF ) $2,000 $500 $1,000 $1,500 FY20 FY21 FY22 % P ric e/ M ix G ro w th O ve r p cp 2 Drive High Value Product Mix in North America Durability & Low Maintenance ValueAesthetics & Design Price +23% Q2 Net Sales Growth (US$) 0%
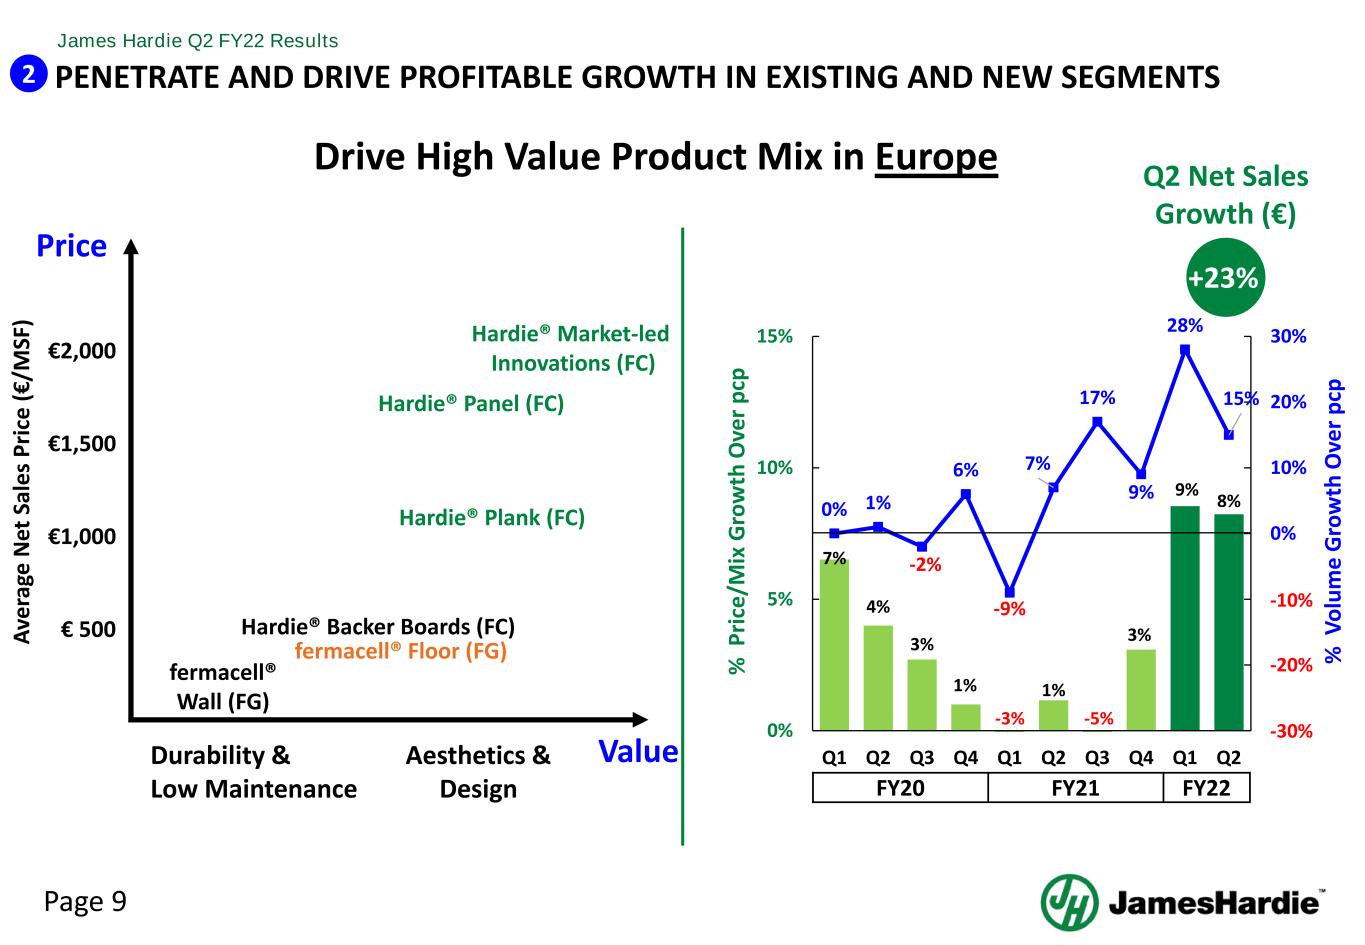
Page 9 James Hardie Q2 FY22 Results € 500 PENETRATE AND DRIVE PROFITABLE GROWTH IN EXISTING AND NEW SEGMENTS2 Drive High Value Product Mix in Europe Av er ag e N et S al es P ric e (€ /M SF ) €2,000 €1,000 €1,500 fermacell® Wall (FG) Hardie® Backer Boards (FC) fermacell® Floor (FG) Hardie® Market-led Innovations (FC) Hardie® Plank (FC) Hardie® Panel (FC) Durability & Low Maintenance Aesthetics & Design Price 7% 4% 3% 1% 1% 3% 9% 8%0% 1% -2% 6% -9% 7% 17% 9% 28% 15% -30% -20% -10% 0% 10% 20% 30% 0% 5% 10% 15% Q1 Q2 Q3 Q4 Q1 Q2 Q3 Q4 Q1 Q2 % V ol um e G ro w th O ve r p cp FY20 FY21 FY22 % P ric e/ M ix G ro w th O ve r p cp +23% Q2 Net Sales Growth (€) -3% -5% Value
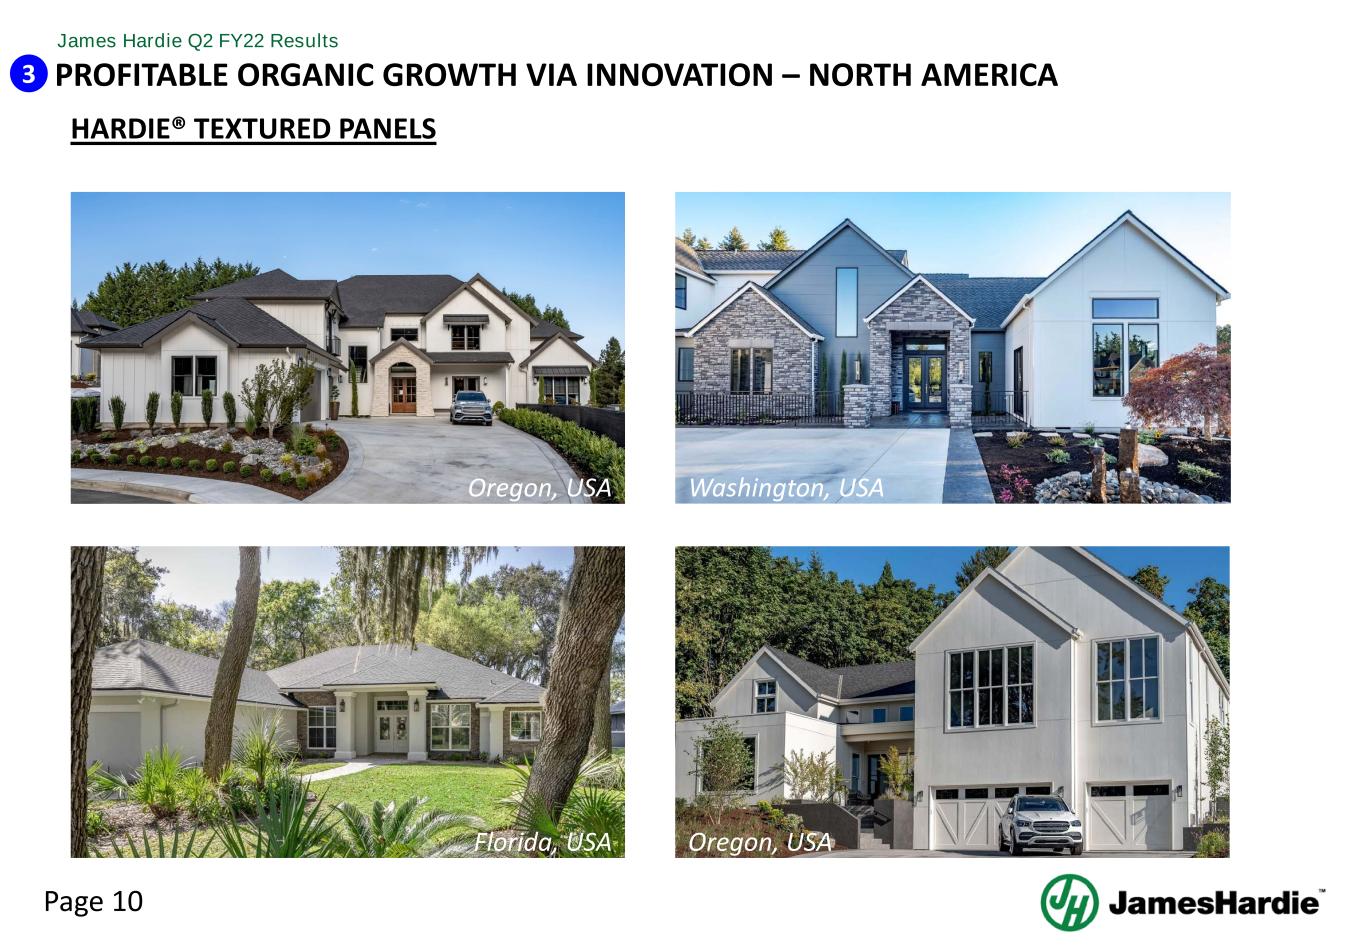
Page 10 James Hardie Q2 FY22 Results PROFITABLE ORGANIC GROWTH VIA INNOVATION – NORTH AMERICA HARDIE® TEXTURED PANELS 3 Oregon, USA Washington, USA Florida, USA Oregon, USA
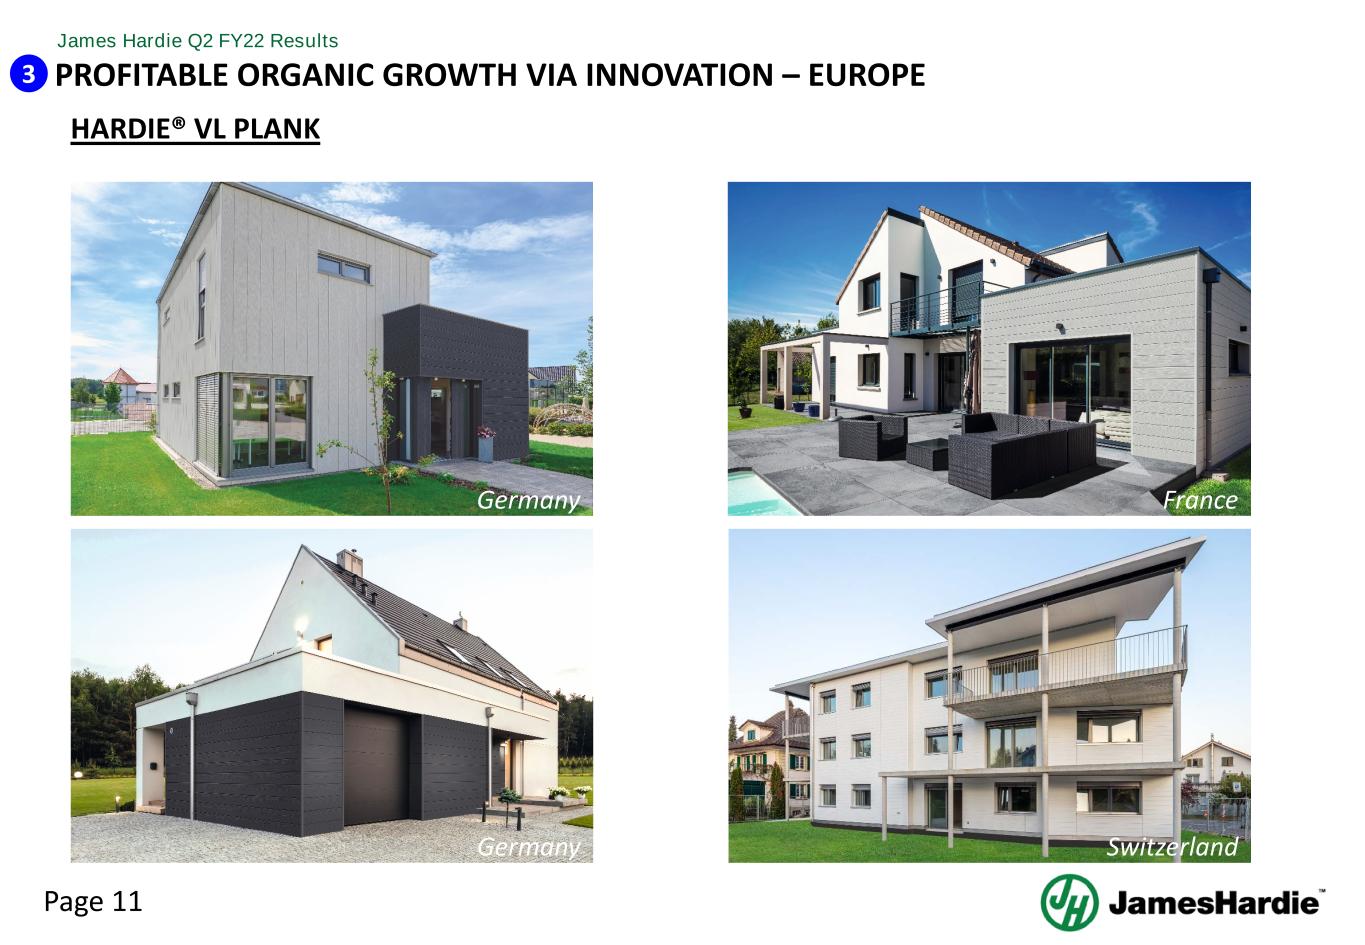
Page 11 James Hardie Q2 FY22 Results HARDIE® VL PLANK PROFITABLE ORGANIC GROWTH VIA INNOVATION – EUROPE3 Germany FranceGermany Switzerland
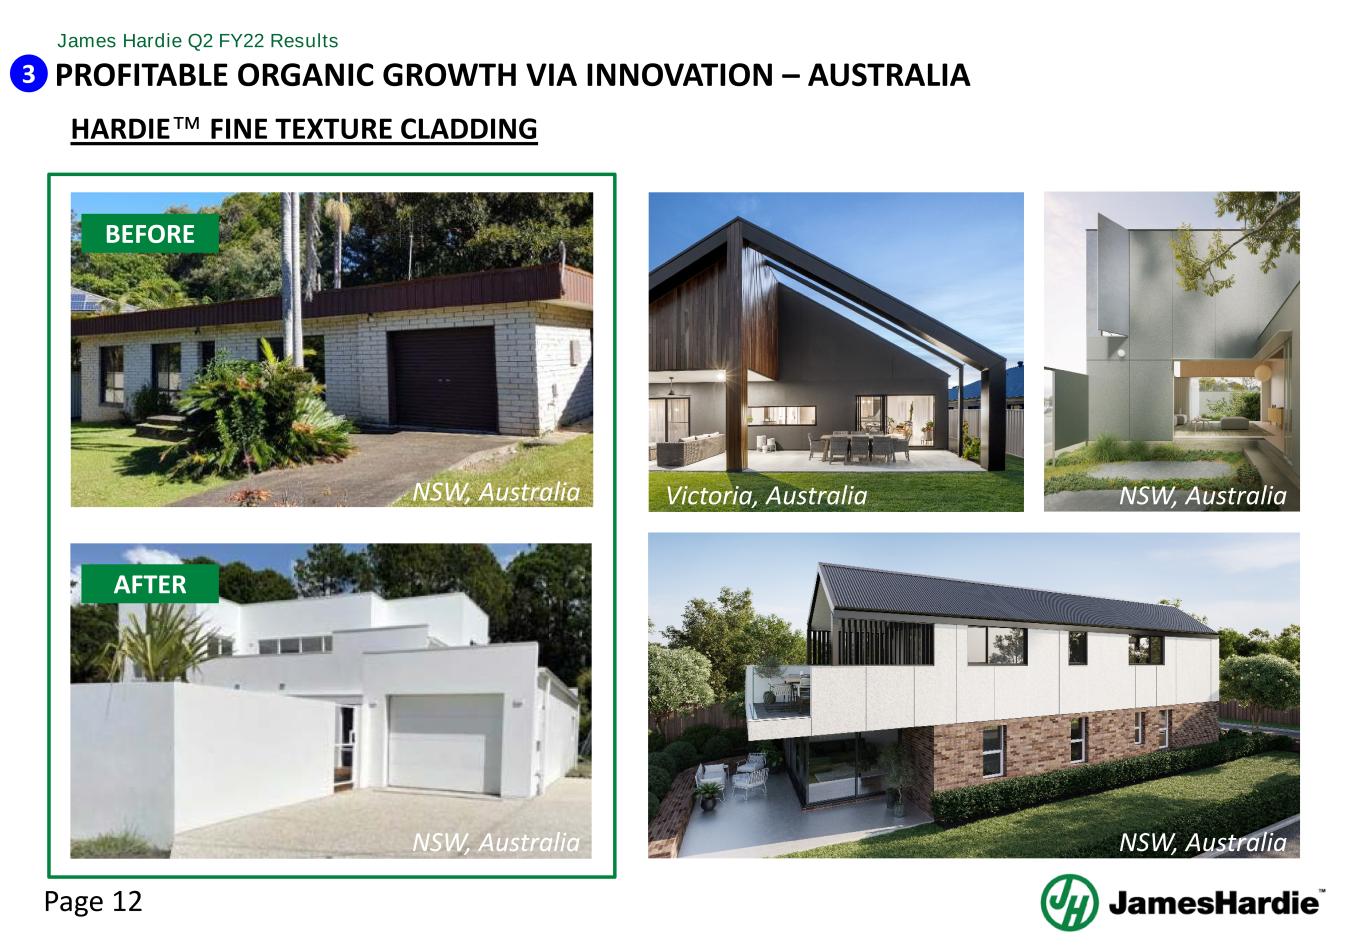
Page 12 James Hardie Q2 FY22 Results PROFITABLE ORGANIC GROWTH VIA INNOVATION – AUSTRALIA HARDIE™ FINE TEXTURE CLADDING 3 BEFORE AFTER NSW, Australia NSW, Australia NSW, Australia Victoria, Australia NSW, Australia
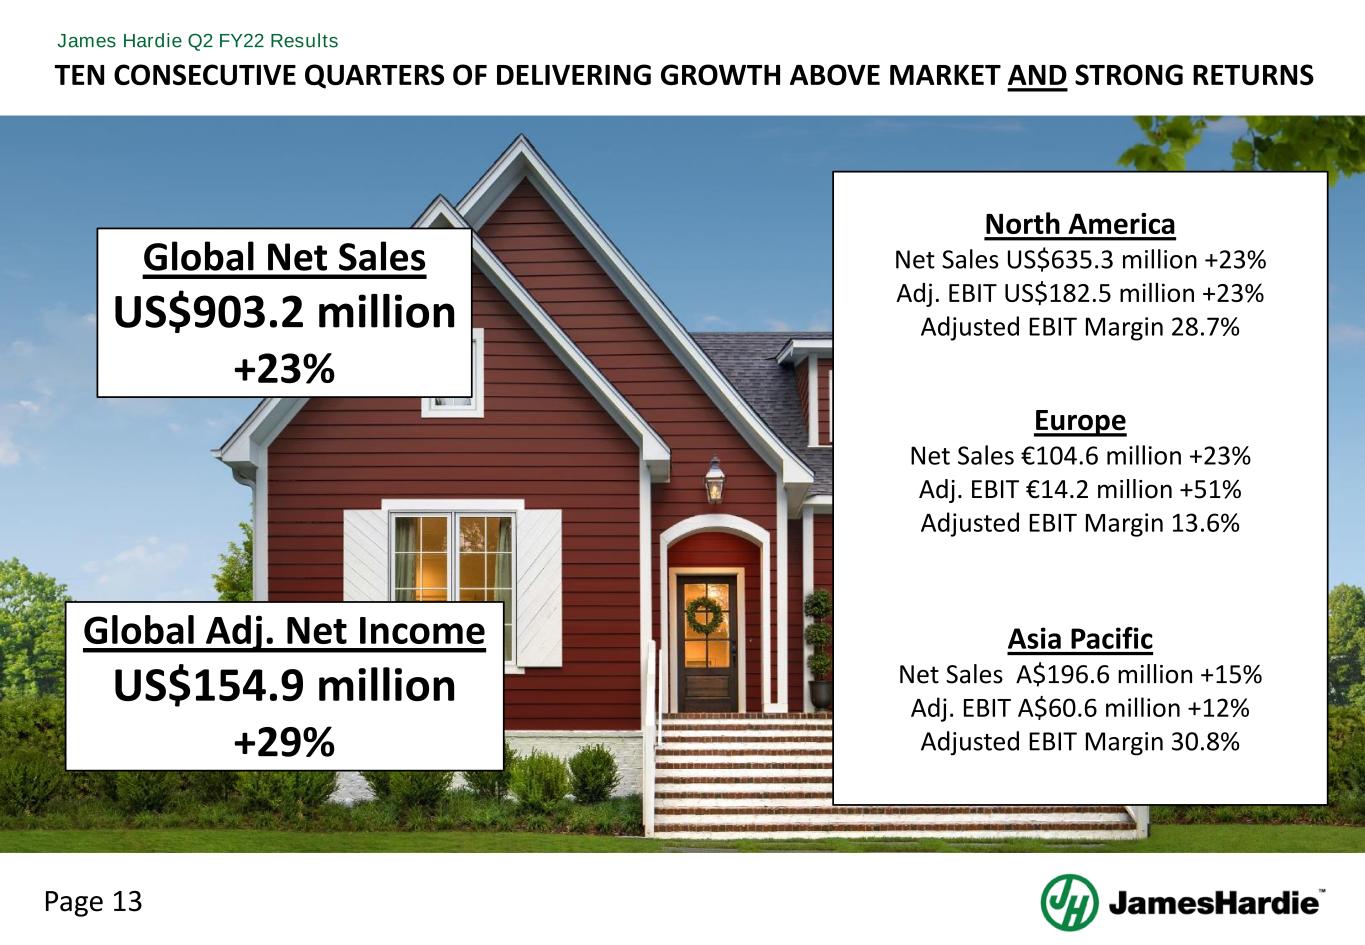
Page 13 James Hardie Q2 FY22 Results Global Net Sales US$903.2 million +23% Global Adj. Net Income US$154.9 million +29% All Europe Net Sales €104.6 million +23% Adj. EBIT €14.2 million +51% Adjusted EBIT Margin 13.6% North America Net Sales US$635.3 million +23% Adj. EBIT US$182.5 million +23% Adjusted EBIT Margin 28.7% Asia Pacific Net Sales A$196.6 million +15% Adj. EBIT A$60.6 million +12% Adjusted EBIT Margin 30.8% TEN CONSECUTIVE QUARTERS OF DELIVERING GROWTH ABOVE MARKET AND STRONG RETURNS
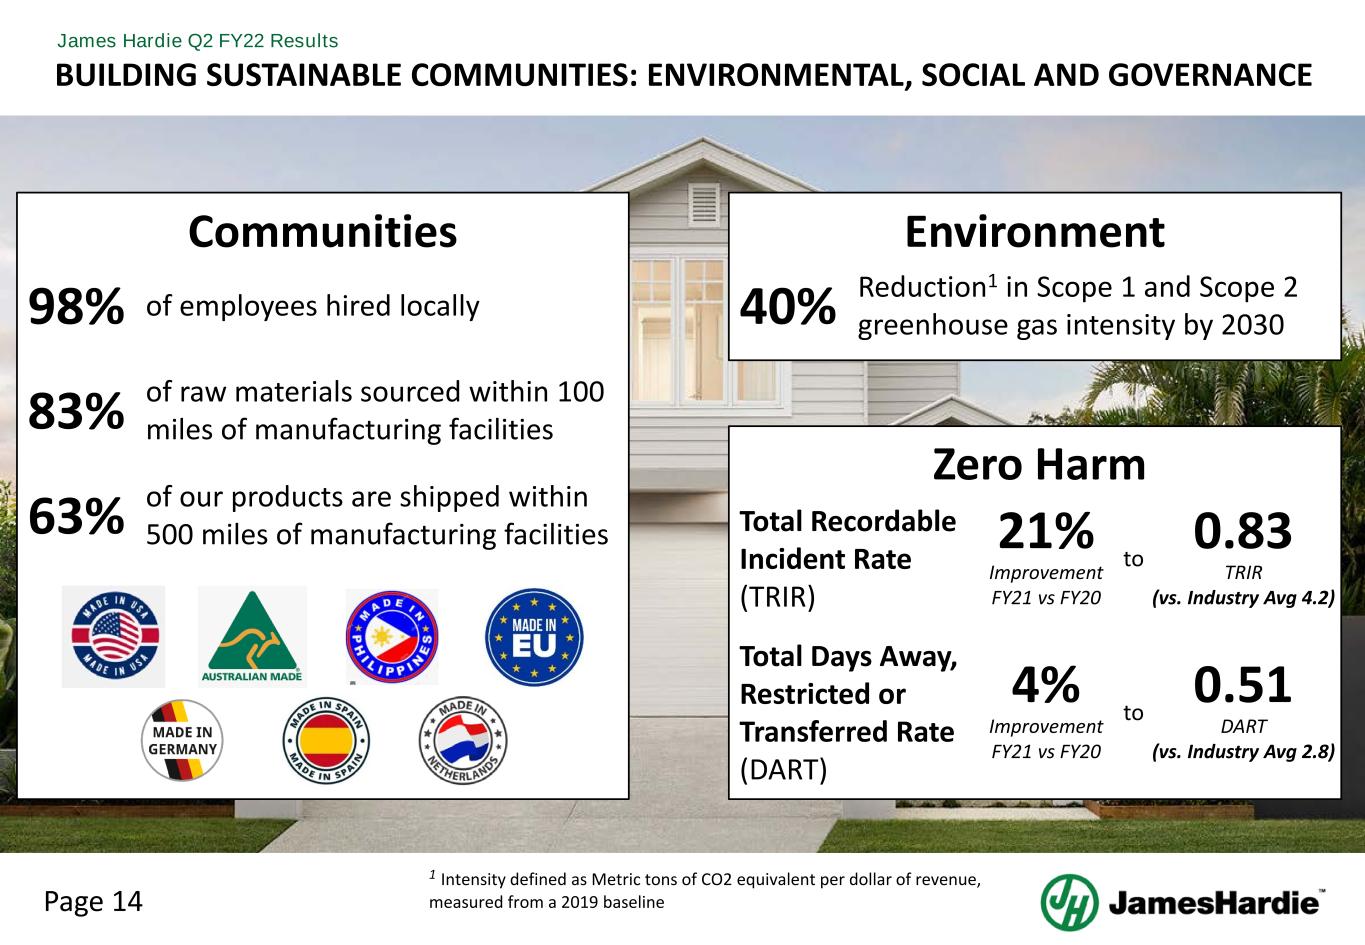
Page 14 James Hardie Q2 FY22 Results BUILDING SUSTAINABLE COMMUNITIES: ENVIRONMENTAL, SOCIAL AND GOVERNANCE 83% of raw materials sourced within 100 miles of manufacturing facilities 98% of employees hired locally 63% of our products are shipped within 500 miles of manufacturing facilities 40% Reduction1 in Scope 1 and Scope 2 greenhouse gas intensity by 2030 Total Recordable Incident Rate (TRIR) Total Days Away, Restricted or Transferred Rate (DART) 21% Improvement FY21 vs FY20 4% Improvement FY21 vs FY20 0.83 TRIR (vs. Industry Avg 4.2) 0.51 DART (vs. Industry Avg 2.8) to to Environment Zero Harm Communities 1 Intensity defined as Metric tons of CO2 equivalent per dollar of revenue, measured from a 2019 baseline
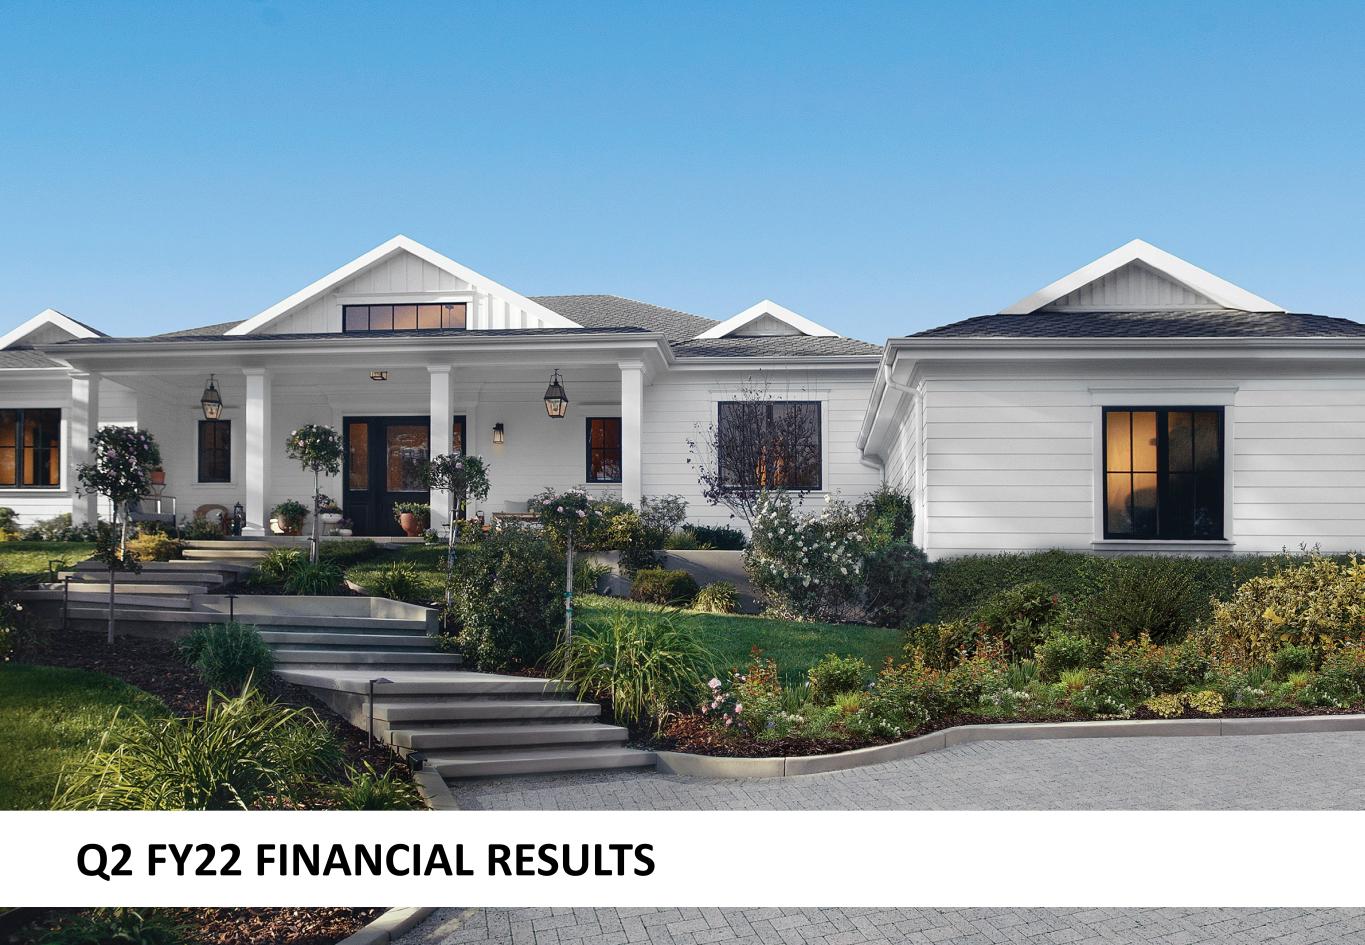
Q2 FY22 FINANCIAL RESULTS
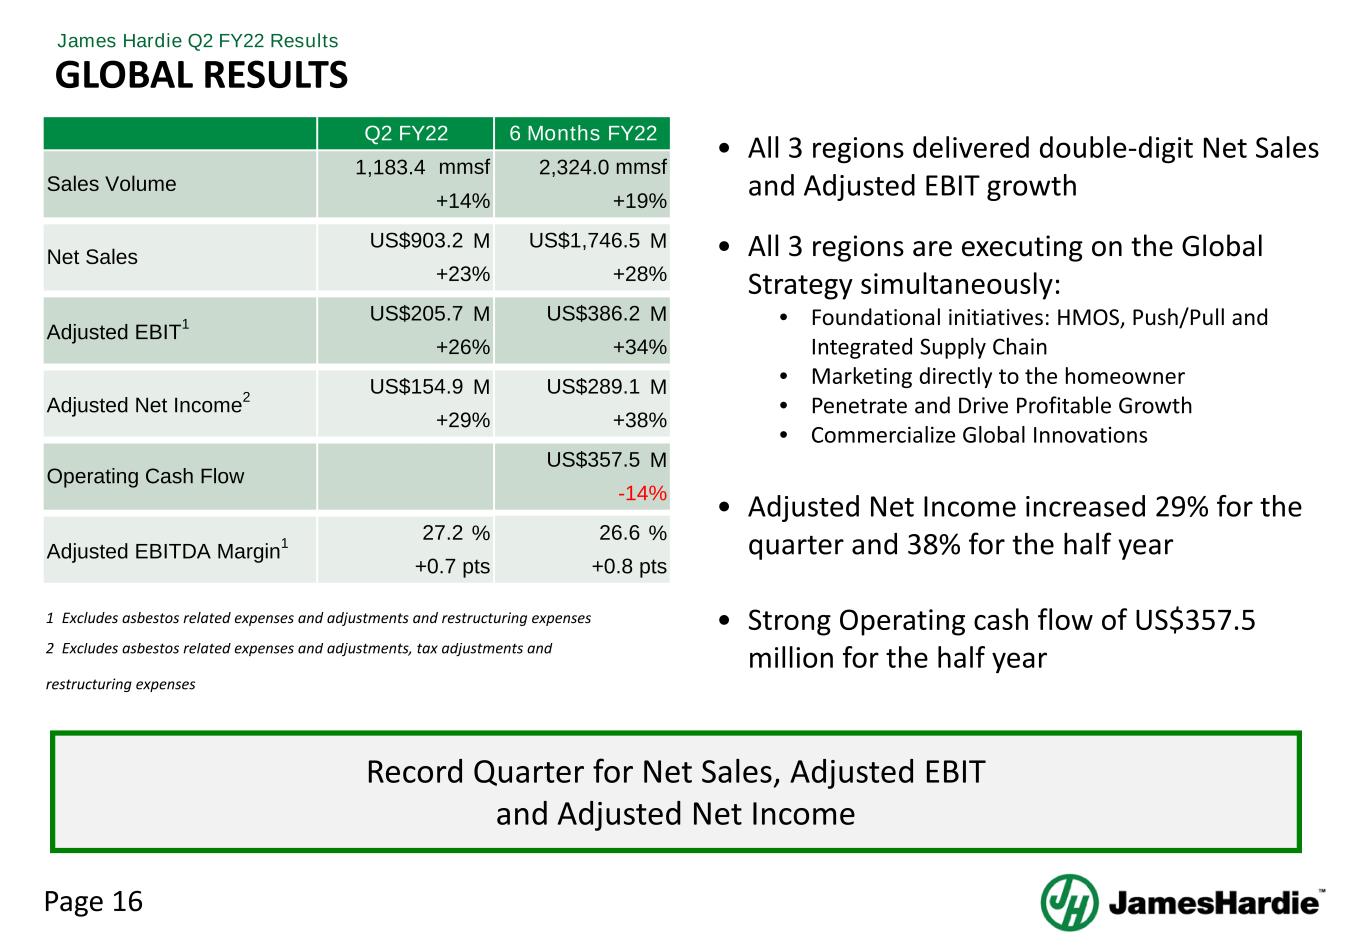
Page 16 James Hardie Q2 FY22 Results • All 3 regions delivered double-digit Net Sales and Adjusted EBIT growth • All 3 regions are executing on the Global Strategy simultaneously: • Foundational initiatives: HMOS, Push/Pull and Integrated Supply Chain • Marketing directly to the homeowner • Penetrate and Drive Profitable Growth • Commercialize Global Innovations • Adjusted Net Income increased 29% for the quarter and 38% for the half year • Strong Operating cash flow of US$357.5 million for the half year GLOBAL RESULTS Record Quarter for Net Sales, Adjusted EBIT and Adjusted Net Income M M M M M M M % % 2 Excludes asbestos related expenses and adjustments, tax adjustments and restructuring expenses 1 Excludes asbestos related expenses and adjustments and restructuring expenses mmsf +19% US$1,746.5 +28% Adjusted EBITDA Margin1 27.2 +0.7 pts US$386.2 US$903.2 +23% +26% +14% Operating Cash Flow Adjusted Net Income2 Adjusted EBIT1 Sales Volume Net Sales Q2 FY22 1,183.4 +29% US$205.7 mmsf US$154.9 6 Months FY22 2,324.0 US$357.5 -14% +0.8 pts 26.6 +34% US$289.1 +38%
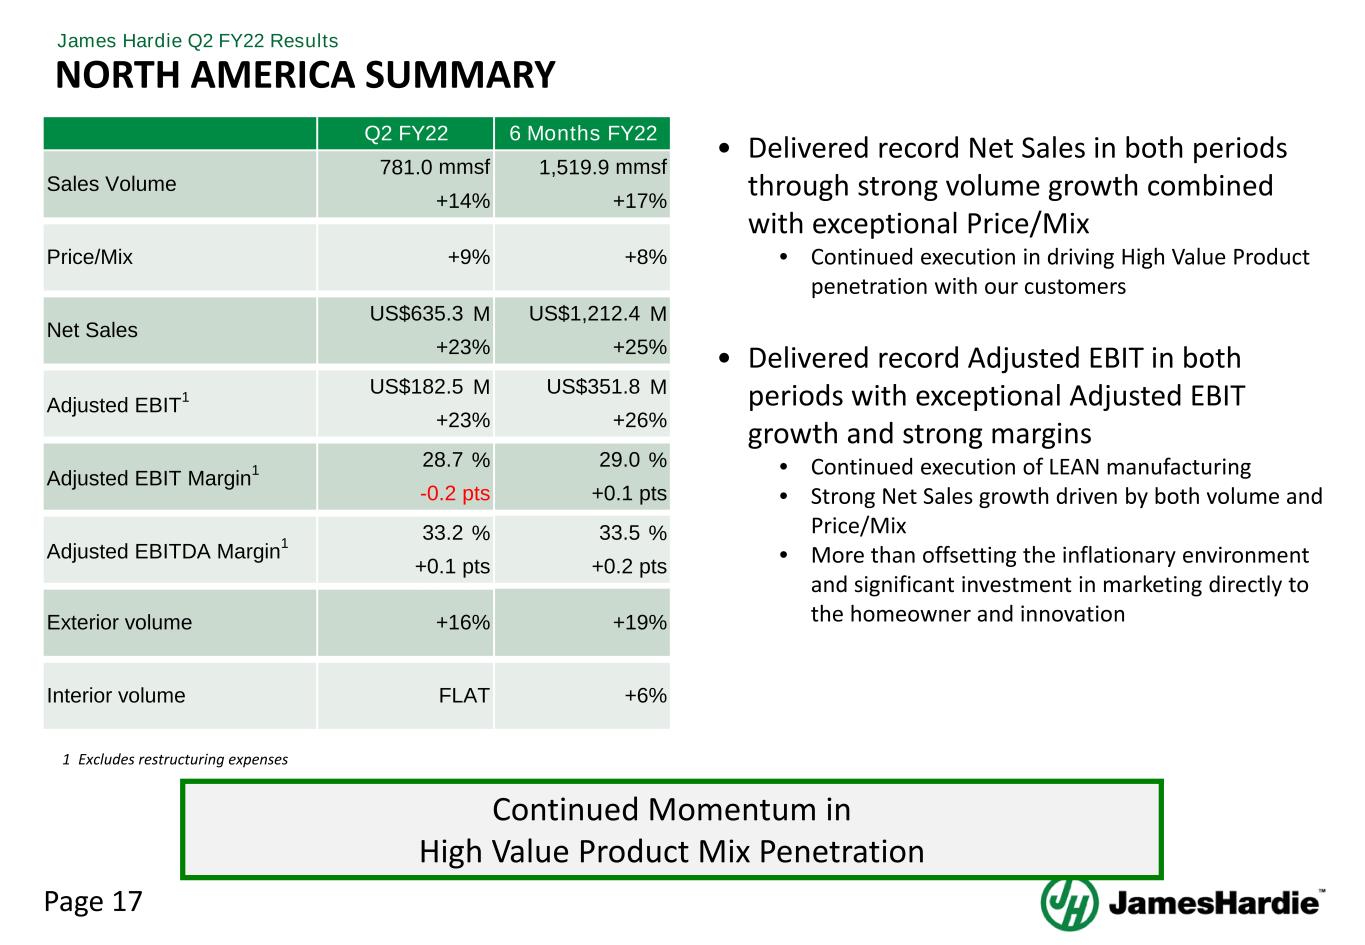
Page 17 James Hardie Q2 FY22 Results NORTH AMERICA SUMMARY • Delivered record Net Sales in both periods through strong volume growth combined with exceptional Price/Mix • Continued execution in driving High Value Product penetration with our customers • Delivered record Adjusted EBIT in both periods with exceptional Adjusted EBIT growth and strong margins • Continued execution of LEAN manufacturing • Strong Net Sales growth driven by both volume and Price/Mix • More than offsetting the inflationary environment and significant investment in marketing directly to the homeowner and innovation M M M M % % % % 1 Excludes restructuring expenses +9% +8% +16% +19% +6%FLATInterior volume Exterior volume 33.5 +0.2 pts US$1,212.4 +25% US$351.8 +26% 6 Months FY22 1,519.9 mmsf +17% 29.0 +0.1 pts Adjusted EBITDA Margin1 33.2 +0.1 pts Sales Volume Net Sales Adjusted EBIT Margin1 Adjusted EBIT1 28.7 -0.2 pts US$182.5 +23% +23% Price/Mix US$635.3 Q2 FY22 781.0 mmsf +14% Continued Momentum in High Value Product Mix Penetration
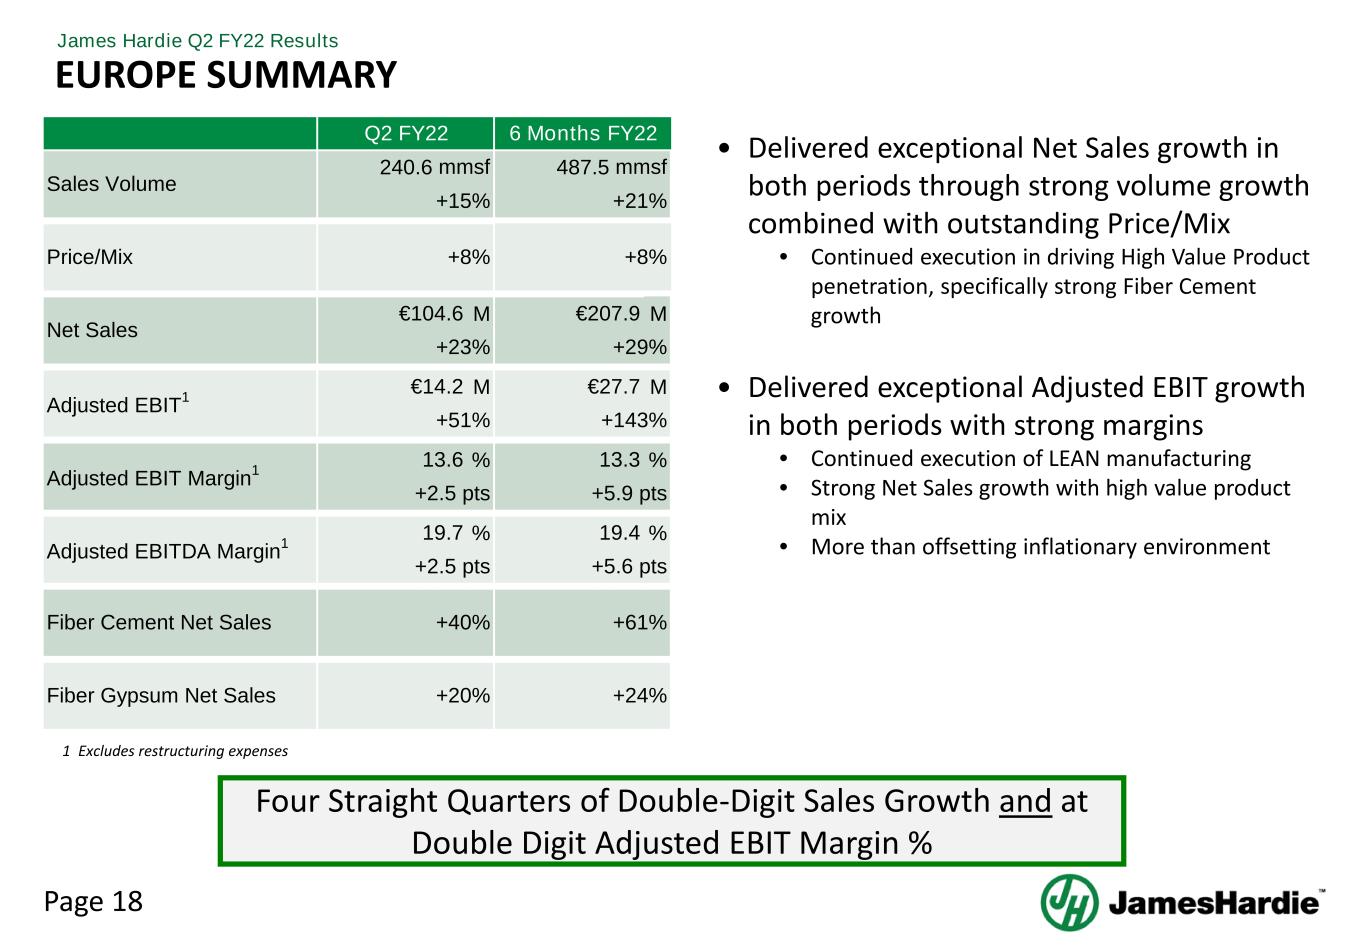
Page 18 James Hardie Q2 FY22 Results EUROPE SUMMARY • Delivered exceptional Net Sales growth in both periods through strong volume growth combined with outstanding Price/Mix • Continued execution in driving High Value Product penetration, specifically strong Fiber Cement growth • Delivered exceptional Adjusted EBIT growth in both periods with strong margins • Continued execution of LEAN manufacturing • Strong Net Sales growth with high value product mix • More than offsetting inflationary environment M M M M % % % % 1 Excludes restructuring expenses +8% +40% +61% +20% +24%Fiber Gypsum Net Sales Fiber Cement Net Sales 19.4 +5.6 pts 6 Months FY22 487.5 mmsf +21% €207.9 +29% €27.7 +143% 13.3 +5.9 pts Price/Mix Q2 FY22 Sales Volume 240.6 mmsf +15% Net Sales +23% €104.6 +8% Adjusted EBITDA Margin1 19.7 +2.5 pts Adjusted EBIT1 Adjusted EBIT Margin1 13.6 +2.5 pts €14.2 +51% Four Straight Quarters of Double-Digit Sales Growth and at Double Digit Adjusted EBIT Margin %
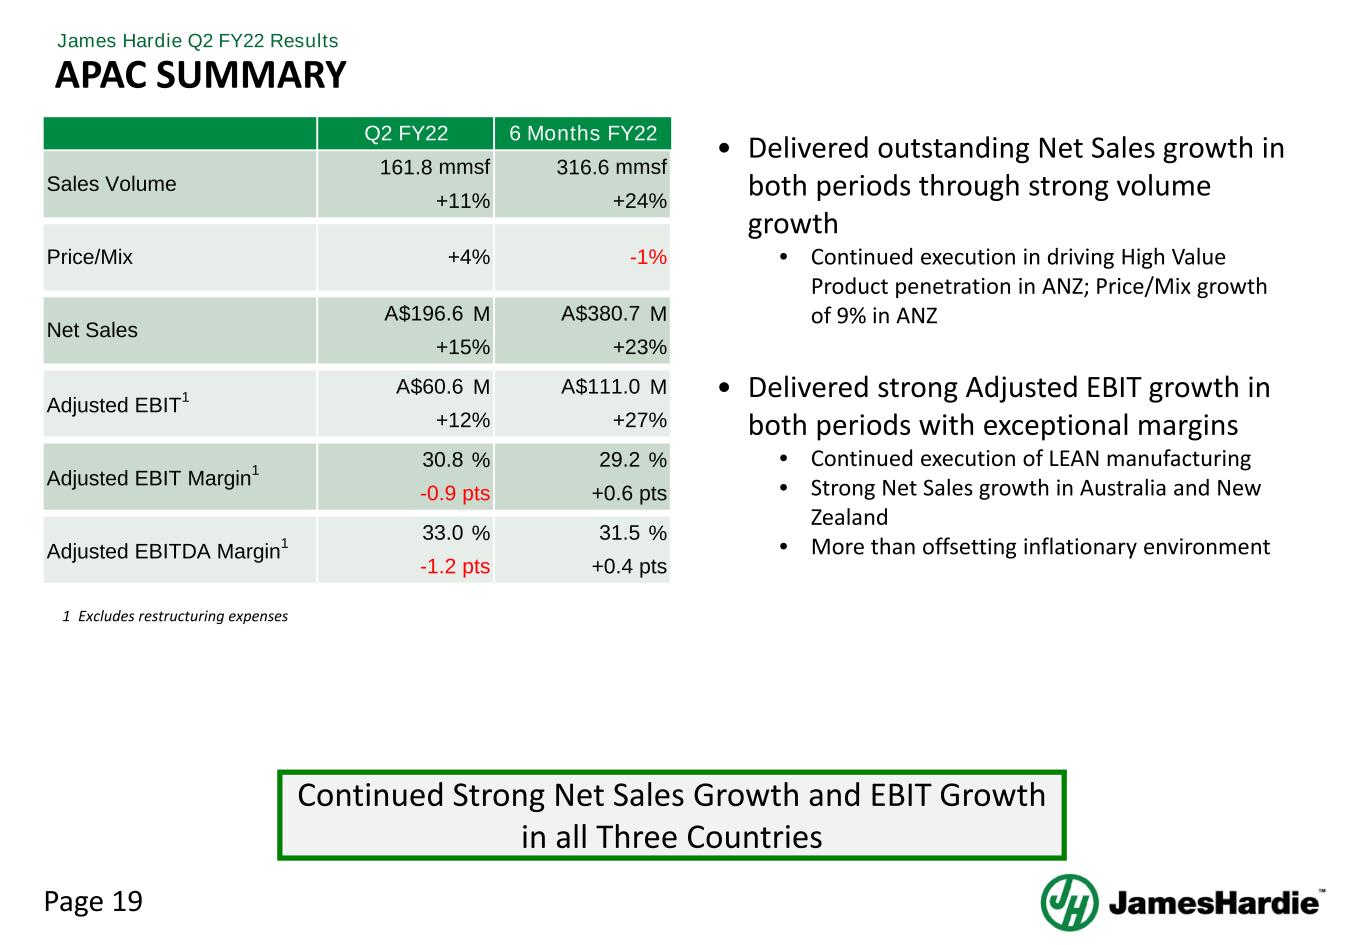
Page 19 James Hardie Q2 FY22 Results APAC SUMMARY • Delivered outstanding Net Sales growth in both periods through strong volume growth • Continued execution in driving High Value Product penetration in ANZ; Price/Mix growth of 9% in ANZ • Delivered strong Adjusted EBIT growth in both periods with exceptional margins • Continued execution of LEAN manufacturing • Strong Net Sales growth in Australia and New Zealand • More than offsetting inflationary environment Continued Strong Net Sales Growth and EBIT Growth in all Three Countries M M M M % % % % 1 Excludes restructuring expenses -1% 29.2 +0.6 pts 31.5 6 Months FY22 316.6 mmsf +24% 33.0 +0.4 pts A$380.7 +23% A$111.0 +27% Adjusted EBIT1 A$60.6 +12% Net Sales A$196.6 +15% Adjusted EBITDA Margin1 -1.2 pts Sales Volume 161.8 mmsf +11% Adjusted EBIT Margin1 30.8 Price/Mix -0.9 pts +4% Q2 FY22
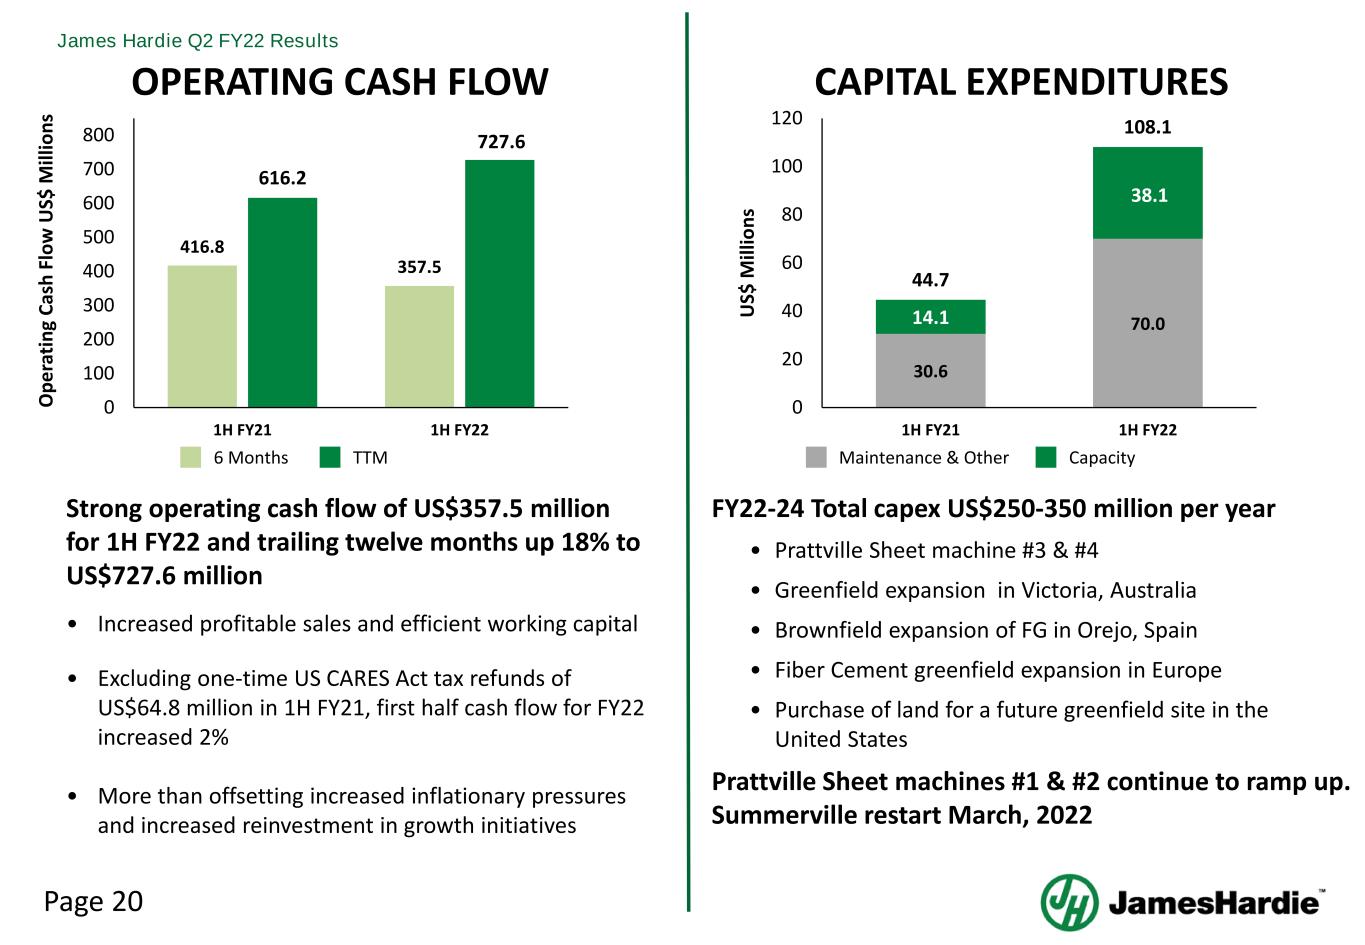
Page 20 James Hardie Q2 FY22 Results 1 OPERATING CASH FLOW CAPITAL EXPENDITURES FY22-24 Total capex US$250-350 million per year • Prattville Sheet machine #3 & #4 • Greenfield expansion in Victoria, Australia • Brownfield expansion of FG in Orejo, Spain • Fiber Cement greenfield expansion in Europe • Purchase of land for a future greenfield site in the United States Prattville Sheet machines #1 & #2 continue to ramp up. Summerville restart March, 2022 Strong operating cash flow of US$357.5 million for 1H FY22 and trailing twelve months up 18% to US$727.6 million • Increased profitable sales and efficient working capital • Excluding one-time US CARES Act tax refunds of US$64.8 million in 1H FY21, first half cash flow for FY22 increased 2% • More than offsetting increased inflationary pressures and increased reinvestment in growth initiatives O pe ra tin g Ca sh F lo w U S$ M ill io ns 416.8 357.5 616.2 727.6 0 100 200 300 400 500 600 700 800 1H FY21 1H FY22 6 Months TTM 30.6 70.014.1 38.1 44.7 108.1 0 20 40 60 80 100 120 1H FY21 1H FY22 U S$ M ill io ns Maintenance & Other Capacity
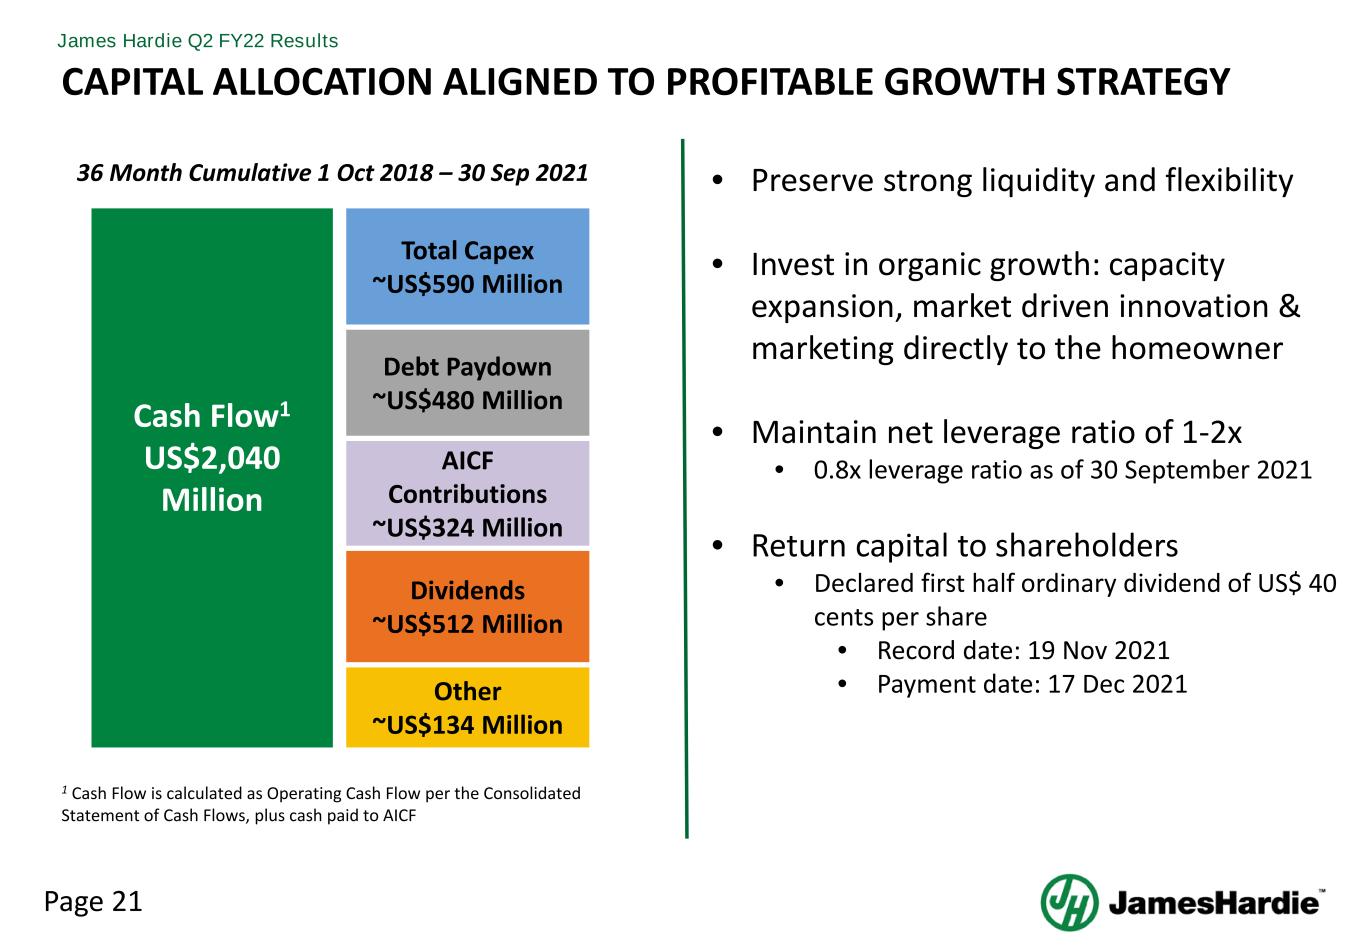
Page 21 James Hardie Q2 FY22 Results CAPITAL ALLOCATION ALIGNED TO PROFITABLE GROWTH STRATEGY 1 Cash Flow1 US$2,040 Million Other ~US$134 Million Debt Paydown ~US$480 Million Dividends ~US$512 Million Total Capex ~US$590 Million AICF Contributions ~US$324 Million 1 Cash Flow is calculated as Operating Cash Flow per the Consolidated Statement of Cash Flows, plus cash paid to AICF • Preserve strong liquidity and flexibility • Invest in organic growth: capacity expansion, market driven innovation & marketing directly to the homeowner • Maintain net leverage ratio of 1-2x • 0.8x leverage ratio as of 30 September 2021 • Return capital to shareholders • Declared first half ordinary dividend of US$ 40 cents per share • Record date: 19 Nov 2021 • Payment date: 17 Dec 2021 36 Month Cumulative 1 Oct 2018 – 30 Sep 2021
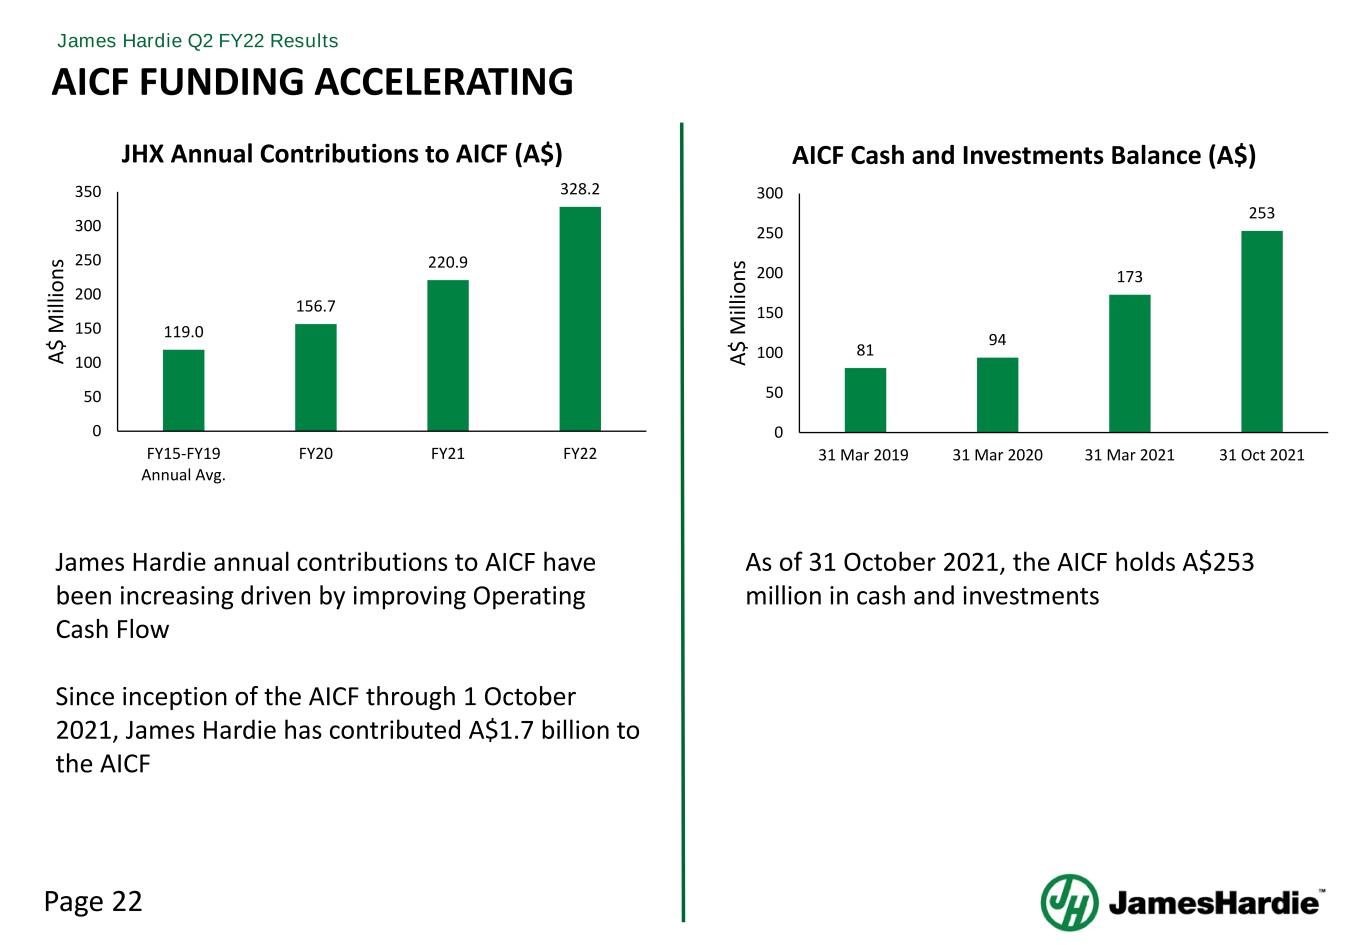
Page 22 James Hardie Q2 FY22 Results 81 94 173 253 0 50 100 150 200 250 300 31 Mar 2019 31 Mar 2020 31 Mar 2021 31 Oct 2021 A$ M ill io ns AICF Cash and Investments Balance (A$) 119.0 156.7 220.9 328.2 0 50 100 150 200 250 300 350 FY15-FY19 Annual Avg. FY20 FY21 FY22 A$ M ill io ns JHX Annual Contributions to AICF (A$) James Hardie annual contributions to AICF have been increasing driven by improving Operating Cash Flow Since inception of the AICF through 1 October 2021, James Hardie has contributed A$1.7 billion to the AICF AICF FUNDING ACCELERATING As of 31 October 2021, the AICF holds A$253 million in cash and investments
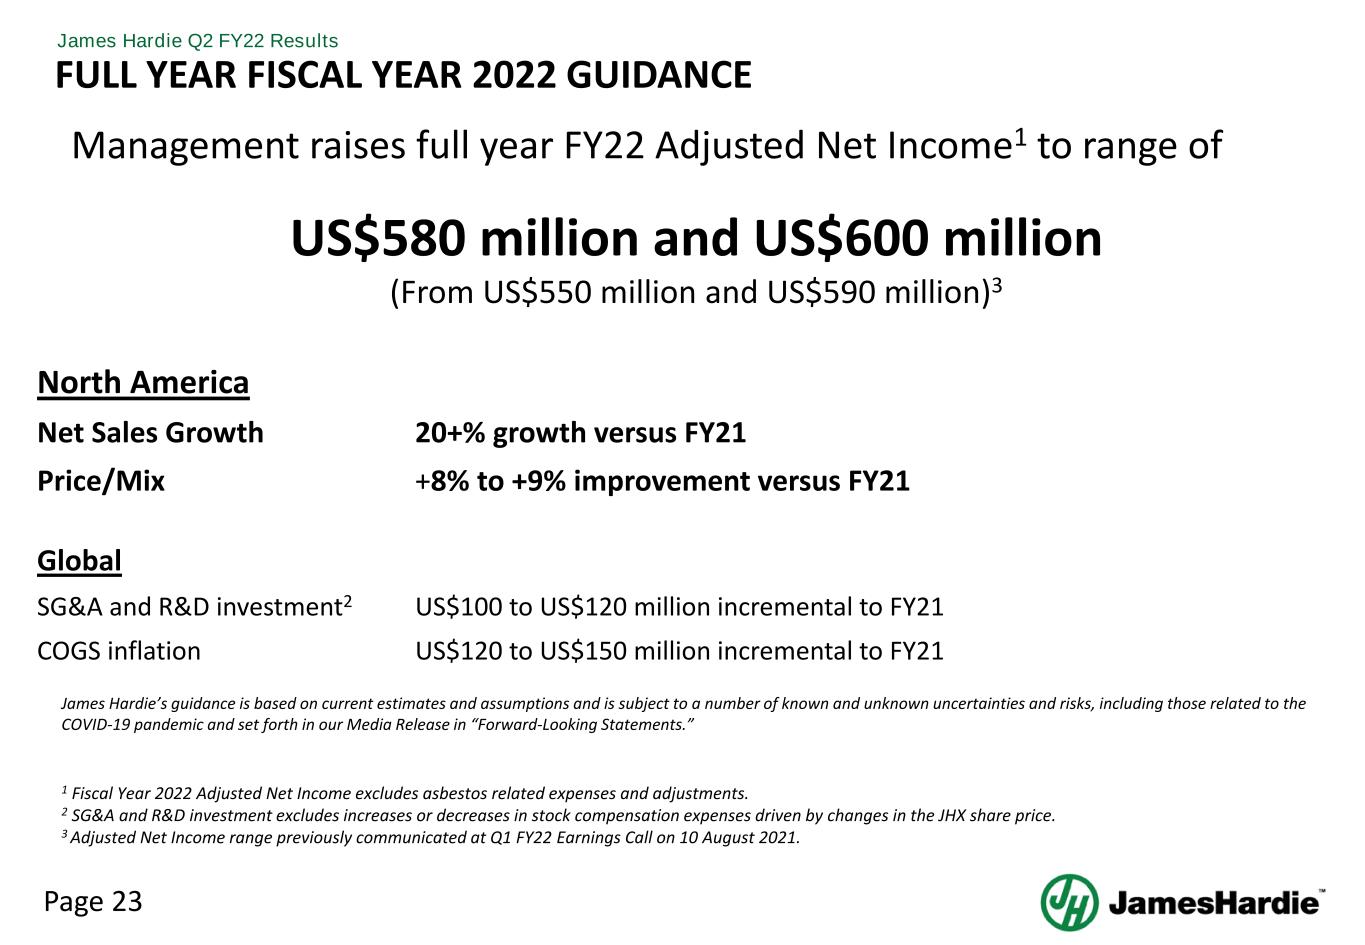
Page 23 James Hardie Q2 FY22 Results FULL YEAR FISCAL YEAR 2022 GUIDANCE Management raises full year FY22 Adjusted Net Income1 to range of US$580 million and US$600 million (From US$550 million and US$590 million)3 North America Net Sales Growth 20+% growth versus FY21 Price/Mix +8% to +9% improvement versus FY21 Global SG&A and R&D investment2 US$100 to US$120 million incremental to FY21 COGS inflation US$120 to US$150 million incremental to FY21 James Hardie’s guidance is based on current estimates and assumptions and is subject to a number of known and unknown uncertainties and risks, including those related to the COVID-19 pandemic and set forth in our Media Release in “Forward-Looking Statements.” 1 Fiscal Year 2022 Adjusted Net Income excludes asbestos related expenses and adjustments. 2 SG&A and R&D investment excludes increases or decreases in stock compensation expenses driven by changes in the JHX share price. 3 Adjusted Net Income range previously communicated at Q1 FY22 Earnings Call on 10 August 2021.
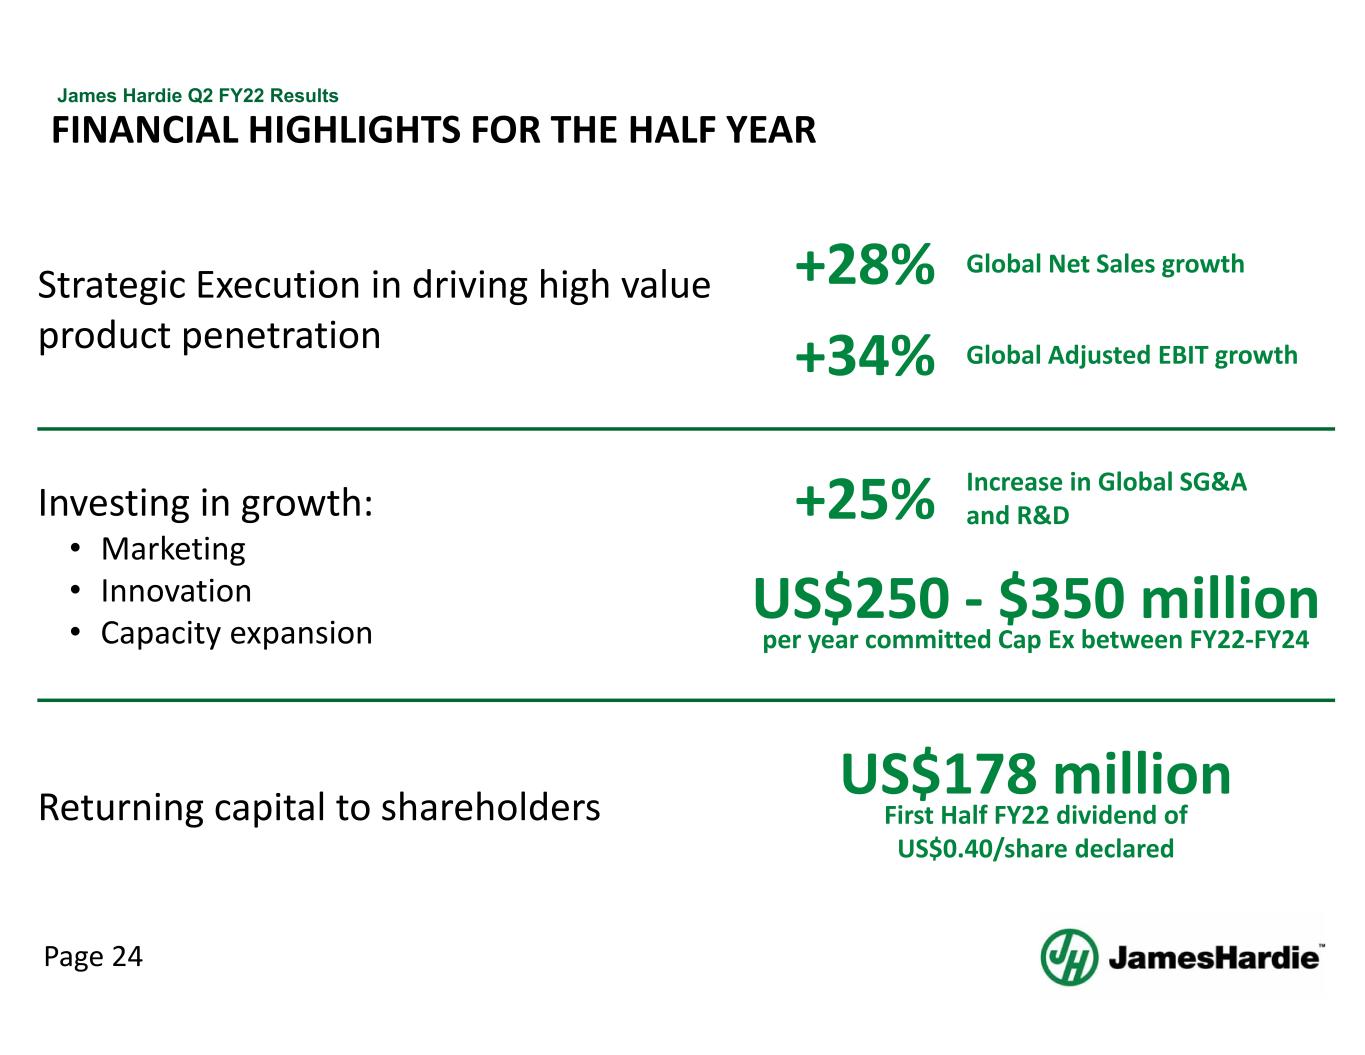
Page 24 James Hardie Q2 FY22 Results FINANCIAL HIGHLIGHTS FOR THE HALF YEAR Returning capital to shareholders Strategic Execution in driving high value product penetration +28% Global Net Sales growth +34% Global Adjusted EBIT growth Investing in growth: • Marketing • Innovation • Capacity expansion US$250 ‐ $350 million per year committed Cap Ex between FY22‐FY24 +25% Increase in Global SG&A and R&D US$178 million First Half FY22 dividend of US$0.40/share declared
QUESTIONS
APPENDIX
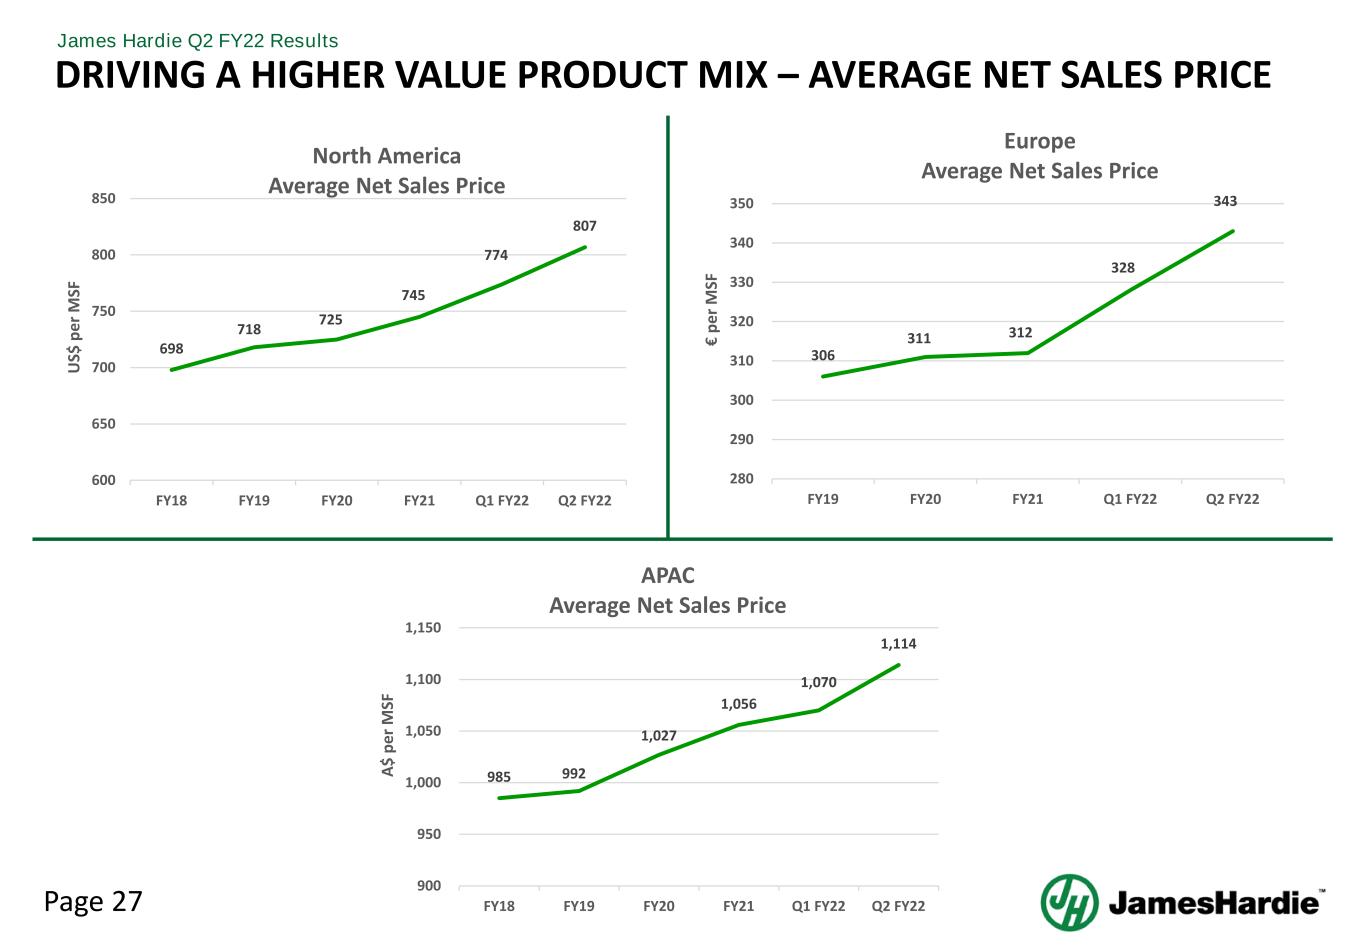
Page 27 James Hardie Q2 FY22 Results DRIVING A HIGHER VALUE PRODUCT MIX – AVERAGE NET SALES PRICE 698 718 725 745 774 807 600 650 700 750 800 850 FY18 FY19 FY20 FY21 Q1 FY22 Q2 FY22 U S$ p er M SF North America Average Net Sales Price 306 311 312 328 343 280 290 300 310 320 330 340 350 FY19 FY20 FY21 Q1 FY22 Q2 FY22 € pe r M SF Europe Average Net Sales Price 985 992 1,027 1,056 1,070 1,114 900 950 1,000 1,050 1,100 1,150 FY18 FY19 FY20 FY21 Q1 FY22 Q2 FY22 A$ p er M SF APAC Average Net Sales Price
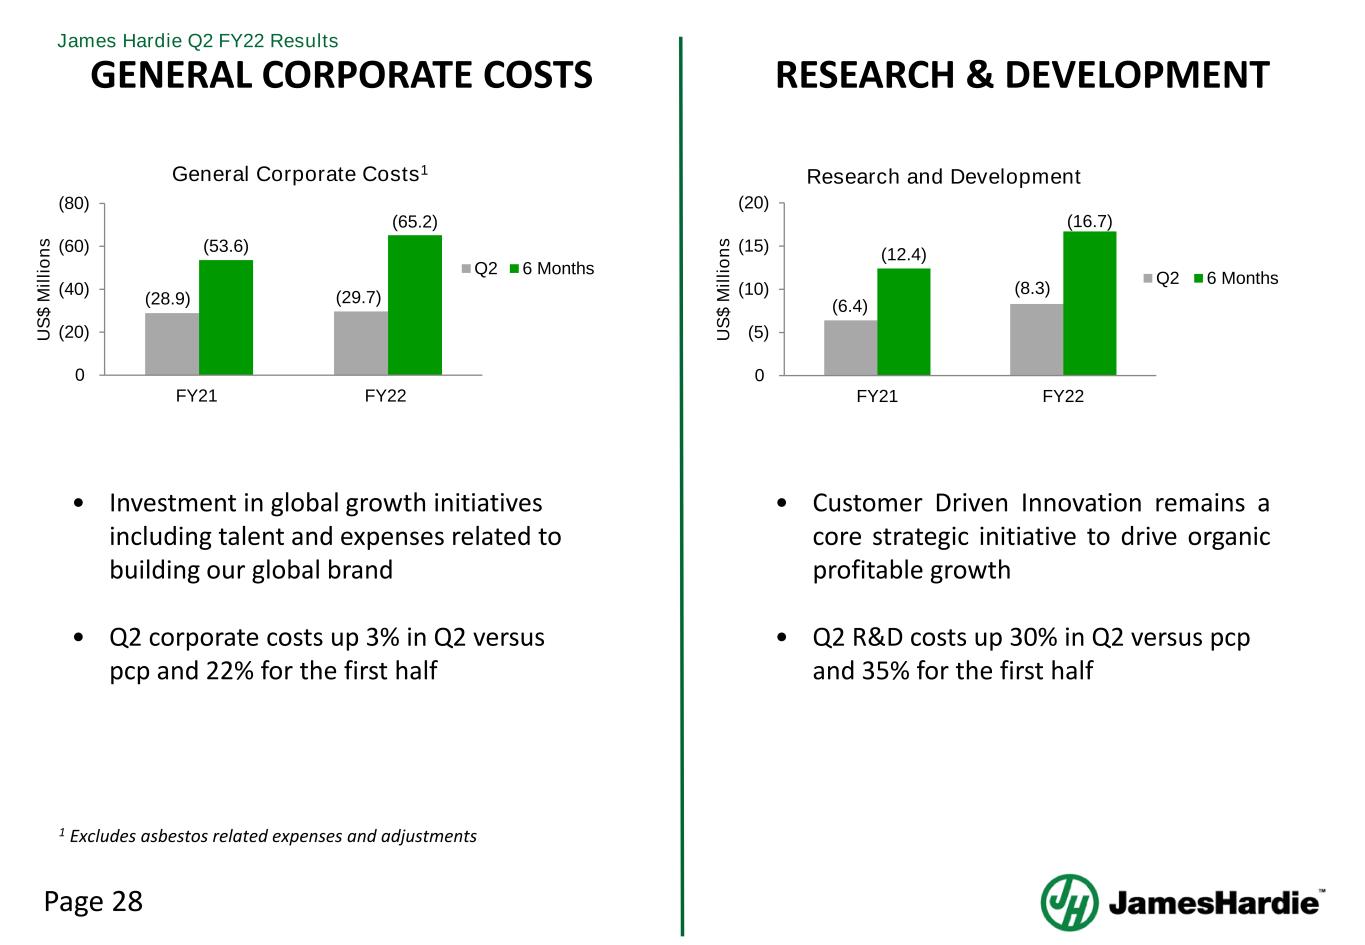
Page 28 James Hardie Q2 FY22 Results GENERAL CORPORATE COSTS • Investment in global growth initiatives including talent and expenses related to building our global brand • Q2 corporate costs up 3% in Q2 versus pcp and 22% for the first half • Customer Driven Innovation remains a core strategic initiative to drive organic profitable growth • Q2 R&D costs up 30% in Q2 versus pcp and 35% for the first half RESEARCH & DEVELOPMENT 1 Excludes asbestos related expenses and adjustments (6.4) (8.3) (12.4) (16.7) (20) (15) (10) (5) 0 FY21 FY22 U S$ M ill io ns Research and Development Q2 6 Months (28.9) (29.7) (53.6) (65.2) (80) (60) (40) (20) 0 FY21 FY22 U S$ M ill io ns General Corporate Costs1 Q2 6 Months
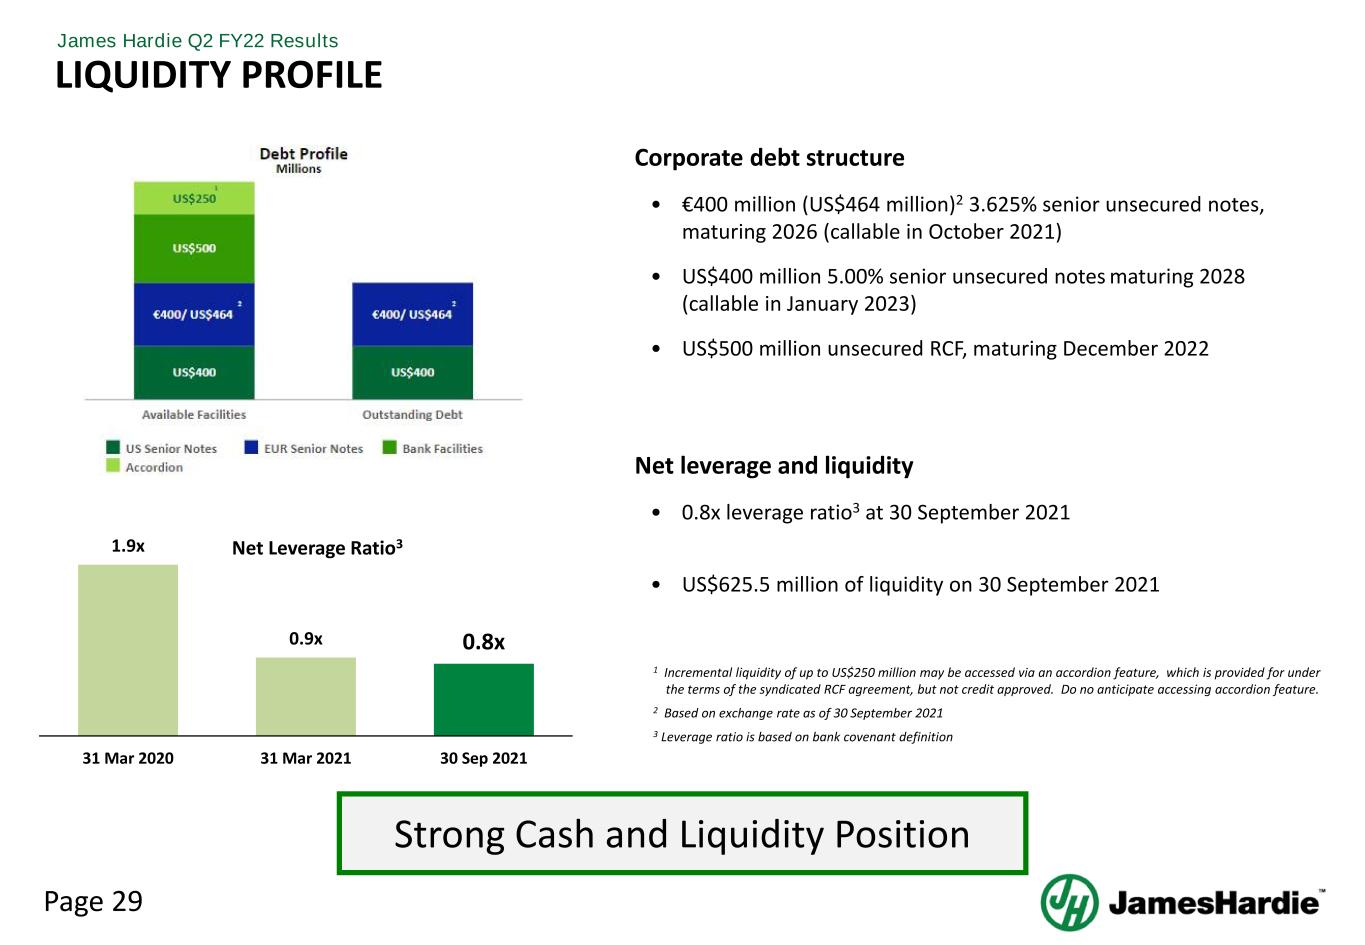
Page 29 James Hardie Q2 FY22 Results LIQUIDITY PROFILE Strong Cash and Liquidity Position 2 1 Incremental liquidity of up to US$250 million may be accessed via an accordion feature, which is provided for under the terms of the syndicated RCF agreement, but not credit approved. Do no anticipate accessing accordion feature. 2 Based on exchange rate as of 30 September 2021 3 Leverage ratio is based on bank covenant definition 1.9x 0.9x 0.8x 31 Mar 2020 31 Mar 2021 30 Sep 2021 Net Leverage Ratio3 Corporate debt structure • €400 million (US$464 million)2 3.625% senior unsecured notes, maturing 2026 (callable in October 2021) • US$400 million 5.00% senior unsecured notes maturing 2028 (callable in January 2023) • US$500 million unsecured RCF, maturing December 2022 Net leverage and liquidity • 0.8x leverage ratio3 at 30 September 2021 • US$625.5 million of liquidity on 30 September 2021
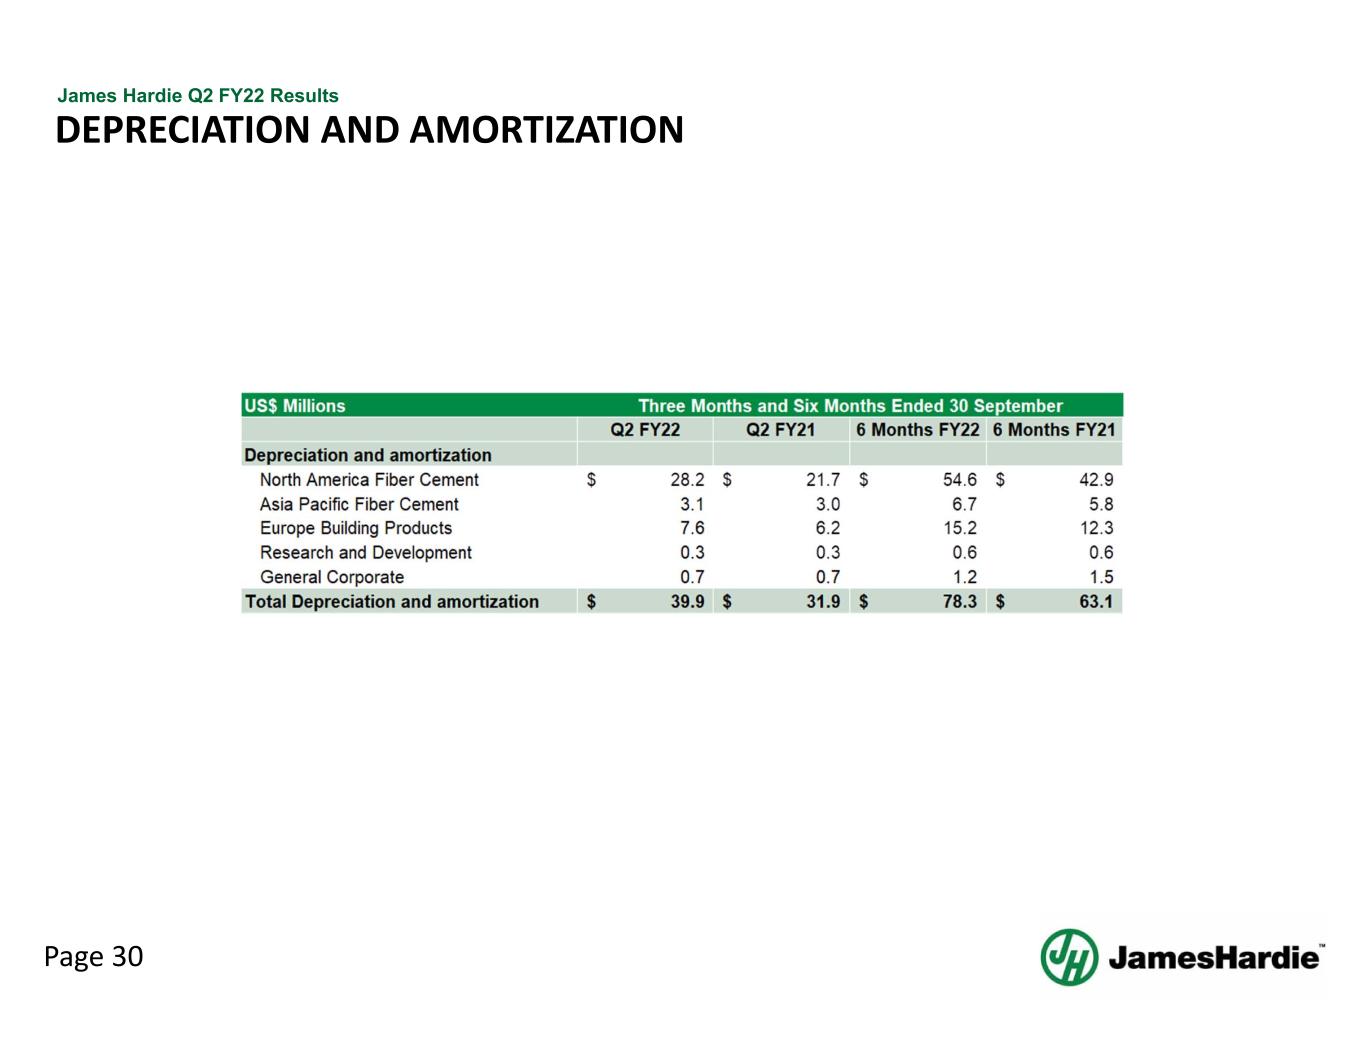
Page 30 James Hardie Q2 FY22 Results DEPRECIATION AND AMORTIZATION
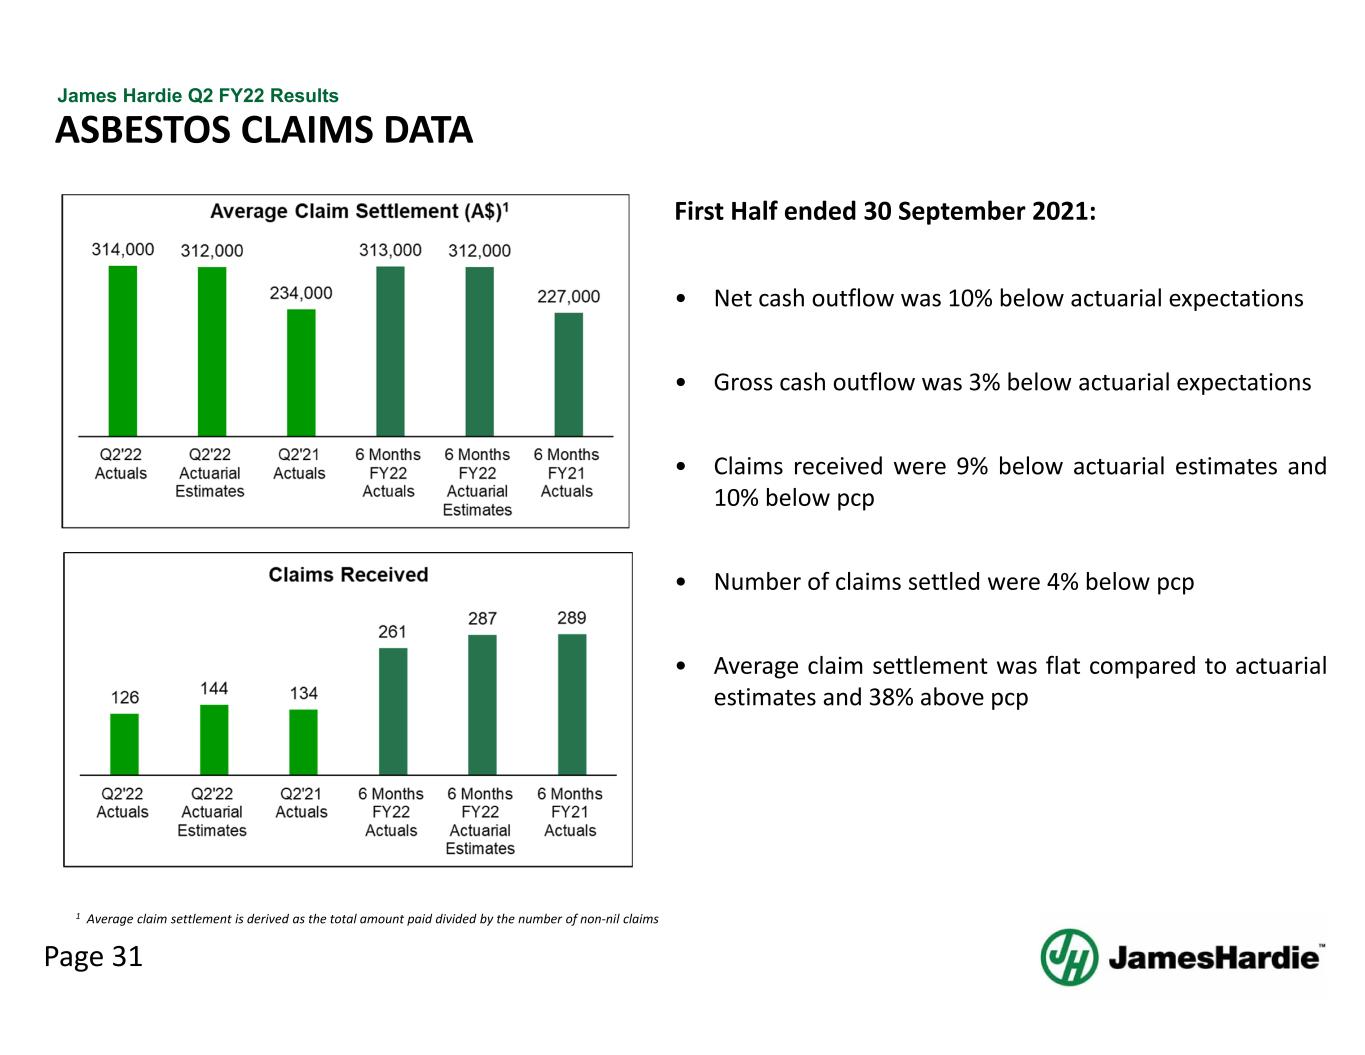
Page 31 James Hardie Q2 FY22 Results First Half ended 30 September 2021: • Net cash outflow was 10% below actuarial expectations • Gross cash outflow was 3% below actuarial expectations • Claims received were 9% below actuarial estimates and 10% below pcp • Number of claims settled were 4% below pcp • Average claim settlement was flat compared to actuarial estimates and 38% above pcp ASBESTOS CLAIMS DATA 1 Average claim settlement is derived as the total amount paid divided by the number of non‐nil claims
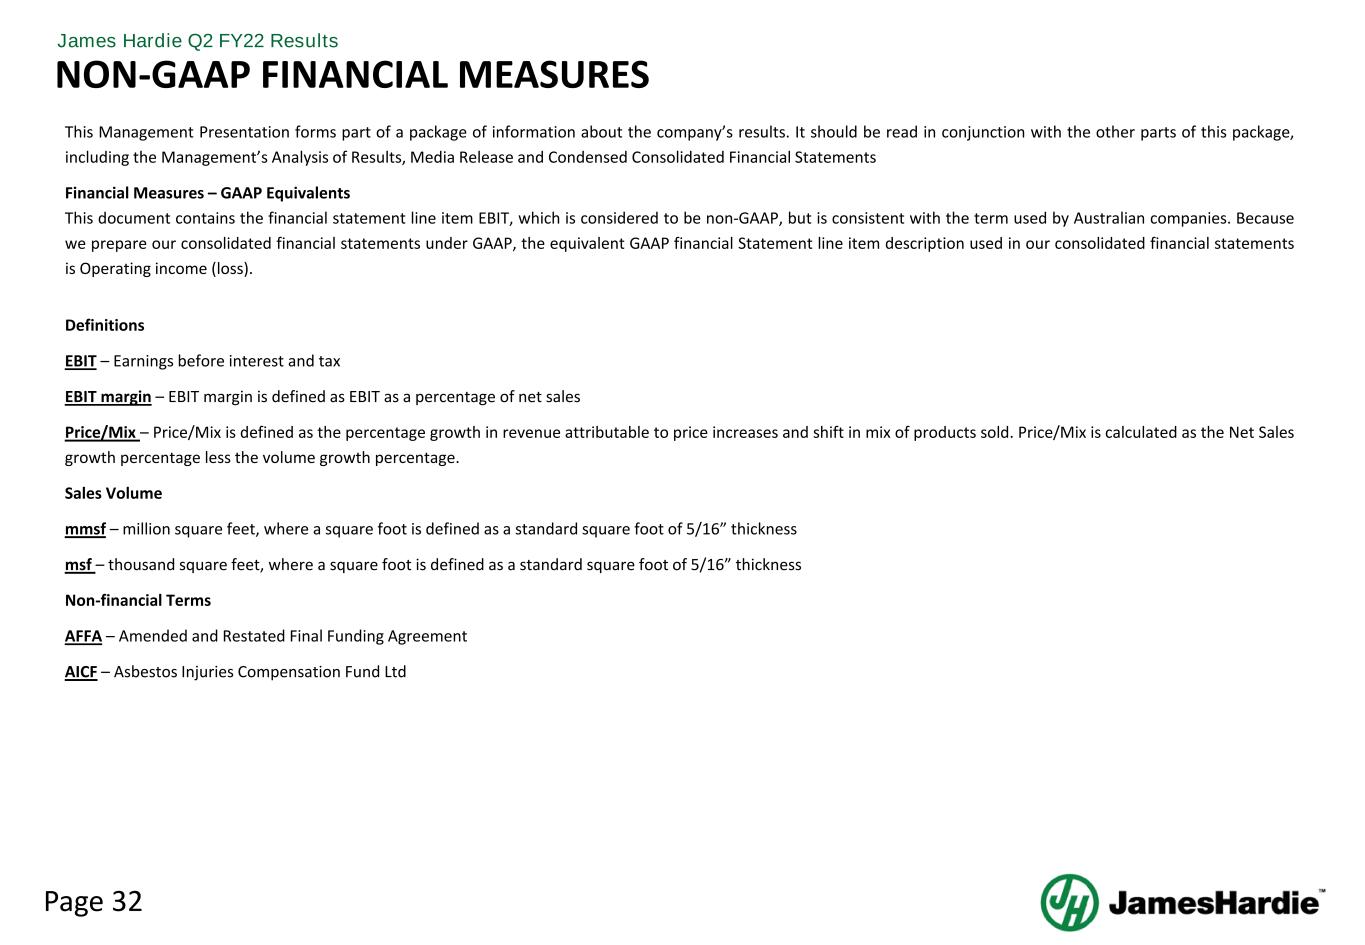
Page 32 James Hardie Q2 FY22 Results This Management Presentation forms part of a package of information about the company’s results. It should be read in conjunction with the other parts of this package, including the Management’s Analysis of Results, Media Release and Condensed Consolidated Financial Statements Financial Measures – GAAP Equivalents This document contains the financial statement line item EBIT, which is considered to be non-GAAP, but is consistent with the term used by Australian companies. Because we prepare our consolidated financial statements under GAAP, the equivalent GAAP financial Statement line item description used in our consolidated financial statements is Operating income (loss). Definitions EBIT – Earnings before interest and tax EBIT margin – EBIT margin is defined as EBIT as a percentage of net sales Price/Mix – Price/Mix is defined as the percentage growth in revenue attributable to price increases and shift in mix of products sold. Price/Mix is calculated as the Net Sales growth percentage less the volume growth percentage. Sales Volume mmsf – million square feet, where a square foot is defined as a standard square foot of 5/16” thickness msf – thousand square feet, where a square foot is defined as a standard square foot of 5/16” thickness Non-financial Terms AFFA – Amended and Restated Final Funding Agreement AICF – Asbestos Injuries Compensation Fund Ltd NON-GAAP FINANCIAL MEASURES
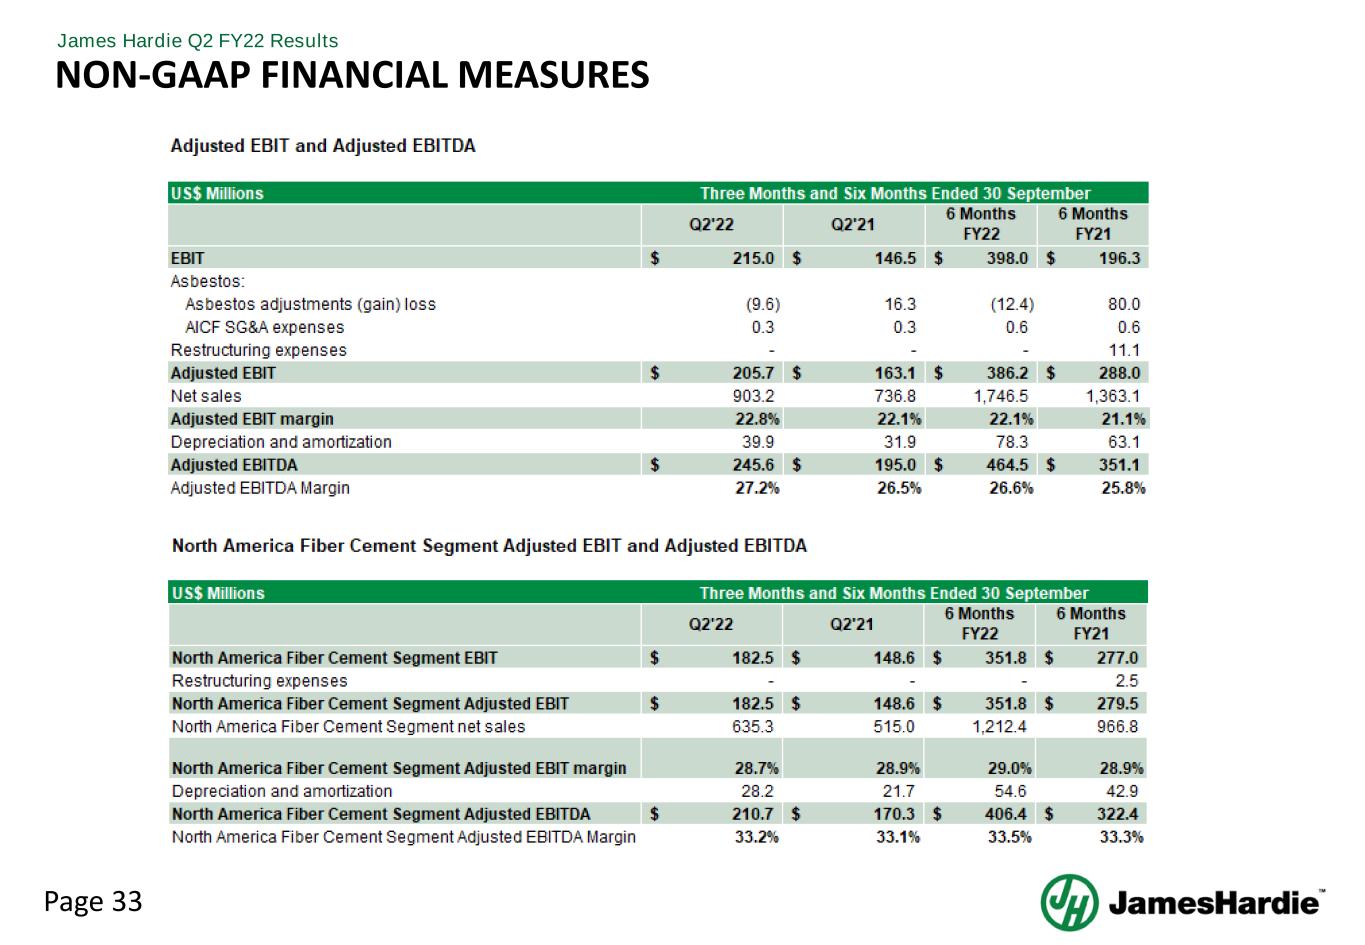
Page 33 James Hardie Q2 FY22 Results NON-GAAP FINANCIAL MEASURES
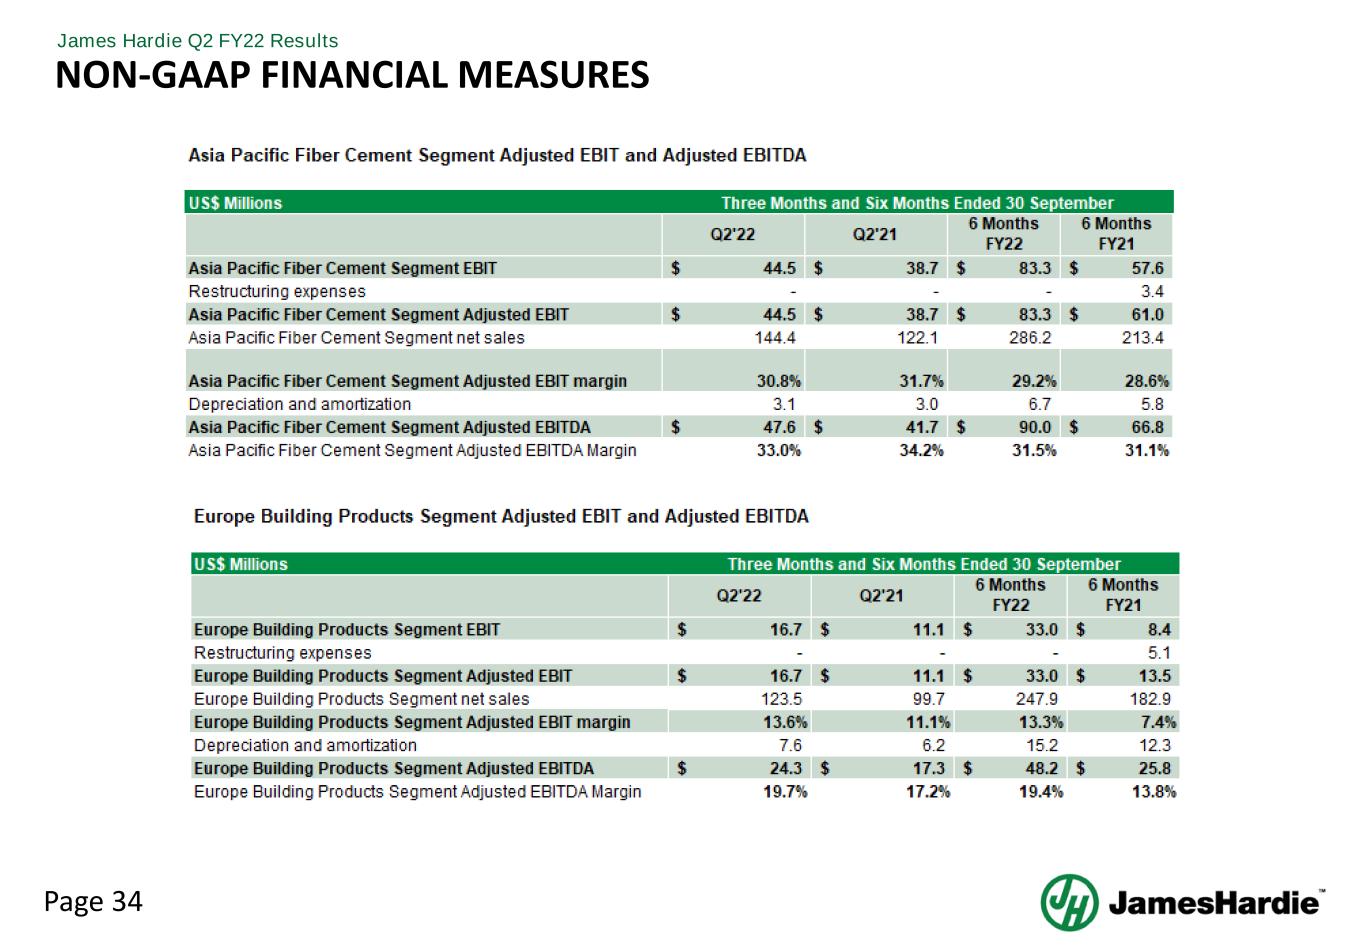
Page 34 James Hardie Q2 FY22 Results NON-GAAP FINANCIAL MEASURES
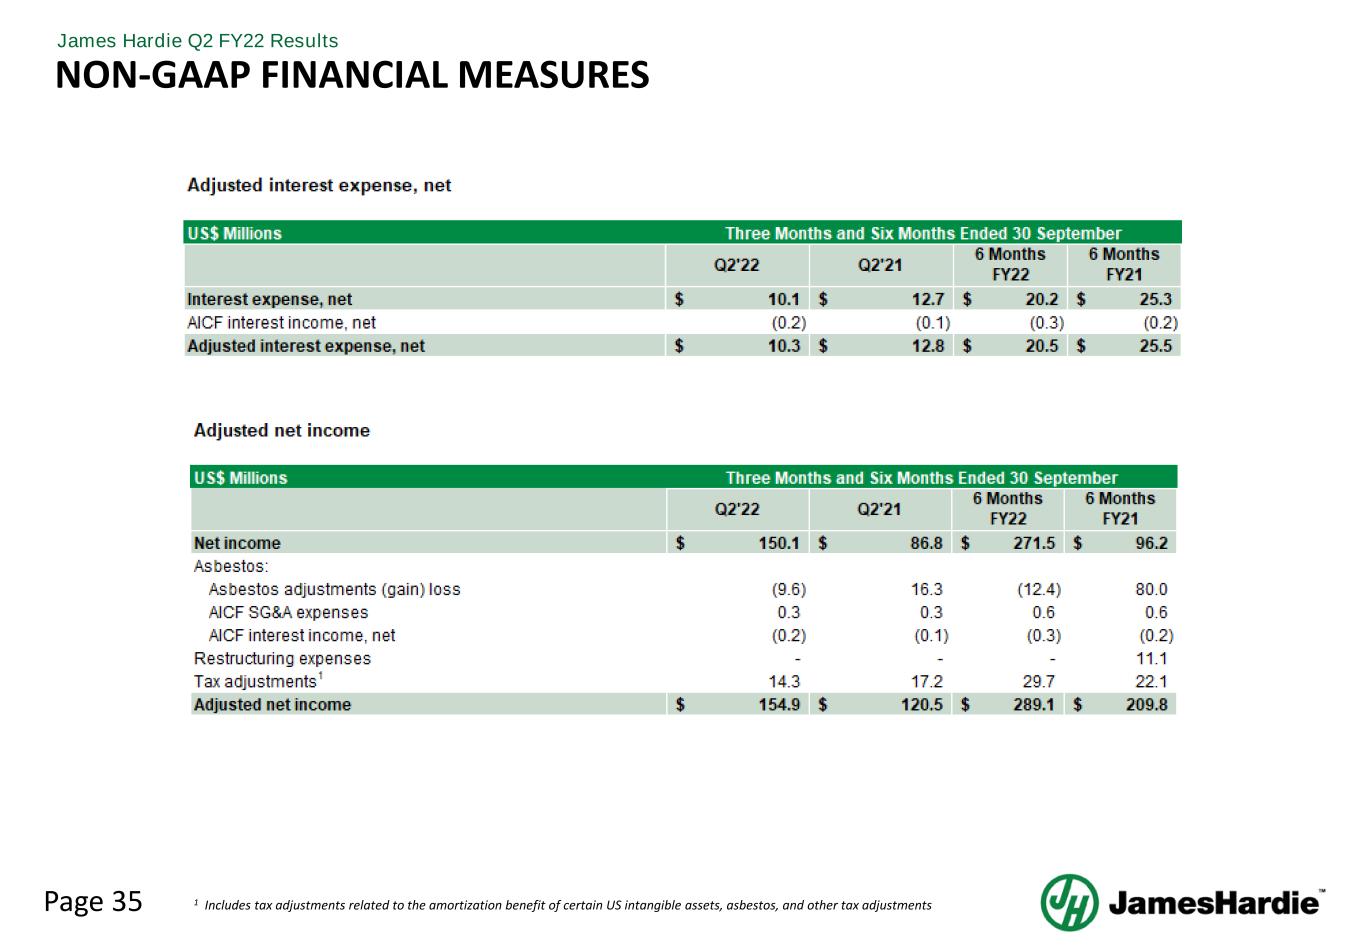
Page 35 James Hardie Q2 FY22 Results NON-GAAP FINANCIAL MEASURES 1 Includes tax adjustments related to the amortization benefit of certain US intangible assets, asbestos, and other tax adjustments
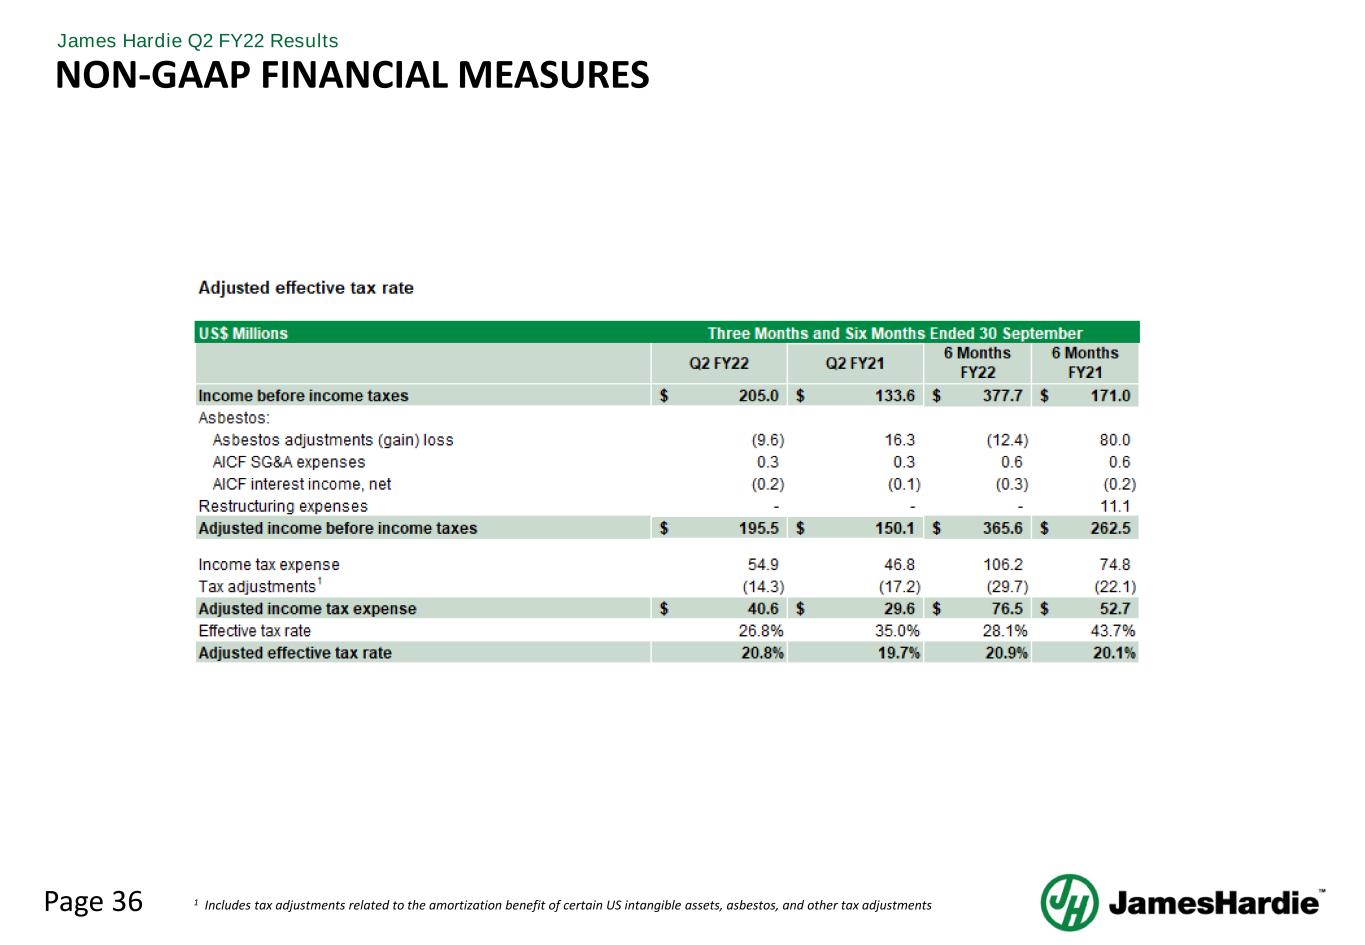
Page 36 James Hardie Q2 FY22 Results NON-GAAP FINANCIAL MEASURES 1 Includes tax adjustments related to the amortization benefit of certain US intangible assets, asbestos, and other tax adjustments

Q2 FY22 MANAGEMENT PRESENTATION 9 November 2021