
Q4 FY22 MANAGEMENT PRESENTATION 17 May 2022 Exhibit 99.5
Page 2 James Hardie Q4 FY22 Results CAUTIONARY NOTE ON FORWARD-LOOKING STATEMENTS This Management Presentation contains forward looking statements within the meaning of the Private Securities Litigation Reform Act of 1995. James Hardie Industries plc (the “Company”) may from time to time make forward-looking statements in its periodic reports filed with or furnished to the Securities and Exchange Commission on Forms 20-F and 6-K, in its annual reports to shareholders, in media releases and other written materials and in oral statements made by the Company’s officers, directors or employees to analysts, institutional investors, representatives of the media and others. Words such as “believe,” “anticipate,” “plan,” “expect,” “intend,” “target,” “estimate,” “project,” “predict,” “forecast,” “guideline,” “aim,” “will,” “should,” “likely,” “continue,” “may,” “objective,” “outlook” and similar expressions are intended to identify forward-looking statements but are not the exclusive means of identifying such statements. These forward-looking statements are based upon management's current expectations, estimates, assumptions and beliefs concerning future events and conditions. Readers are cautioned not to place undue reliance on any forward- looking statements. Forward-looking statements are necessarily subject to risks, uncertainties and other factors, many of which are unforeseeable and beyond the Company’s control. Many factors could cause actual results, performance or achievements to be materially different from those expressed or implied in this Management Presentation, including, among others, the risks and uncertainties set forth in Section 3 “Risk Factors” in James Hardie’s Annual Report on Form 20-F for the year ended 31 March 2022; changes in general economic, political, governmental and business conditions globally and in the countries in which the Company does business, including the impact of COVID-19; changes in interest rates; changes in inflation rates; changes in exchange rates; the level of construction generally; changes in cement demand and prices; changes in raw material and energy prices; changes in business strategy and various other factors. Should one or more of these risks or uncertainties materialize, or should underlying assumptions prove incorrect, actual results may vary materially from those described herein. James Hardie assumes no obligation to update or correct the information contained in this Management Presentation except as required by law. This Management Presentation includes financial measures that are not considered a measure of financial performance under generally accepted accounting principles in the United States (GAAP). These financial measures are designed to provide investors with an alternative method for assessing our performance from on-going operations, capital efficiency and profit generation. Management uses these financial measures for the same purposes. These financial measures are or may be non-GAAP financial measures as defined in the rules of the U.S. Securities and Exchange Commission and may exclude or include amounts that are included or excluded, as applicable, in the calculation of the most directly comparable financial measures calculated in accordance with GAAP. These non-GAAP financial measures should not be considered to be more meaningful than the equivalent GAAP measure. Management has included such measures to provide investors with an alternative method for assessing its operating results in a manner that is focused on the performance of its ongoing operations and excludes the impact of certain legacy items, such as asbestos adjustments. Additionally, management uses such non-GAAP financial measures for the same purposes. However, these non-GAAP financial measures are not prepared in accordance with GAAP, may not be reported by all of the Company’s competitors and may not be directly comparable to similarly titled measures of the Company’s competitors due to potential differences in the exact method of calculation. For additional information regarding the non-GAAP financial measures presented in this Management Presentation, including a reconciliation of each non-GAAP financial measure to the equivalent GAAP measure, see the slide titled “Non-GAAP Financial Measures” included in the Appendix to this Management Presentation. In addition, this Management Presentation includes financial measures and descriptions that are considered to not be in accordance with GAAP, but which are consistent with financial measures reported by Australian companies, such as operating profit, EBIT and EBIT margin. Since the Company prepares its Consolidated Financial Statements in accordance with GAAP, the Company provides investors with definitions and a cross-reference from the non-GAAP financial measure used in this Management Presentation to the equivalent GAAP financial measure used in the Company’s Consolidated Financial Statements. See the section titled “Non-GAAP Financial Measures” included in the Appendix to this Management Presentation. CAUTIONARY NOTE ON FORWARD-LOOKING STATEMENTS USE OF NON-GAAP FINANCIAL INFORMATION; AUSTRALIAN EQUIVALENT TERMINOLOGY
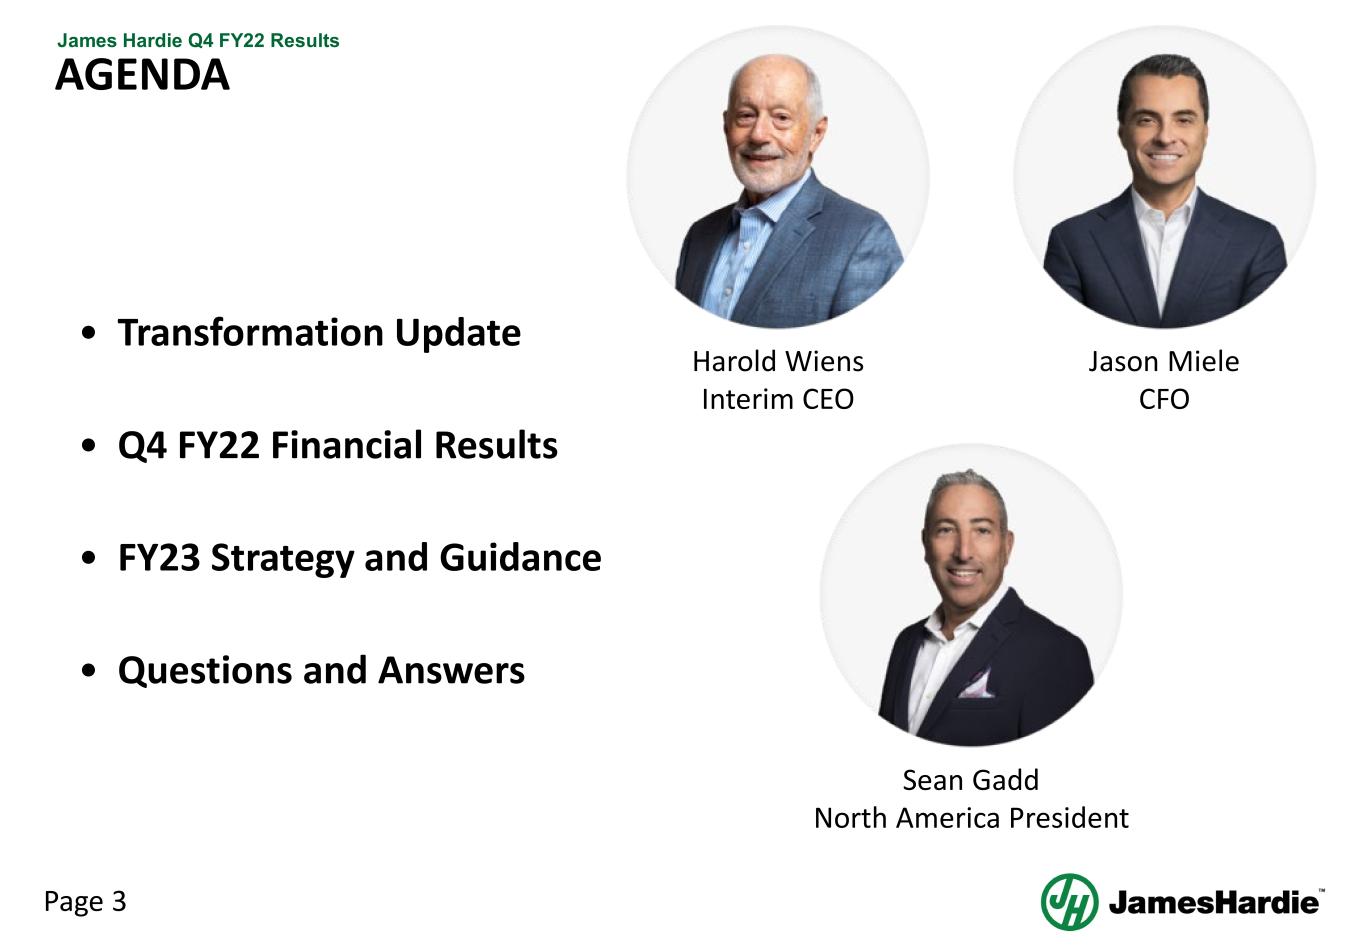
Page 3 James Hardie Q4 FY22 Results AGENDA • Transformation Update • Q4 FY22 Financial Results • FY23 Strategy and Guidance • Questions and Answers Harold Wiens Interim CEO Jason Miele CFO Sean Gadd North America President

TRANSFORMATION UPDATE
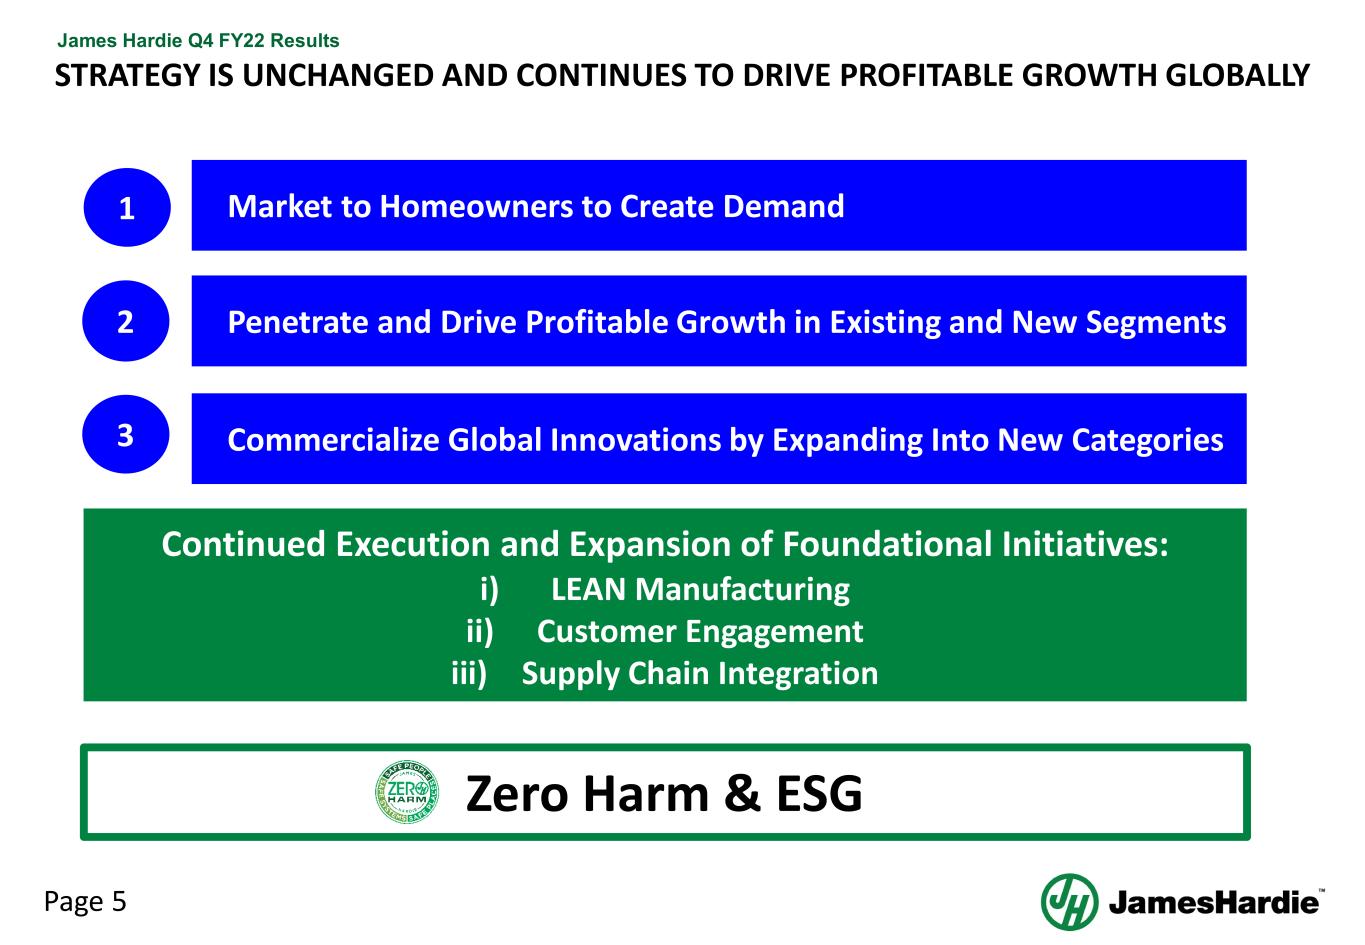
Page 5 James Hardie Q4 FY22 Results STRATEGY IS UNCHANGED AND CONTINUES TO DRIVE PROFITABLE GROWTH GLOBALLY Market to Homeowners to Create Demand Penetrate and Drive Profitable Growth in Existing and New Segments Commercialize Global Innovations by Expanding Into New Categories Continued Execution and Expansion of Foundational Initiatives: i) LEAN Manufacturing ii) Customer Engagement iii) Supply Chain Integration 1 2 3 Zero Harm & ESG
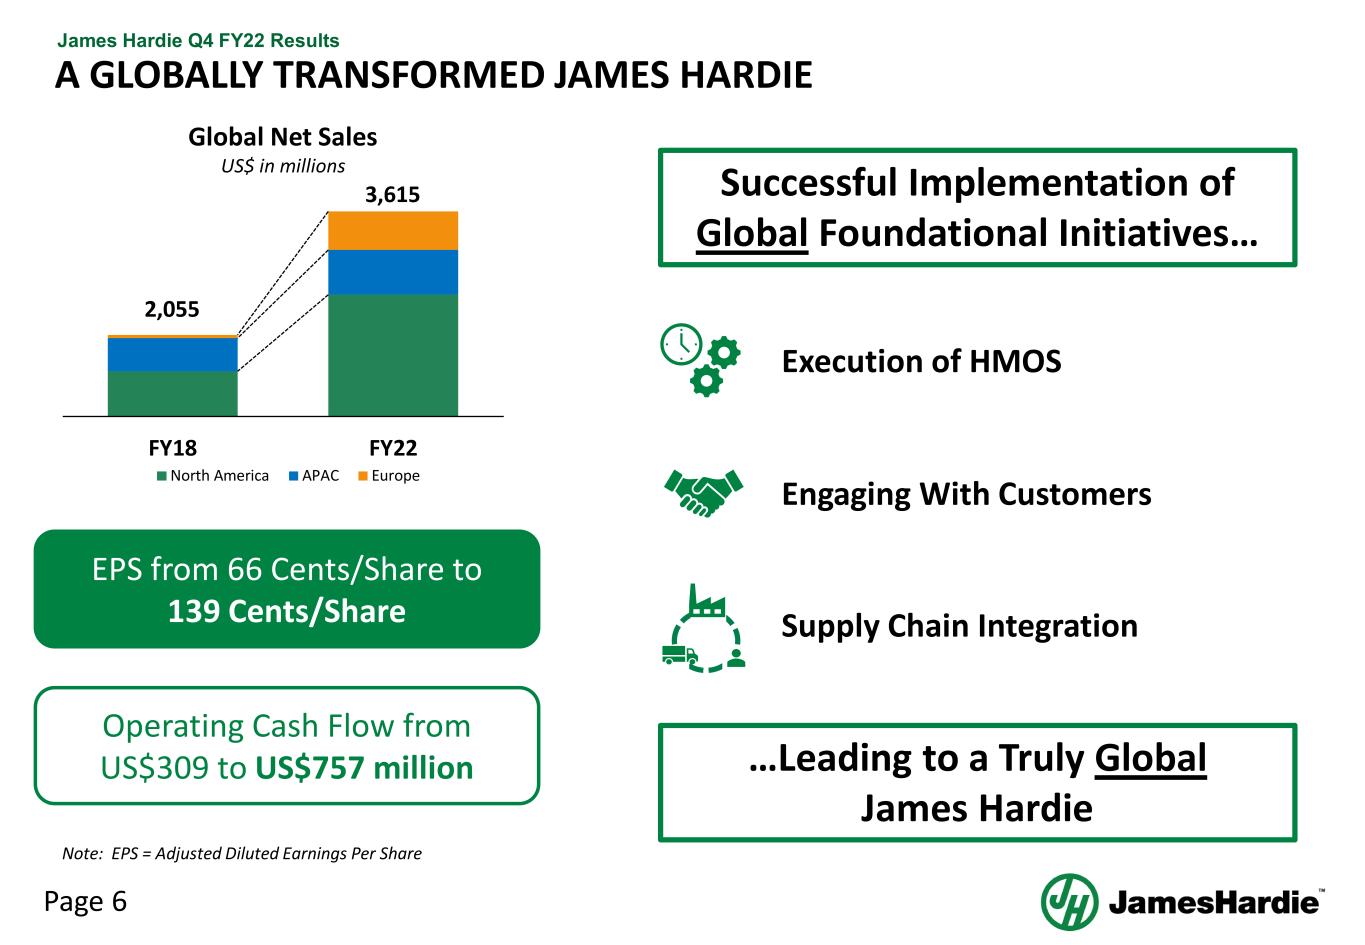
Page 6 James Hardie Q4 FY22 Results A GLOBALLY TRANSFORMED JAMES HARDIE FY18 FY22 North America APAC Europe Global Net Sales US$ in millions Execution of HMOS Successful Implementation of Global Foundational Initiatives… …Leading to a Truly Global James Hardie 2,055 3,615 Engaging With Customers Supply Chain Integration EPS from 66 Cents/Share to 139 Cents/Share Operating Cash Flow from US$309 to US$757 million Note: EPS = Adjusted Diluted Earnings Per Share
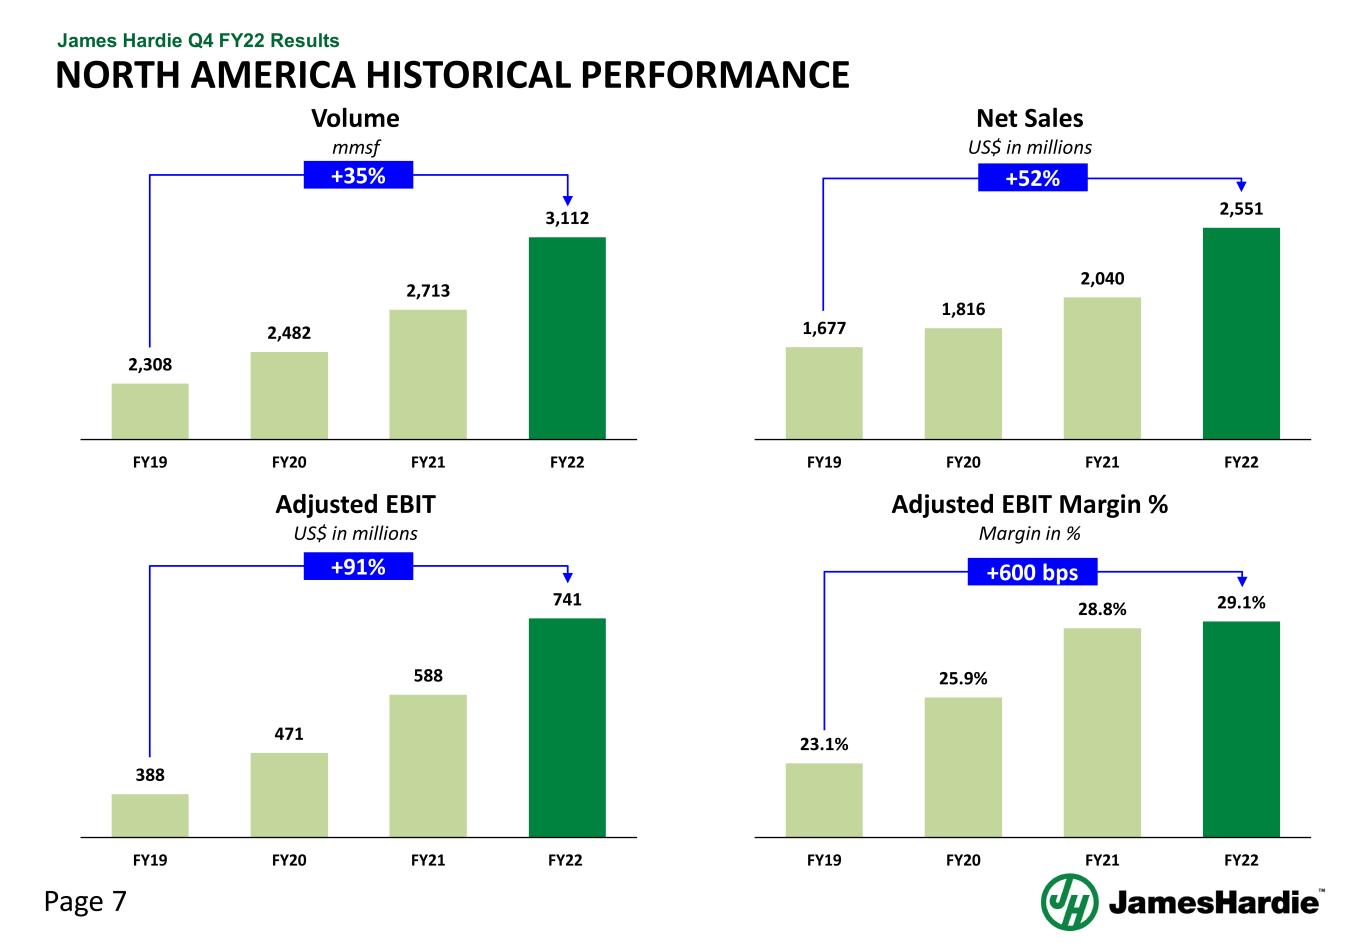
Page 7 James Hardie Q4 FY22 Results NORTH AMERICA HISTORICAL PERFORMANCE 2,308 2,482 2,713 3,112 FY19 FY20 FY21 FY22 Volume mmsf 1,677 1,816 2,040 2,551 FY19 FY20 FY21 FY22 388 471 588 741 FY19 FY20 FY21 FY22 Adjusted EBIT US$ in millions 23.1% 25.9% 28.8% 29.1% FY19 FY20 FY21 FY22 +35% +52% +91% +600 bps Adjusted EBIT Margin % Margin in % Net Sales US$ in millions
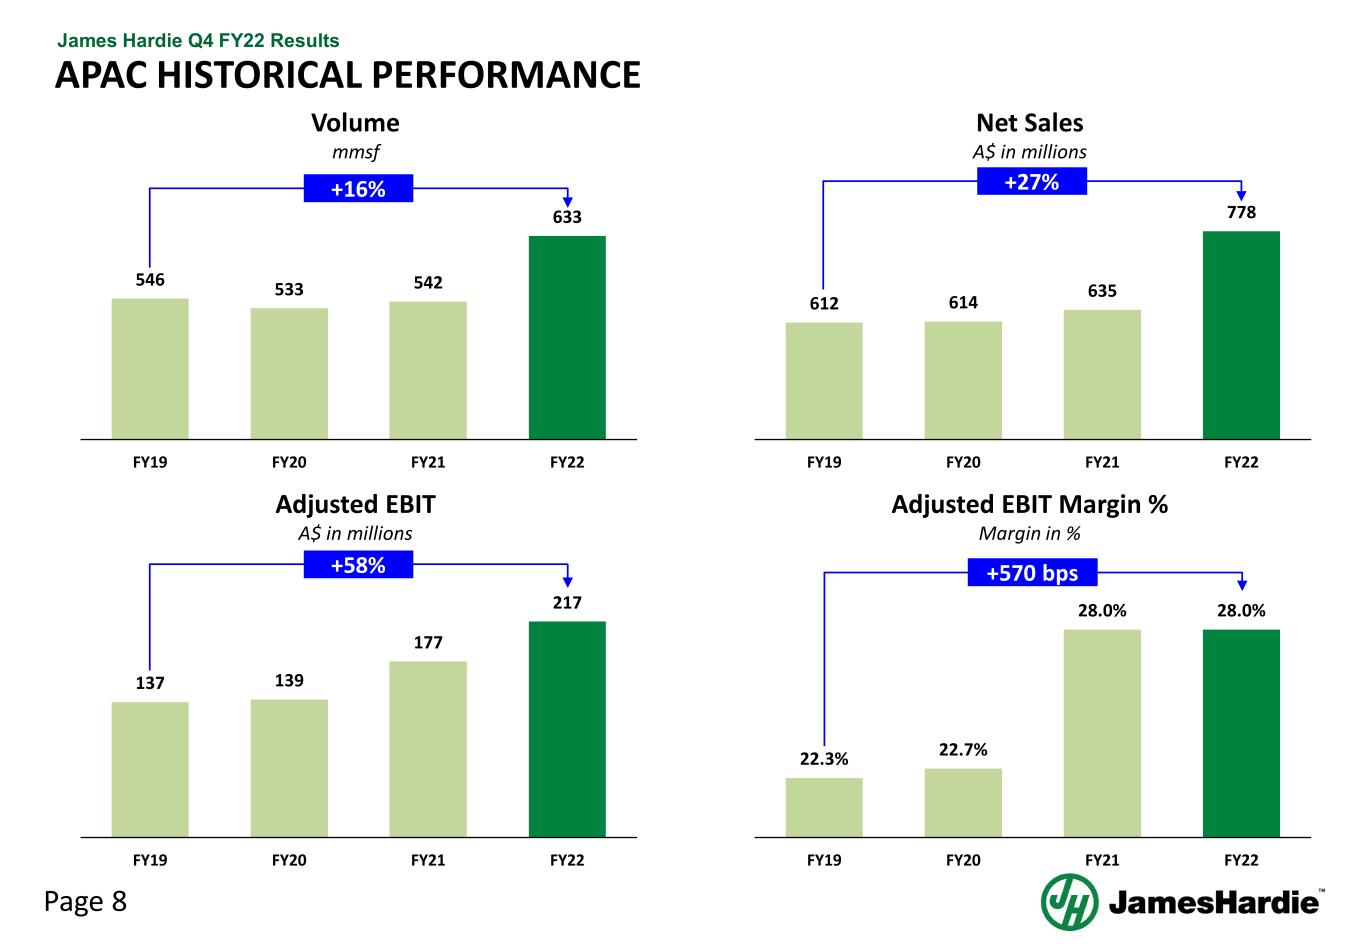
Page 8 James Hardie Q4 FY22 Results APAC HISTORICAL PERFORMANCE 546 533 542 633 FY19 FY20 FY21 FY22 Volume mmsf 612 614 635 778 FY19 FY20 FY21 FY22 137 139 177 217 FY19 FY20 FY21 FY22 Adjusted EBIT A$ in millions 22.3% 22.7% 28.0% 28.0% FY19 FY20 FY21 FY22 +16% +27% +58% +570 bps Adjusted EBIT Margin % Margin in % Net Sales A$ in millions
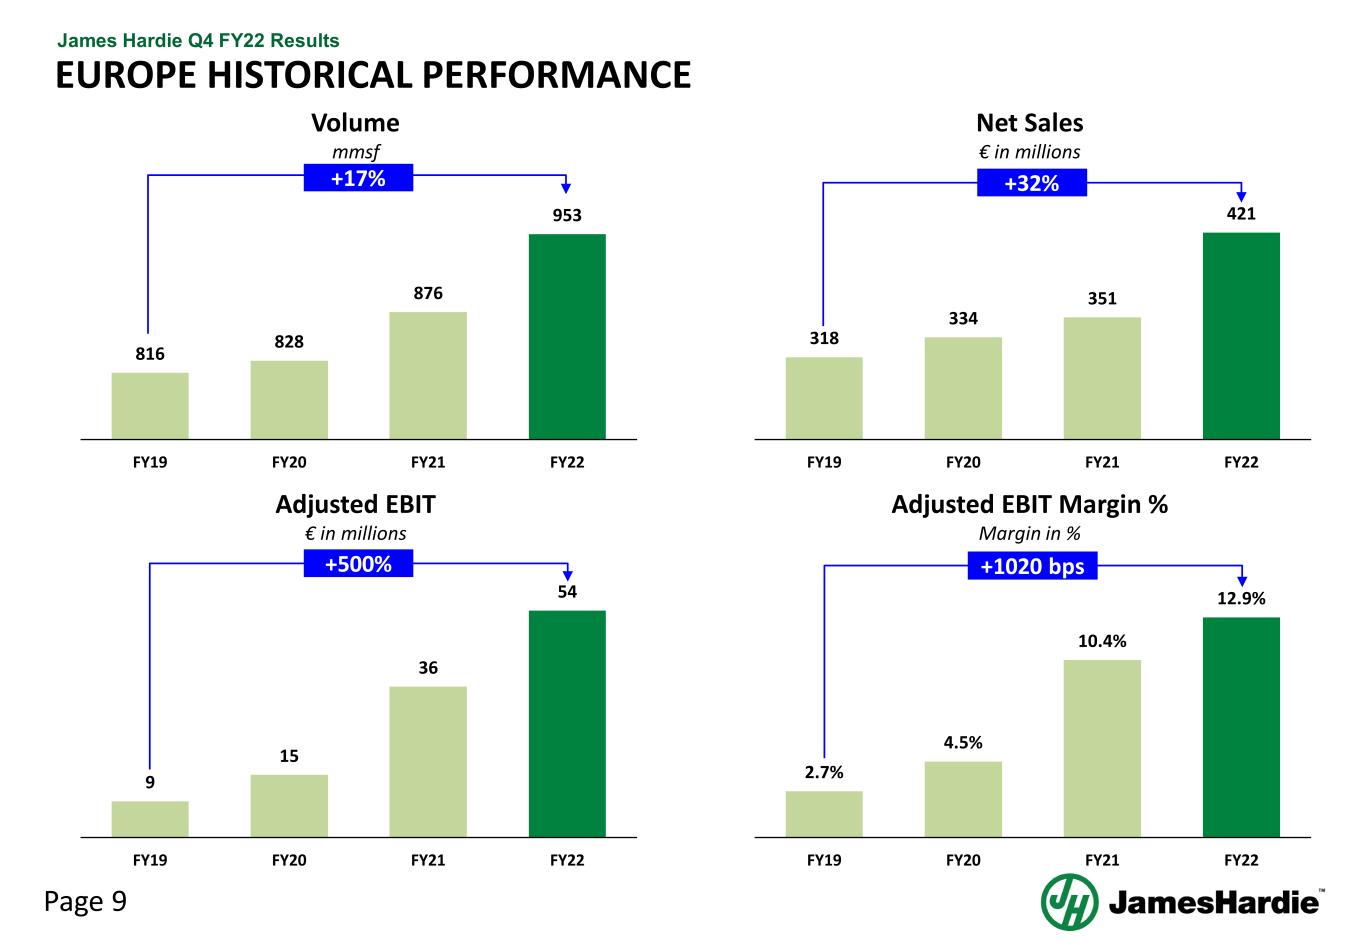
Page 9 James Hardie Q4 FY22 Results EUROPE HISTORICAL PERFORMANCE Volume mmsf 318 334 351 421 FY19 FY20 FY21 FY22 9 15 36 54 FY19 FY20 FY21 FY22 Adjusted EBIT € in millions 2.7% 4.5% 10.4% 12.9% FY19 FY20 FY21 FY22 +32% +500% +1020 bps Adjusted EBIT Margin % Margin in % Net Sales € in millions 816 828 876 953 FY19 FY20 FY21 FY22 +17%
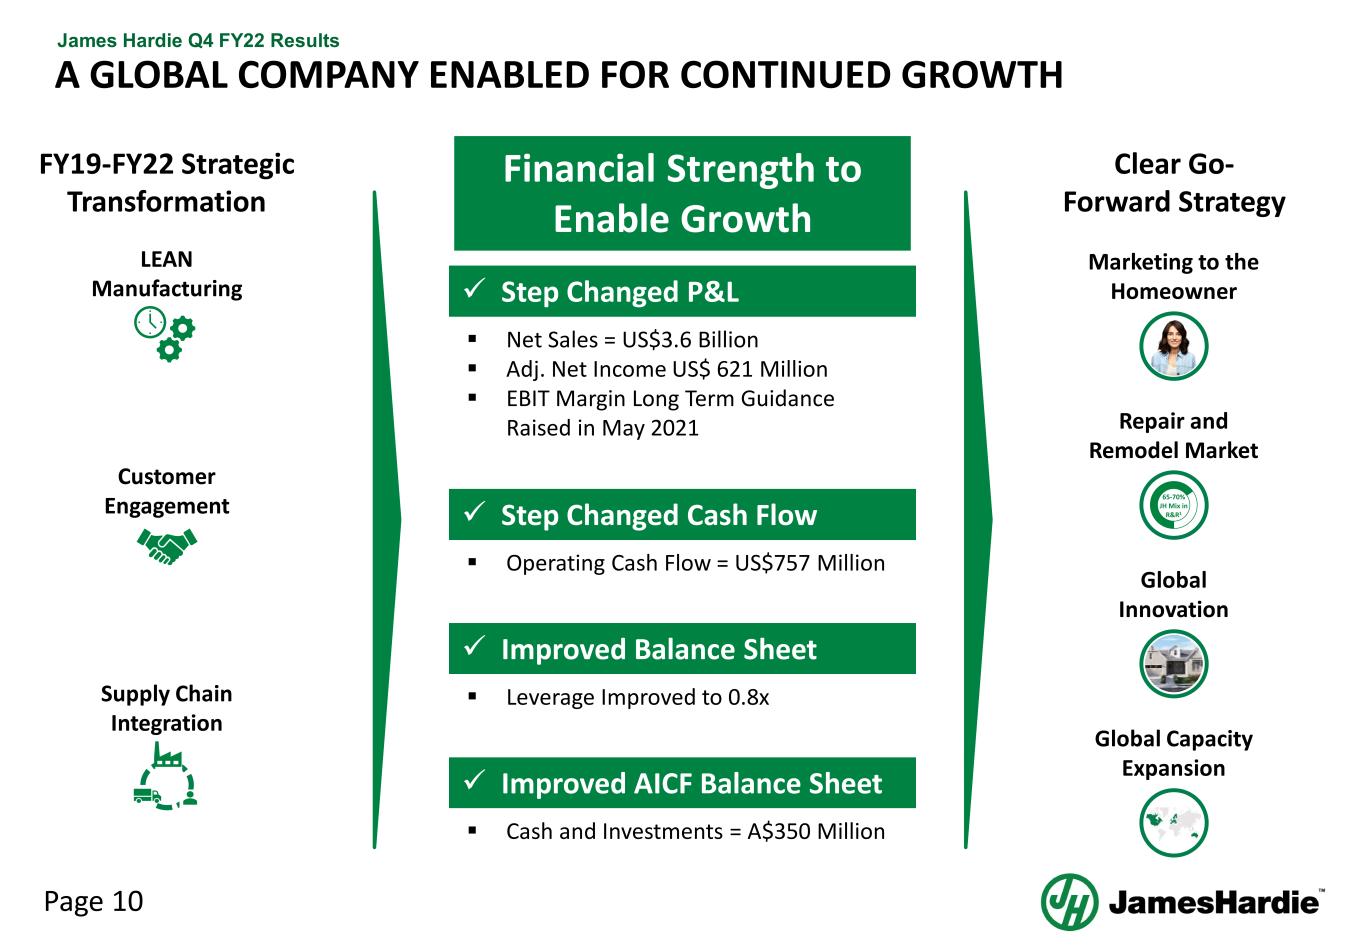
Page 10 James Hardie Q4 FY22 Results Global Capacity Expansion A GLOBAL COMPANY ENABLED FOR CONTINUED GROWTH FY19-FY22 Strategic Transformation Clear Go- Forward Strategy LEAN Manufacturing Customer Engagement Supply Chain Integration Global Innovation Marketing to the Homeowner Repair and Remodel Market 65-70% JH Mix in R&R1 Financial Strength to Enable Growth Step Changed P&L Net Sales = US$3.6 Billion Adj. Net Income US$ 621 Million EBIT Margin Long Term Guidance Raised in May 2021 Step Changed Cash Flow Operating Cash Flow = US$757 Million Improved Balance Sheet Leverage Improved to 0.8x Improved AICF Balance Sheet Cash and Investments = A$350 Million
Q4 FY22 FINANCIAL RESULTS
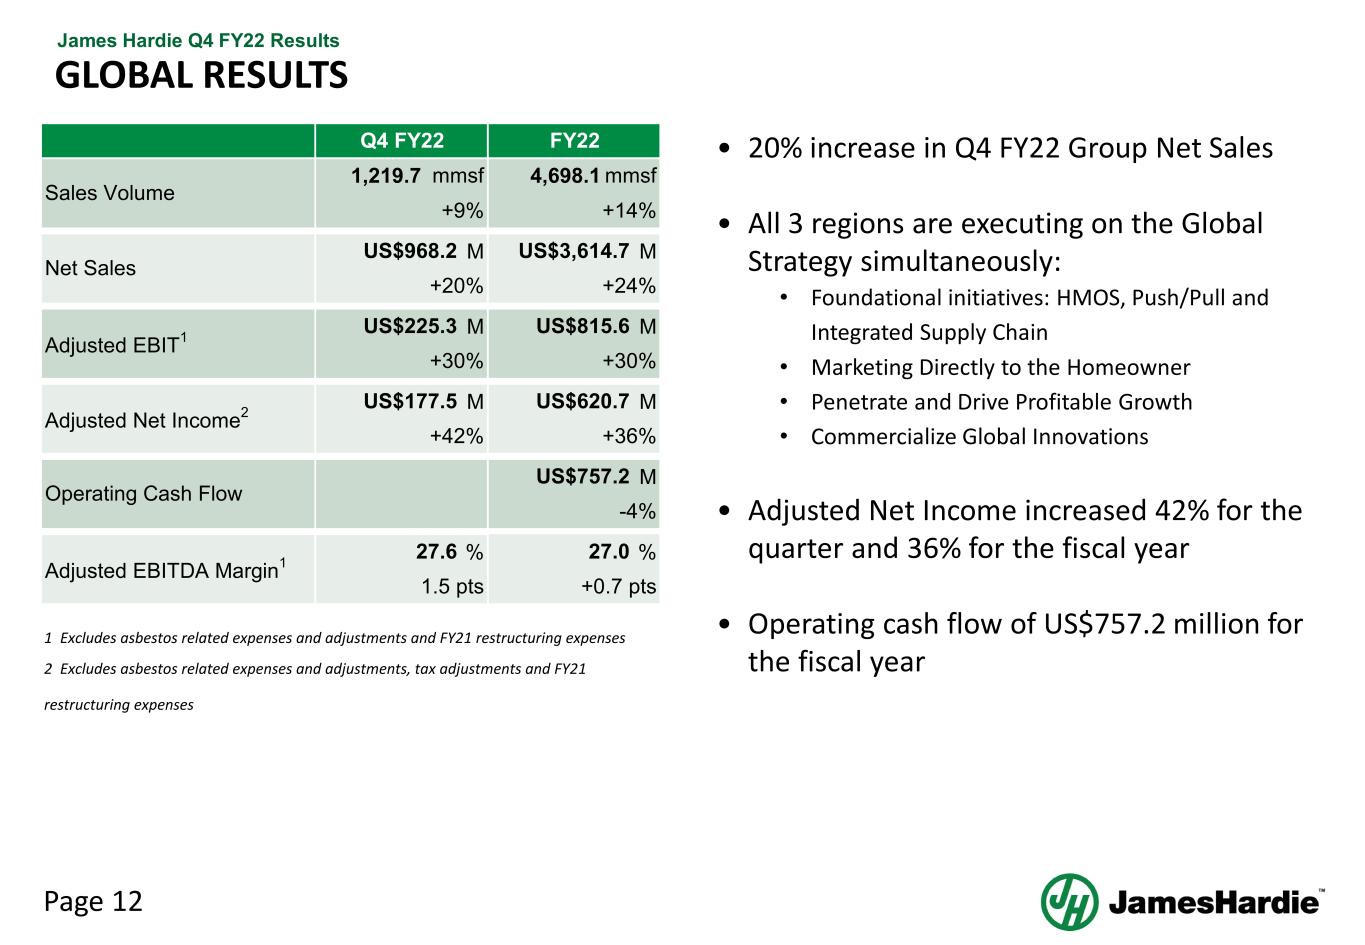
Page 12 James Hardie Q4 FY22 Results • 20% increase in Q4 FY22 Group Net Sales • All 3 regions are executing on the Global Strategy simultaneously: • Foundational initiatives: HMOS, Push/Pull and Integrated Supply Chain • Marketing Directly to the Homeowner • Penetrate and Drive Profitable Growth • Commercialize Global Innovations • Adjusted Net Income increased 42% for the quarter and 36% for the fiscal year • Operating cash flow of US$757.2 million for the fiscal year GLOBAL RESULTS M M M M M M M % % 2 Excludes asbestos related expenses and adjustments, tax adjustments and FY21 restructuring expenses 1 Excludes asbestos related expenses and adjustments and FY21 restructuring expenses mmsf +14% US$3,614.7 +24% Adjusted EBITDA Margin1 27.6 1.5 pts US$815.6 US$968.2 +20% +30% +9% Operating Cash Flow Adjusted Net Income2 Adjusted EBIT1 Sales Volume Net Sales Q4 FY22 1,219.7 +42% US$225.3 mmsf US$177.5 FY22 4,698.1 US$757.2 -4% +0.7 pts 27.0 +30% US$620.7 +36%
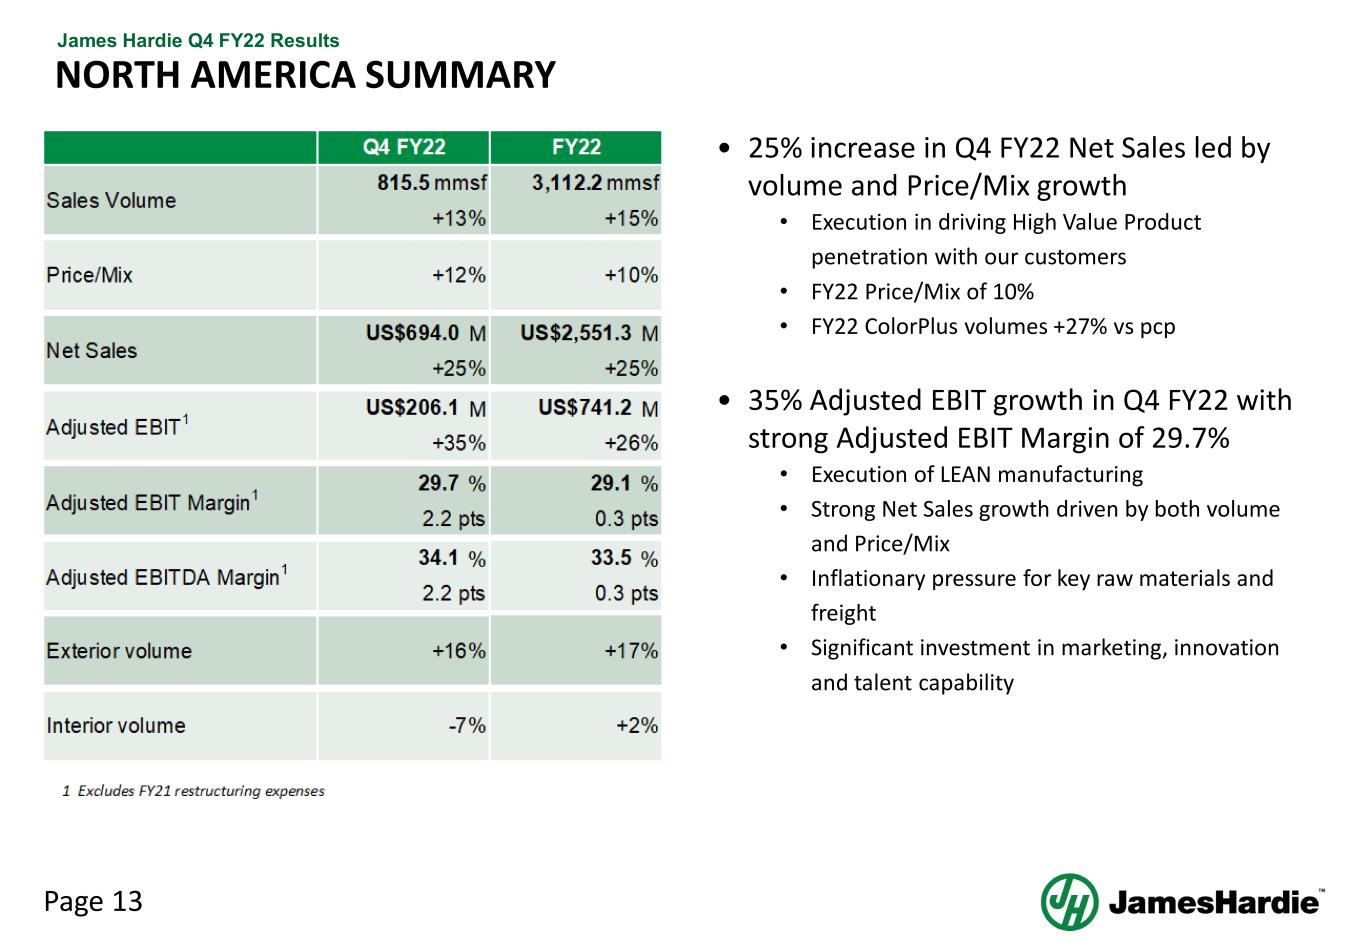
Page 13 James Hardie Q4 FY22 Results NORTH AMERICA SUMMARY • 25% increase in Q4 FY22 Net Sales led by volume and Price/Mix growth • Execution in driving High Value Product penetration with our customers • FY22 Price/Mix of 10% • FY22 ColorPlus volumes +27% vs pcp • 35% Adjusted EBIT growth in Q4 FY22 with strong Adjusted EBIT Margin of 29.7% • Execution of LEAN manufacturing • Strong Net Sales growth driven by both volume and Price/Mix • Inflationary pressure for key raw materials and freight • Significant investment in marketing, innovation and talent capability
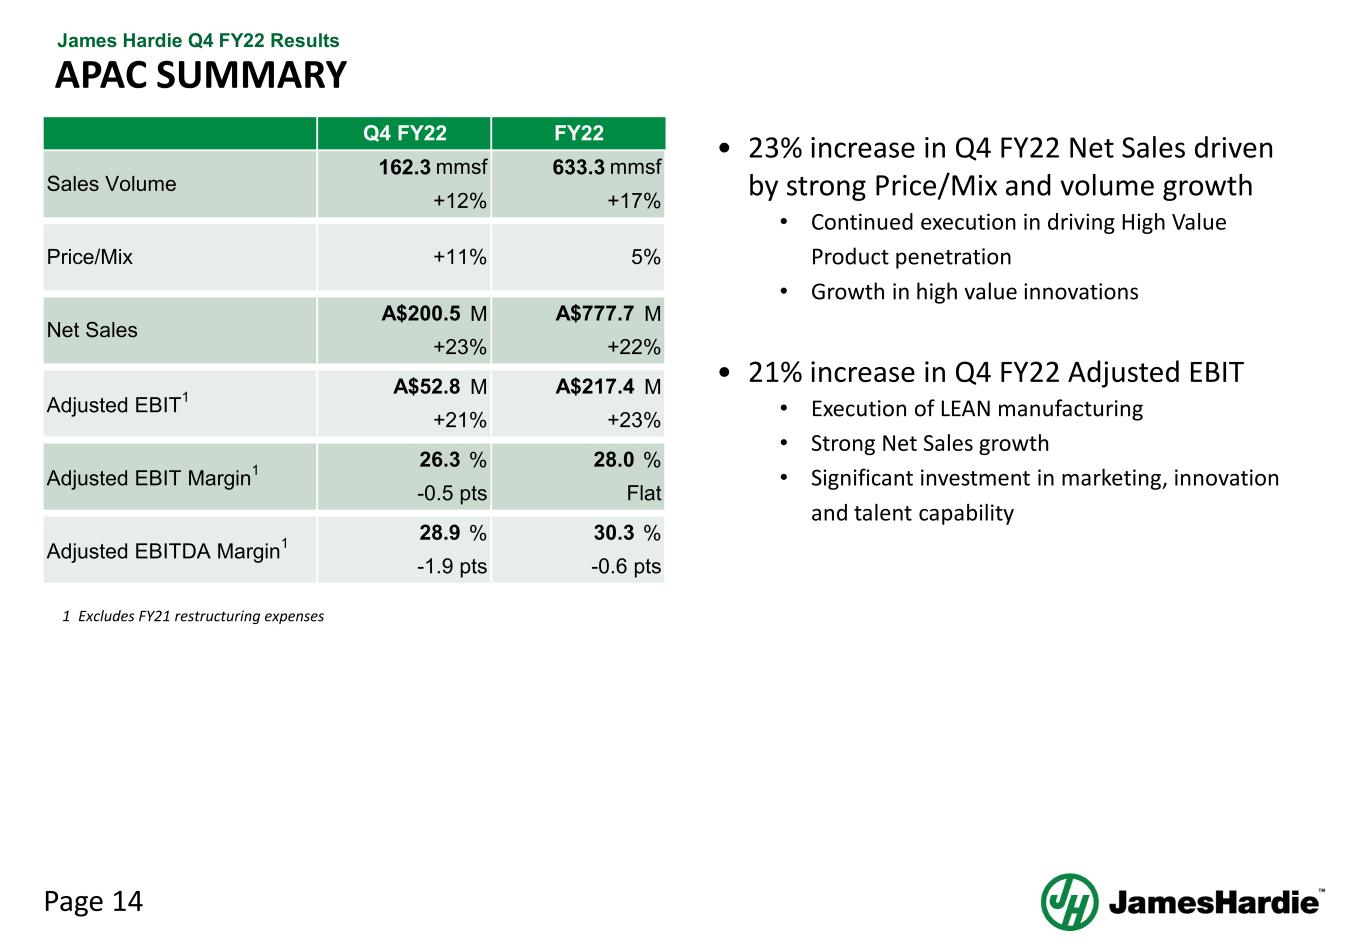
Page 14 James Hardie Q4 FY22 Results APAC SUMMARY • 23% increase in Q4 FY22 Net Sales driven by strong Price/Mix and volume growth • Continued execution in driving High Value Product penetration • Growth in high value innovations • 21% increase in Q4 FY22 Adjusted EBIT • Execution of LEAN manufacturing • Strong Net Sales growth • Significant investment in marketing, innovation and talent capability M M M M % % % % 1 Excludes FY21 restructuring expenses Q4 FY22 +12% Adjusted EBIT Margin1 26.3 Price/Mix -0.5 pts +11% Adjusted EBIT1 A$52.8 +21% Net Sales A$200.5 +23% Sales Volume 162.3 mmsf 28.0 Flat 30.3 FY22 633.3 mmsf +17% 28.9 A$777.7 +22% 5% -0.6 pts A$217.4 +23% Adjusted EBITDA Margin1 -1.9 pts
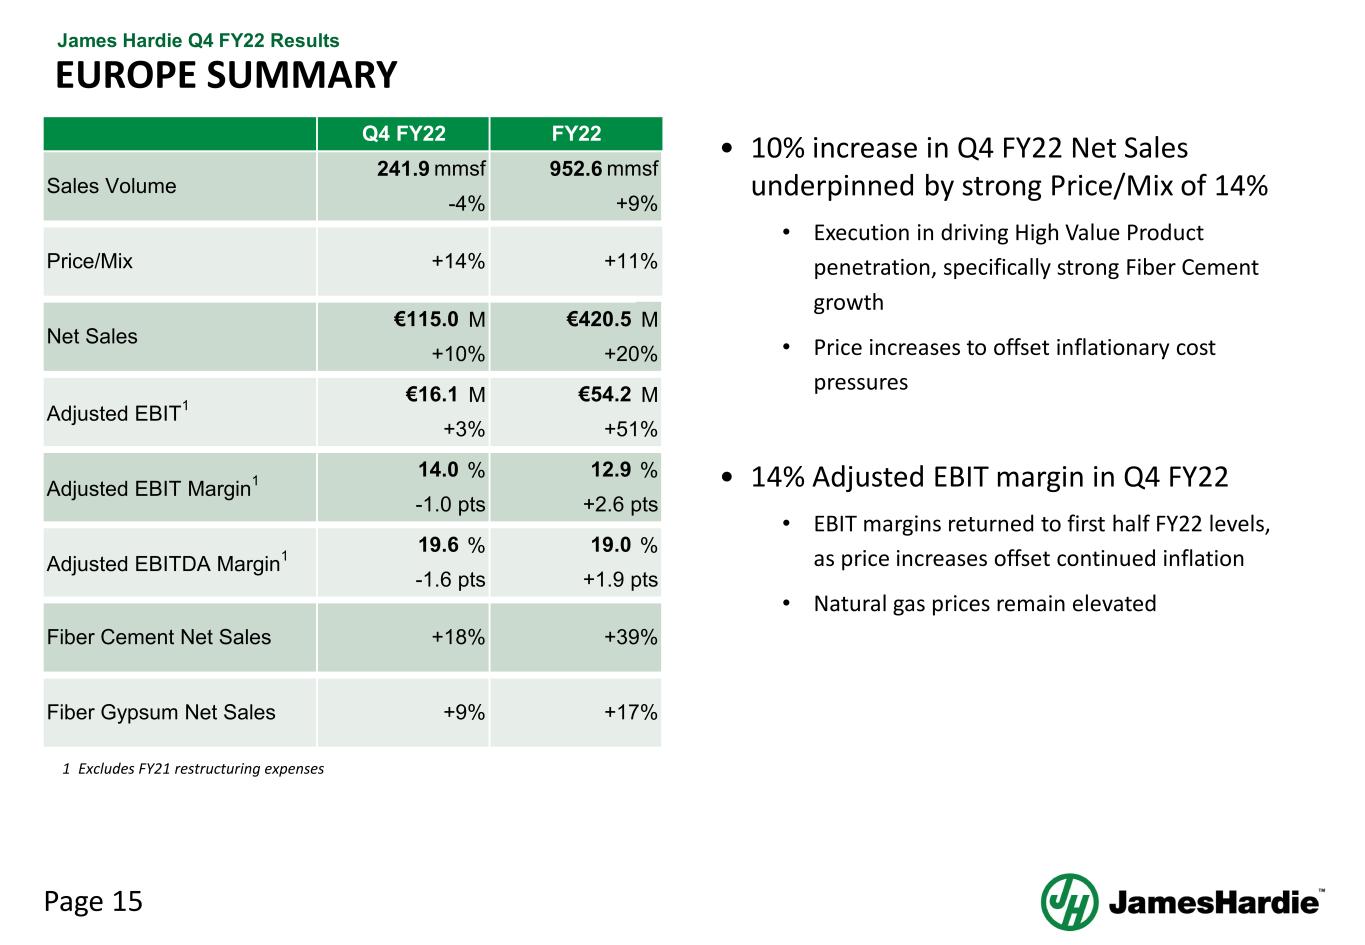
Page 15 James Hardie Q4 FY22 Results EUROPE SUMMARY • 10% increase in Q4 FY22 Net Sales underpinned by strong Price/Mix of 14% • Execution in driving High Value Product penetration, specifically strong Fiber Cement growth • Price increases to offset inflationary cost pressures • 14% Adjusted EBIT margin in Q4 FY22 • EBIT margins returned to first half FY22 levels, as price increases offset continued inflation • Natural gas prices remain elevated M M M M % % % % 1 Excludes FY21 restructuring expenses Net Sales +10% €115.0 +14% Adjusted EBITDA Margin1 19.6 -1.6 pts Adjusted EBIT1 Adjusted EBIT Margin1 14.0 Price/Mix Q4 FY22 Sales Volume 241.9 mmsf -4% 19.0 +1.9 pts FY22 952.6 mmsf +9% €420.5 +20% €54.2 +51% Fiber Gypsum Net Sales Fiber Cement Net Sales +11% +18% +39% +9% +17% 12.9 +2.6 pts-1.0 pts €16.1 +3%
FY23 STRATEGY UPDATE AND GUIDANCE
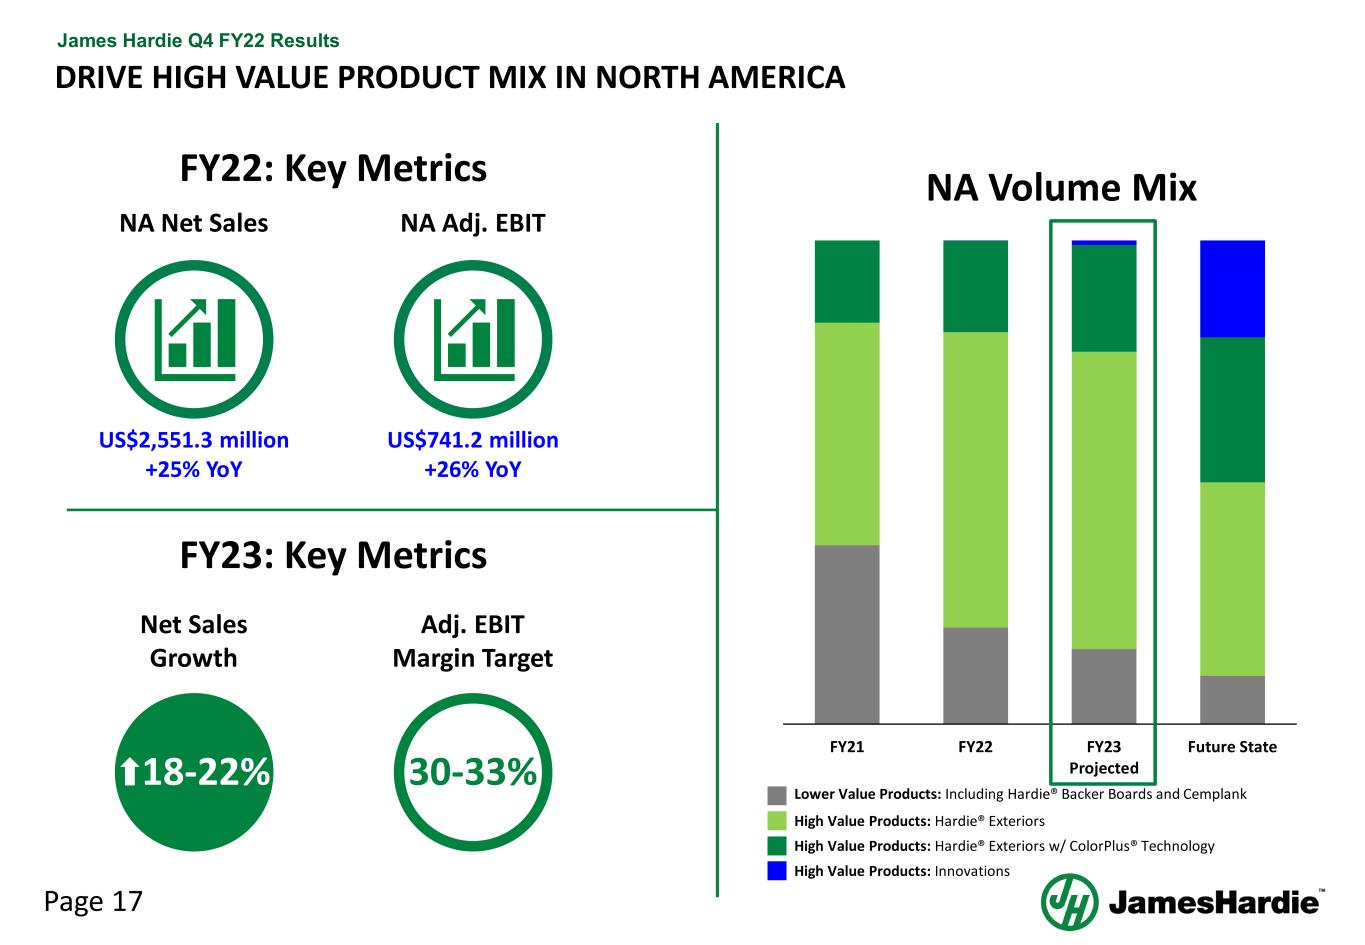
Page 17 James Hardie Q4 FY22 Results DRIVE HIGH VALUE PRODUCT MIX IN NORTH AMERICA FY21 FY22 FY23 Projected Future State NA Volume Mix Lower Value Products: Including Hardie® Backer Boards and Cemplank High Value Products: Hardie® Exteriors High Value Products: Hardie® Exteriors w/ ColorPlus® Technology High Value Products: Innovations FY23: Key Metrics Net Sales Growth Adj. EBIT Margin Target 18-22% 30-33% NA Net Sales US$2,551.3 million +25% YoY NA Adj. EBIT US$741.2 million +26% YoY FY22: Key Metrics
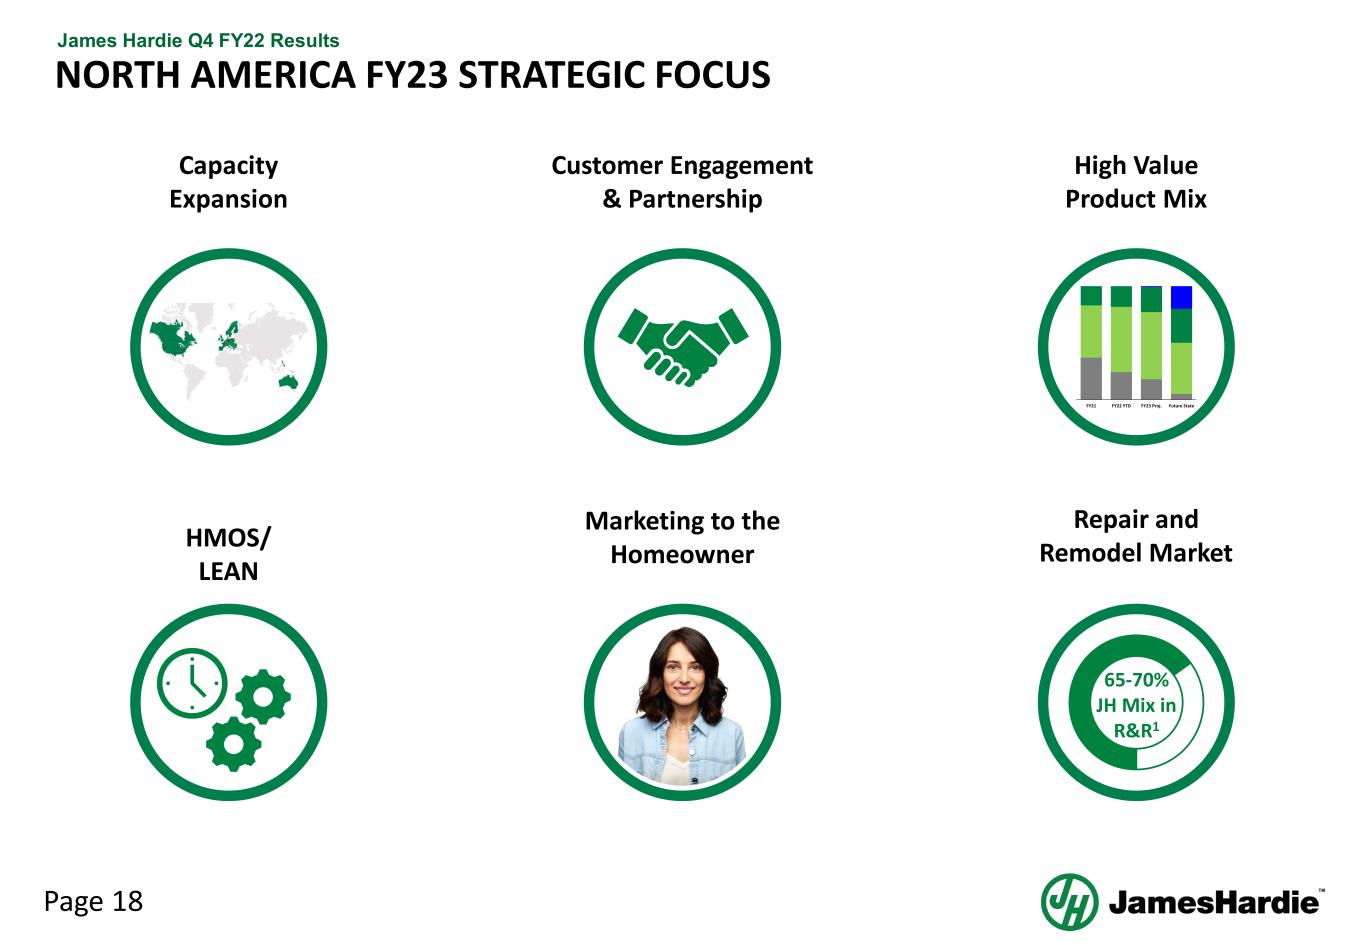
Page 18 James Hardie Q4 FY22 Results NORTH AMERICA FY23 STRATEGIC FOCUS Capacity Expansion Repair and Remodel Market 65-70% JH Mix in R&R1 High Value Product Mix FY21 FY22 YTD FY23 Proj. Future State HMOS/ LEAN Customer Engagement & Partnership Marketing to the Homeowner
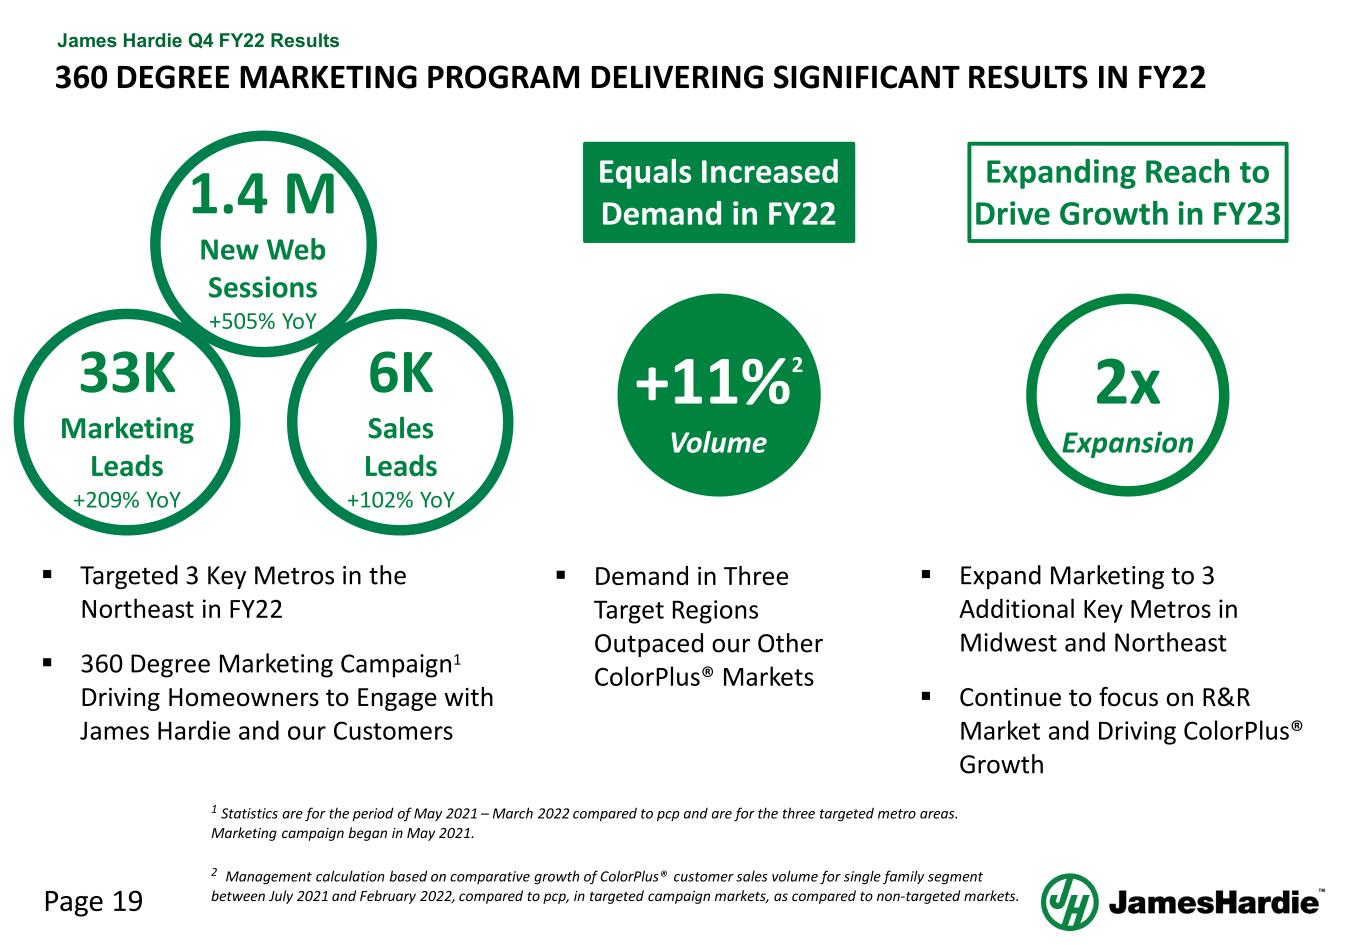
Page 19 James Hardie Q4 FY22 Results 360 DEGREE MARKETING PROGRAM DELIVERING SIGNIFICANT RESULTS IN FY22 1.4 M New Web Sessions +505% YoY 33K Marketing Leads +209% YoY 6K Sales Leads +102% YoY Targeted 3 Key Metros in the Northeast in FY22 360 Degree Marketing Campaign1 Driving Homeowners to Engage with James Hardie and our Customers 1 Statistics are for the period of May 2021 – March 2022 compared to pcp and are for the three targeted metro areas. Marketing campaign began in May 2021. 2 Management calculation based on comparative growth of ColorPlus® customer sales volume for single family segment between July 2021 and February 2022, compared to pcp, in targeted campaign markets, as compared to non-targeted markets. Equals Increased Demand in FY22 Demand in Three Target Regions Outpaced our Other ColorPlus® Markets +11%2 Volume Expanding Reach to Drive Growth in FY23 2x Expand Marketing to 3 Additional Key Metros in Midwest and Northeast Continue to focus on R&R Market and Driving ColorPlus® Growth Expansion
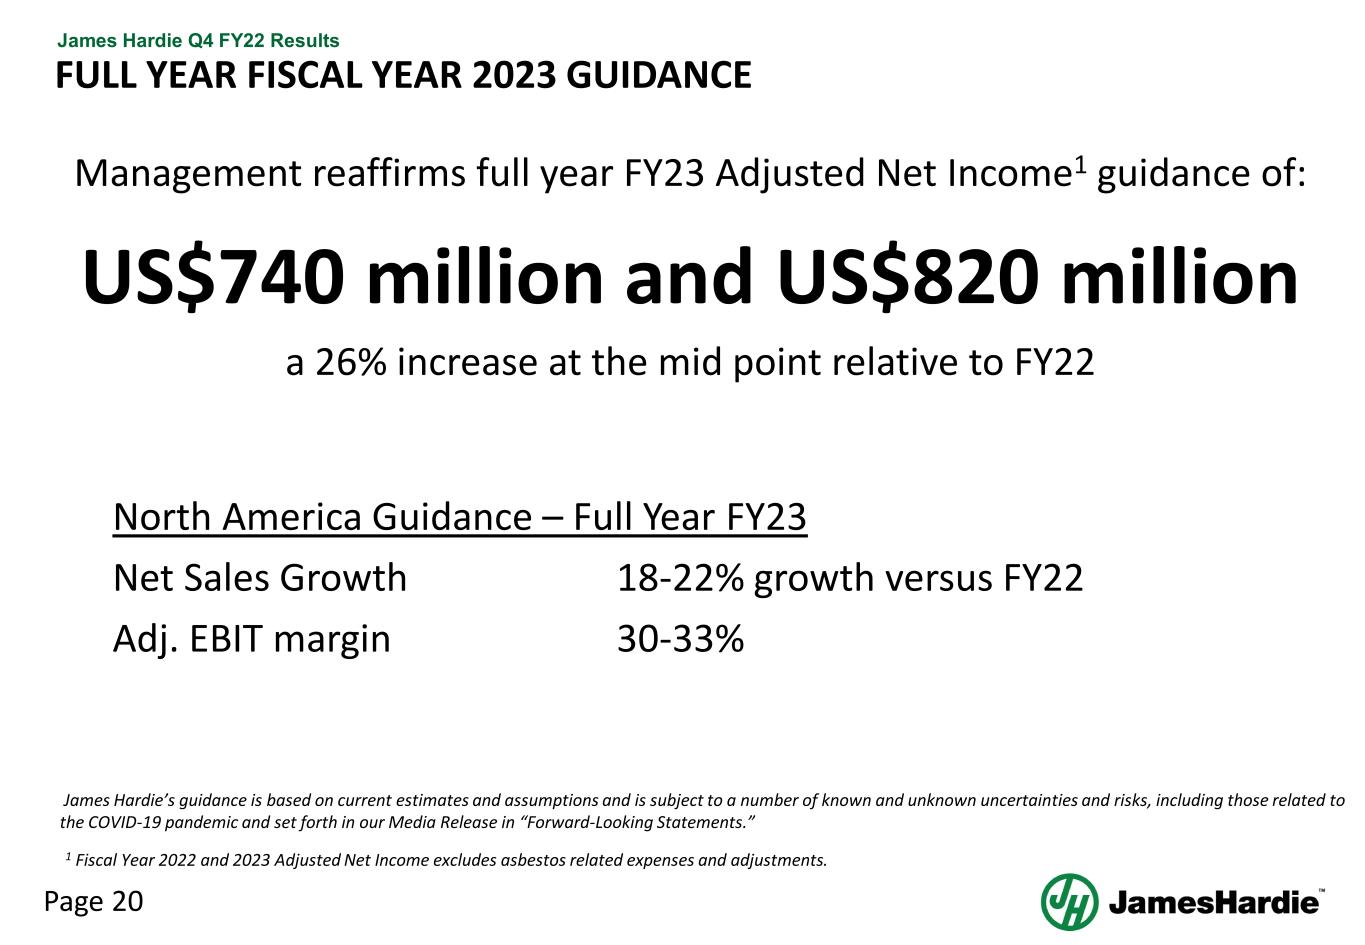
Page 20 James Hardie Q4 FY22 Results FULL YEAR FISCAL YEAR 2023 GUIDANCE Management reaffirms full year FY23 Adjusted Net Income1 guidance of: US$740 million and US$820 million a 26% increase at the mid point relative to FY22 North America Guidance – Full Year FY23 Net Sales Growth 18-22% growth versus FY22 Adj. EBIT margin 30-33% James Hardie’s guidance is based on current estimates and assumptions and is subject to a number of known and unknown uncertainties and risks, including those related to the COVID-19 pandemic and set forth in our Media Release in “Forward-Looking Statements.” 1 Fiscal Year 2022 and 2023 Adjusted Net Income excludes asbestos related expenses and adjustments.
QUESTIONS
APPENDIX
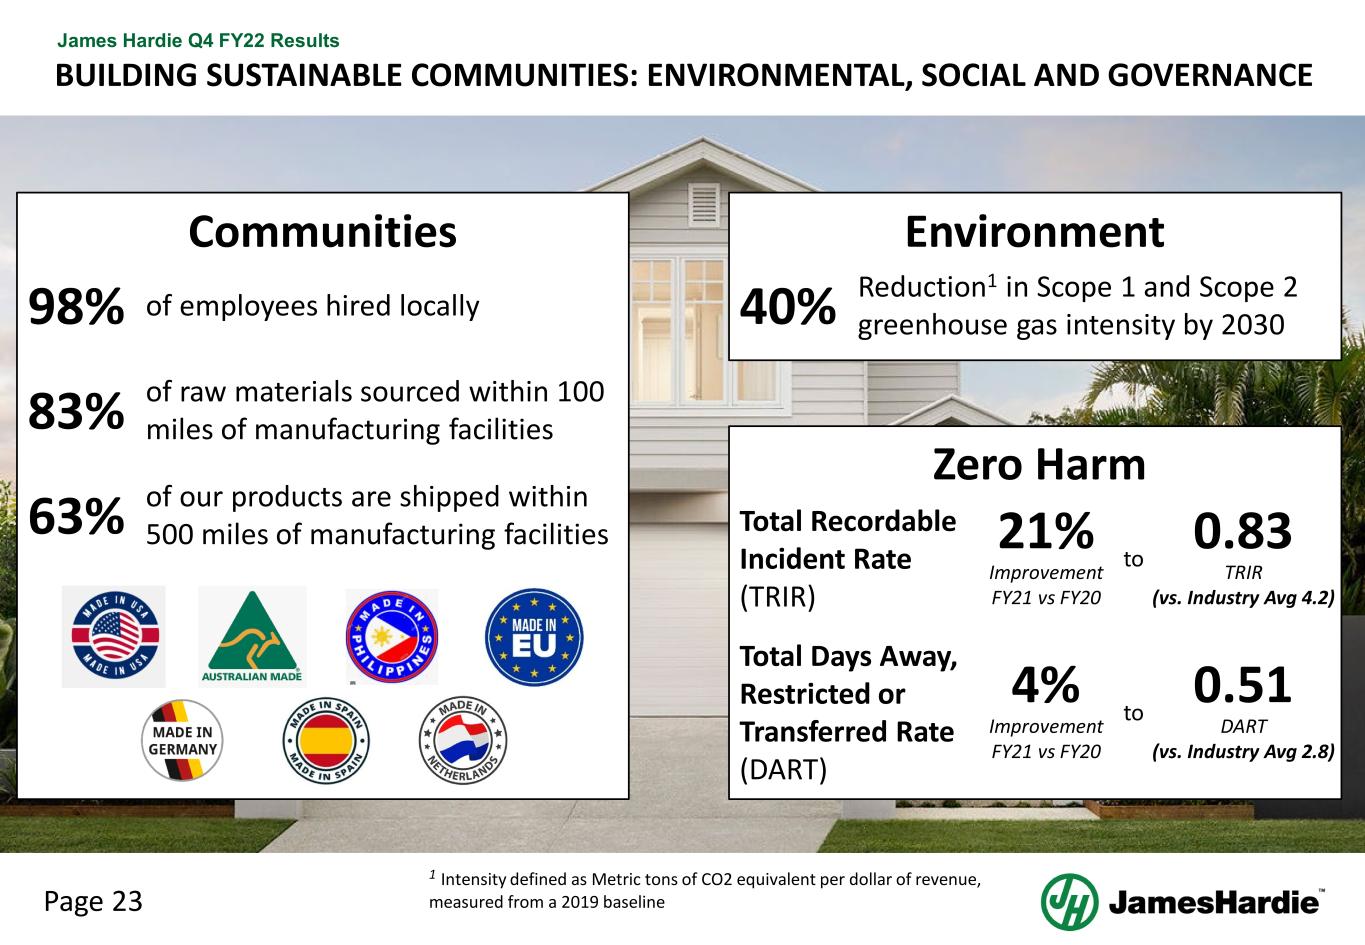
Page 23 James Hardie Q4 FY22 Results BUILDING SUSTAINABLE COMMUNITIES: ENVIRONMENTAL, SOCIAL AND GOVERNANCE 83% of raw materials sourced within 100 miles of manufacturing facilities 98% of employees hired locally 63% of our products are shipped within 500 miles of manufacturing facilities 40% Reduction1 in Scope 1 and Scope 2 greenhouse gas intensity by 2030 Total Recordable Incident Rate (TRIR) Total Days Away, Restricted or Transferred Rate (DART) 21% Improvement FY21 vs FY20 4% Improvement FY21 vs FY20 0.83 TRIR (vs. Industry Avg 4.2) 0.51 DART (vs. Industry Avg 2.8) to to Environment Zero Harm Communities 1 Intensity defined as Metric tons of CO2 equivalent per dollar of revenue, measured from a 2019 baseline
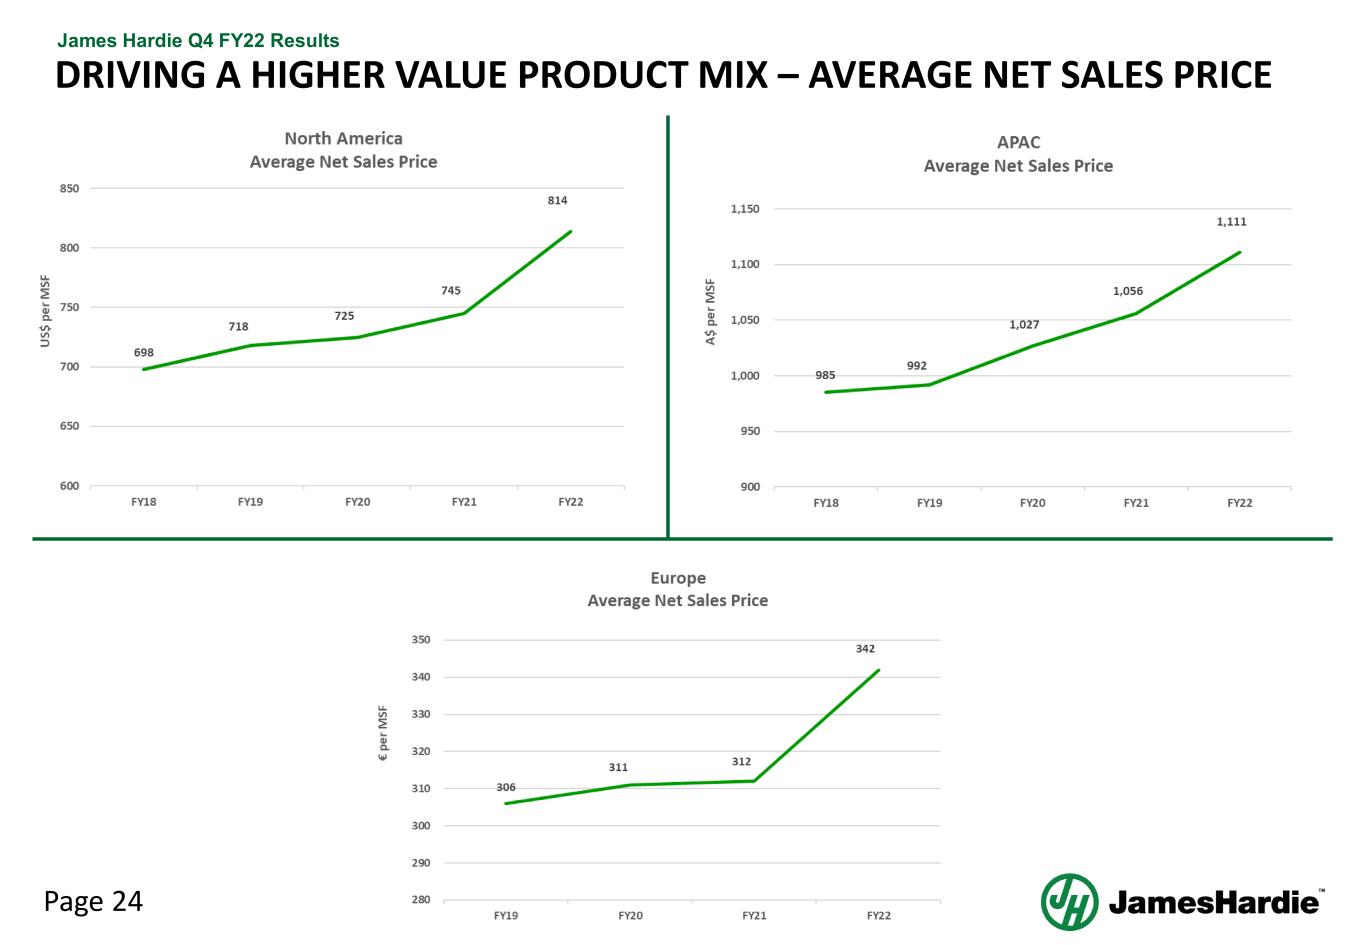
Page 24 James Hardie Q4 FY22 Results DRIVING A HIGHER VALUE PRODUCT MIX – AVERAGE NET SALES PRICE
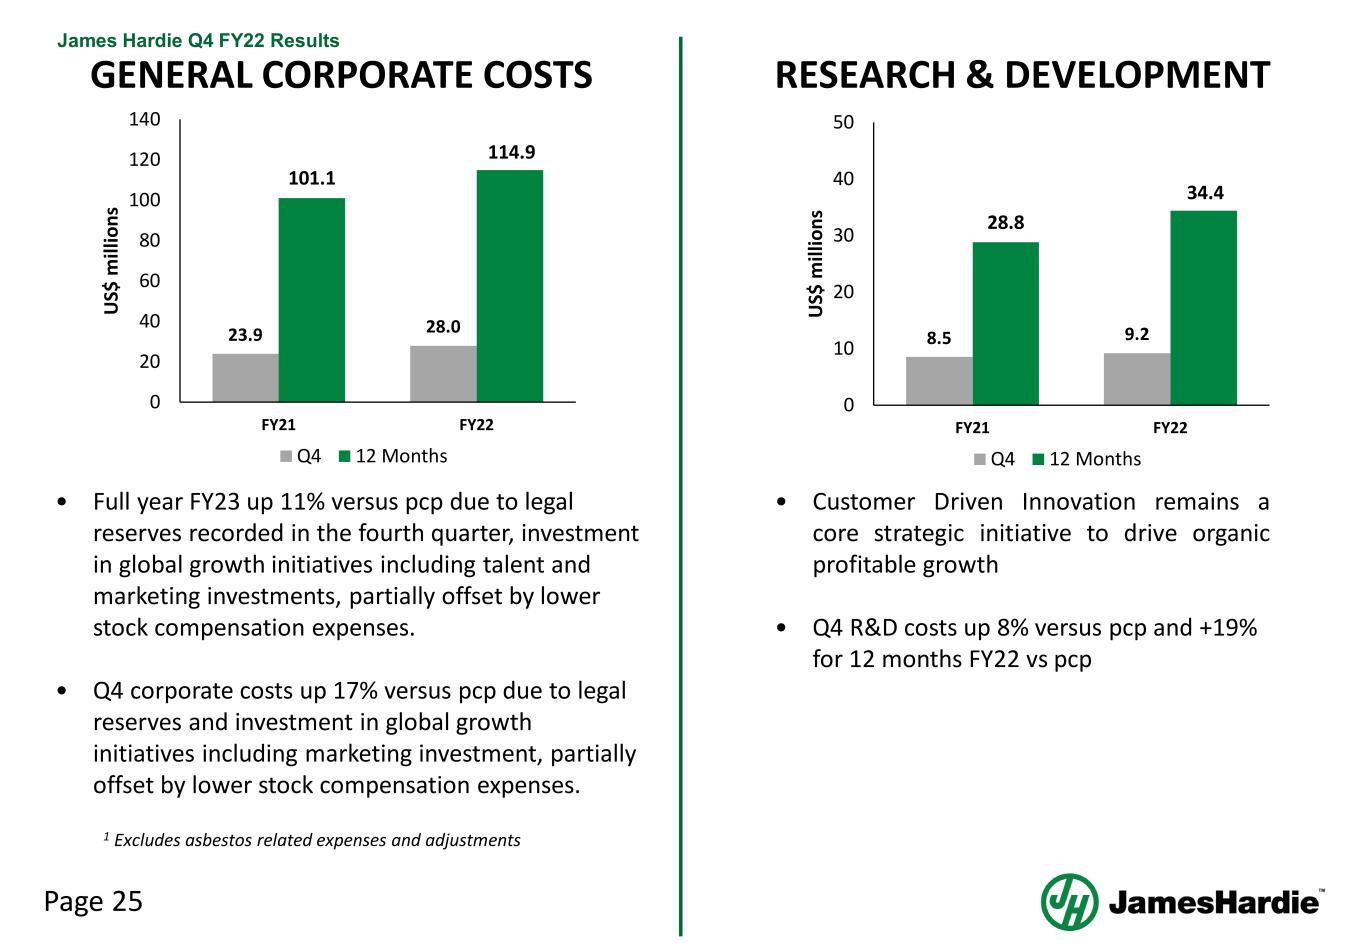
Page 25 James Hardie Q4 FY22 Results GENERAL CORPORATE COSTS • Full year FY23 up 11% versus pcp due to legal reserves recorded in the fourth quarter, investment in global growth initiatives including talent and marketing investments, partially offset by lower stock compensation expenses. • Q4 corporate costs up 17% versus pcp due to legal reserves and investment in global growth initiatives including marketing investment, partially offset by lower stock compensation expenses. • Customer Driven Innovation remains a core strategic initiative to drive organic profitable growth • Q4 R&D costs up 8% versus pcp and +19% for 12 months FY22 vs pcp RESEARCH & DEVELOPMENT 1 Excludes asbestos related expenses and adjustments 23.9 28.0 101.1 114.9 0 20 40 60 80 100 120 140 FY21 FY22 U S$ m ill io ns Q4 12 Months 8.5 9.2 28.8 34.4 0 10 20 30 40 50 FY21 FY22 U S$ m ill io ns Q4 12 Months
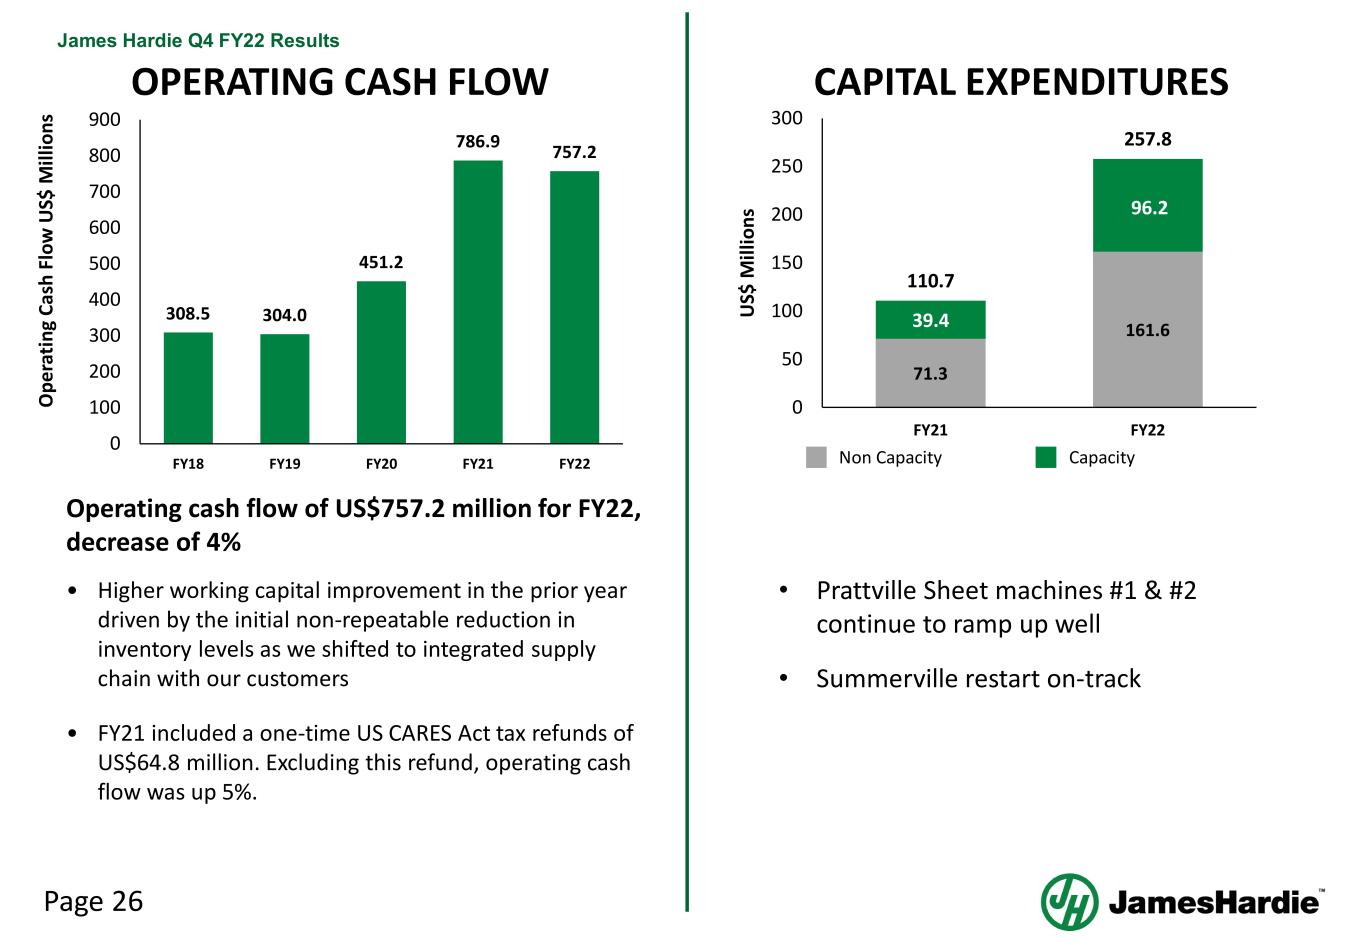
Page 26 James Hardie Q4 FY22 Results 1 OPERATING CASH FLOW CAPITAL EXPENDITURES • Prattville Sheet machines #1 & #2 continue to ramp up well • Summerville restart on-track Operating cash flow of US$757.2 million for FY22, decrease of 4% • Higher working capital improvement in the prior year driven by the initial non-repeatable reduction in inventory levels as we shifted to integrated supply chain with our customers • FY21 included a one-time US CARES Act tax refunds of US$64.8 million. Excluding this refund, operating cash flow was up 5%. O pe ra tin g Ca sh F lo w U S$ M ill io ns 308.5 304.0 451.2 786.9 757.2 0 100 200 300 400 500 600 700 800 900 FY18 FY19 FY20 FY21 FY22 71.3 161.639.4 96.2 110.7 257.8 0 50 100 150 200 250 300 FY21 FY22 U S$ M ill io ns Non Capacity Capacity
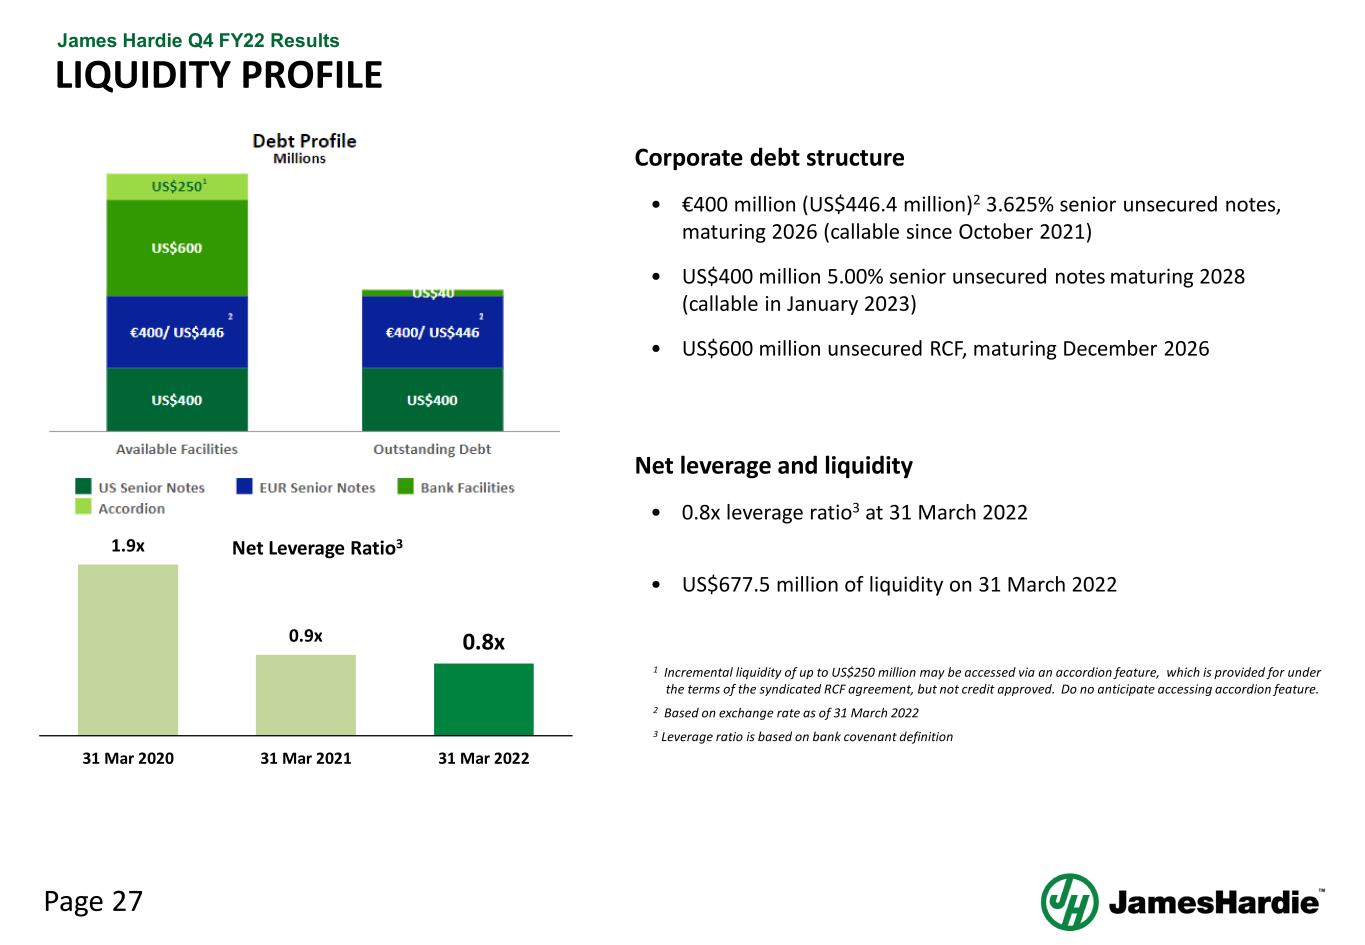
Page 27 James Hardie Q4 FY22 Results LIQUIDITY PROFILE 2 1 Incremental liquidity of up to US$250 million may be accessed via an accordion feature, which is provided for under the terms of the syndicated RCF agreement, but not credit approved. Do no anticipate accessing accordion feature. 2 Based on exchange rate as of 31 March 2022 3 Leverage ratio is based on bank covenant definition 1.9x 0.9x 0.8x 31 Mar 2020 31 Mar 2021 31 Mar 2022 Net Leverage Ratio3 Corporate debt structure • €400 million (US$446.4 million)2 3.625% senior unsecured notes, maturing 2026 (callable since October 2021) • US$400 million 5.00% senior unsecured notes maturing 2028 (callable in January 2023) • US$600 million unsecured RCF, maturing December 2026 Net leverage and liquidity • 0.8x leverage ratio3 at 31 March 2022 • US$677.5 million of liquidity on 31 March 2022
Page 28 James Hardie Q4 FY22 Results CAPITAL ALLOCATION ALIGNED TO PROFITABLE GROWTH STRATEGY • Preserve strong liquidity and flexibility • Invest in organic growth: capacity expansion, market driven innovation & marketing directly to the homeowner • Maintain net leverage ratio of less than 2x • 0.8x leverage ratio as of 31 March 2022 • Return capital to shareholders
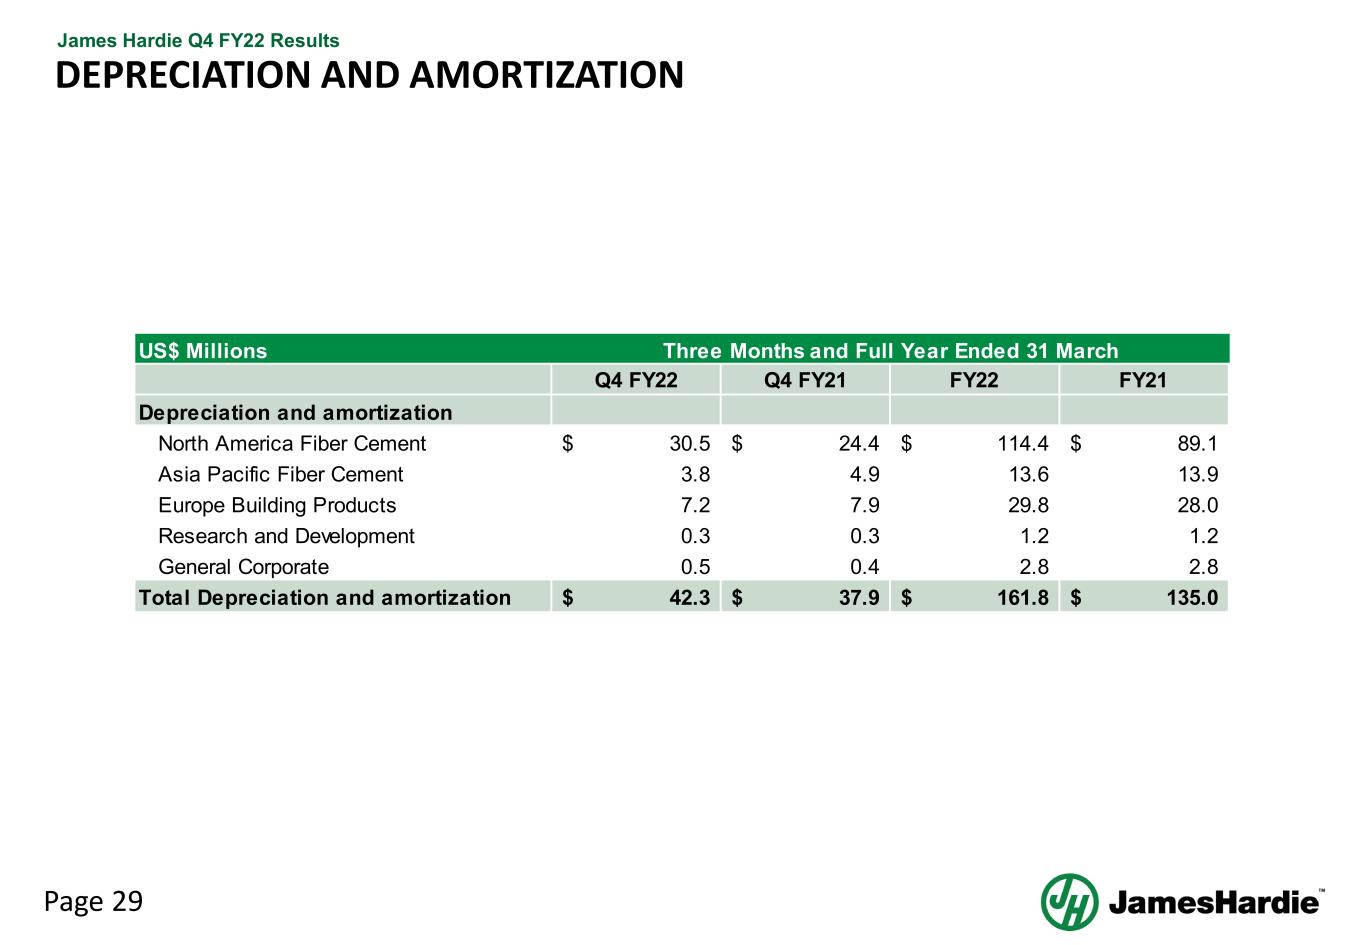
Page 29 James Hardie Q4 FY22 Results DEPRECIATION AND AMORTIZATION US$ Millions Q4 FY22 Q4 FY21 FY22 FY21 Depreciation and amortization North America Fiber Cement 30.5$ 24.4$ 114.4$ 89.1$ Asia Pacific Fiber Cement 3.8 4.9 13.6 13.9 Europe Building Products 7.2 7.9 29.8 28.0 Research and Development 0.3 0.3 1.2 1.2 General Corporate 0.5 0.4 2.8 2.8 Total Depreciation and amortization 42.3$ 37.9$ 161.8$ 135.0$ Three Months and Full Year Ended 31 March
Page 30 James Hardie Q4 FY22 Results 1 ASBESTOS COMPENSATION KEY POINTS • Updated actuarial report completed as of 31 March 2022 • Undiscounted and uninflated estimate increased from A$1,352 million to A$1,390 million • For fiscal year 2022, we noted the following related to asbestos-related claims experience: • Net cash outflow was 1% below actuarial expectations • Claims received were 3% below actuarial expectations • Average claim settlement was 1% above actuarial expectations • Total contributions of US$248.5 million were made to AICF during FY2022 • AICF has A$349.7 million in cash and investments as of 31 March 2022 • We anticipate that we will make further contributions totaling approximately US$117.8 million to AICF during FY2023
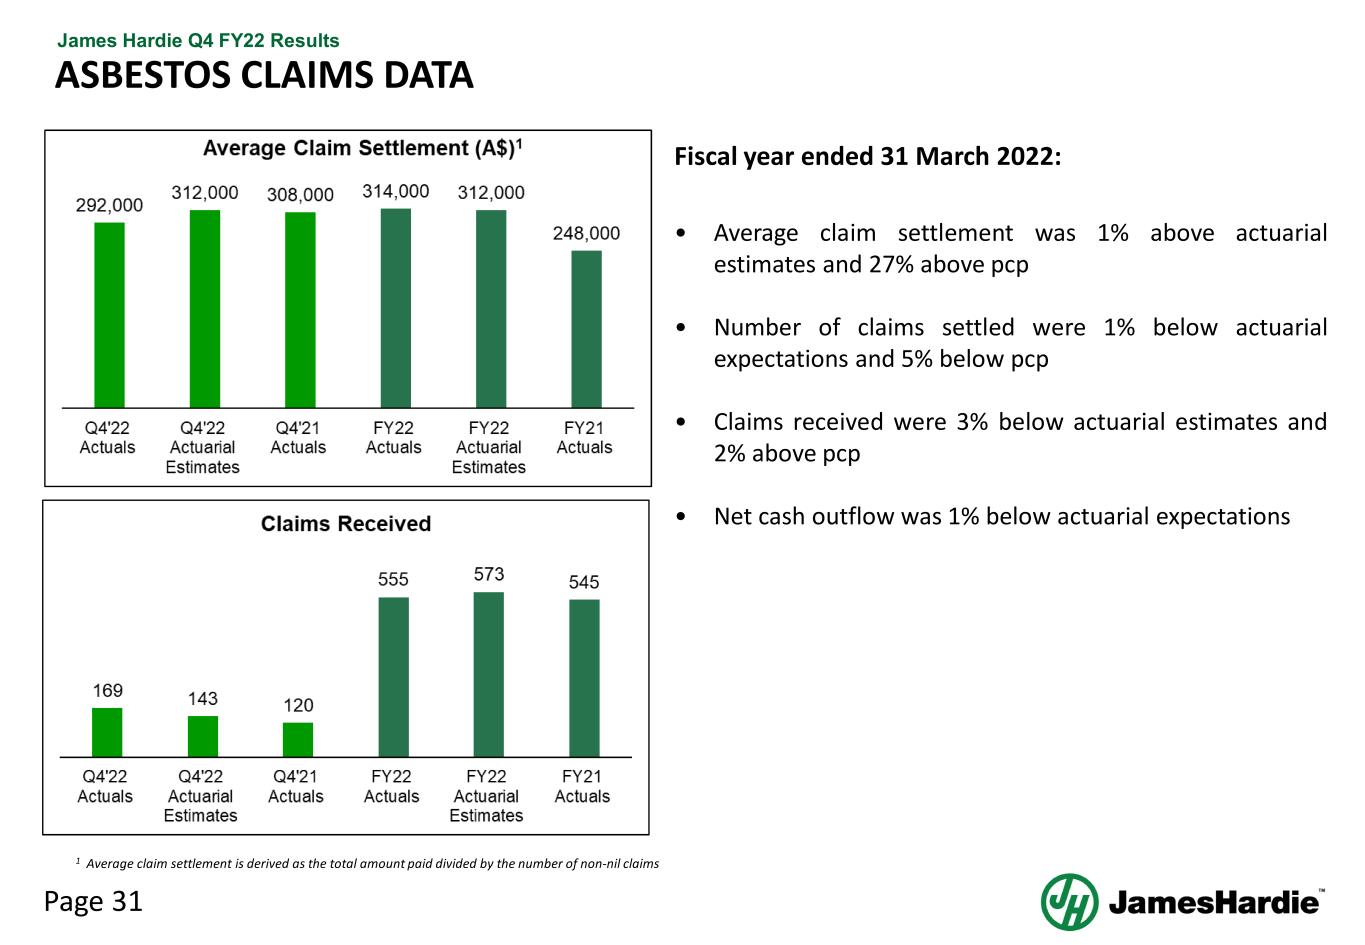
Page 31 James Hardie Q4 FY22 Results Fiscal year ended 31 March 2022: • Average claim settlement was 1% above actuarial estimates and 27% above pcp • Number of claims settled were 1% below actuarial expectations and 5% below pcp • Claims received were 3% below actuarial estimates and 2% above pcp • Net cash outflow was 1% below actuarial expectations ASBESTOS CLAIMS DATA 1 Average claim settlement is derived as the total amount paid divided by the number of non-nil claims
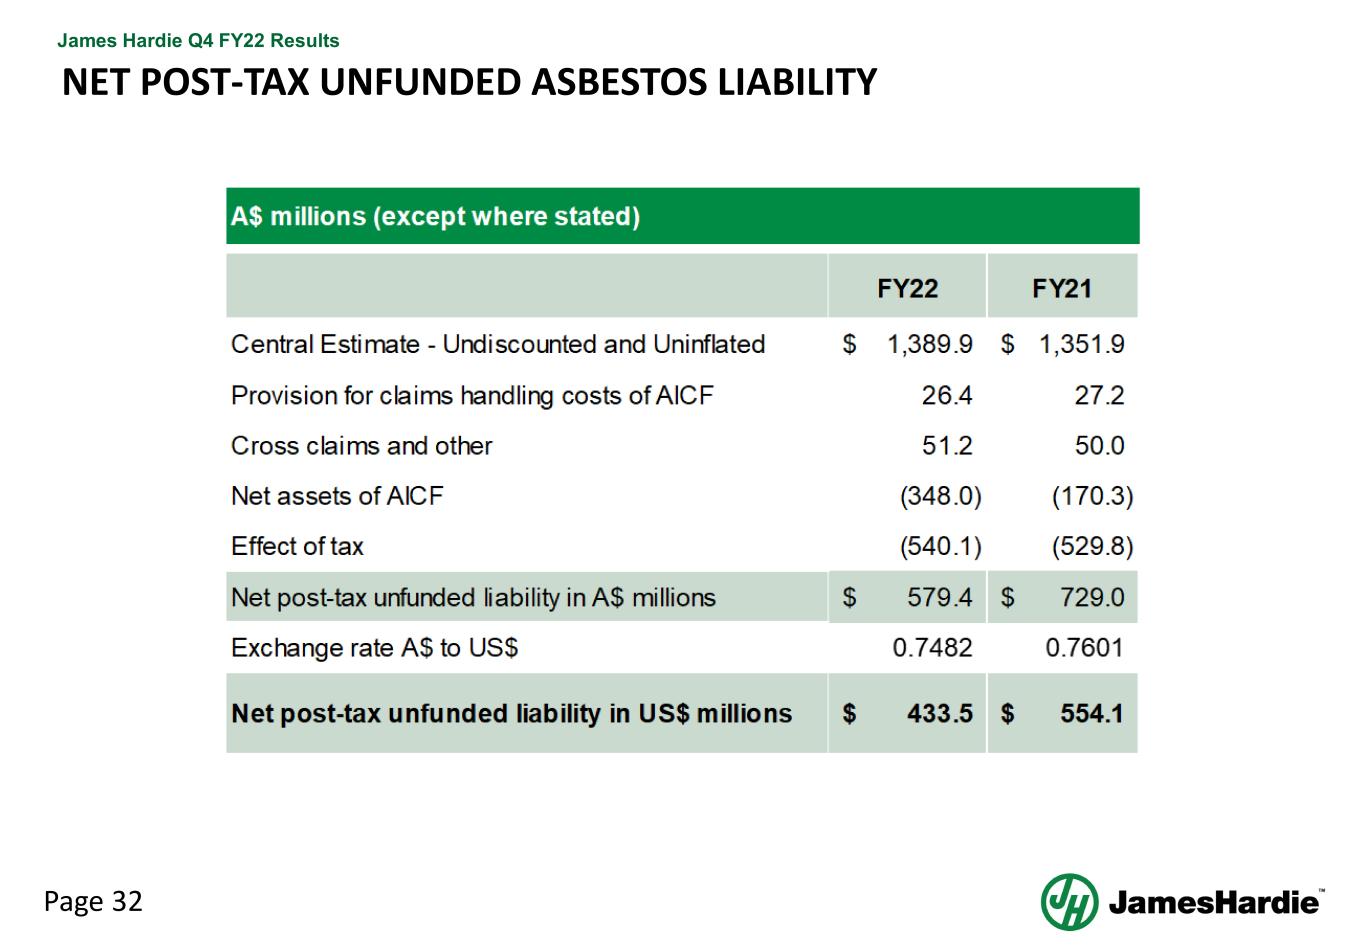
Page 32 James Hardie Q4 FY22 Results 1 NET POST-TAX UNFUNDED ASBESTOS LIABILITY
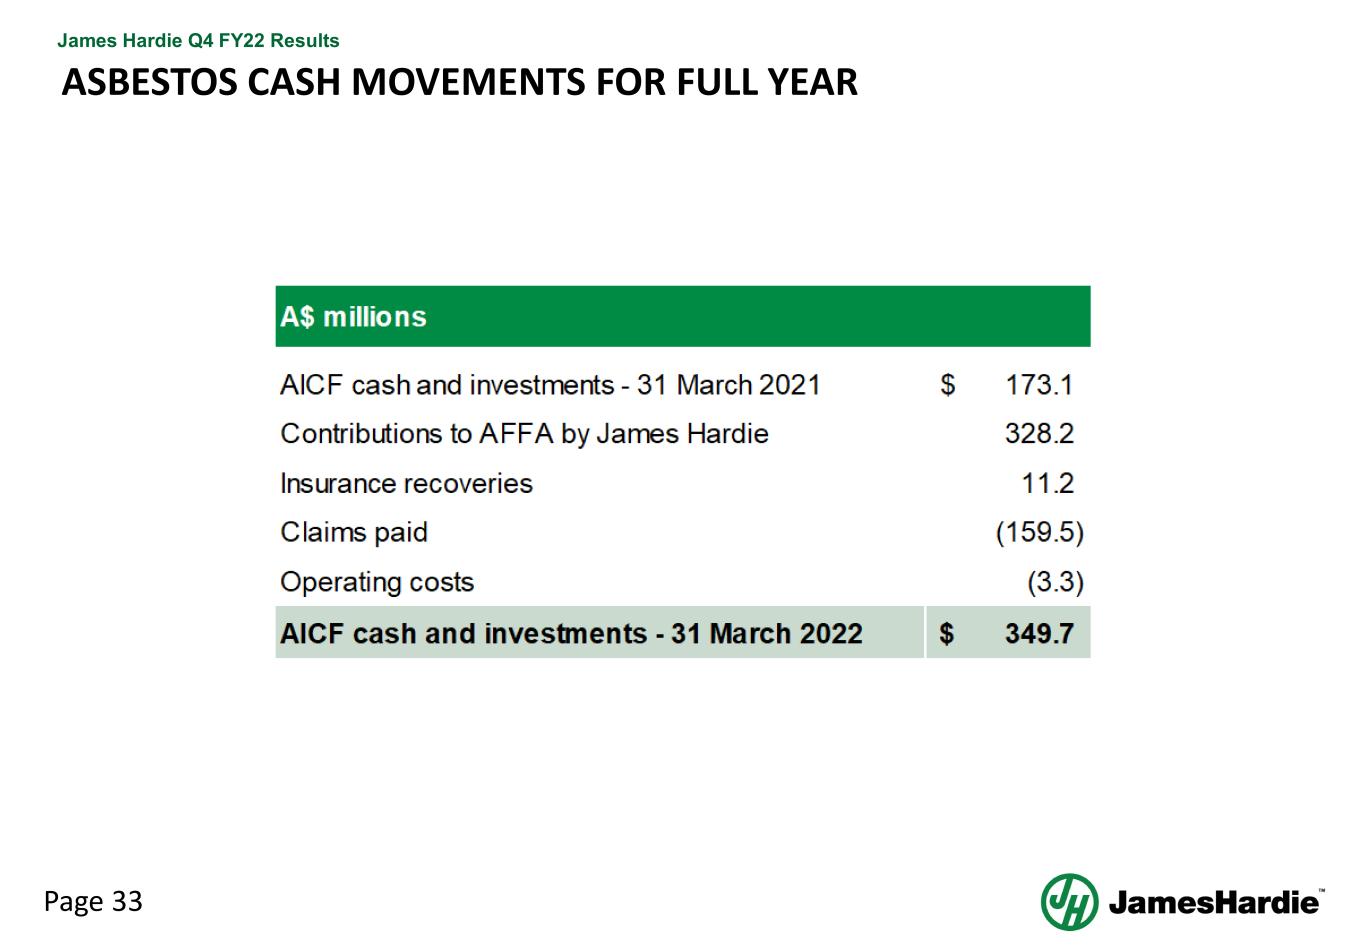
Page 33 James Hardie Q4 FY22 Results 1 ASBESTOS CASH MOVEMENTS FOR FULL YEAR
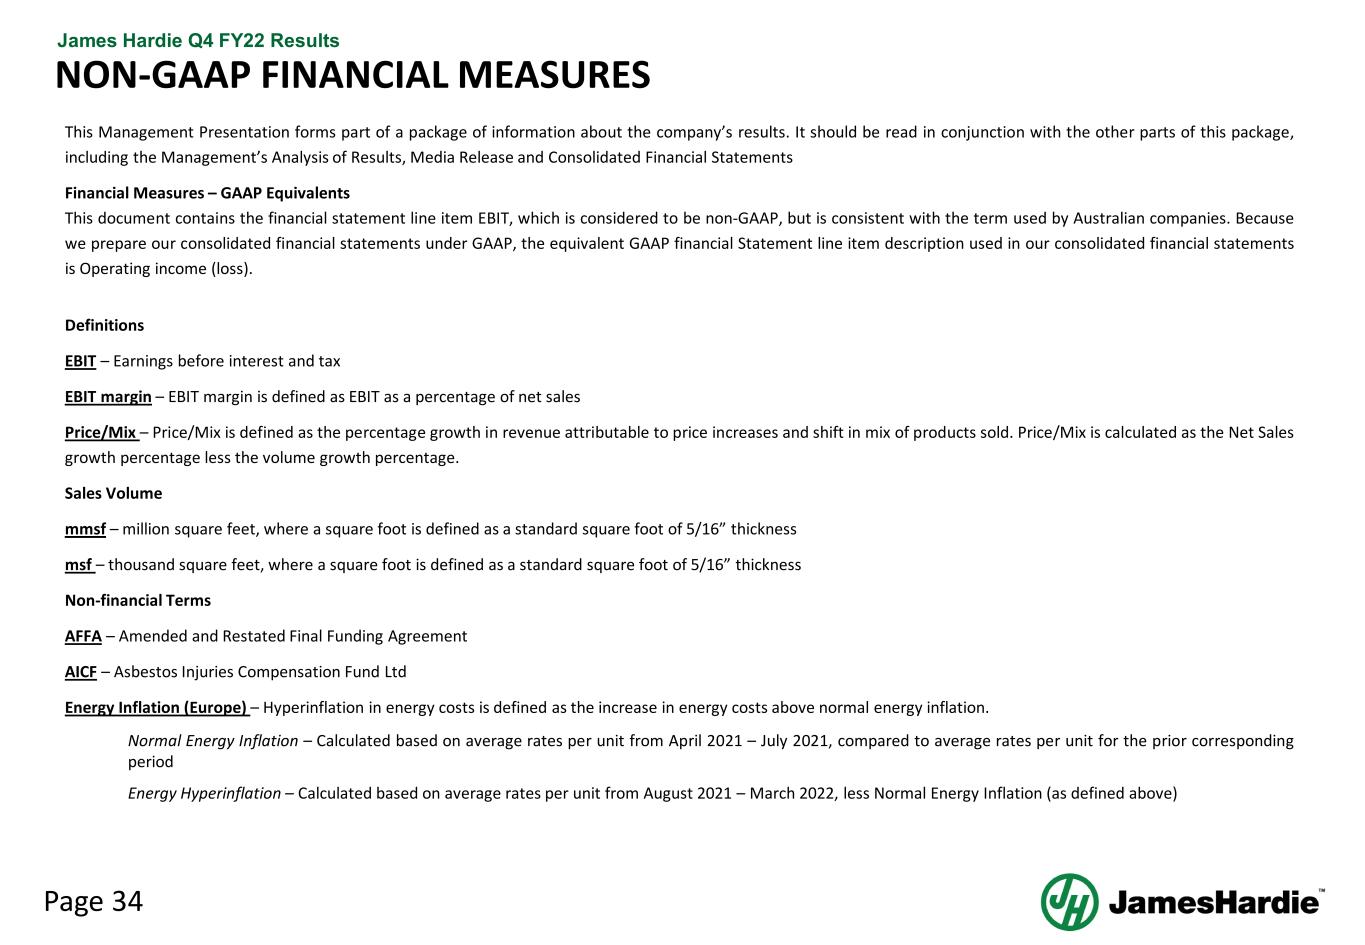
Page 34 James Hardie Q4 FY22 Results This Management Presentation forms part of a package of information about the company’s results. It should be read in conjunction with the other parts of this package, including the Management’s Analysis of Results, Media Release and Consolidated Financial Statements Financial Measures – GAAP Equivalents This document contains the financial statement line item EBIT, which is considered to be non-GAAP, but is consistent with the term used by Australian companies. Because we prepare our consolidated financial statements under GAAP, the equivalent GAAP financial Statement line item description used in our consolidated financial statements is Operating income (loss). Definitions EBIT – Earnings before interest and tax EBIT margin – EBIT margin is defined as EBIT as a percentage of net sales Price/Mix – Price/Mix is defined as the percentage growth in revenue attributable to price increases and shift in mix of products sold. Price/Mix is calculated as the Net Sales growth percentage less the volume growth percentage. Sales Volume mmsf – million square feet, where a square foot is defined as a standard square foot of 5/16” thickness msf – thousand square feet, where a square foot is defined as a standard square foot of 5/16” thickness Non-financial Terms AFFA – Amended and Restated Final Funding Agreement AICF – Asbestos Injuries Compensation Fund Ltd Energy Inflation (Europe) – Hyperinflation in energy costs is defined as the increase in energy costs above normal energy inflation. Normal Energy Inflation – Calculated based on average rates per unit from April 2021 – July 2021, compared to average rates per unit for the prior corresponding period Energy Hyperinflation – Calculated based on average rates per unit from August 2021 – March 2022, less Normal Energy Inflation (as defined above) NON-GAAP FINANCIAL MEASURES
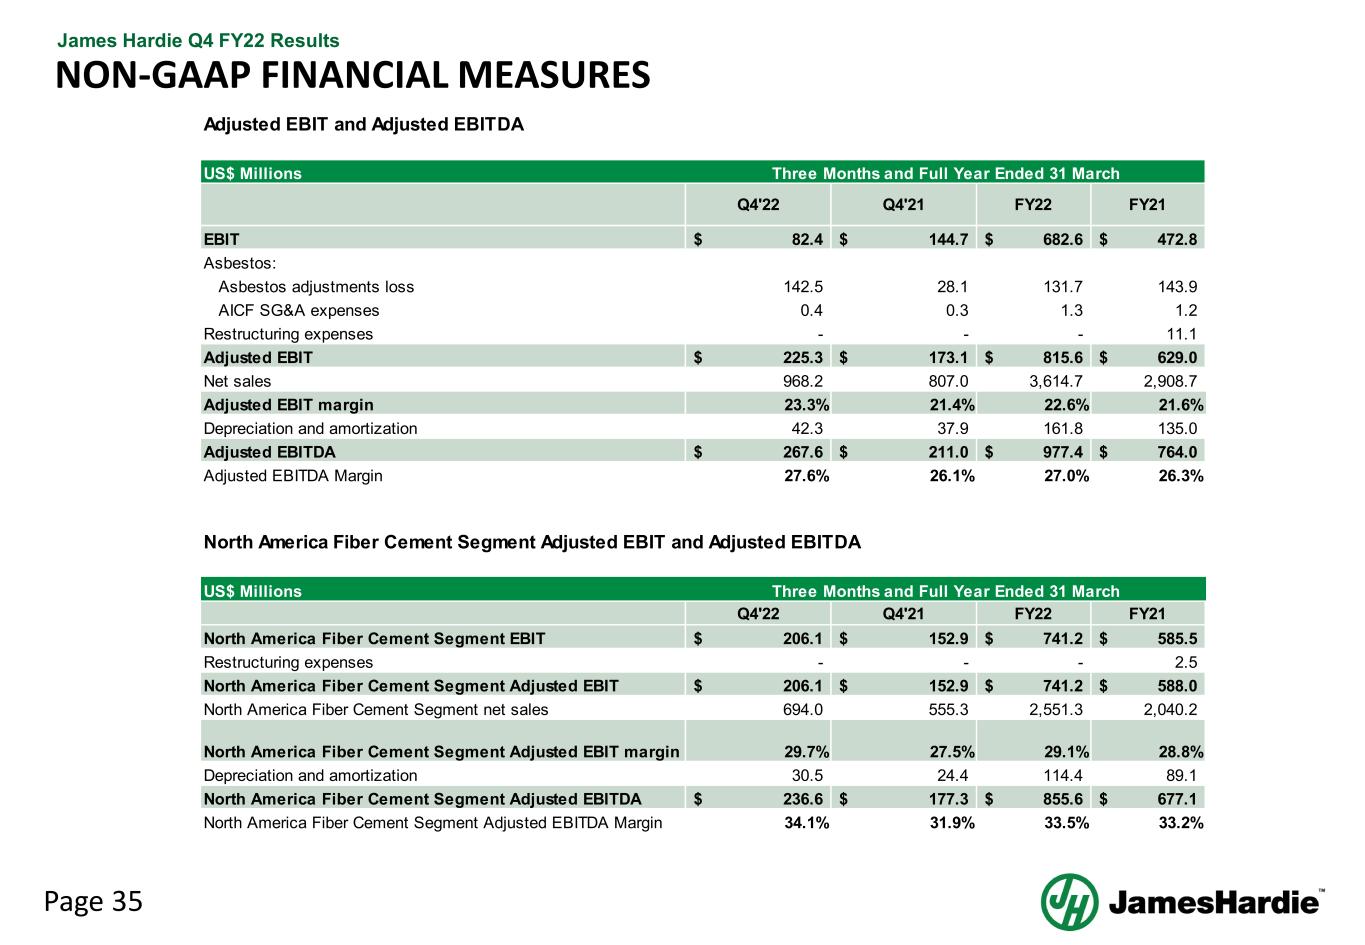
Page 35 James Hardie Q4 FY22 Results NON-GAAP FINANCIAL MEASURES Adjusted EBIT and Adjusted EBITDA US$ Millions Q4'22 Q4'21 FY22 FY21 EBIT 82.4$ 144.7$ 682.6$ 472.8$ Asbestos: Asbestos adjustments loss 142.5 28.1 131.7 143.9 AICF SG&A expenses 0.4 0.3 1.3 1.2 Restructuring expenses - - - 11.1 Adjusted EBIT 225.3$ 173.1$ 815.6$ 629.0$ Net sales 968.2 807.0 3,614.7 2,908.7 Adjusted EBIT margin 23.3% 21.4% 22.6% 21.6% Depreciation and amortization 42.3 37.9 161.8 135.0 Adjusted EBITDA 267.6$ 211.0$ 977.4$ 764.0$ Adjusted EBITDA Margin 27.6% 26.1% 27.0% 26.3% US$ Millions Q4'22 Q4'21 FY22 FY21 North America Fiber Cement Segment EBIT 206.1$ 152.9$ 741.2$ 585.5$ Restructuring expenses - - - 2.5 North America Fiber Cement Segment Adjusted EBIT 206.1$ 152.9$ 741.2$ 588.0$ North America Fiber Cement Segment net sales 694.0 555.3 2,551.3 2,040.2 North America Fiber Cement Segment Adjusted EBIT margin 29.7% 27.5% 29.1% 28.8% Depreciation and amortization 30.5 24.4 114.4 89.1 North America Fiber Cement Segment Adjusted EBITDA 236.6$ 177.3$ 855.6$ 677.1$ North America Fiber Cement Segment Adjusted EBITDA Margin 34.1% 31.9% 33.5% 33.2% Three Months and Full Year Ended 31 March North America Fiber Cement Segment Adjusted EBIT and Adjusted EBITDA Three Months and Full Year Ended 31 March
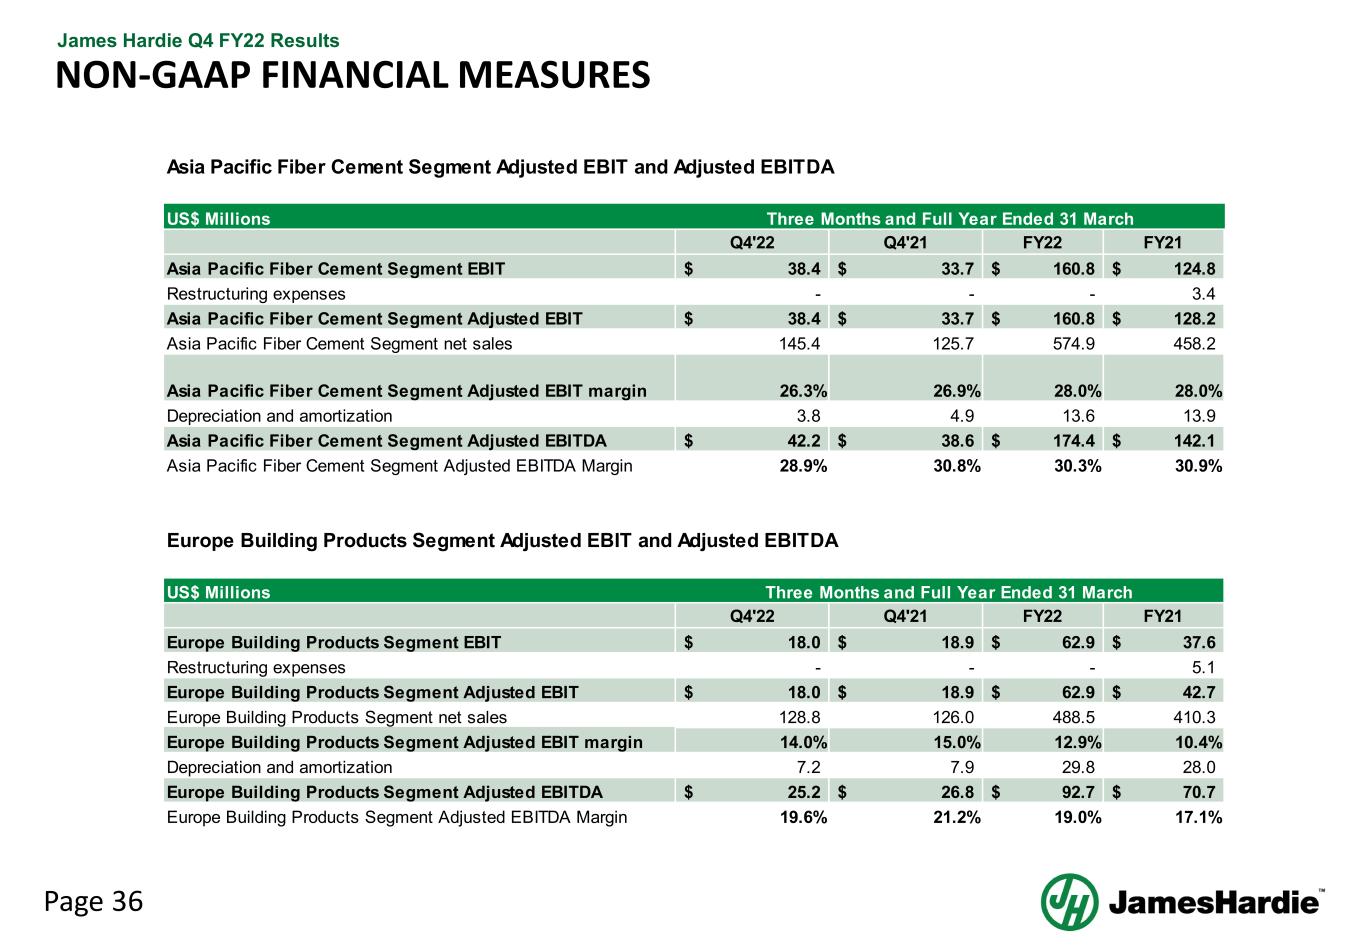
Page 36 James Hardie Q4 FY22 Results NON-GAAP FINANCIAL MEASURES US$ Millions Q4'22 Q4'21 FY22 FY21 Asia Pacific Fiber Cement Segment EBIT 38.4$ 33.7$ 160.8$ 124.8$ Restructuring expenses - - - 3.4 Asia Pacific Fiber Cement Segment Adjusted EBIT 38.4$ 33.7$ 160.8$ 128.2$ Asia Pacific Fiber Cement Segment net sales 145.4 125.7 574.9 458.2 Asia Pacific Fiber Cement Segment Adjusted EBIT margin 26.3% 26.9% 28.0% 28.0% Depreciation and amortization 3.8 4.9 13.6 13.9 Asia Pacific Fiber Cement Segment Adjusted EBITDA 42.2$ 38.6$ 174.4$ 142.1$ Asia Pacific Fiber Cement Segment Adjusted EBITDA Margin 28.9% 30.8% 30.3% 30.9% Asia Pacific Fiber Cement Segment Adjusted EBIT and Adjusted EBITDA Three Months and Full Year Ended 31 March US$ Millions Q4'22 Q4'21 FY22 FY21 Europe Building Products Segment EBIT 18.0$ 18.9$ 62.9$ 37.6$ Restructuring expenses - - - 5.1 Europe Building Products Segment Adjusted EBIT 18.0$ 18.9$ 62.9$ 42.7$ Europe Building Products Segment net sales 128.8 126.0 488.5 410.3 Europe Building Products Segment Adjusted EBIT margin 14.0% 15.0% 12.9% 10.4% Depreciation and amortization 7.2 7.9 29.8 28.0 Europe Building Products Segment Adjusted EBITDA 25.2$ 26.8$ 92.7$ 70.7$ Europe Building Products Segment Adjusted EBITDA Margin 19.6% 21.2% 19.0% 17.1% Three Months and Full Year Ended 31 March Europe Building Products Segment Adjusted EBIT and Adjusted EBITDA
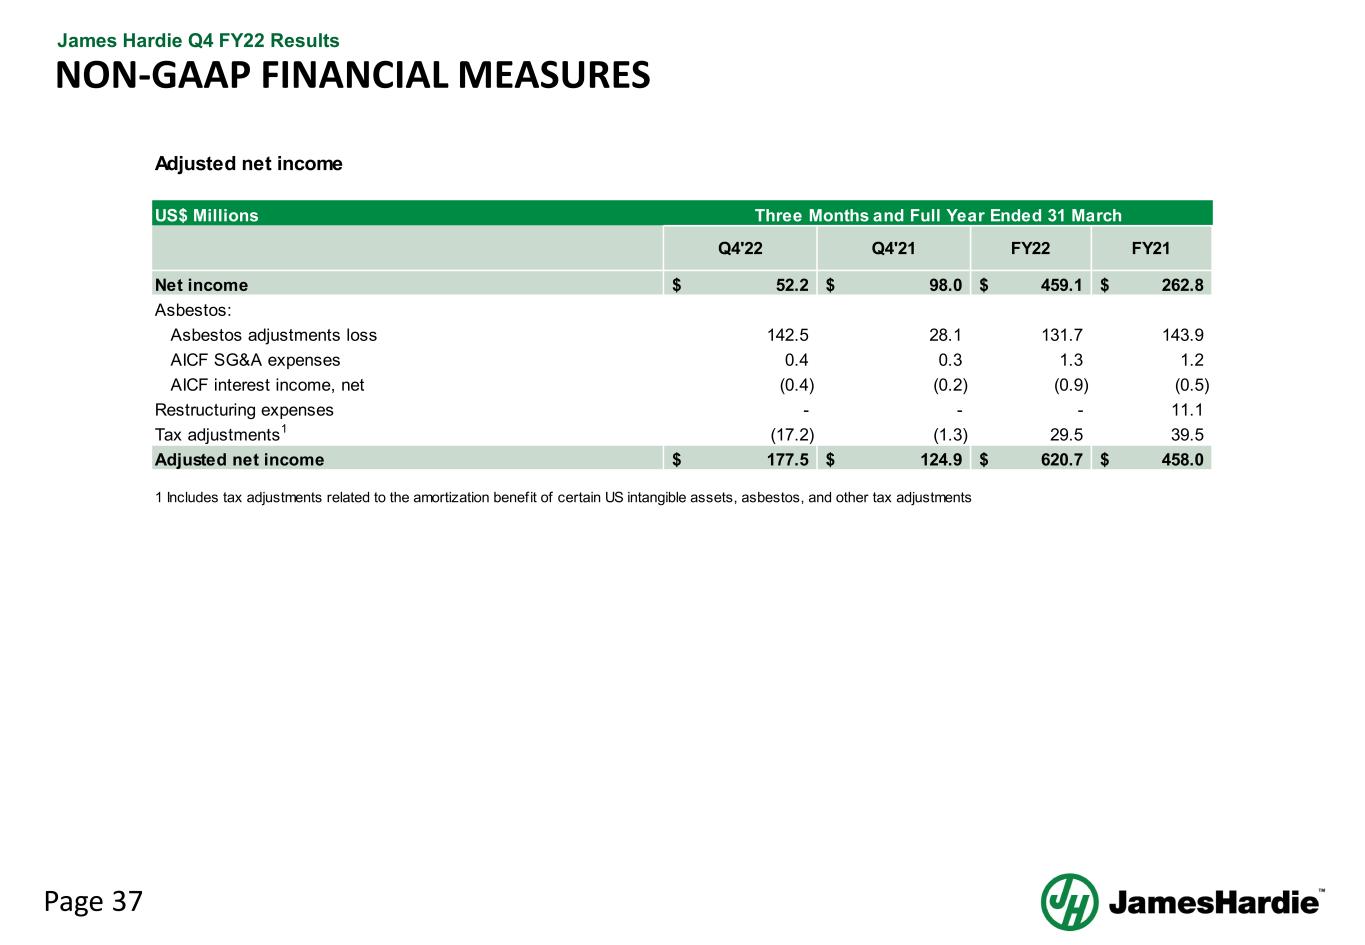
Page 37 James Hardie Q4 FY22 Results NON-GAAP FINANCIAL MEASURES Adjusted net income US$ Millions Q4'22 Q4'21 FY22 FY21 Net income 52.2$ 98.0$ 459.1$ 262.8$ Asbestos: Asbestos adjustments loss 142.5 28.1 131.7 143.9 AICF SG&A expenses 0.4 0.3 1.3 1.2 AICF interest income, net (0.4) (0.2) (0.9) (0.5) Restructuring expenses - - - 11.1 Tax adjustments1 (17.2) (1.3) 29.5 39.5 Adjusted net income 177.5$ 124.9$ 620.7$ 458.0$ 1 Includes tax adjustments related to the amortization benefit of certain US intangible assets, asbestos, and other tax adjustments Three Months and Full Year Ended 31 March
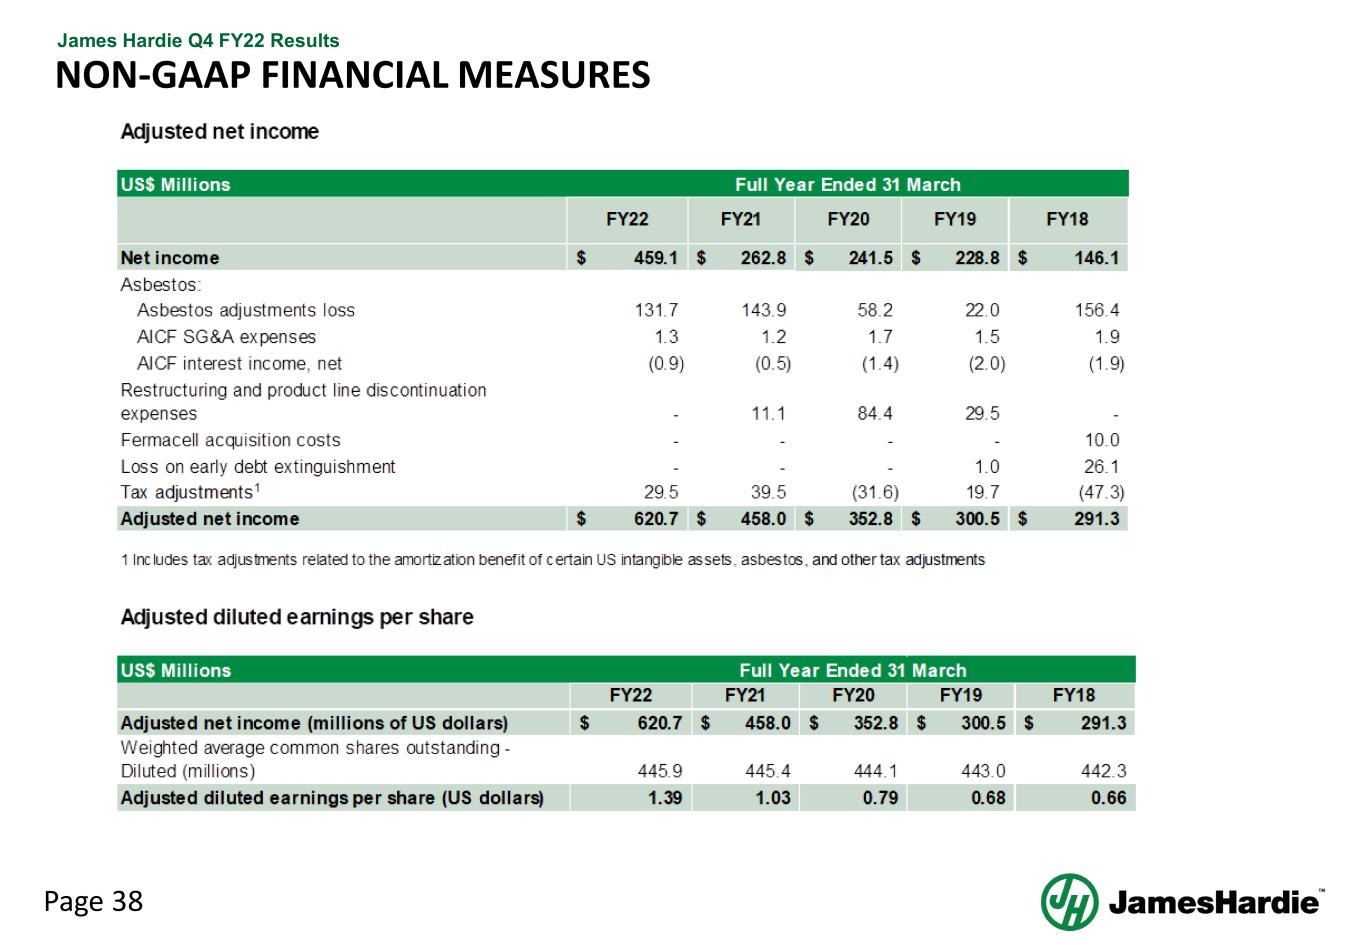
Page 38 James Hardie Q4 FY22 Results NON-GAAP FINANCIAL MEASURES
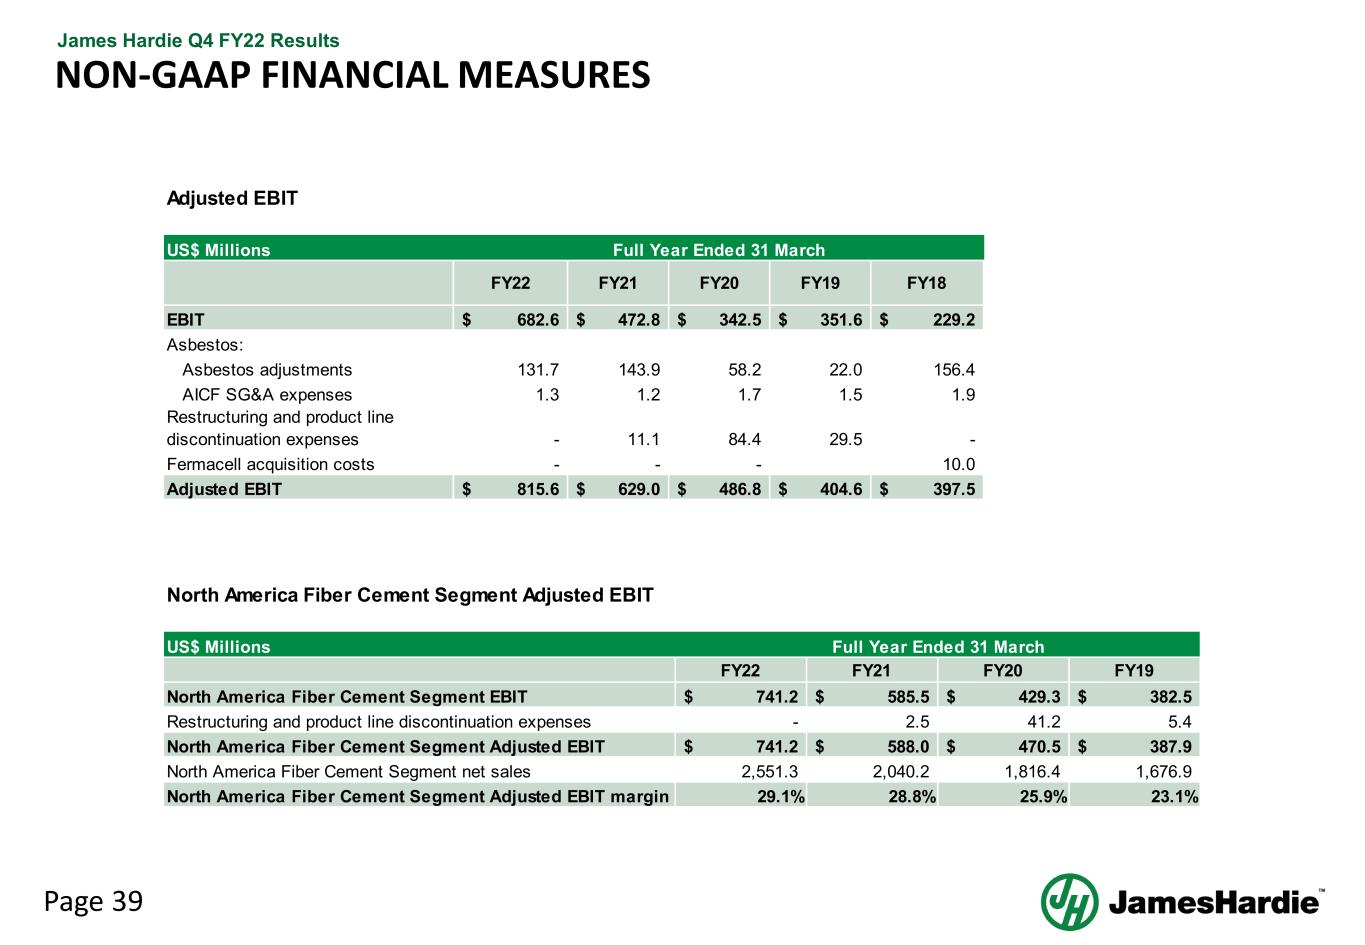
Page 39 James Hardie Q4 FY22 Results NON-GAAP FINANCIAL MEASURES Adjusted EBIT US$ Millions FY22 FY21 FY20 FY19 FY18 EBIT 682.6$ 472.8$ 342.5$ 351.6$ 229.2$ Asbestos: Asbestos adjustments 131.7 143.9 58.2 22.0 156.4 AICF SG&A expenses 1.3 1.2 1.7 1.5 1.9 Restructuring and product line discontinuation expenses - 11.1 84.4 29.5 - Fermacell acquisition costs - - - 10.0 Adjusted EBIT 815.6$ 629.0$ 486.8$ 404.6$ 397.5$ Full Year Ended 31 March US$ Millions FY22 FY21 FY20 FY19 North America Fiber Cement Segment EBIT 741.2$ 585.5$ 429.3$ 382.5$ Restructuring and product line discontinuation expenses - 2.5 41.2 5.4 North America Fiber Cement Segment Adjusted EBIT 741.2$ 588.0$ 470.5$ 387.9$ North America Fiber Cement Segment net sales 2,551.3 2,040.2 1,816.4 1,676.9 North America Fiber Cement Segment Adjusted EBIT margin 29.1% 28.8% 25.9% 23.1% North America Fiber Cement Segment Adjusted EBIT Full Year Ended 31 March
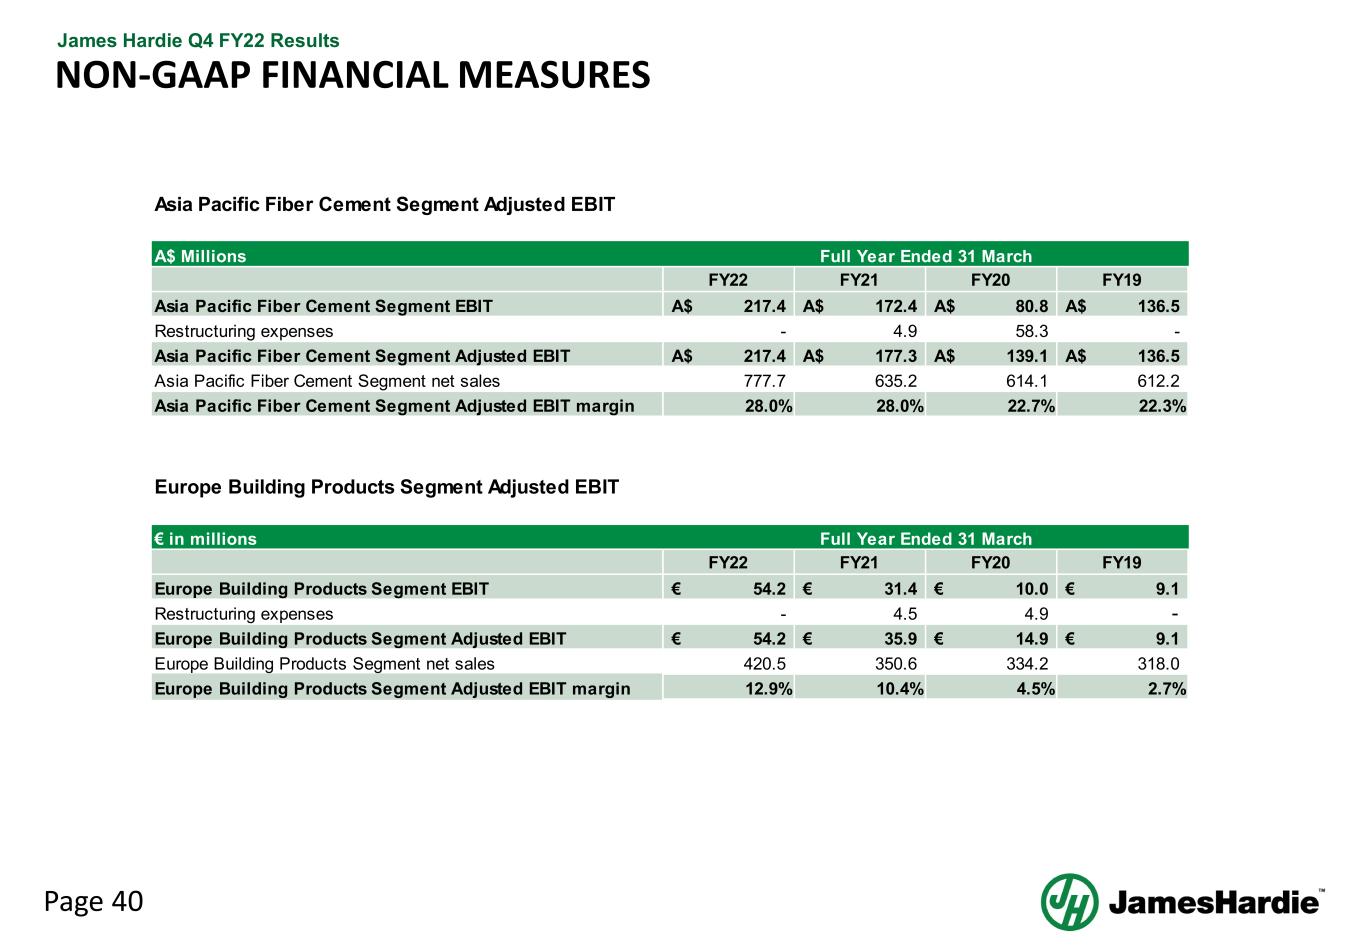
Page 40 James Hardie Q4 FY22 Results NON-GAAP FINANCIAL MEASURES A$ Millions FY22 FY21 FY20 FY19 Asia Pacific Fiber Cement Segment EBIT 217.4A$ 172.4A$ 80.8A$ 136.5A$ Restructuring expenses - 4.9 58.3 - Asia Pacific Fiber Cement Segment Adjusted EBIT 217.4A$ 177.3A$ 139.1A$ 136.5A$ Asia Pacific Fiber Cement Segment net sales 777.7 635.2 614.1 612.2 Asia Pacific Fiber Cement Segment Adjusted EBIT margin 28.0% 28.0% 22.7% 22.3% Asia Pacific Fiber Cement Segment Adjusted EBIT Full Year Ended 31 March € in millions FY22 FY21 FY20 FY19 Europe Building Products Segment EBIT 54.2€ 31.4€ 10.0€ 9.1€ Restructuring expenses - 4.5 4.9 - Europe Building Products Segment Adjusted EBIT 54.2€ 35.9€ 14.9€ 9.1€ Europe Building Products Segment net sales 420.5 350.6 334.2 318.0 Europe Building Products Segment Adjusted EBIT margin 12.9% 10.4% 4.5% 2.7% Europe Building Products Segment Adjusted EBIT Full Year Ended 31 March

Q4 FY22 MANAGEMENT PRESENTATION 17 May 2022