ja m es ha rd ie .c o m ↓ FY 2022 Building Sustainable Communities Sustainability Report EXHIBIT 99.2
#1 130+ years James Hardie has been delivering innovative solutions producer of high-performance fiber cement products ↑ ↓ About this report This is James Hardie’s second sustainability report. It covers our sustainability performance and progress for FY22 across our global operations and highlights our future priorities. It has been prepared in accordance with the GRI Standards: Core option. As our sustainability program progresses, we are committed to aligning with best-practice reporting standards and frameworks, including those set forth by Global Reporting Initiative (GRI), the Sustainability Accounting Standards Board (SASB) and the Task Force on Climate-related Financial Disclosures (TCFD). All monetary figures are in US dollars unless otherwise indicated. About James Hardie James Hardie Industries plc is the world’s #1 producer and marketer of high-performance fiber cement siding and fiber gypsum building solutions. Our company culture is built on providing a foundation of “Zero Harm,” creating a positive impact in communities, and delivering environmentally responsible and innovative solutions to customers. In business for more than 130 years, James Hardie successfully uses innovation to drive market value. Our products are made from natural and sustainable raw materials, delivering endless design possibilities to consumers. We manufacture a variety of patterned profiles and surface finishes for a range of applications, including siding, trim, soffit lining, internal linings, walls, facades, floors and tile underlay for use in residential, commercial and industrial applications. We manufacture and distribute our products and accessories globally for use in new residential construction, manufactured housing, renovations and extensions, as well as a variety of commercial and industrial applications. Headquartered in Ireland, James Hardie employs a diverse global workforce of approximately 5,000 employees across operations in North America, Europe, Australia, New Zealand and the Philippines. In the fiscal year ending 31 March 2022 (FY22), James Hardie generated more than $3.6 billion in net sales and more than $621 million in net income. Sustainability Report | FY 2022 2 B u il d in g S u s ta in a b le C o m m u n it ie s 02 Building Better Systems 03 Building Community 04 Building Value01 Overview 05 Building Our Foundation 06 Appendix
↑ ↓ T A B L E O F C O N T E N T S 01 Overview A message from the CEO 5 Operations overview 6 Our pillars 7 FY22 highlights 8 Honors and accolades 9 02 Building Better Systems Teamwork through HMOS 11 Eliminating coal 12 Water-saving technologies 13 Recycling and reusing waste 14 Safety 15 03 Building Community Inclusion and diversity 17 Empowering our employees 18 Benefiting our local communities 19 04 Building Value Consumer feedback drives innovation 21 Our product lifecycle 22 Impacting our local economies 23 05 Building Our Foundation Our stakeholders and material topics 25 Governance and ethics 26 Climate disclosure update 27 Management approach 28 06 Appendix ESG data summary 32 GRI index 37 SASB index 41 3
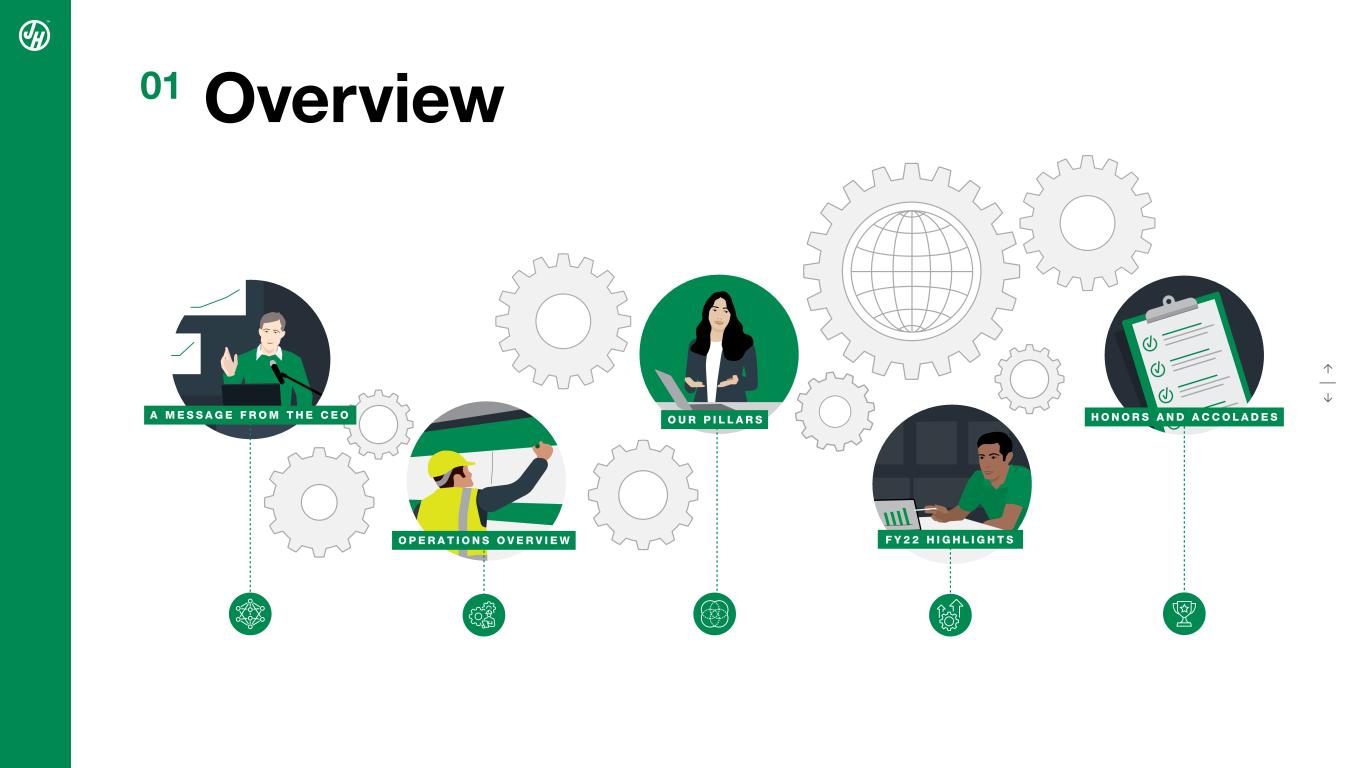
01 Overview O U R P I L L A R SA M E S S A G E F R O M T H E C E O F Y 2 2 H I G H L I G H T S H O N O R S A N D A C C O L A D E S O P E R A T I O N S O V E R V I E W ↑ ↓
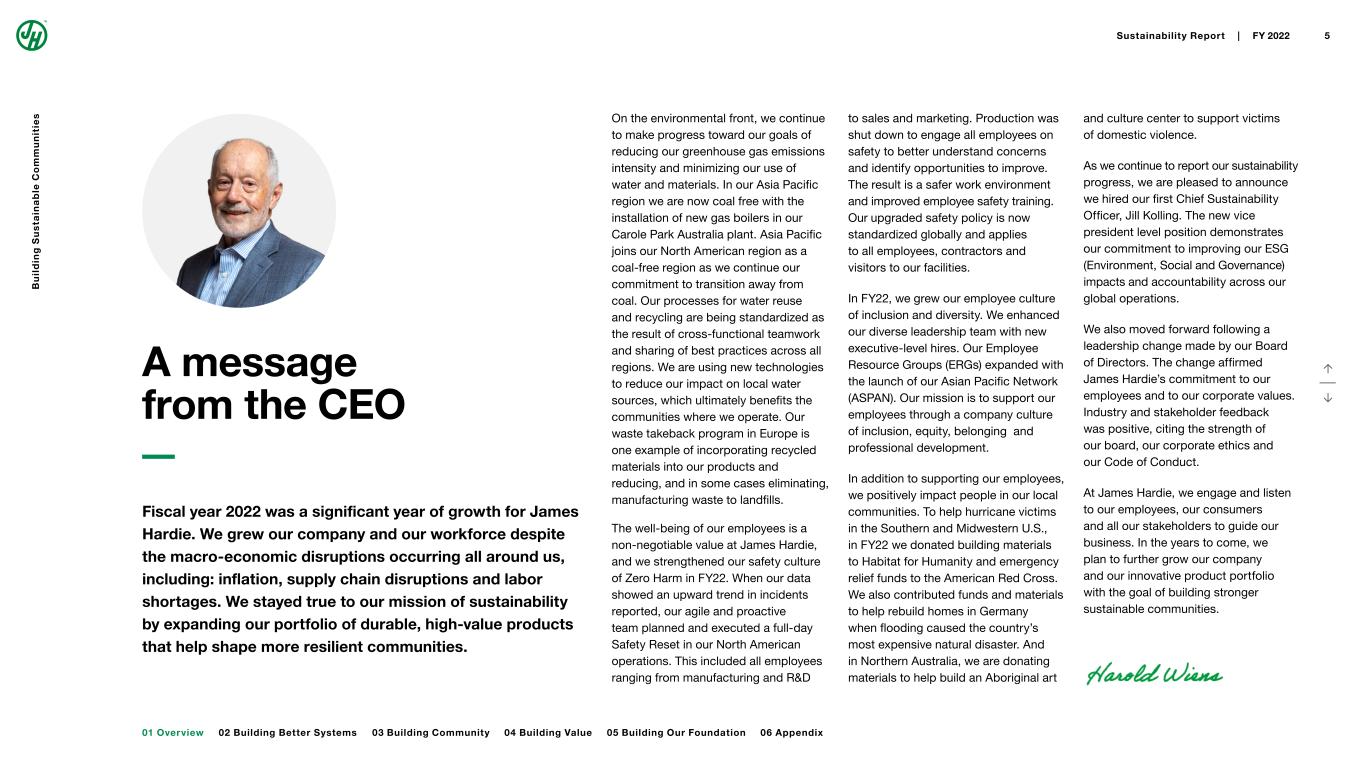
A message from the CEO Fiscal year 2022 was a significant year of growth for James Hardie. We grew our company and our workforce despite the macro-economic disruptions occurring all around us, including: inflation, supply chain disruptions and labor shortages. We stayed true to our mission of sustainability by expanding our portfolio of durable, high-value products that help shape more resilient communities. On the environmental front, we continue to make progress toward our goals of reducing our greenhouse gas emissions intensity and minimizing our use of water and materials. In our Asia Pacific region we are now coal free with the installation of new gas boilers in our Carole Park Australia plant. Asia Pacific joins our North American region as a coal-free region as we continue our commitment to transition away from coal. Our processes for water reuse and recycling are being standardized as the result of cross-functional teamwork and sharing of best practices across all regions. We are using new technologies to reduce our impact on local water sources, which ultimately benefits the communities where we operate. Our waste takeback program in Europe is one example of incorporating recycled materials into our products and reducing, and in some cases eliminating, manufacturing waste to landfills. The well-being of our employees is a non-negotiable value at James Hardie, and we strengthened our safety culture of Zero Harm in FY22. When our data showed an upward trend in incidents reported, our agile and proactive team planned and executed a full-day Safety Reset in our North American operations. This included all employees ranging from manufacturing and R&D to sales and marketing. Production was shut down to engage all employees on safety to better understand concerns and identify opportunities to improve. The result is a safer work environment and improved employee safety training. Our upgraded safety policy is now standardized globally and applies to all employees, contractors and visitors to our facilities. In FY22, we grew our employee culture of inclusion and diversity. We enhanced our diverse leadership team with new executive-level hires. Our Employee Resource Groups (ERGs) expanded with the launch of our Asian Pacific Network (ASPAN). Our mission is to support our employees through a company culture of inclusion, equity, belonging and professional development. In addition to supporting our employees, we positively impact people in our local communities. To help hurricane victims in the Southern and Midwestern U.S., in FY22 we donated building materials to Habitat for Humanity and emergency relief funds to the American Red Cross. We also contributed funds and materials to help rebuild homes in Germany when flooding caused the country’s most expensive natural disaster. And in Northern Australia, we are donating materials to help build an Aboriginal art and culture center to support victims of domestic violence. As we continue to report our sustainability progress, we are pleased to announce we hired our first Chief Sustainability Officer, Jill Kolling. The new vice president level position demonstrates our commitment to improving our ESG (Environment, Social and Governance) impacts and accountability across our global operations. We also moved forward following a leadership change made by our Board of Directors. The change affirmed James Hardie’s commitment to our employees and to our corporate values. Industry and stakeholder feedback was positive, citing the strength of our board, our corporate ethics and our Code of Conduct. At James Hardie, we engage and listen to our employees, our consumers and all our stakeholders to guide our business. In the years to come, we plan to further grow our company and our innovative product portfolio with the goal of building stronger sustainable communities. ↑ ↓ 02 Building Better Systems 03 Building Community 04 Building Value01 Overview 05 Building Our Foundation 06 Appendix Sustainability Report | FY 2022 5 B u il d in g S u s ta in a b le C o m m u n it ie s
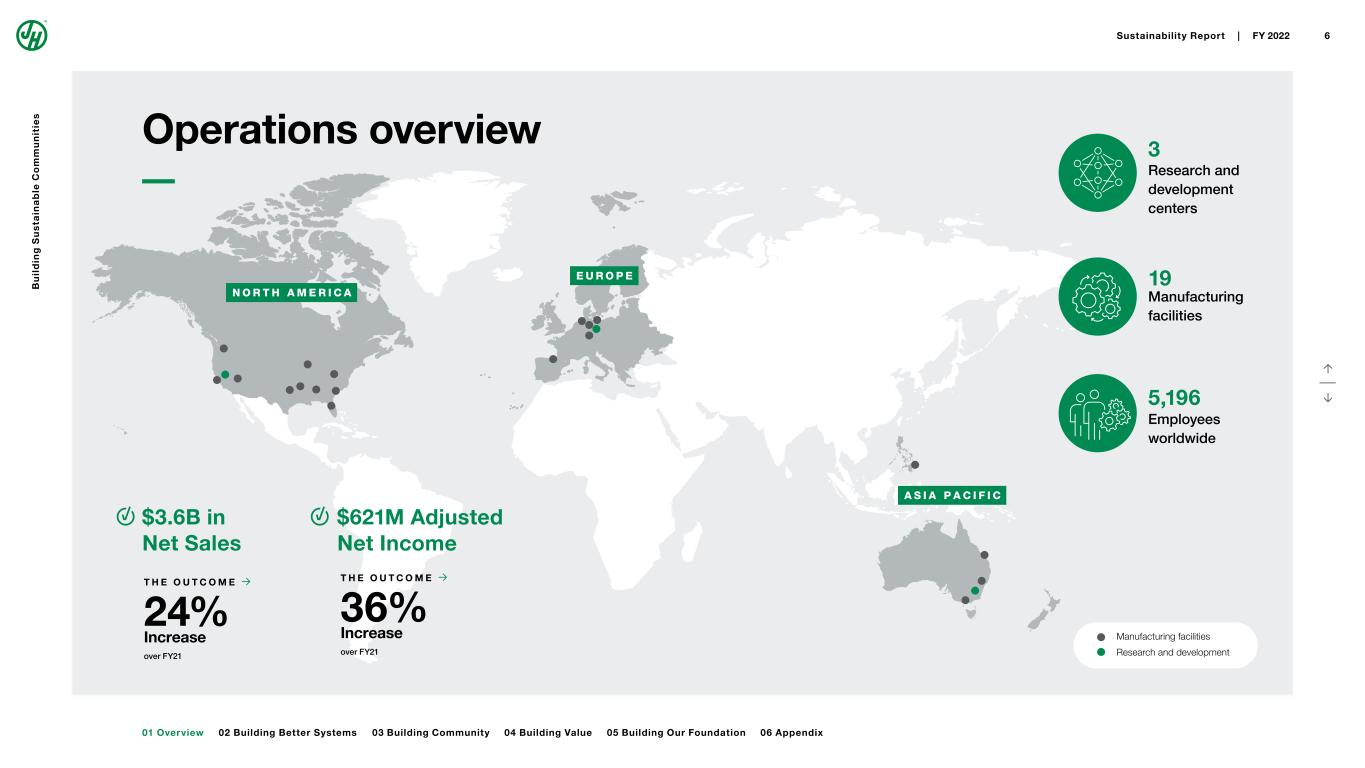
A S I A P A C I F I C E U R O P E N O R T H A M E R I C A Operations overview $621M Adjusted Net Income $3.6B in Net Sales 19 Manufacturing facilities 3 Research and development centers 5,196 Employees worldwide Manufacturing facilities Research and development T H E O U T C O M E → 36% Increase over FY21 ↑ ↓ T H E O U T C O M E → 24% Increase over FY21 02 Building Better Systems 03 Building Community 04 Building Value01 Overview 05 Building Our Foundation 06 Appendix Sustainability Report | FY 2022 6 B u il d in g S u s ta in a b le C o m m u n it ie s
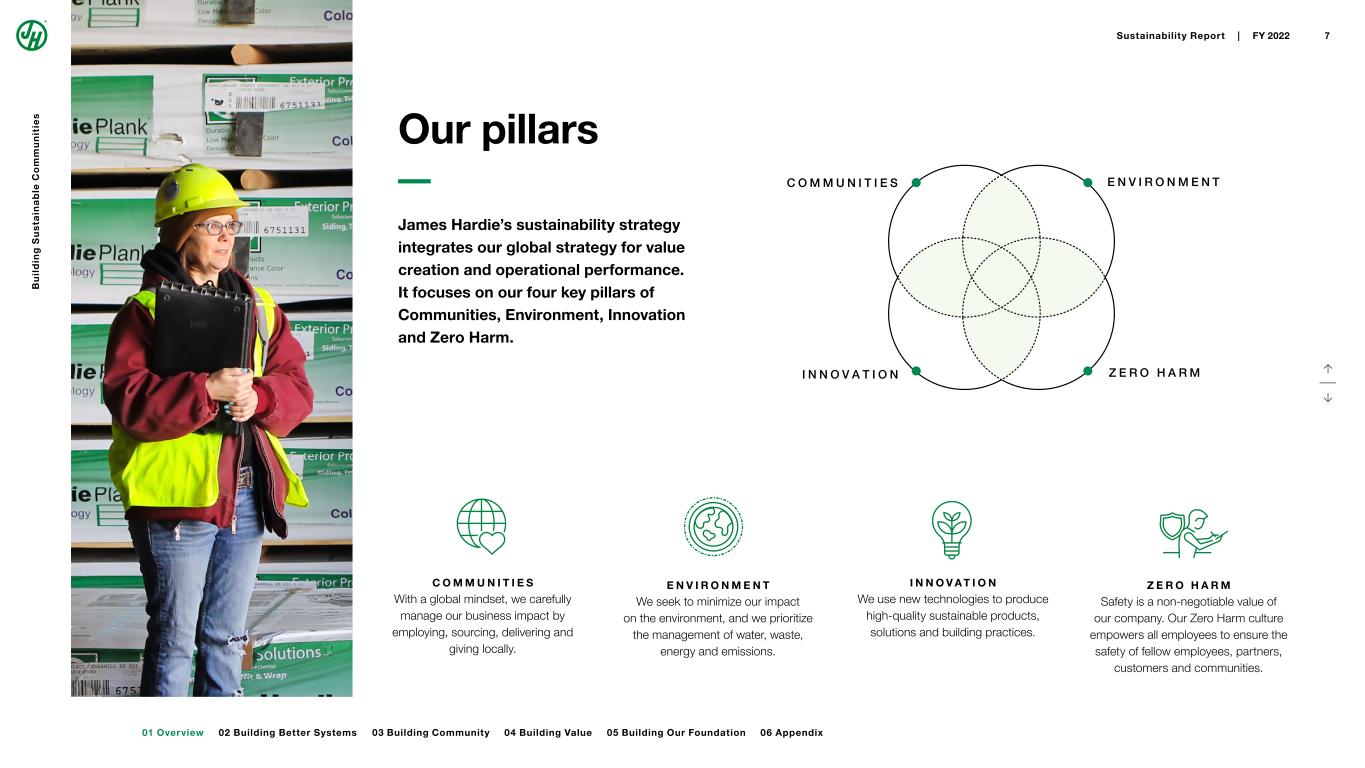
Our pillars C O M M U N I T I E S With a global mindset, we carefully manage our business impact by employing, sourcing, delivering and giving locally. E N V I R O N M E N T We seek to minimize our impact on the environment, and we prioritize the management of water, waste, energy and emissions. I N N O V A T I O N We use new technologies to produce high-quality sustainable products, solutions and building practices. Z E R O H A R M Safety is a non-negotiable value of our company. Our Zero Harm culture empowers all employees to ensure the safety of fellow employees, partners, customers and communities. C O M M U N I T I E S E N V I R O N M E N T I N N O V A T I O N Z E R O H A R M James Hardie’s sustainability strategy integrates our global strategy for value creation and operational performance. It focuses on our four key pillars of Communities, Environment, Innovation and Zero Harm. ↑ ↓ 02 Building Better Systems 03 Building Community 04 Building Value01 Overview 05 Building Our Foundation 06 Appendix Sustainability Report | FY 2022 7 B u il d in g S u s ta in a b le C o m m u n it ie s
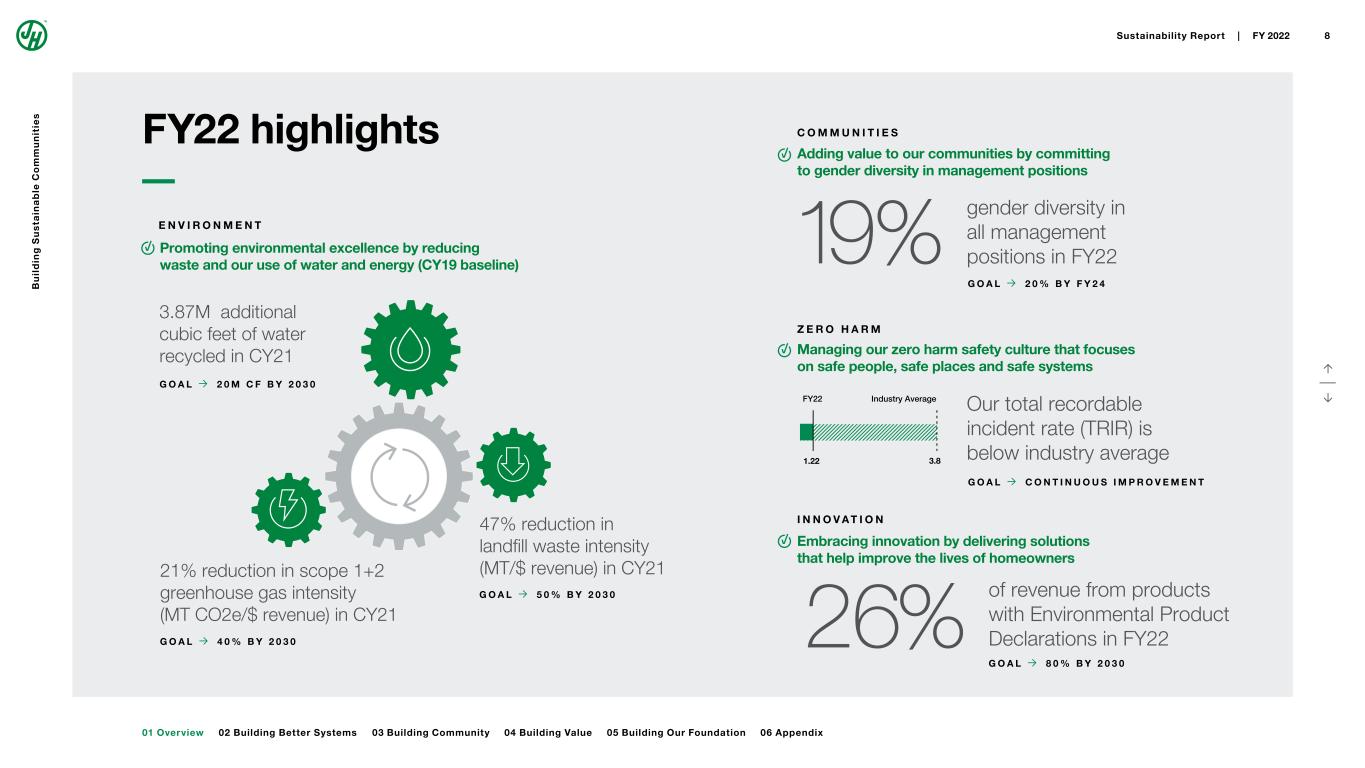
gender diversity in all management positions in FY22 21% reduction in scope 1+2 greenhouse gas intensity (MT CO2e/$ revenue) in CY21 3.87M additional cubic feet of water recycled in CY21 47% reduction in landfill waste intensity (MT/$ revenue) in CY21 Our total recordable incident rate (TRIR) is below industry average of revenue from products with Environmental Product Declarations in FY22 Promoting environmental excellence by reducing waste and our use of water and energy (CY19 baseline) Adding value to our communities by committing to gender diversity in management positions Managing our zero harm safety culture that focuses on safe people, safe places and safe systems Embracing innovation by delivering solutions that help improve the lives of homeowners 1.22 FY22 Industry Average 3.8 19% 26% C O M M U N I T I E S E N V I R O N M E N T I N N O V A T I O N Z E R O H A R M G O A L → 5 0 % B Y 2 0 3 0 G O A L → 2 0 M C F B Y 2 0 3 0 G O A L → 4 0 % B Y 2 0 3 0 G O A L → 2 0 % B Y F Y 2 4 G O A L → C O N T I N U O U S I M P R O V E M E N T G O A L → 8 0 % B Y 2 0 3 0 ↑ ↓ FY22 highlights 02 Building Better Systems 03 Building Community 04 Building Value01 Overview 05 Building Our Foundation 06 Appendix Sustainability Report | FY 2022 8 B u il d in g S u s ta in a b le C o m m u n it ie s
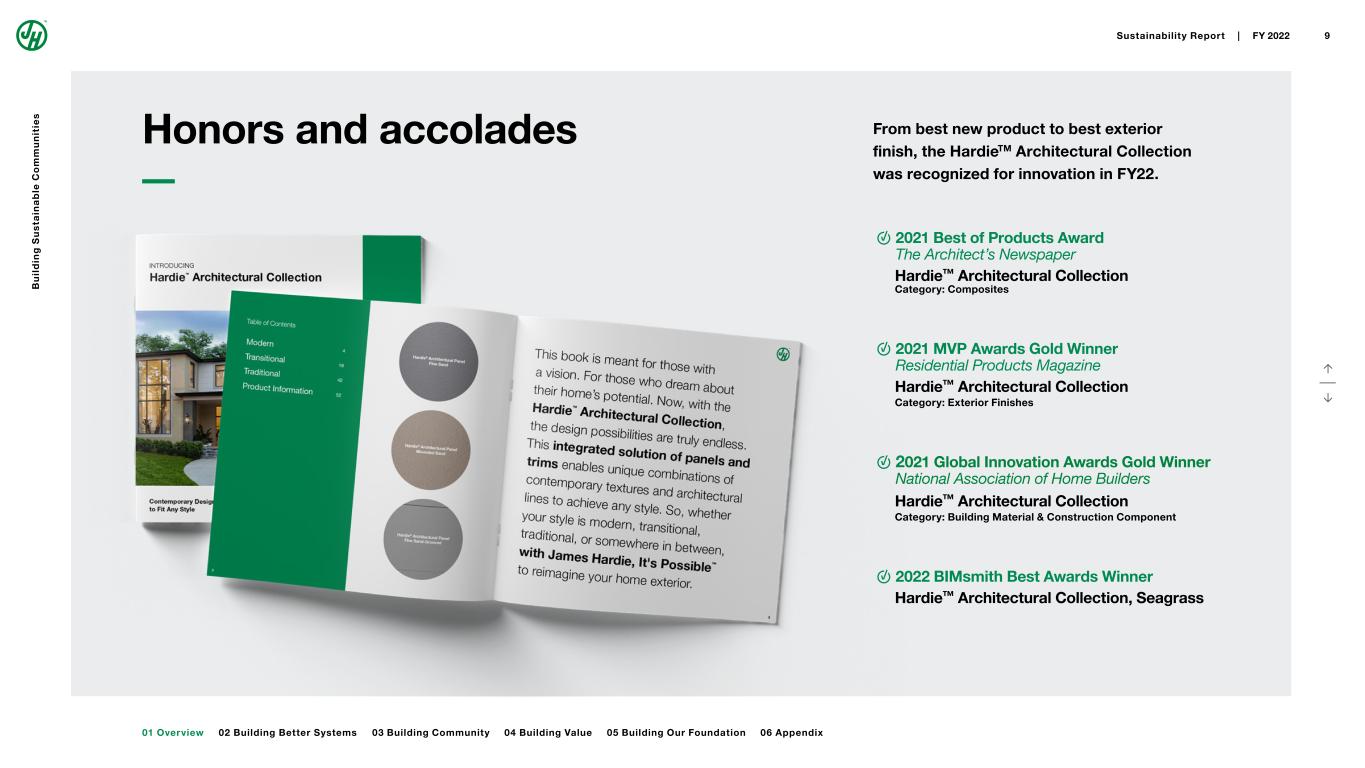
↑ ↓ Honors and accolades From best new product to best exterior finish, the HardieTM Architectural Collection was recognized for innovation in FY22. 2021 Best of Products Award The Architect’s Newspaper Hardie™ Architectural Collection Category: Composites 2021 MVP Awards Gold Winner Residential Products Magazine Hardie™ Architectural Collection Category: Exterior Finishes 2021 Global Innovation Awards Gold Winner National Association of Home Builders Hardie™ Architectural Collection Category: Building Material & Construction Component 2022 BIMsmith Best Awards Winner Hardie™ Architectural Collection, Seagrass 02 Building Better Systems 03 Building Community 04 Building Value01 Overview 05 Building Our Foundation 06 Appendix Sustainability Report | FY 2022 9 B u il d in g S u s ta in a b le C o m m u n it ie s
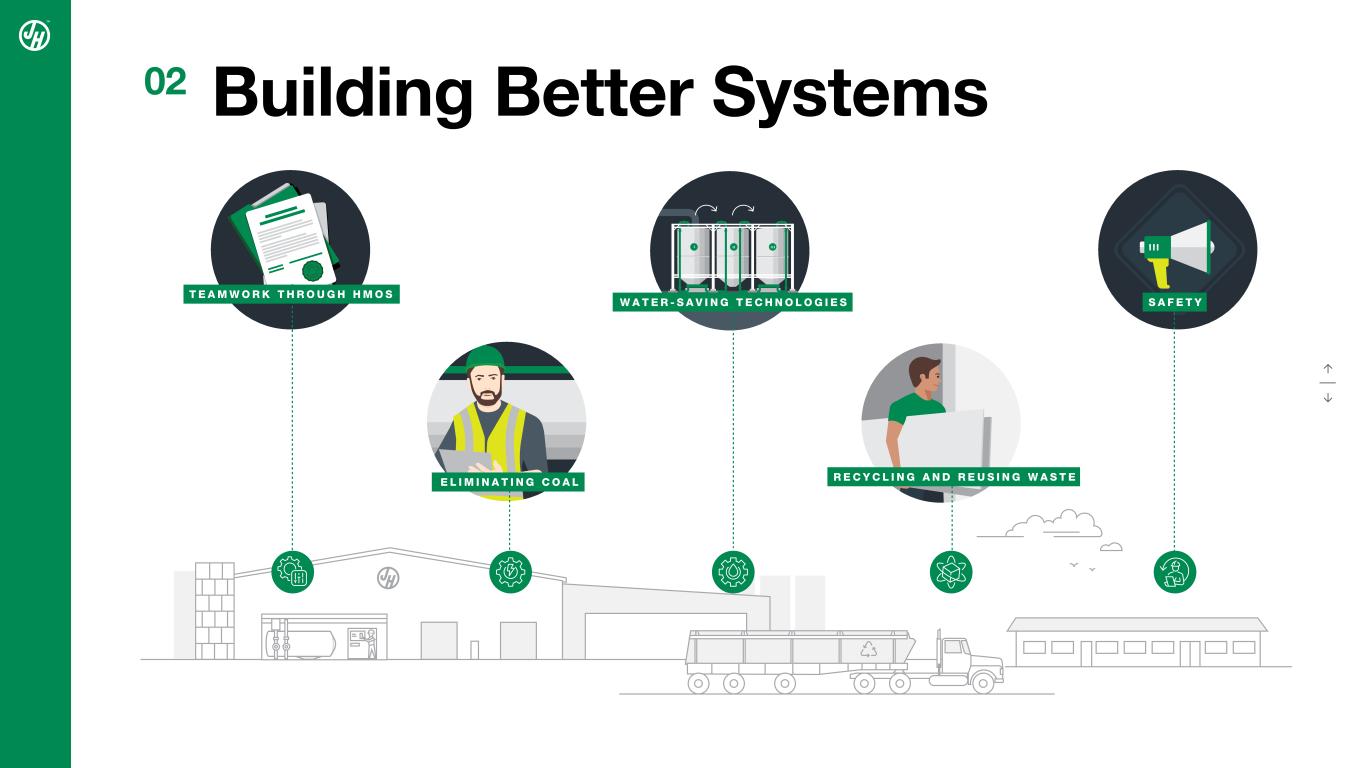
02 Building Better Systems 111 111 R E C Y C L I N G A N D R E U S I N G W A S T EE L I M I N A T I N G C O A L T E A M W O R K T H R O U G H H M O S W A T E R - S A V I N G T E C H N O L O G I E S S A F E T Y ↑ ↓
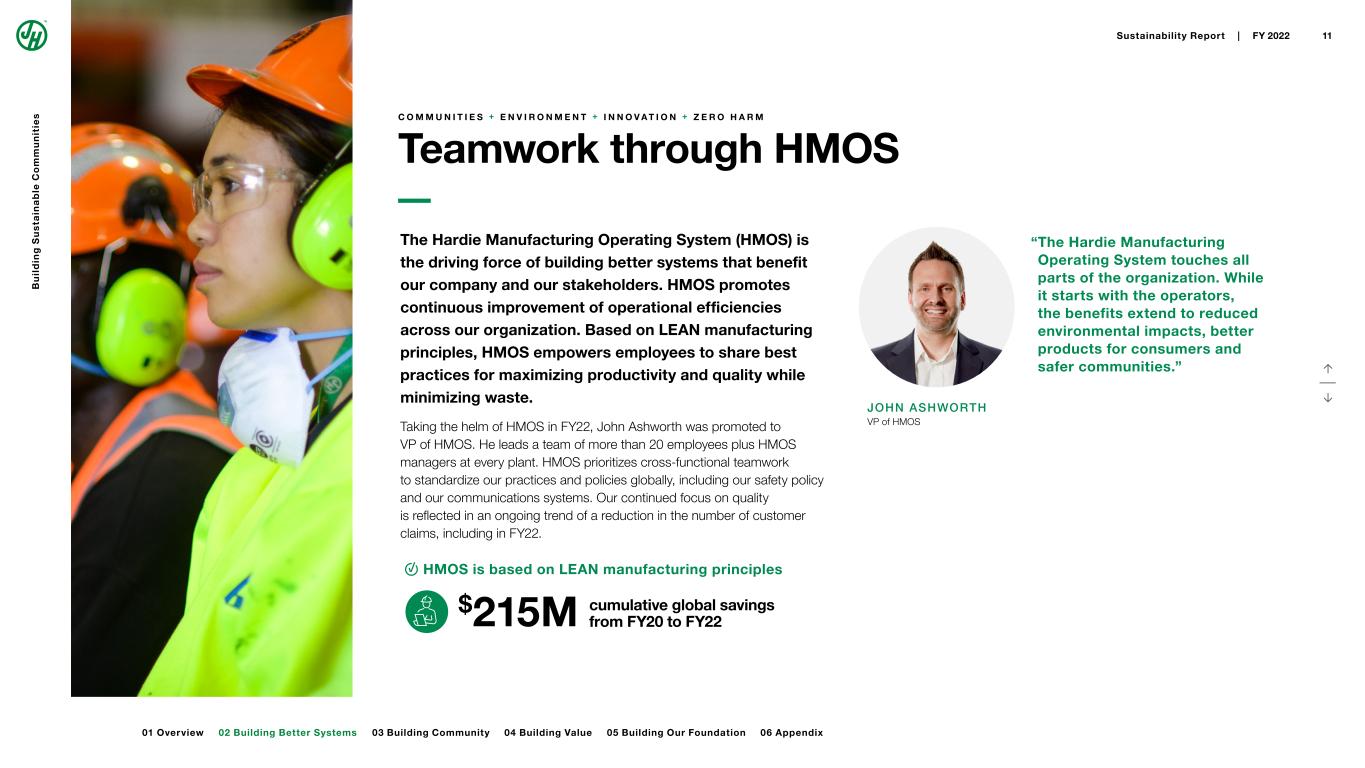
↑ ↓ C O M M U N I T I E S + E N V I R O N M E N T + I N N O V A T I O N + Z E R O H A R M Teamwork through HMOS JOHN ASHWORTH VP of HMOS “ The Hardie Manufacturing Operating System touches all parts of the organization. While it starts with the operators, the benefits extend to reduced environmental impacts, better products for consumers and safer communities.” $ 215M cumulative global savings from FY20 to FY22 HMOS is based on LEAN manufacturing principles The Hardie Manufacturing Operating System (HMOS) is the driving force of building better systems that benefit our company and our stakeholders. HMOS promotes continuous improvement of operational efficiencies across our organization. Based on LEAN manufacturing principles, HMOS empowers employees to share best practices for maximizing productivity and quality while minimizing waste. Taking the helm of HMOS in FY22, John Ashworth was promoted to VP of HMOS. He leads a team of more than 20 employees plus HMOS managers at every plant. HMOS prioritizes cross-functional teamwork to standardize our practices and policies globally, including our safety policy and our communications systems. Our continued focus on quality is reflected in an ongoing trend of a reduction in the number of customer claims, including in FY22. B u il d in g S u s ta in a b le C o m m u n it ie s 02 Building Better Systems01 Overview Sustainability Report | FY 2022 11 03 Building Community 04 Building Value 05 Building Our Foundation 06 Appendix
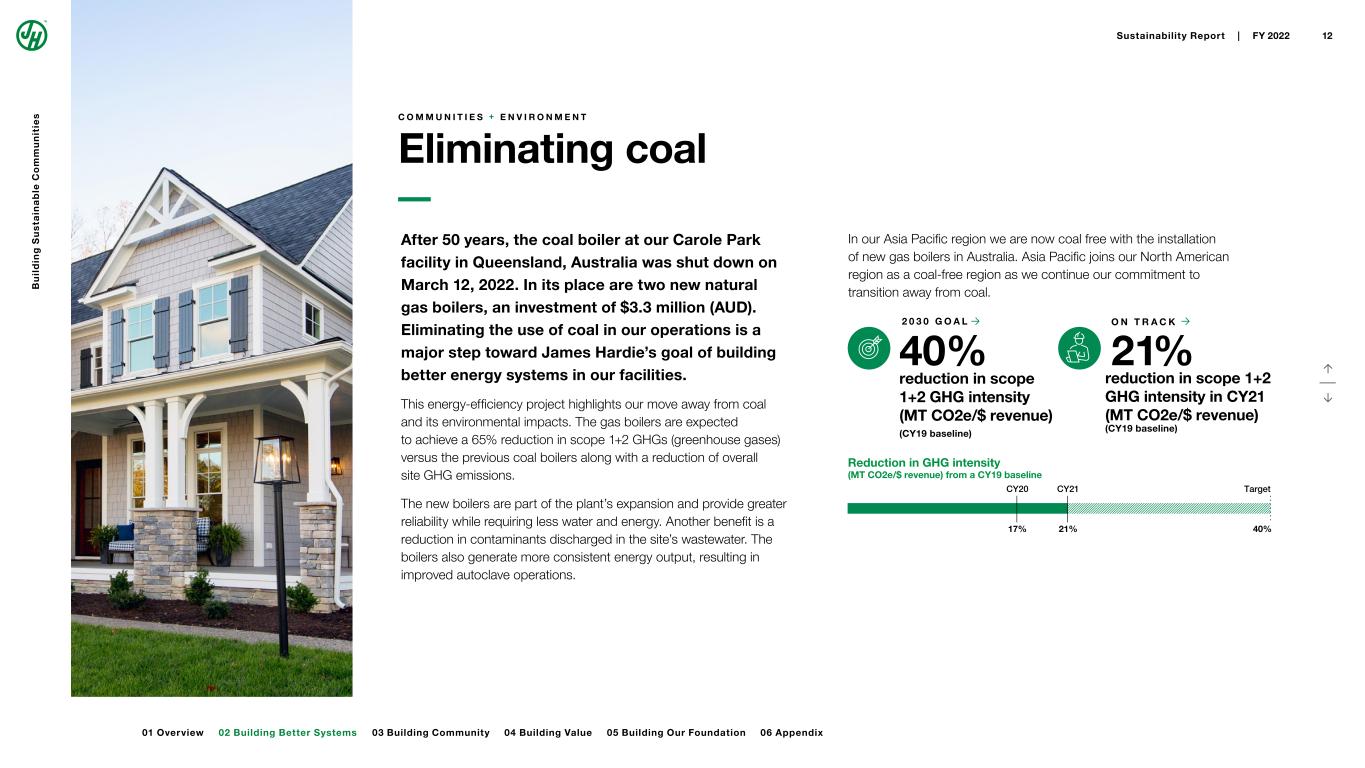
40% reduction in scope 1+2 GHG intensity (MT CO2e/$ revenue) (CY19 baseline) O N T R A C K →→ 21% reduction in scope 1+2 GHG intensity in CY21 (MT CO2e/$ revenue) (CY19 baseline) 2 0 3 0 G O A L Reduction in GHG intensity (MT CO2e/$ revenue) from a CY19 baseline TargetCY20 CY21 40%17% 21% ↑ ↓ C O M M U N I T I E S + E N V I R O N M E N T Eliminating coal After 50 years, the coal boiler at our Carole Park facility in Queensland, Australia was shut down on March 12, 2022. In its place are two new natural gas boilers, an investment of $3.3 million (AUD). Eliminating the use of coal in our operations is a major step toward James Hardie’s goal of building better energy systems in our facilities. This energy-efficiency project highlights our move away from coal and its environmental impacts. The gas boilers are expected to achieve a 65% reduction in scope 1+2 GHGs (greenhouse gases) versus the previous coal boilers along with a reduction of overall site GHG emissions. The new boilers are part of the plant’s expansion and provide greater reliability while requiring less water and energy. Another benefit is a reduction in contaminants discharged in the site’s wastewater. The boilers also generate more consistent energy output, resulting in improved autoclave operations. In our Asia Pacific region we are now coal free with the installation of new gas boilers in Australia. Asia Pacific joins our North American region as a coal-free region as we continue our commitment to transition away from coal. B u il d in g S u s ta in a b le C o m m u n it ie s 02 Building Better Systems01 Overview Sustainability Report | FY 2022 12 03 Building Community 04 Building Value 05 Building Our Foundation 06 Appendix
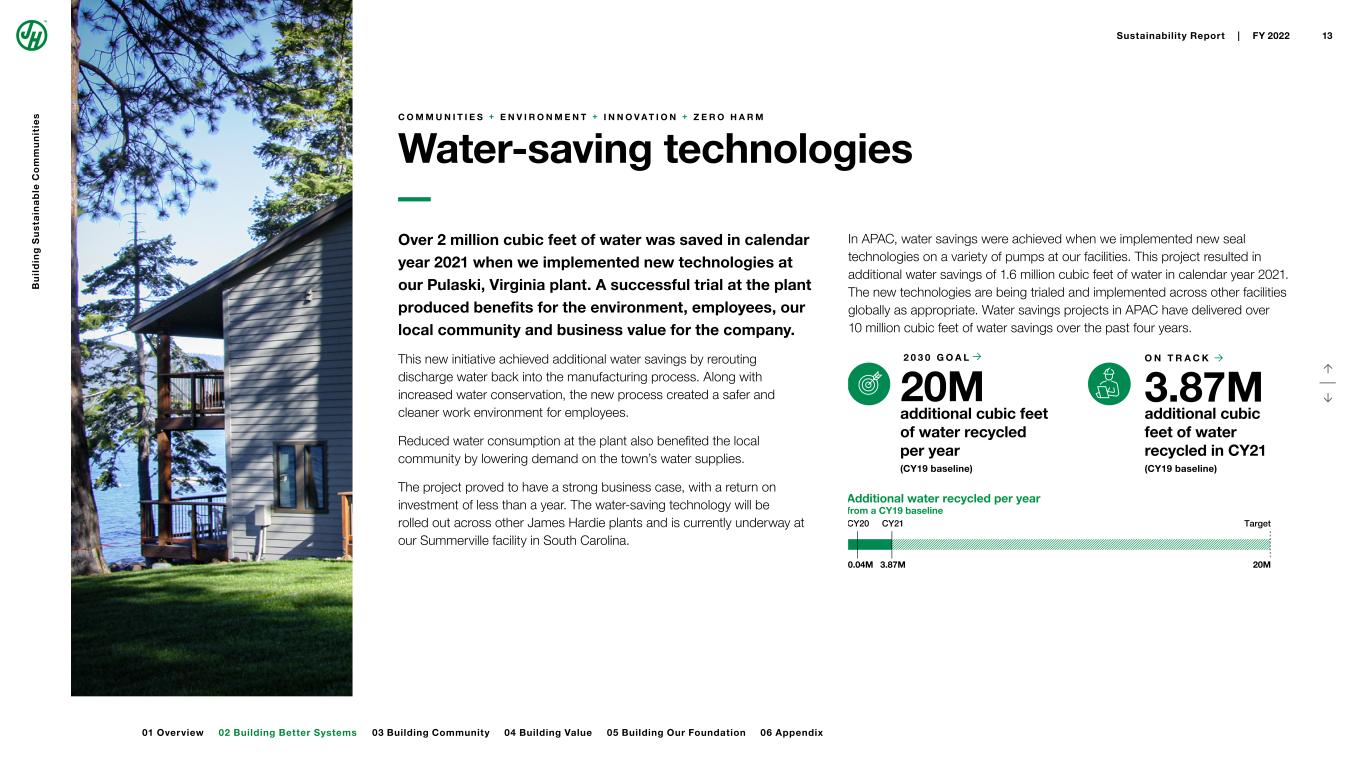
↑ ↓ C O M M U N I T I E S + E N V I R O N M E N T + I N N O V A T I O N + Z E R O H A R M Water-saving technologies In APAC, water savings were achieved when we implemented new seal technologies on a variety of pumps at our facilities. This project resulted in additional water savings of 1.6 million cubic feet of water in calendar year 2021. The new technologies are being trialed and implemented across other facilities globally as appropriate. Water savings projects in APAC have delivered over 10 million cubic feet of water savings over the past four years. 20M → O N T R A C K 3.87M additional cubic feet of water recycled in CY21 (CY19 baseline) →2 0 3 0 G O A L additional cubic feet of water recycled per year (CY19 baseline) Additional water recycled per year from a CY19 baseline CY20 CY21 20M Target 3.87M 0.04M Over 2 million cubic feet of water was saved in calendar year 2021 when we implemented new technologies at our Pulaski, Virginia plant. A successful trial at the plant produced benefits for the environment, employees, our local community and business value for the company. This new initiative achieved additional water savings by rerouting discharge water back into the manufacturing process. Along with increased water conservation, the new process created a safer and cleaner work environment for employees. Reduced water consumption at the plant also benefited the local community by lowering demand on the town’s water supplies. The project proved to have a strong business case, with a return on investment of less than a year. The water-saving technology will be rolled out across other James Hardie plants and is currently underway at our Summerville facility in South Carolina. B u il d in g S u s ta in a b le C o m m u n it ie s 02 Building Better Systems01 Overview Sustainability Report | FY 2022 13 03 Building Community 04 Building Value 05 Building Our Foundation 06 Appendix
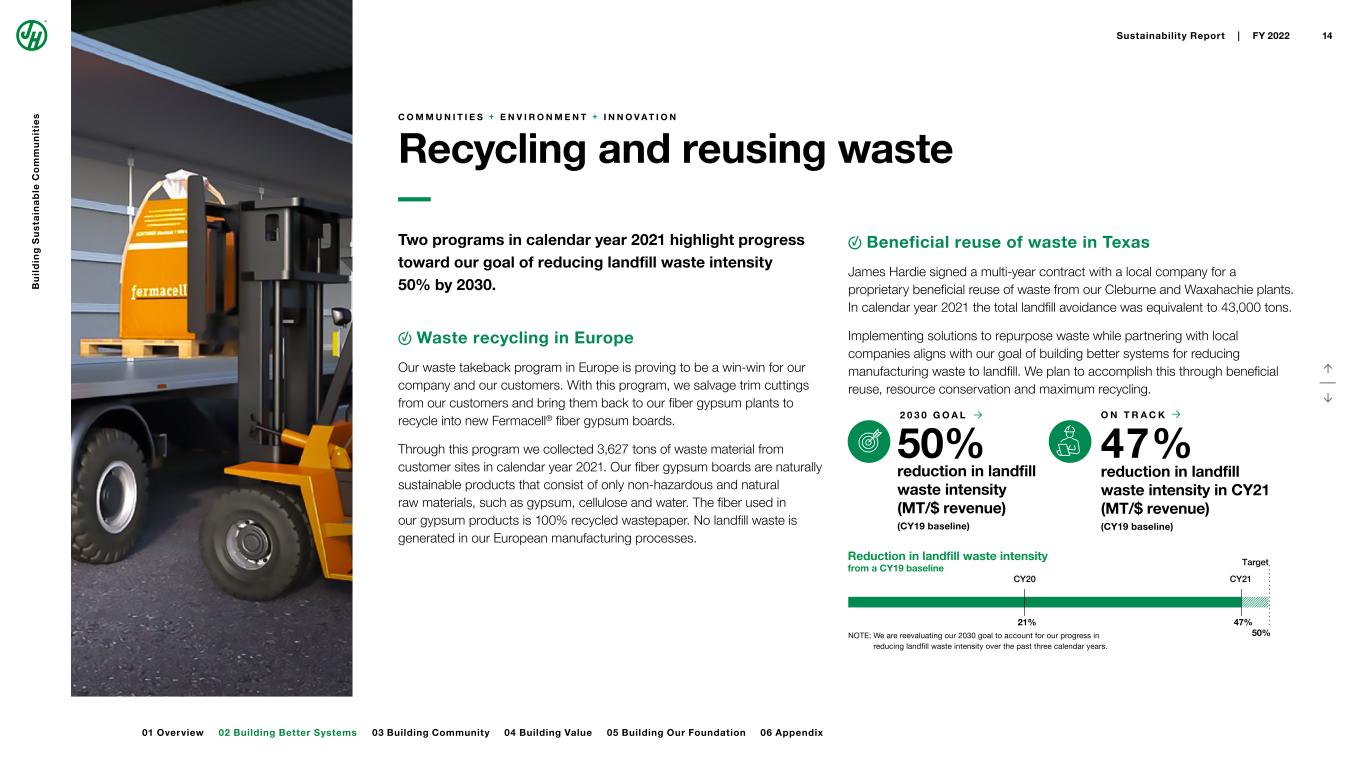
↑ ↓ C O M M U N I T I E S + E N V I R O N M E N T + I N N O V A T I O N Recycling and reusing waste → O N T R A C K → 47% reduction in landfill waste intensity in CY21 (MT/$ revenue) (CY19 baseline) 50% reduction in landfill waste intensity (MT/$ revenue) (CY19 baseline) 2 0 3 0 G O A L Reduction in landfill waste intensity from a CY19 baseline Target CY20 CY21 50% 47%21% Beneficial reuse of waste in Texas James Hardie signed a multi-year contract with a local company for a proprietary beneficial reuse of waste from our Cleburne and Waxahachie plants. In calendar year 2021 the total landfill avoidance was equivalent to 43,000 tons. Implementing solutions to repurpose waste while partnering with local companies aligns with our goal of building better systems for reducing manufacturing waste to landfill. We plan to accomplish this through beneficial reuse, resource conservation and maximum recycling. NOTE: We are reevaluating our 2030 goal to account for our progress in reducing landfill waste intensity over the past three calendar years. Two programs in calendar year 2021 highlight progress toward our goal of reducing landfill waste intensity 50% by 2030. Waste recycling in Europe Our waste takeback program in Europe is proving to be a win-win for our company and our customers. With this program, we salvage trim cuttings from our customers and bring them back to our fiber gypsum plants to recycle into new Fermacell® fiber gypsum boards. Through this program we collected 3,627 tons of waste material from customer sites in calendar year 2021. Our fiber gypsum boards are naturally sustainable products that consist of only non-hazardous and natural raw materials, such as gypsum, cellulose and water. The fiber used in our gypsum products is 100% recycled wastepaper. No landfill waste is generated in our European manufacturing processes. B u il d in g S u s ta in a b le C o m m u n it ie s 02 Building Better Systems01 Overview Sustainability Report | FY 2022 14 03 Building Community 04 Building Value 05 Building Our Foundation 06 Appendix
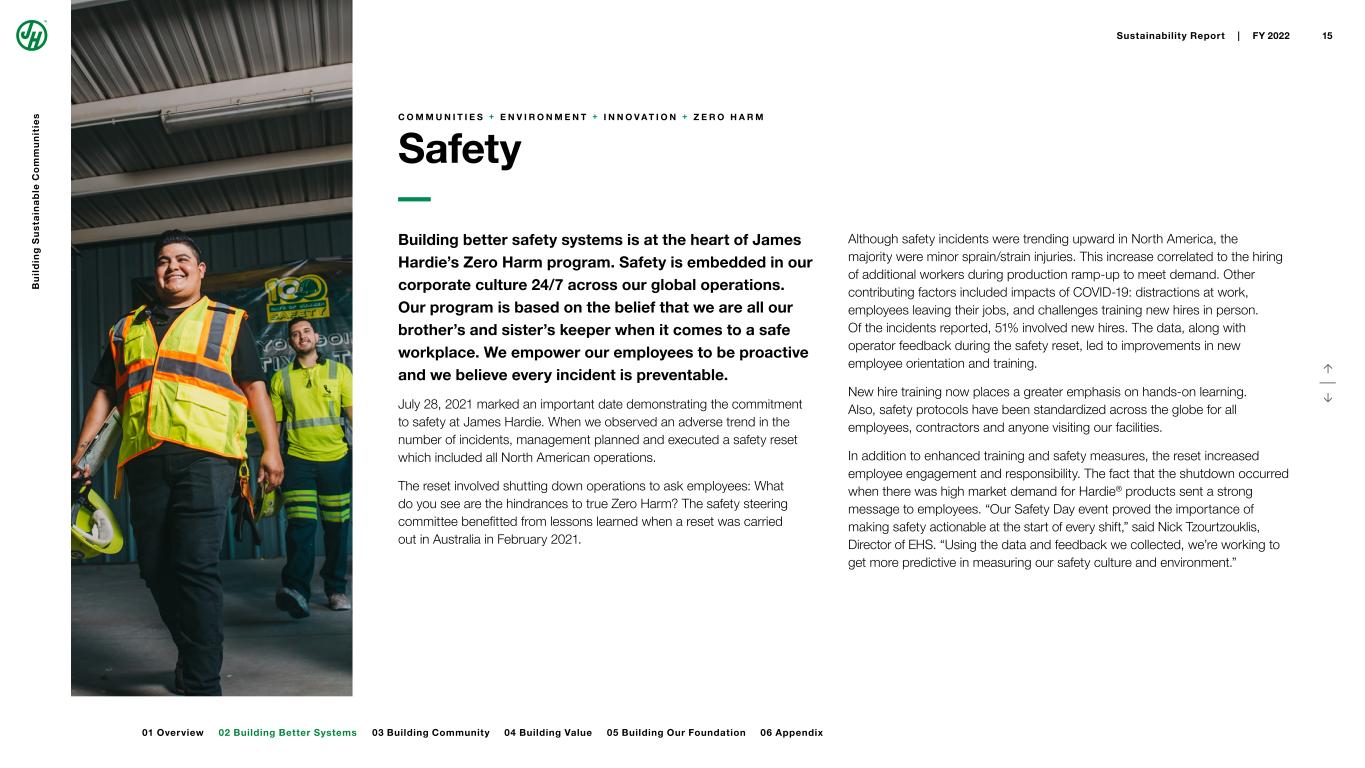
↑ ↓ C O M M U N I T I E S + E N V I R O N M E N T + I N N O V A T I O N + Z E R O H A R M Safety Although safety incidents were trending upward in North America, the majority were minor sprain/strain injuries. This increase correlated to the hiring of additional workers during production ramp-up to meet demand. Other contributing factors included impacts of COVID-19: distractions at work, employees leaving their jobs, and challenges training new hires in person. Of the incidents reported, 51% involved new hires. The data, along with operator feedback during the safety reset, led to improvements in new employee orientation and training. New hire training now places a greater emphasis on hands-on learning. Also, safety protocols have been standardized across the globe for all employees, contractors and anyone visiting our facilities. In addition to enhanced training and safety measures, the reset increased employee engagement and responsibility. The fact that the shutdown occurred when there was high market demand for Hardie® products sent a strong message to employees. “Our Safety Day event proved the importance of making safety actionable at the start of every shift,” said Nick Tzourtzouklis, Director of EHS. “Using the data and feedback we collected, we’re working to get more predictive in measuring our safety culture and environment.” Building better safety systems is at the heart of James Hardie’s Zero Harm program. Safety is embedded in our corporate culture 24/7 across our global operations. Our program is based on the belief that we are all our brother’s and sister’s keeper when it comes to a safe workplace. We empower our employees to be proactive and we believe every incident is preventable. July 28, 2021 marked an important date demonstrating the commitment to safety at James Hardie. When we observed an adverse trend in the number of incidents, management planned and executed a safety reset which included all North American operations. The reset involved shutting down operations to ask employees: What do you see are the hindrances to true Zero Harm? The safety steering committee benefitted from lessons learned when a reset was carried out in Australia in February 2021. B u il d in g S u s ta in a b le C o m m u n it ie s 02 Building Better Systems01 Overview Sustainability Report | FY 2022 15 03 Building Community 04 Building Value 05 Building Our Foundation 06 Appendix
03 Building Community E M P O W E R I N G O U R E M P L O Y E E S I N C L U S I O N A N D D I V E R S I T Y B E N E F I T I N G O U R L O C A L C O M M U N I T I E S ↑ ↓
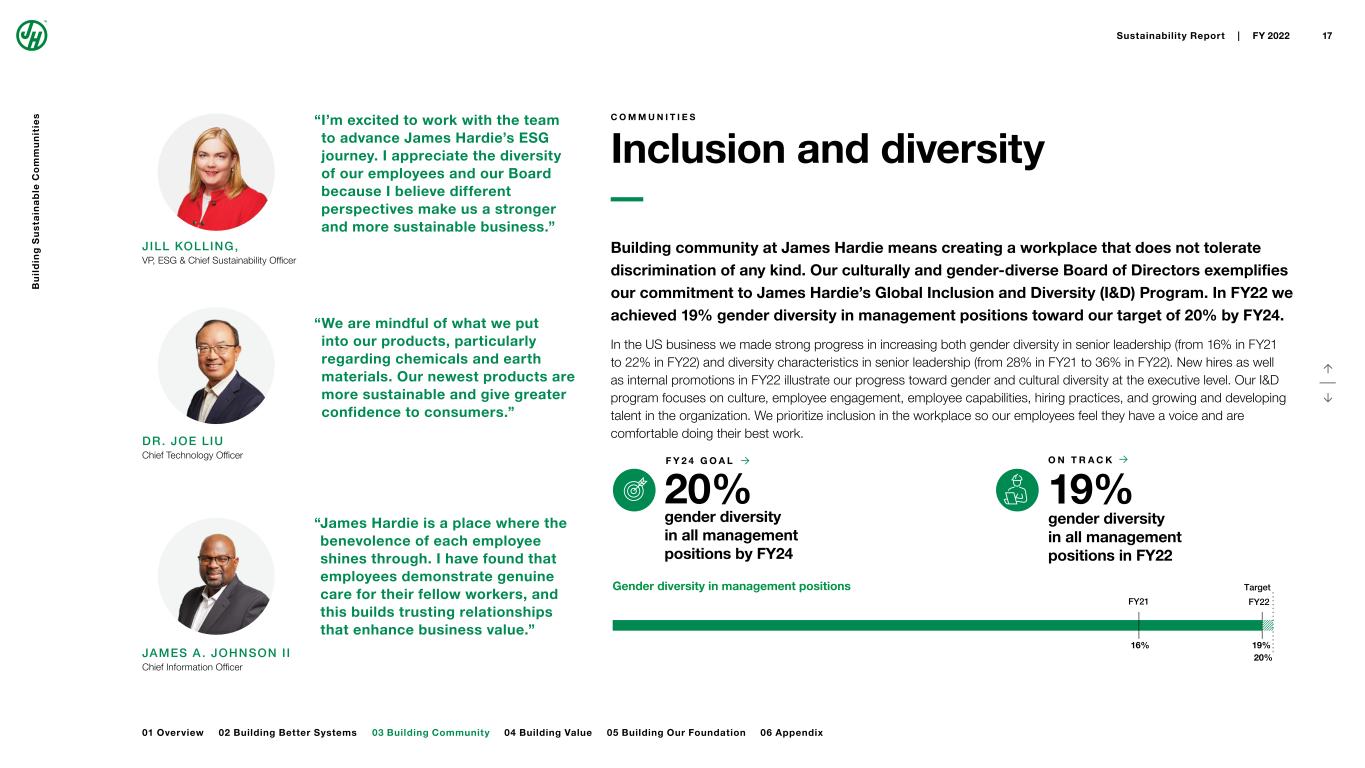
↑ ↓ C O M M U N I T I E S Inclusion and diversity Building community at James Hardie means creating a workplace that does not tolerate discrimination of any kind. Our culturally and gender-diverse Board of Directors exemplifies our commitment to James Hardie’s Global Inclusion and Diversity (I&D) Program. In FY22 we achieved 19% gender diversity in management positions toward our target of 20% by FY24. In the US business we made strong progress in increasing both gender diversity in senior leadership (from 16% in FY21 to 22% in FY22) and diversity characteristics in senior leadership (from 28% in FY21 to 36% in FY22). New hires as well as internal promotions in FY22 illustrate our progress toward gender and cultural diversity at the executive level. Our I&D program focuses on culture, employee engagement, employee capabilities, hiring practices, and growing and developing talent in the organization. We prioritize inclusion in the workplace so our employees feel they have a voice and are comfortable doing their best work. JILL KOLLING, VP, ESG & Chief Sustainability Officer “ We are mindful of what we put into our products, particularly regarding chemicals and earth materials. Our newest products are more sustainable and give greater confidence to consumers.” DR. JOE LIU Chief Technology Officer “ I’m excited to work with the team to advance James Hardie’s ESG journey. I appreciate the diversity of our employees and our Board because I believe different perspectives make us a stronger and more sustainable business.” JAMES A . JOHNSON I I Chief Information Officer “ James Hardie is a place where the benevolence of each employee shines through. I have found that employees demonstrate genuine care for their fellow workers, and this builds trusting relationships that enhance business value.” → O N T R A C K → 19% gender diversity in all management positions in FY22 Gender diversity in management positions 20% gender diversity in all management positions by FY24 F Y 2 4 G O A L Target FY22 20% 19% FY21 16% B u il d in g S u s ta in a b le C o m m u n it ie s 02 Building Better Systems 03 Building Community Sustainability Report | FY 2022 17 01 Overview 04 Building Value 05 Building Our Foundation 06 Appendix
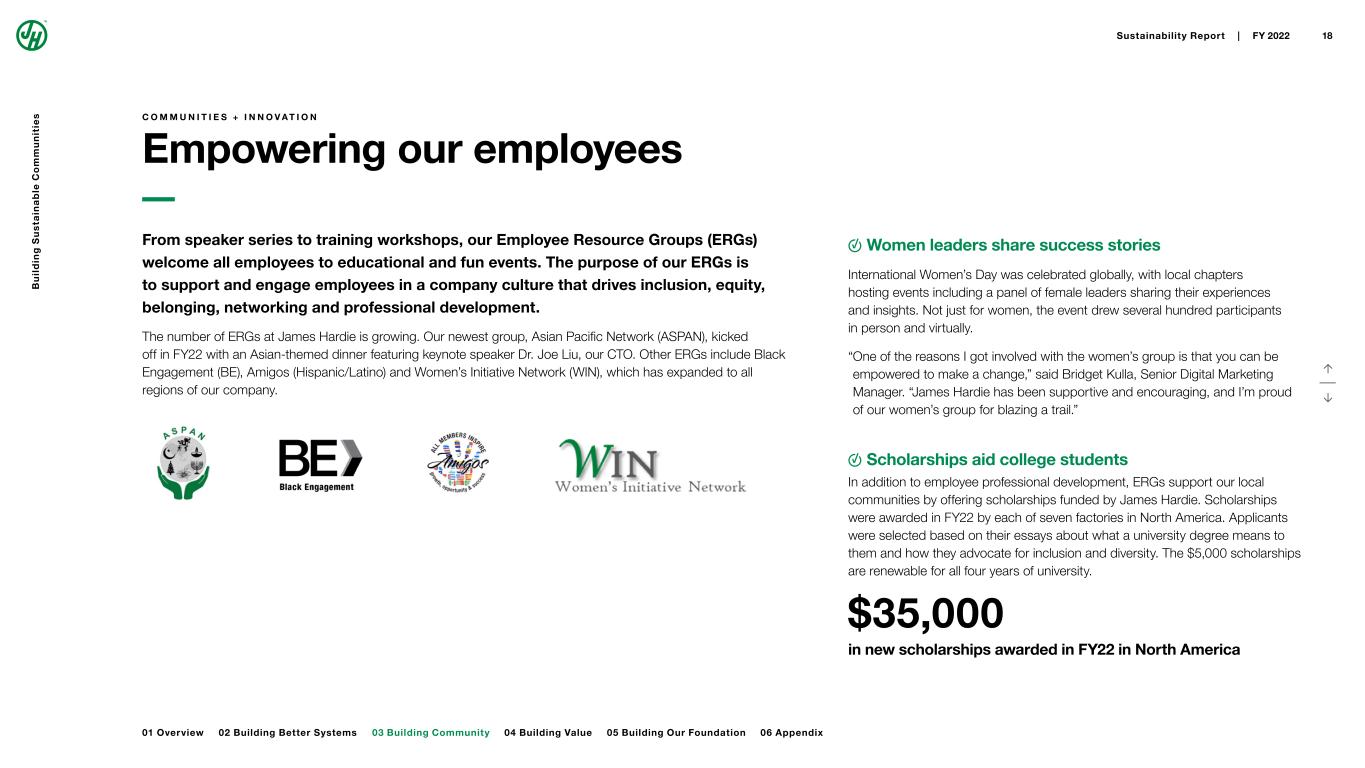
↑ ↓ C O M M U N I T I E S + I N N O V A T I O N Empowering our employees Women leaders share success stories International Women’s Day was celebrated globally, with local chapters hosting events including a panel of female leaders sharing their experiences and insights. Not just for women, the event drew several hundred participants in person and virtually. “ One of the reasons I got involved with the women’s group is that you can be empowered to make a change,” said Bridget Kulla, Senior Digital Marketing Manager. “James Hardie has been supportive and encouraging, and I’m proud of our women’s group for blazing a trail.” Scholarships aid college students In addition to employee professional development, ERGs support our local communities by offering scholarships funded by James Hardie. Scholarships were awarded in FY22 by each of seven factories in North America. Applicants were selected based on their essays about what a university degree means to them and how they advocate for inclusion and diversity. The $5,000 scholarships are renewable for all four years of university. $35,000 in new scholarships awarded in FY22 in North America From speaker series to training workshops, our Employee Resource Groups (ERGs) welcome all employees to educational and fun events. The purpose of our ERGs is to support and engage employees in a company culture that drives inclusion, equity, belonging, networking and professional development. The number of ERGs at James Hardie is growing. Our newest group, Asian Pacific Network (ASPAN), kicked off in FY22 with an Asian-themed dinner featuring keynote speaker Dr. Joe Liu, our CTO. Other ERGs include Black Engagement (BE), Amigos (Hispanic/Latino) and Women’s Initiative Network (WIN), which has expanded to all regions of our company. B u il d in g S u s ta in a b le C o m m u n it ie s 02 Building Better Systems 03 Building Community Sustainability Report | FY 2022 18 01 Overview 04 Building Value 05 Building Our Foundation 06 Appendix
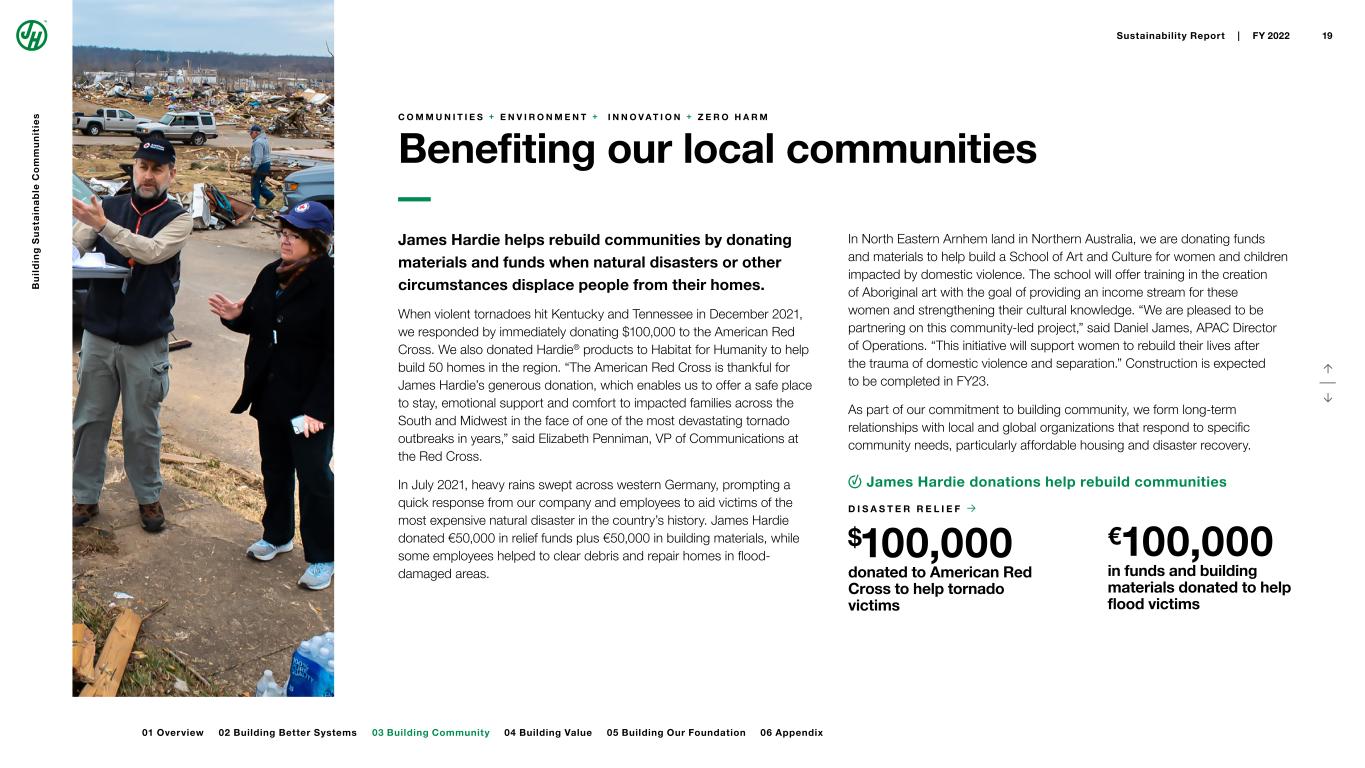
↑ ↓ C O M M U N I T I E S + E N V I R O N M E N T + I N N O V A T I O N + Z E R O H A R M Benefiting our local communities In North Eastern Arnhem land in Northern Australia, we are donating funds and materials to help build a School of Art and Culture for women and children impacted by domestic violence. The school will offer training in the creation of Aboriginal art with the goal of providing an income stream for these women and strengthening their cultural knowledge. “We are pleased to be partnering on this community-led project,” said Daniel James, APAC Director of Operations. “This initiative will support women to rebuild their lives after the trauma of domestic violence and separation.” Construction is expected to be completed in FY23. As part of our commitment to building community, we form long-term relationships with local and global organizations that respond to specific community needs, particularly affordable housing and disaster recovery. James Hardie donations help rebuild communities D I S A S T E R R E L I E F → $100,000 donated to American Red Cross to help tornado victims €100,000 in funds and building materials donated to help flood victims James Hardie helps rebuild communities by donating materials and funds when natural disasters or other circumstances displace people from their homes. When violent tornadoes hit Kentucky and Tennessee in December 2021, we responded by immediately donating $100,000 to the American Red Cross. We also donated Hardie® products to Habitat for Humanity to help build 50 homes in the region. “The American Red Cross is thankful for James Hardie’s generous donation, which enables us to offer a safe place to stay, emotional support and comfort to impacted families across the South and Midwest in the face of one of the most devastating tornado outbreaks in years,” said Elizabeth Penniman, VP of Communications at the Red Cross. In July 2021, heavy rains swept across western Germany, prompting a quick response from our company and employees to aid victims of the most expensive natural disaster in the country’s history. James Hardie donated €50,000 in relief funds plus €50,000 in building materials, while some employees helped to clear debris and repair homes in flood- damaged areas. B u il d in g S u s ta in a b le C o m m u n it ie s 02 Building Better Systems 03 Building Community Sustainability Report | FY 2022 19 01 Overview 04 Building Value 05 Building Our Foundation 06 Appendix
04 Building Value $ I M P A C T I N G O U R L O C A L E C O N O M I E S C O N S U M E R F E E D B A C K D R I V E S I N N O V A T I O N O U R P R O D U C T L I F E C Y C L E ↑ ↓
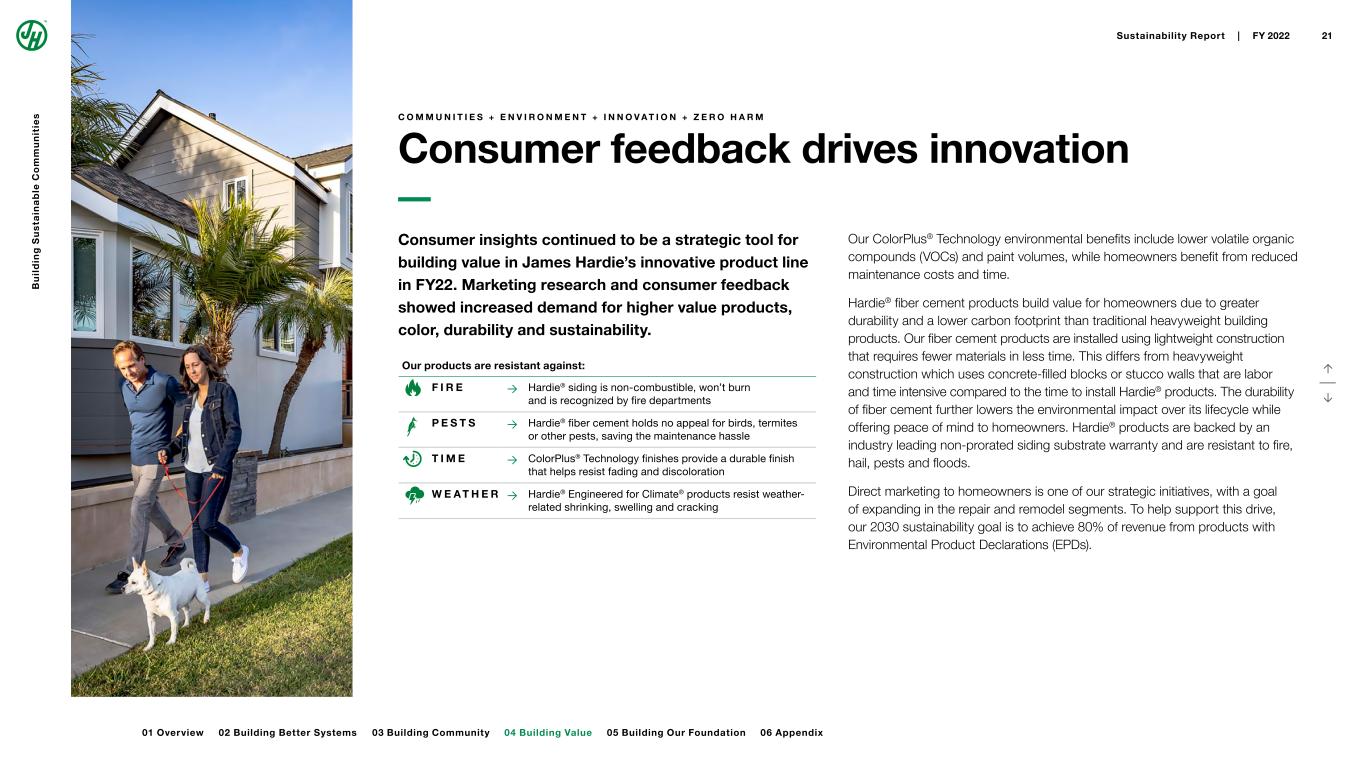
↑ ↓ Our products are resistant against: F I R E → Hardie® siding is non-combustible, won’t burn and is recognized by fire departments P E S T S → Hardie® fiber cement holds no appeal for birds, termites or other pests, saving the maintenance hassle T I M E → ColorPlus® Technology finishes provide a durable finish that helps resist fading and discoloration W E A T H E R → Hardie® Engineered for Climate® products resist weather- related shrinking, swelling and cracking C O M M U N I T I E S + E N V I R O N M E N T + I N N O V A T I O N + Z E R O H A R M Consumer feedback drives innovation Our ColorPlus® Technology environmental benefits include lower volatile organic compounds (VOCs) and paint volumes, while homeowners benefit from reduced maintenance costs and time. Hardie® fiber cement products build value for homeowners due to greater durability and a lower carbon footprint than traditional heavyweight building products. Our fiber cement products are installed using lightweight construction that requires fewer materials in less time. This differs from heavyweight construction which uses concrete-filled blocks or stucco walls that are labor and time intensive compared to the time to install Hardie® products. The durability of fiber cement further lowers the environmental impact over its lifecycle while offering peace of mind to homeowners. Hardie® products are backed by an industry leading non-prorated siding substrate warranty and are resistant to fire, hail, pests and floods. Direct marketing to homeowners is one of our strategic initiatives, with a goal of expanding in the repair and remodel segments. To help support this drive, our 2030 sustainability goal is to achieve 80% of revenue from products with Environmental Product Declarations (EPDs). Consumer insights continued to be a strategic tool for building value in James Hardie’s innovative product line in FY22. Marketing research and consumer feedback showed increased demand for higher value products, color, durability and sustainability. B u il d in g S u s ta in a b le C o m m u n it ie s 03 Building Community 04 Building Value Sustainability Report | FY 2022 21 01 Overview 02 Building Better Systems 06 Appendix05 Building Our Foundation
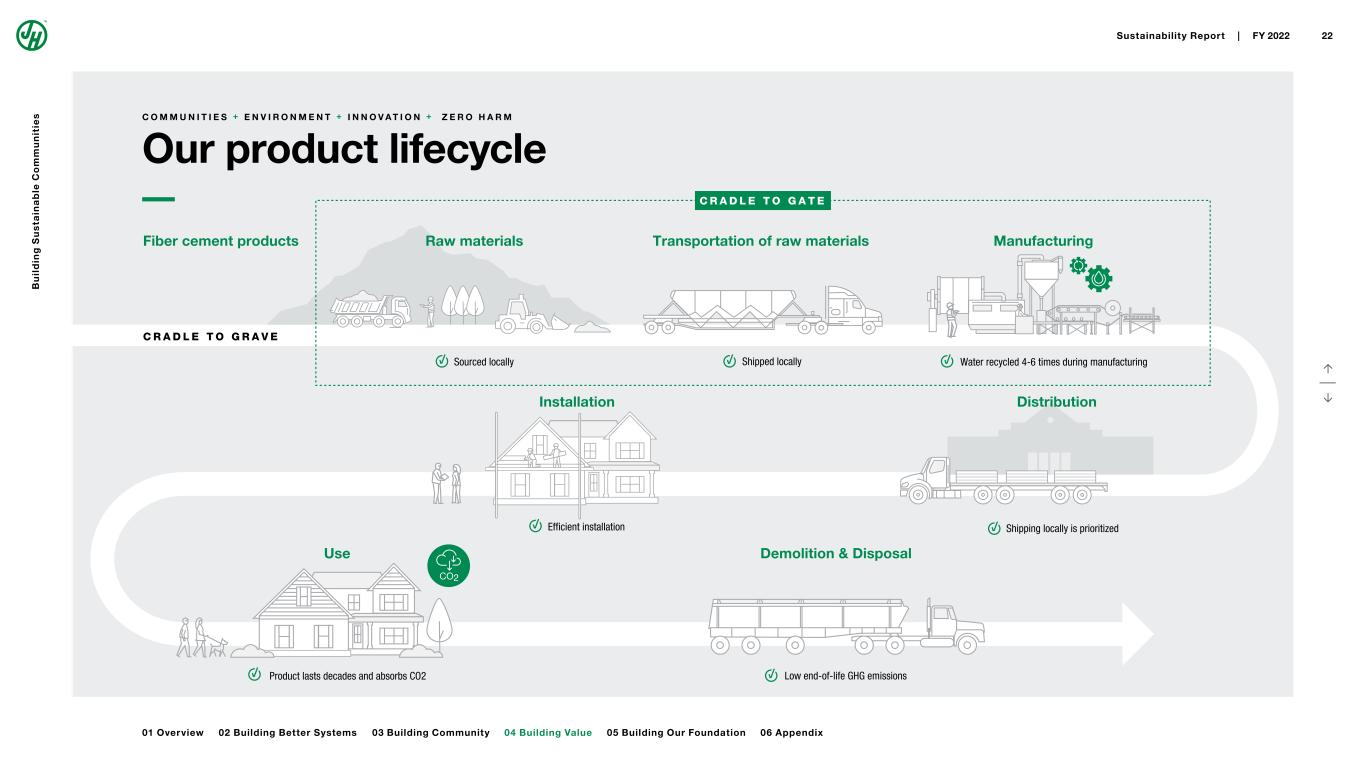
Distribution Use Installation Transportation of raw materials Manufacturing C R A D L E T O G R A V E C R A D L E T O G A T E Raw materials Sourced locally Efficient installation Low end-of-life GHG emissionsProduct lasts decades and absorbs CO2 Shipped locally Water recycled 4-6 times during manufacturing Demolition & Disposal Shipping locally is prioritized Fiber cement products CO2 ↑ ↓ C O M M U N I T I E S + E N V I R O N M E N T + I N N O V A T I O N + Z E R O H A R M Our product lifecycle B u il d in g S u s ta in a b le C o m m u n it ie s 03 Building Community 04 Building Value Sustainability Report | FY 2022 22 01 Overview 02 Building Better Systems 06 Appendix05 Building Our Foundation
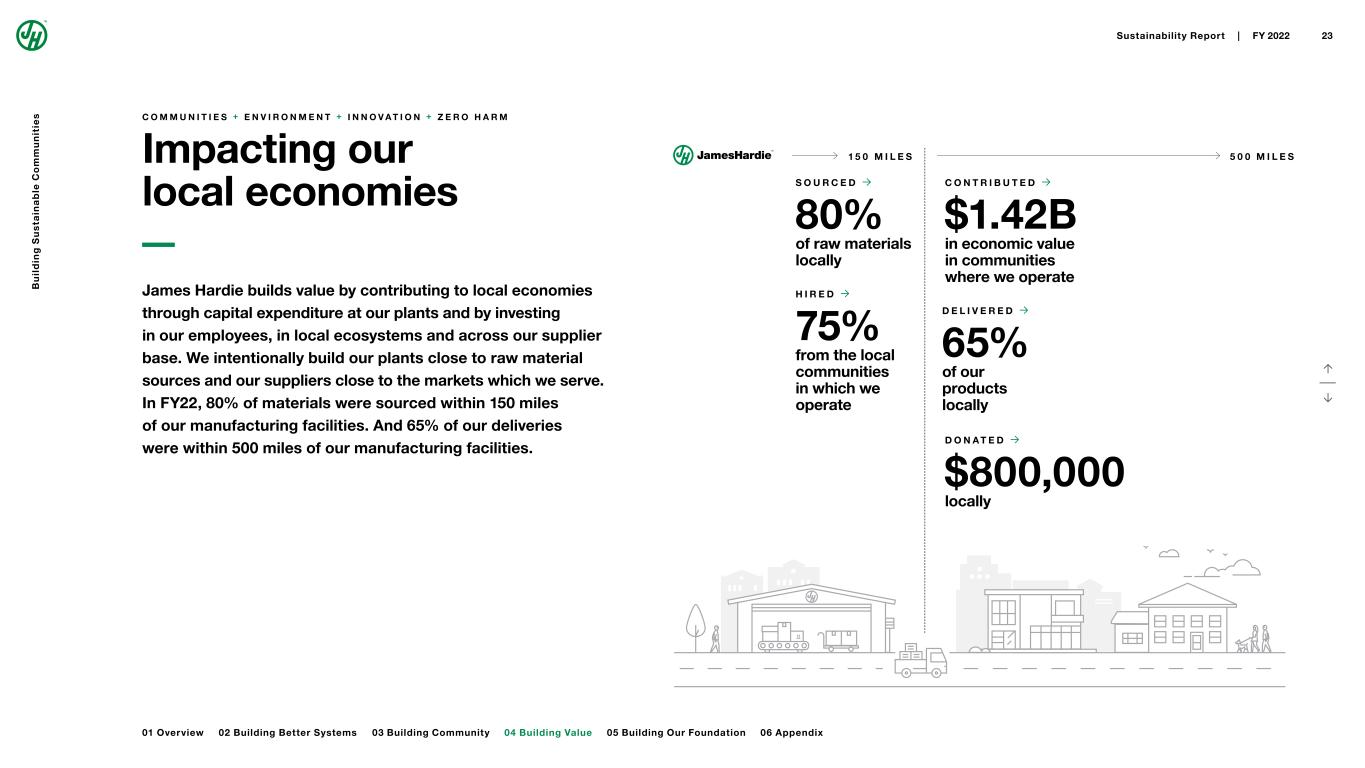
↑ ↓ C O M M U N I T I E S + E N V I R O N M E N T + I N N O V A T I O N + Z E R O H A R M Impacting our local economies James Hardie builds value by contributing to local economies through capital expenditure at our plants and by investing in our employees, in local ecosystems and across our supplier base. We intentionally build our plants close to raw material sources and our suppliers close to the markets which we serve. In FY22, 80% of materials were sourced within 150 miles of our manufacturing facilities. And 65% of our deliveries were within 500 miles of our manufacturing facilities. C O N T R I B U T E D → $1.42B in economic value in communities where we operate D E L I V E R E D → 65% of our products locally D O N A T E D → $800,000 locally 1 5 0 M I L E S 5 0 0 M I L E S H I R E D → 75% from the local communities in which we operate S O U R C E D → 80% of raw materials locally B u il d in g S u s ta in a b le C o m m u n it ie s 03 Building Community 04 Building Value Sustainability Report | FY 2022 23 01 Overview 02 Building Better Systems 06 Appendix05 Building Our Foundation
05 Building Our Foundation C L I M A T E D I S C L O S U R E U P D A T E O U R S T A K E H O L D E R S A N D M A T E R I A L T O P I C S M A N A G E M E N T A P P R O A C H G O V E R N A N C E A N D E T H I C S ↑ ↓
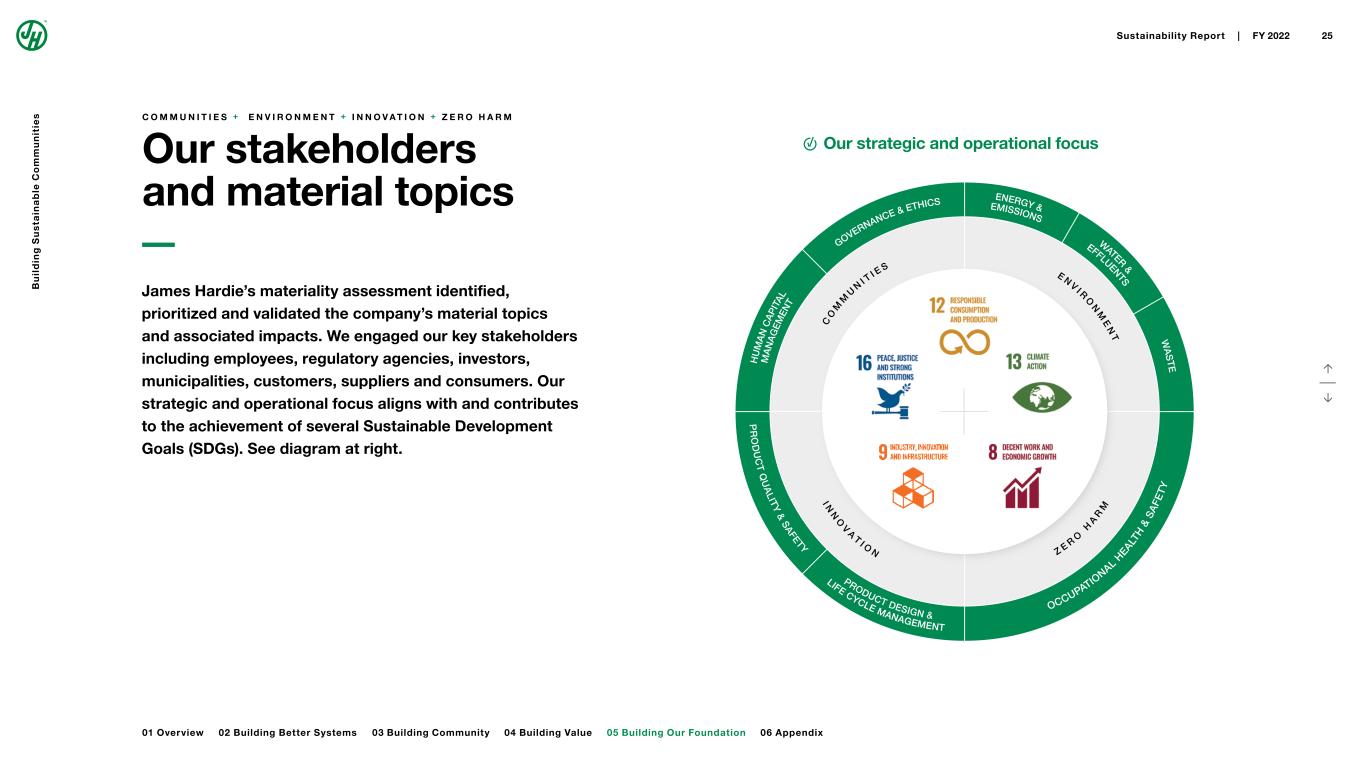
↑ ↓ C O M M U N I T I E S + E N V I R O N M E N T + I N N O V A T I O N + Z E R O H A R M Our stakeholders and material topics James Hardie’s materiality assessment identified, prioritized and validated the company’s material topics and associated impacts. We engaged our key stakeholders including employees, regulatory agencies, investors, municipalities, customers, suppliers and consumers. Our strategic and operational focus aligns with and contributes to the achievement of several Sustainable Development Goals (SDGs). See diagram at right. OCCUPATIO NAL H EALT H & S A FE TY P R O D U C T Q U A LITY & SAFETY LIFE CYCLE MANAGEMENT PRODUCT DESIGN & W A S TE ENERGY & EMISSIONS W ATER & EFFLUENTS GOVERNANCE & ETHICS H U M A N C A P IT AL M A N A G EM EN T E N V I R O N M E N T I N N O V A T I O N C O M M U N I T I E S Z E R O H A R M Our strategic and operational focus B u il d in g S u s ta in a b le C o m m u n it ie s 05 Building Our Foundation Sustainability Report | FY 2022 25 01 Overview 02 Building Better Systems 03 Building Community 04 Building Value 06 Appendix
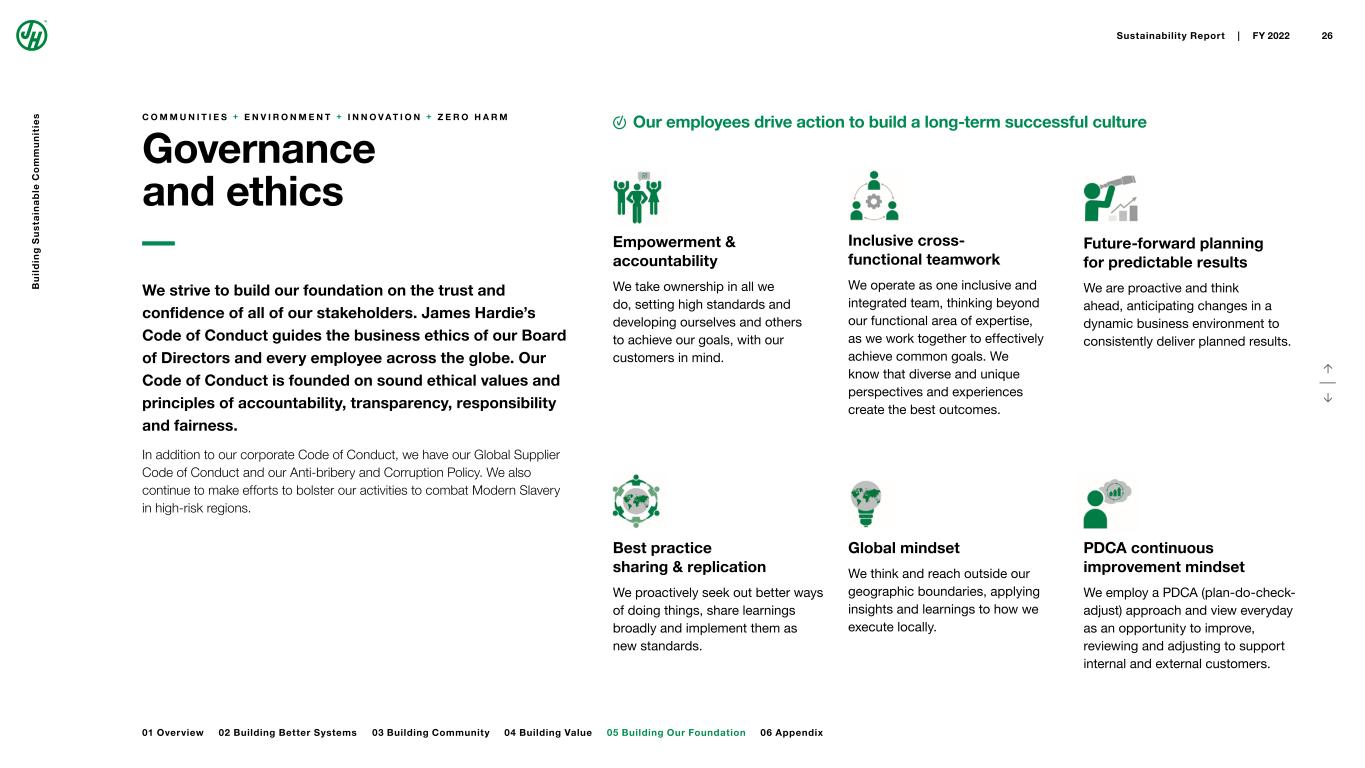
↑ ↓ C O M M U N I T I E S + E N V I R O N M E N T + I N N O V A T I O N + Z E R O H A R M Governance and ethics We strive to build our foundation on the trust and confidence of all of our stakeholders. James Hardie’s Code of Conduct guides the business ethics of our Board of Directors and every employee across the globe. Our Code of Conduct is founded on sound ethical values and principles of accountability, transparency, responsibility and fairness. In addition to our corporate Code of Conduct, we have our Global Supplier Code of Conduct and our Anti-bribery and Corruption Policy. We also continue to make efforts to bolster our activities to combat Modern Slavery in high-risk regions. Inclusive cross- functional teamwork We operate as one inclusive and integrated team, thinking beyond our functional area of expertise, as we work together to effectively achieve common goals. We know that diverse and unique perspectives and experiences create the best outcomes. Empowerment & accountability We take ownership in all we do, setting high standards and developing ourselves and others to achieve our goals, with our customers in mind. Our employees drive action to build a long-term successful culture Future-forward planning for predictable results We are proactive and think ahead, anticipating changes in a dynamic business environment to consistently deliver planned results. Best practice sharing & replication We proactively seek out better ways of doing things, share learnings broadly and implement them as new standards. Global mindset We think and reach outside our geographic boundaries, applying insights and learnings to how we execute locally. PDCA continuous improvement mindset We employ a PDCA (plan-do-check- adjust) approach and view everyday as an opportunity to improve, reviewing and adjusting to support internal and external customers. B u il d in g S u s ta in a b le C o m m u n it ie s 05 Building Our Foundation Sustainability Report | FY 2022 26 01 Overview 02 Building Better Systems 03 Building Community 04 Building Value 06 Appendix
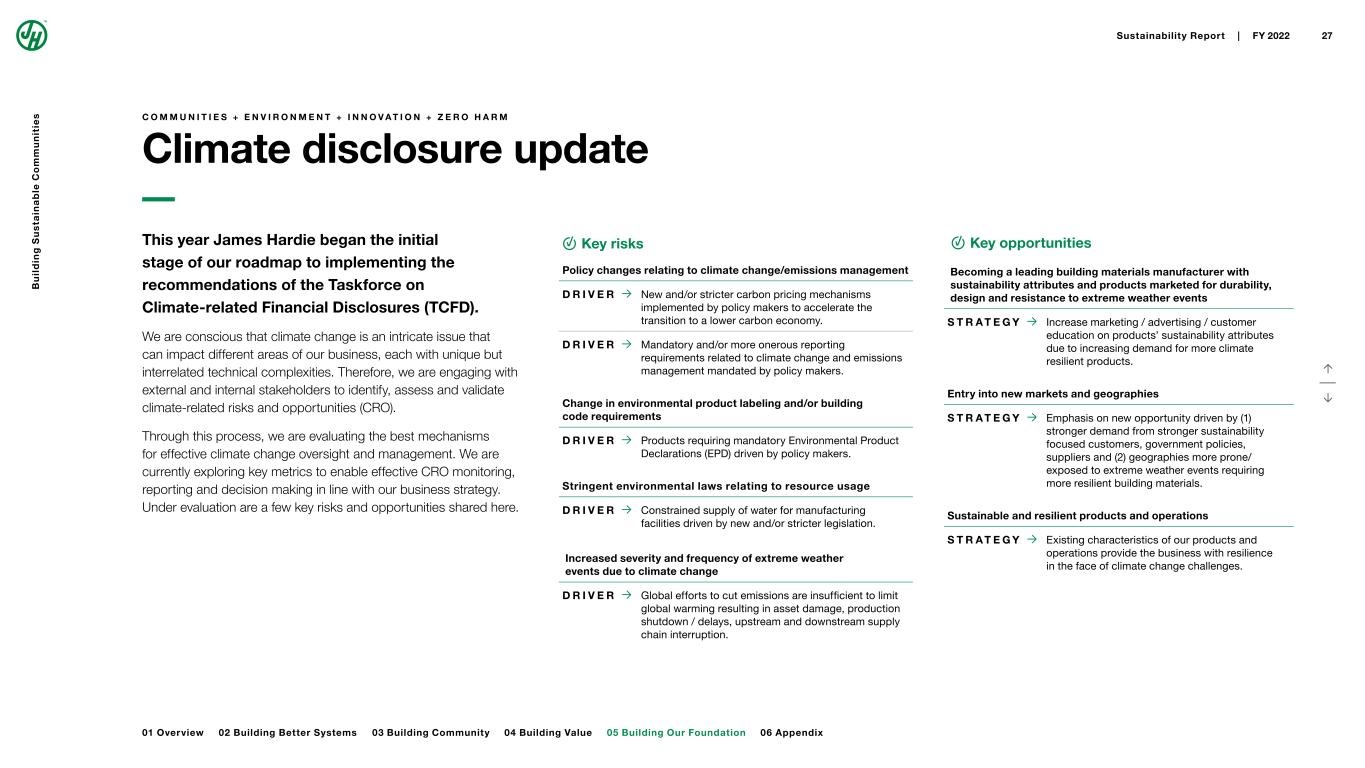
↑ ↓ C O M M U N I T I E S + E N V I R O N M E N T + I N N O V A T I O N + Z E R O H A R M Climate disclosure update Key risks Policy changes relating to climate change/emissions management D R I V E R → New and/or stricter carbon pricing mechanisms implemented by policy makers to accelerate the transition to a lower carbon economy. D R I V E R → Mandatory and/or more onerous reporting requirements related to climate change and emissions management mandated by policy makers. Change in environmental product labeling and/or building code requirements D R I V E R → Products requiring mandatory Environmental Product Declarations (EPD) driven by policy makers. Stringent environmental laws relating to resource usage D R I V E R → Constrained supply of water for manufacturing facilities driven by new and/or stricter legislation. Increased severity and frequency of extreme weather events due to climate change D R I V E R → Global efforts to cut emissions are insufficient to limit global warming resulting in asset damage, production shutdown / delays, upstream and downstream supply chain interruption. Key opportunities Becoming a leading building materials manufacturer with sustainability attributes and products marketed for durability, design and resistance to extreme weather events S T R A T E G Y → Increase marketing / advertising / customer education on products’ sustainability attributes due to increasing demand for more climate resilient products. Entry into new markets and geographies S T R A T E G Y → Emphasis on new opportunity driven by (1) stronger demand from stronger sustainability focused customers, government policies, suppliers and (2) geographies more prone/ exposed to extreme weather events requiring more resilient building materials. Sustainable and resilient products and operations S T R A T E G Y → Existing characteristics of our products and operations provide the business with resilience in the face of climate change challenges. This year James Hardie began the initial stage of our roadmap to implementing the recommendations of the Taskforce on Climate-related Financial Disclosures (TCFD). We are conscious that climate change is an intricate issue that can impact different areas of our business, each with unique but interrelated technical complexities. Therefore, we are engaging with external and internal stakeholders to identify, assess and validate climate-related risks and opportunities (CRO). Through this process, we are evaluating the best mechanisms for effective climate change oversight and management. We are currently exploring key metrics to enable effective CRO monitoring, reporting and decision making in line with our business strategy. Under evaluation are a few key risks and opportunities shared here. B u il d in g S u s ta in a b le C o m m u n it ie s 05 Building Our Foundation Sustainability Report | FY 2022 27 01 Overview 02 Building Better Systems 03 Building Community 04 Building Value 06 Appendix
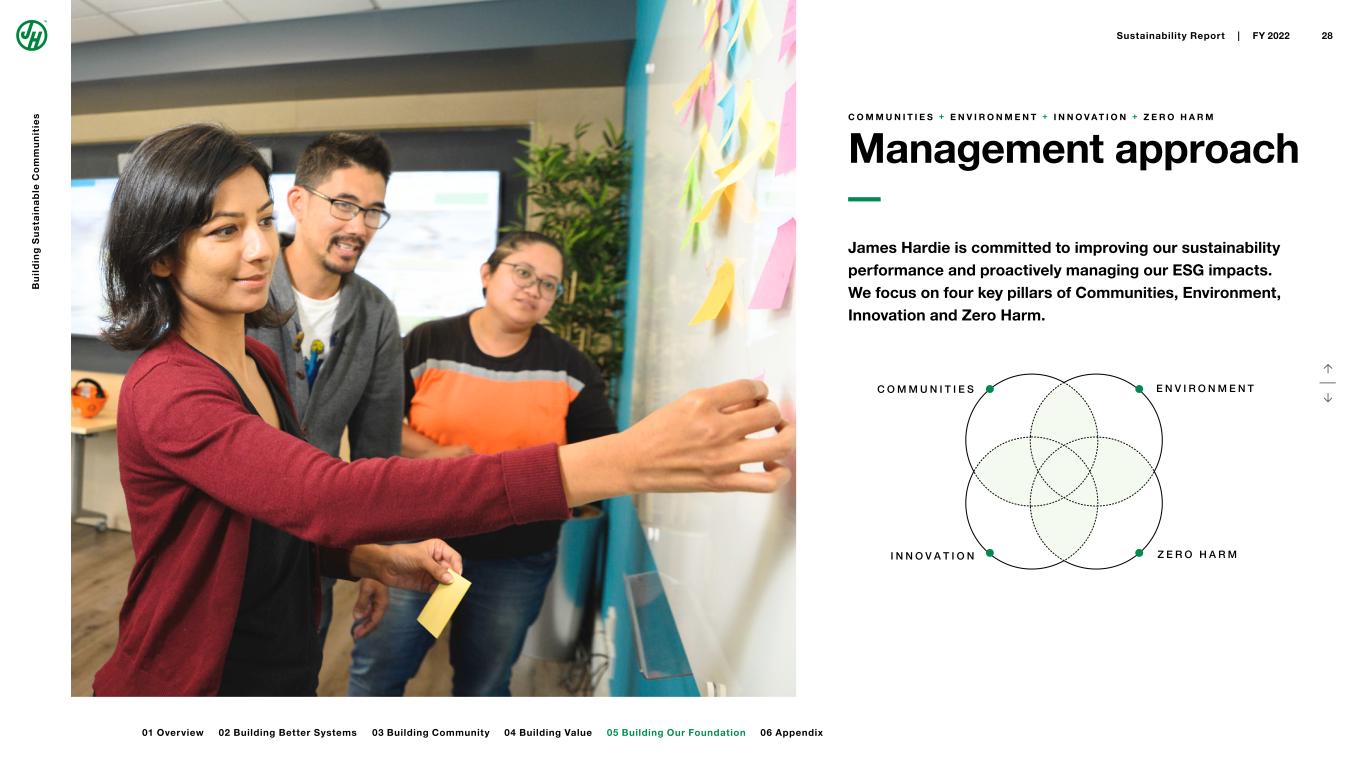
C O M M U N I T I E S E N V I R O N M E N T I N N O V A T I O N Z E R O H A R M ↑ ↓ C O M M U N I T I E S + E N V I R O N M E N T + I N N O V A T I O N + Z E R O H A R M Management approach James Hardie is committed to improving our sustainability performance and proactively managing our ESG impacts. We focus on four key pillars of Communities, Environment, Innovation and Zero Harm. B u il d in g S u s ta in a b le C o m m u n it ie s 05 Building Our Foundation Sustainability Report | FY 2022 28 01 Overview 02 Building Better Systems 03 Building Community 04 Building Value 06 Appendix
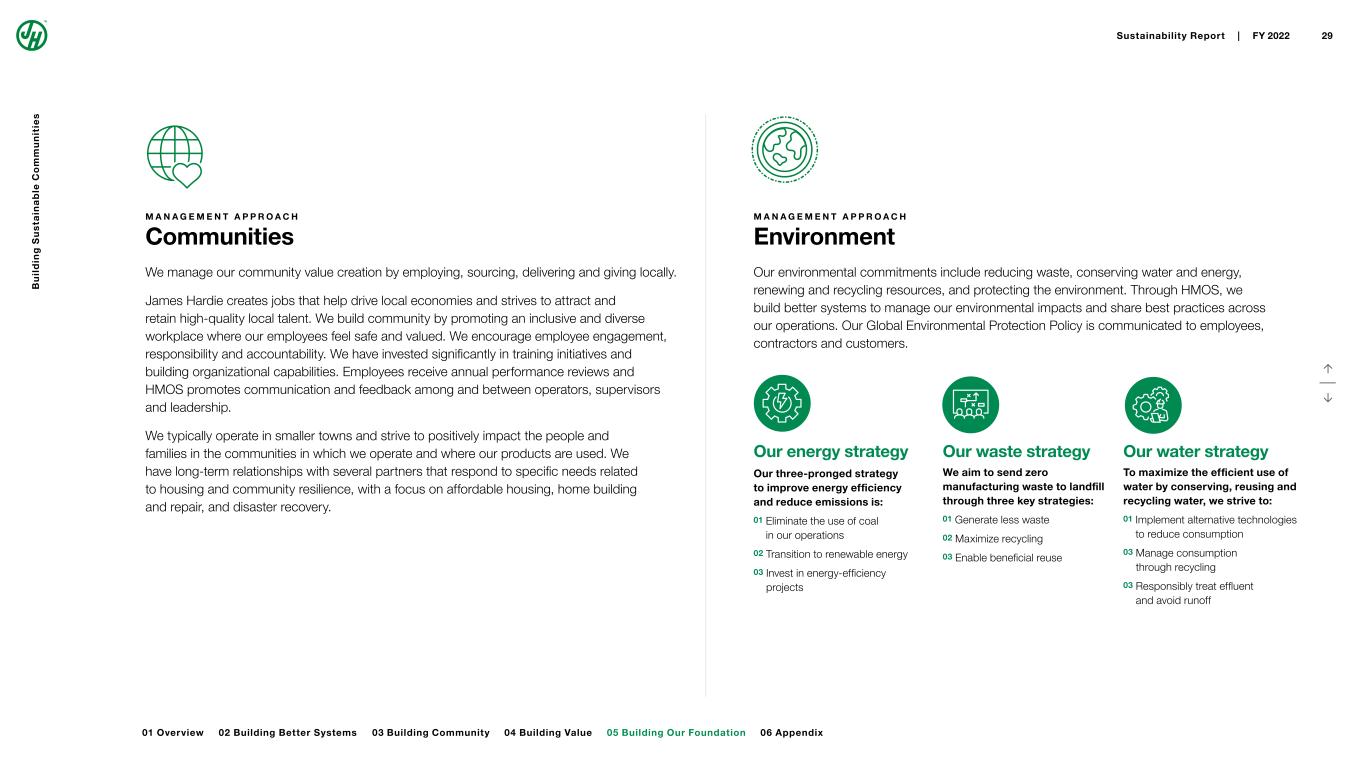
↑ ↓ M A N A G E M E N T A P P R O A C H Communities We manage our community value creation by employing, sourcing, delivering and giving locally. James Hardie creates jobs that help drive local economies and strives to attract and retain high-quality local talent. We build community by promoting an inclusive and diverse workplace where our employees feel safe and valued. We encourage employee engagement, responsibility and accountability. We have invested significantly in training initiatives and building organizational capabilities. Employees receive annual performance reviews and HMOS promotes communication and feedback among and between operators, supervisors and leadership. We typically operate in smaller towns and strive to positively impact the people and families in the communities in which we operate and where our products are used. We have long-term relationships with several partners that respond to specific needs related to housing and community resilience, with a focus on affordable housing, home building and repair, and disaster recovery. M A N A G E M E N T A P P R O A C H Environment Our environmental commitments include reducing waste, conserving water and energy, renewing and recycling resources, and protecting the environment. Through HMOS, we build better systems to manage our environmental impacts and share best practices across our operations. Our Global Environmental Protection Policy is communicated to employees, contractors and customers. Our energy strategy Our three-pronged strategy to improve energy efficiency and reduce emissions is: 01 Eliminate the use of coal in our operations 02 Transition to renewable energy 03 Invest in energy-efficiency projects Our waste strategy We aim to send zero manufacturing waste to landfill through three key strategies: 01 Generate less waste 02 Maximize recycling 03 Enable beneficial reuse Our water strategy To maximize the efficient use of water by conserving, reusing and recycling water, we strive to: 01 Implement alternative technologies to reduce consumption 03 Manage consumption through recycling 03 Responsibly treat effluent and avoid runoff B u il d in g S u s ta in a b le C o m m u n it ie s 05 Building Our Foundation Sustainability Report | FY 2022 29 01 Overview 02 Building Better Systems 03 Building Community 04 Building Value 06 Appendix
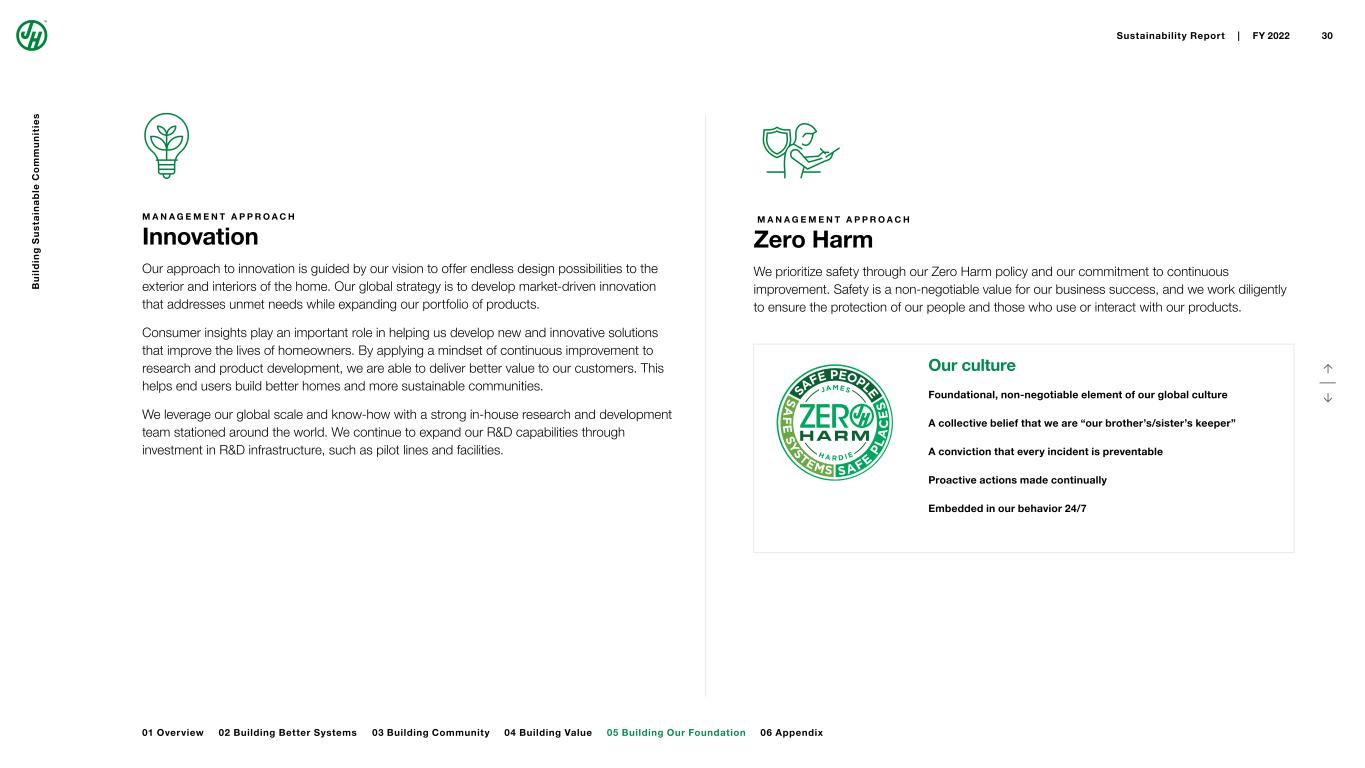
↑ ↓ M A N A G E M E N T A P P R O A C H Innovation Our approach to innovation is guided by our vision to offer endless design possibilities to the exterior and interiors of the home. Our global strategy is to develop market-driven innovation that addresses unmet needs while expanding our portfolio of products. Consumer insights play an important role in helping us develop new and innovative solutions that improve the lives of homeowners. By applying a mindset of continuous improvement to research and product development, we are able to deliver better value to our customers. This helps end users build better homes and more sustainable communities. We leverage our global scale and know-how with a strong in-house research and development team stationed around the world. We continue to expand our R&D capabilities through investment in R&D infrastructure, such as pilot lines and facilities. M A N A G E M E N T A P P R O A C H Zero Harm We prioritize safety through our Zero Harm policy and our commitment to continuous improvement. Safety is a non-negotiable value for our business success, and we work diligently to ensure the protection of our people and those who use or interact with our products. Our culture Foundational, non-negotiable element of our global culture A collective belief that we are “our brother’s/sister’s keeper” A conviction that every incident is preventable Proactive actions made continually Embedded in our behavior 24/7 B u il d in g S u s ta in a b le C o m m u n it ie s 05 Building Our Foundation Sustainability Report | FY 2022 30 01 Overview 02 Building Better Systems 03 Building Community 04 Building Value 06 Appendix
06 Appendix S A S B I N D E X E S G D A T A S U M M A R Y G R I I N D E X ↑ ↓
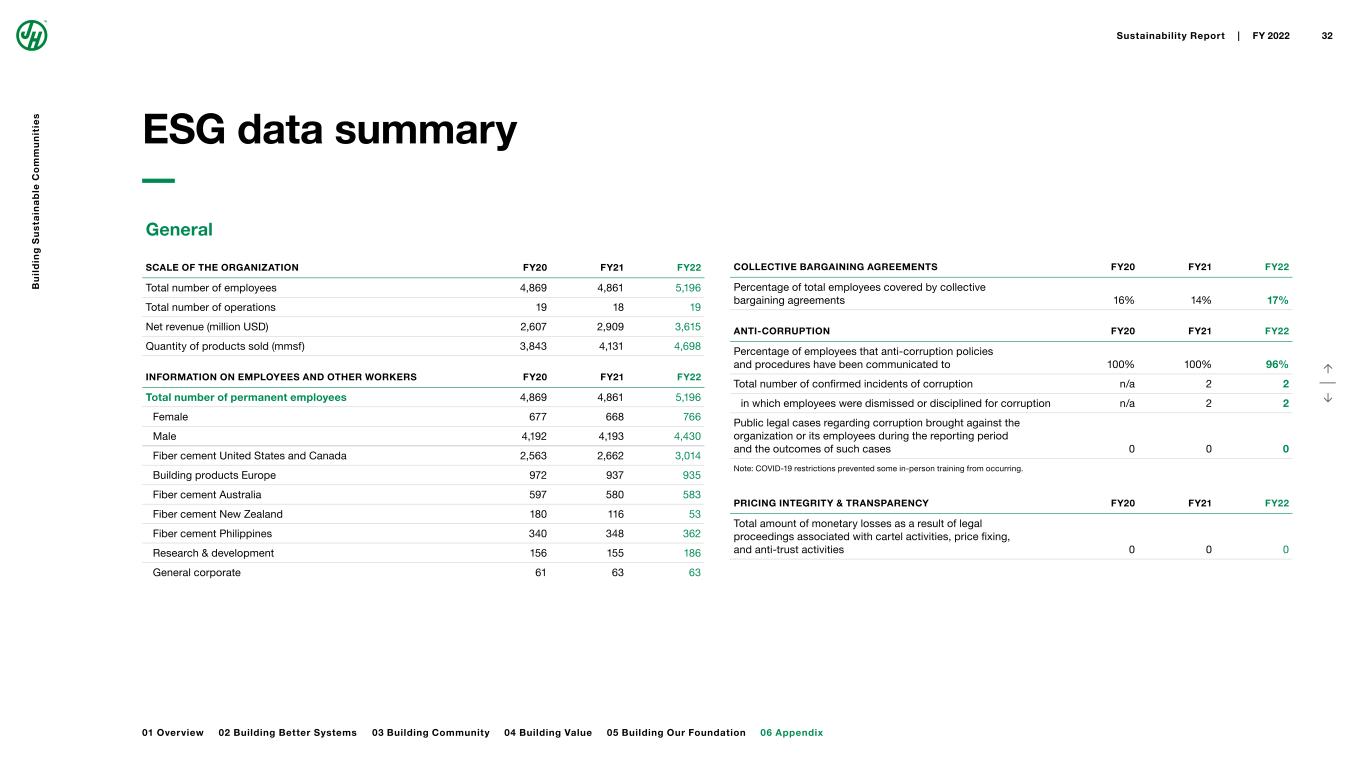
General SCALE OF THE ORGANIZATION FY20 FY21 FY22 Total number of employees 4,869 4,861 5,196 Total number of operations 19 18 19 Net revenue (million USD) 2,607 2,909 3,615 Quantity of products sold (mmsf) 3,843 4,131 4,698 INFORMATION ON EMPLOYEES AND OTHER WORKERS FY20 FY21 FY22 Total number of permanent employees 4,869 4,861 5,196 Female 677 668 766 Male 4,192 4,193 4,430 Fiber cement United States and Canada 2,563 2,662 3,014 Building products Europe 972 937 935 Fiber cement Australia 597 580 583 Fiber cement New Zealand 180 116 53 Fiber cement Philippines 340 348 362 Research & development 156 155 186 General corporate 61 63 63 COLLECTIVE BARGAINING AGREEMENTS FY20 FY21 FY22 Percentage of total employees covered by collective bargaining agreements 16% 14% 17% ANTI-CORRUPTION FY20 FY21 FY22 Percentage of employees that anti-corruption policies and procedures have been communicated to 100% 100% 96% Total number of confirmed incidents of corruption n/a 2 2 in which employees were dismissed or disciplined for corruption n/a 2 2 Public legal cases regarding corruption brought against the organization or its employees during the reporting period and the outcomes of such cases 0 0 0 Note: COVID-19 restrictions prevented some in-person training from occurring. PRICING INTEGRITY & TRANSPARENCY FY20 FY21 FY22 Total amount of monetary losses as a result of legal proceedings associated with cartel activities, price fixing, and anti-trust activities 0 0 0 ↑ ↓ ESG data summary B u il d in g S u s ta in a b le C o m m u n it ie s 06 Appendix Sustainability Report | FY 2022 32 01 Overview 02 Building Better Systems 03 Building Community 04 Building Value 05 Building Our Foundation
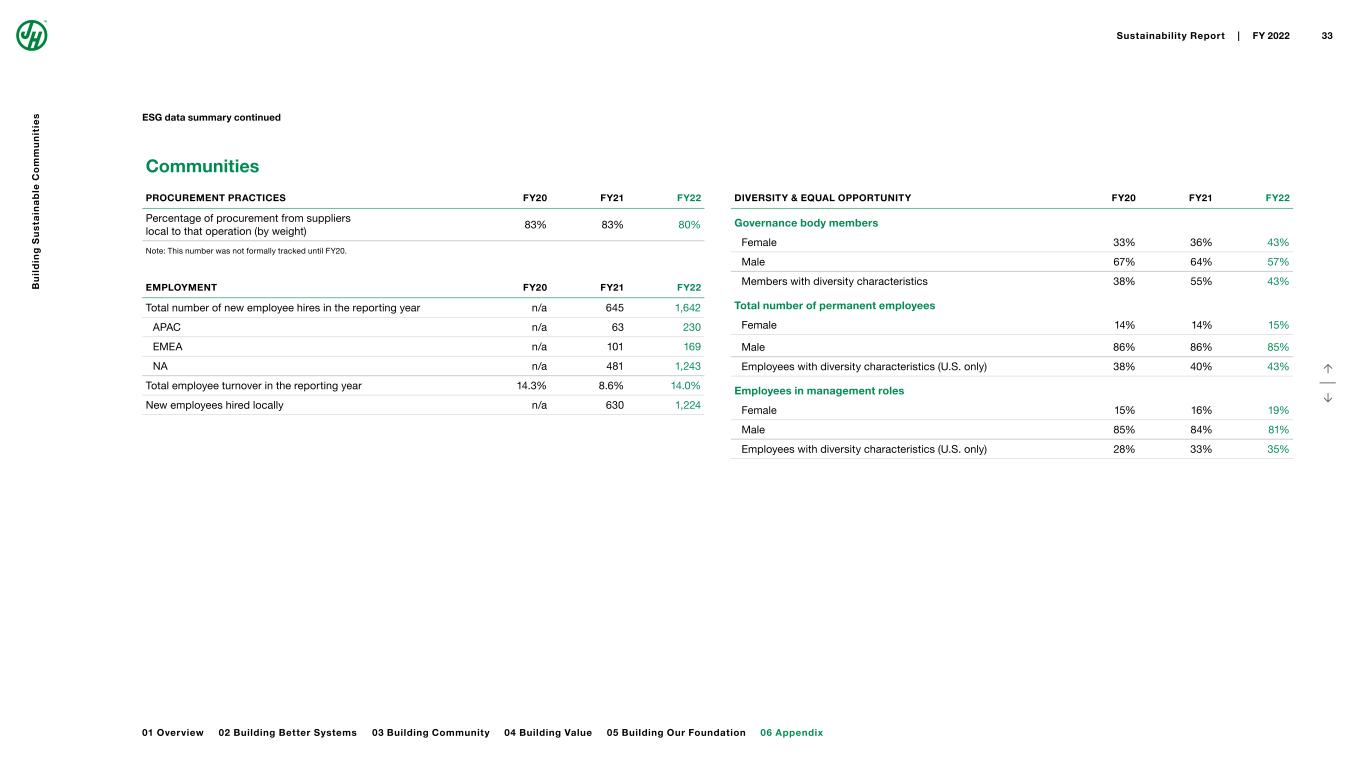
Communities DIVERSITY & EQUAL OPPORTUNITY FY20 FY21 FY22 Governance body members Female 33% 36% 43% Male 67% 64% 57% Members with diversity characteristics 38% 55% 43% Total number of permanent employees Female 14% 14% 15% Male 86% 86% 85% Employees with diversity characteristics (U.S. only) 38% 40% 43% Employees in management roles Female 15% 16% 19% Male 85% 84% 81% Employees with diversity characteristics (U.S. only) 28% 33% 35% ↑ ↓ PROCUREMENT PRACTICES FY20 FY21 FY22 Percentage of procurement from suppliers local to that operation (by weight) 83% 83% 80% Note: This number was not formally tracked until FY20. EMPLOYMENT FY20 FY21 FY22 Total number of new employee hires in the reporting year n/a 645 1,642 APAC n/a 63 230 EMEA n/a 101 169 NA n/a 481 1,243 Total employee turnover in the reporting year 14.3% 8.6% 14.0% New employees hired locally n/a 630 1,224 ESG data summary continued B u il d in g S u s ta in a b le C o m m u n it ie s 06 Appendix Sustainability Report | FY 2022 33 01 Overview 02 Building Better Systems 03 Building Community 04 Building Value 05 Building Our Foundation
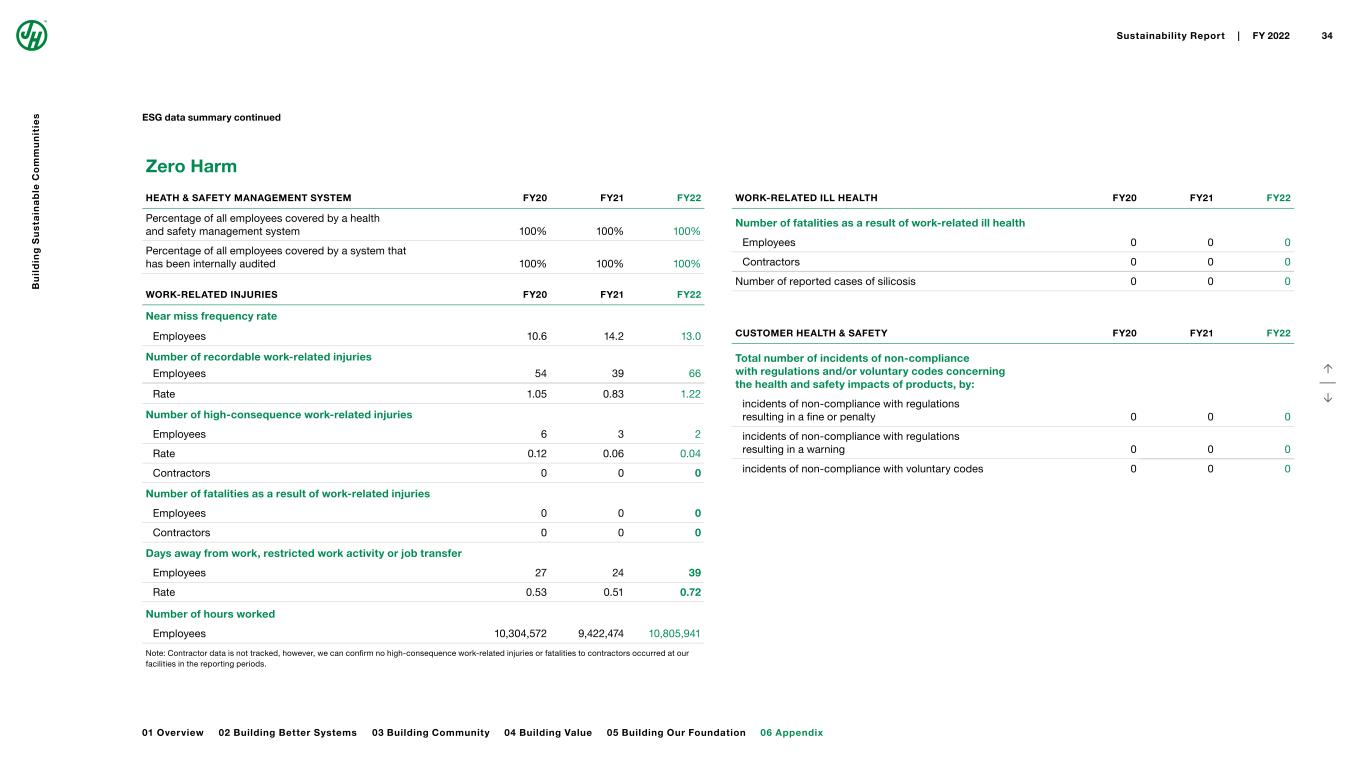
Zero Harm WORK-RELATED ILL HEALTH FY20 FY21 FY22 Number of fatalities as a result of work-related ill health Employees 0 0 0 Contractors 0 0 0 Number of reported cases of silicosis 0 0 0 CUSTOMER HEALTH & SAFETY FY20 FY21 FY22 Total number of incidents of non-compliance with regulations and/or voluntary codes concerning the health and safety impacts of products, by: incidents of non-compliance with regulations resulting in a fine or penalty 0 0 0 incidents of non-compliance with regulations resulting in a warning 0 0 0 incidents of non-compliance with voluntary codes 0 0 0 ↑ ↓ HEATH & SAFETY MANAGEMENT SYSTEM FY20 FY21 FY22 Percentage of all employees covered by a health and safety management system 100% 100% 100% Percentage of all employees covered by a system that has been internally audited 100% 100% 100% WORK-RELATED INJURIES FY20 FY21 FY22 Near miss frequency rate Employees 10.6 14.2 13.0 Number of recordable work-related injuries Employees 54 39 66 Rate 1.05 0.83 1.22 Number of high-consequence work-related injuries Employees 6 3 2 Rate 0.12 0.06 0.04 Contractors 0 0 0 Number of fatalities as a result of work-related injuries Employees 0 0 0 Contractors 0 0 0 Days away from work, restricted work activity or job transfer Employees 27 24 39 Rate 0.53 0.51 0.72 Number of hours worked Employees 10,304,572 9,422,474 10,805,941 Note: Contractor data is not tracked, however, we can confirm no high-consequence work-related injuries or fatalities to contractors occurred at our facilities in the reporting periods. ESG data summary continued B u il d in g S u s ta in a b le C o m m u n it ie s 06 Appendix Sustainability Report | FY 2022 34 01 Overview 02 Building Better Systems 03 Building Community 04 Building Value 05 Building Our Foundation
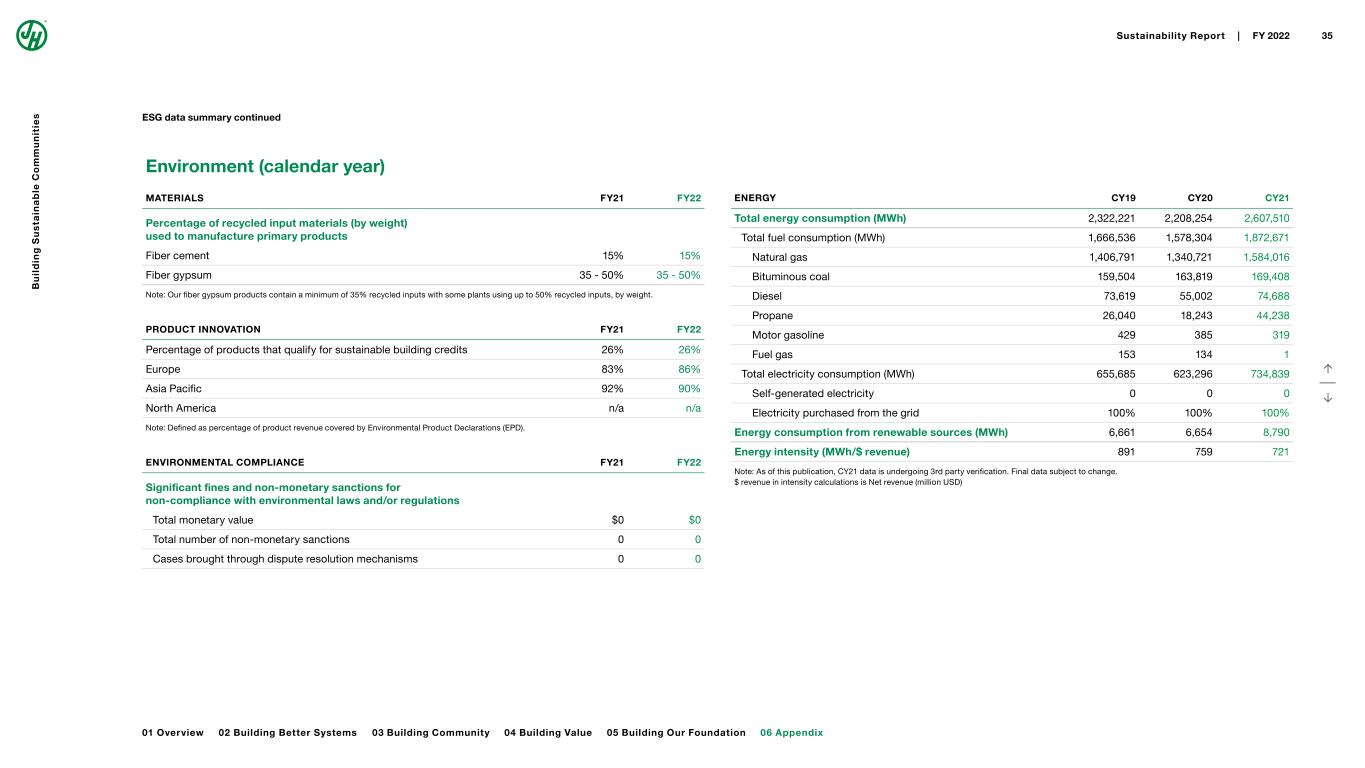
Environment (calendar year) ENERGY CY19 CY20 CY21 Total energy consumption (MWh) 2,322,221 2,208,254 2,607,510 Total fuel consumption (MWh) 1,666,536 1,578,304 1,872,671 Natural gas 1,406,791 1,340,721 1,584,016 Bituminous coal 159,504 163,819 169,408 Diesel 73,619 55,002 74,688 Propane 26,040 18,243 44,238 Motor gasoline 429 385 319 Fuel gas 153 134 1 Total electricity consumption (MWh) 655,685 623,296 734,839 Self-generated electricity 0 0 0 Electricity purchased from the grid 100% 100% 100% Energy consumption from renewable sources (MWh) 6,661 6,654 8,790 Energy intensity (MWh/$ revenue) 891 759 721 Note: As of this publication, CY21 data is undergoing 3rd party verification. Final data subject to change. $ revenue in intensity calculations is Net revenue (million USD) ESG data summary continued ↑ ↓ MATERIALS FY21 FY22 Percentage of recycled input materials (by weight) used to manufacture primary products Fiber cement 15% 15% Fiber gypsum 35 - 50% 35 - 50% Note: Our fiber gypsum products contain a minimum of 35% recycled inputs with some plants using up to 50% recycled inputs, by weight. PRODUCT INNOVATION FY21 FY22 Percentage of products that qualify for sustainable building credits 26% 26% Europe 83% 86% Asia Pacific 92% 90% North America n/a n/a Note: Defined as percentage of product revenue covered by Environmental Product Declarations (EPD). ENVIRONMENTAL COMPLIANCE FY21 FY22 Significant fines and non-monetary sanctions for non-compliance with environmental laws and/or regulations Total monetary value $0 $0 Total number of non-monetary sanctions 0 0 Cases brought through dispute resolution mechanisms 0 0 B u il d in g S u s ta in a b le C o m m u n it ie s 06 Appendix Sustainability Report | FY 2022 35 01 Overview 02 Building Better Systems 03 Building Community 04 Building Value 05 Building Our Foundation
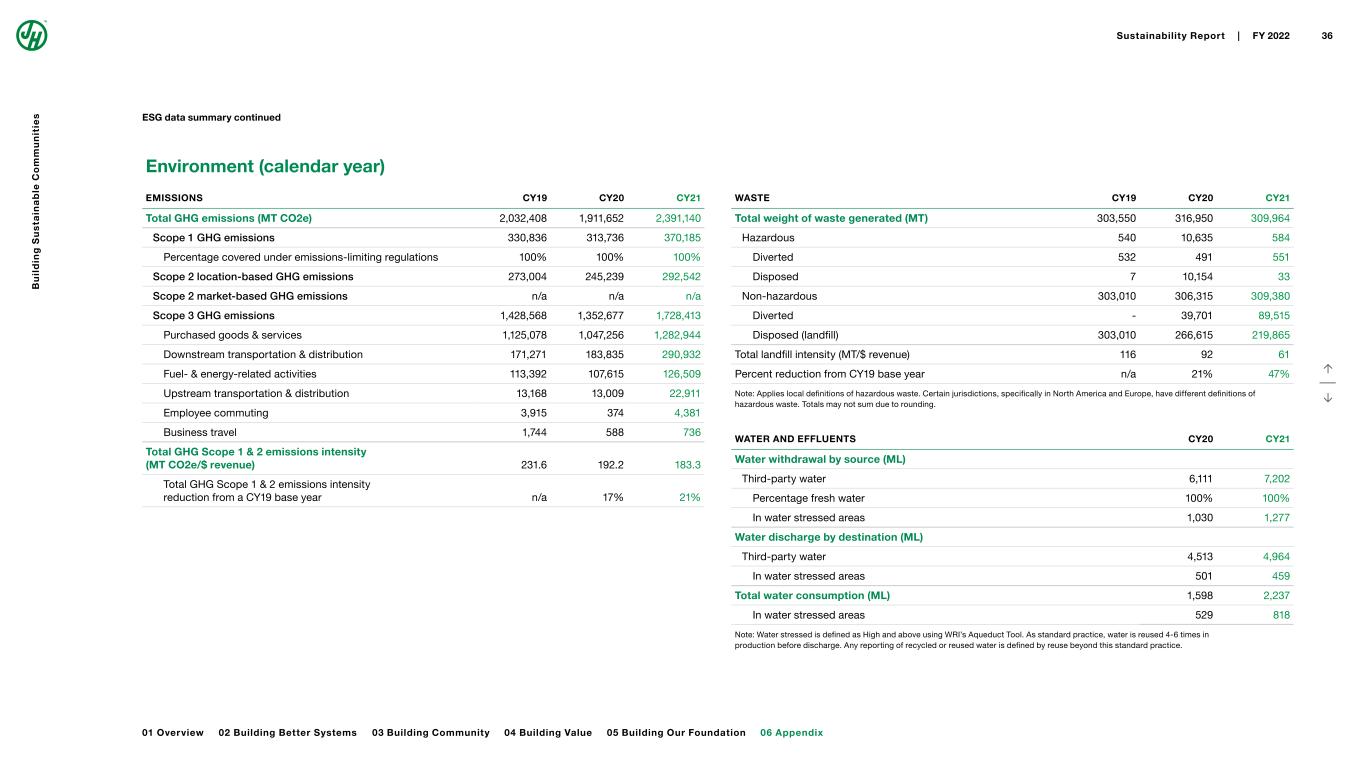
EMISSIONS CY19 CY20 CY21 Total GHG emissions (MT CO2e) 2,032,408 1,911,652 2,391,140 Scope 1 GHG emissions 330,836 313,736 370,185 Percentage covered under emissions-limiting regulations 100% 100% 100% Scope 2 location-based GHG emissions 273,004 245,239 292,542 Scope 2 market-based GHG emissions n/a n/a n/a Scope 3 GHG emissions 1,428,568 1,352,677 1,728,413 Purchased goods & services 1,125,078 1,047,256 1,282,944 Downstream transportation & distribution 171,271 183,835 290,932 Fuel- & energy-related activities 113,392 107,615 126,509 Upstream transportation & distribution 13,168 13,009 22,911 Employee commuting 3,915 374 4,381 Business travel 1,744 588 736 Total GHG Scope 1 & 2 emissions intensity (MT CO2e/$ revenue) 231.6 192.2 183.3 Total GHG Scope 1 & 2 emissions intensity reduction from a CY19 base year n/a 17% 21% WASTE CY19 CY20 CY21 Total weight of waste generated (MT) 303,550 316,950 309,964 Hazardous 540 10,635 584 Diverted 532 491 551 Disposed 7 10,154 33 Non-hazardous 303,010 306,315 309,380 Diverted - 39,701 89,515 Disposed (landfill) 303,010 266,615 219,865 Total landfill intensity (MT/$ revenue) 116 92 61 Percent reduction from CY19 base year n/a 21% 47% Note: Applies local definitions of hazardous waste. Certain jurisdictions, specifically in North America and Europe, have different definitions of hazardous waste. Totals may not sum due to rounding. WATER AND EFFLUENTS CY20 CY21 Water withdrawal by source (ML) Third-party water 6,111 7,202 Percentage fresh water 100% 100% In water stressed areas 1,030 1,277 Water discharge by destination (ML) Third-party water 4,513 4,964 In water stressed areas 501 459 Total water consumption (ML) 1,598 2,237 In water stressed areas 529 818 Note: Water stressed is defined as High and above using WRI’s Aqueduct Tool. As standard practice, water is reused 4-6 times in production before discharge. Any reporting of recycled or reused water is defined by reuse beyond this standard practice. ESG data summary continued ↑ ↓ Environment (calendar year) B u il d in g S u s ta in a b le C o m m u n it ie s 06 Appendix Sustainability Report | FY 2022 36 01 Overview 02 Building Better Systems 03 Building Community 04 Building Value 05 Building Our Foundation
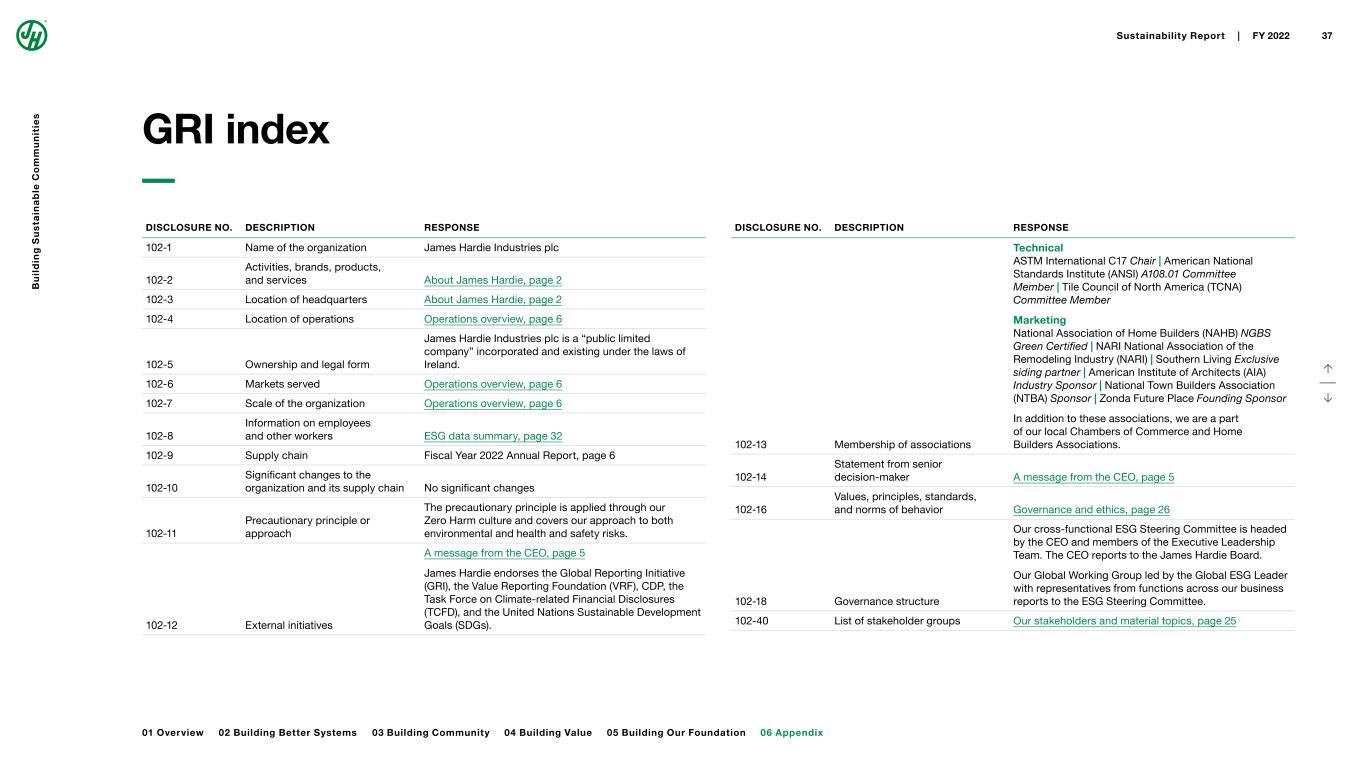
DISCLOSURE NO. DESCRIPTION RESPONSE 102-1 Name of the organization James Hardie Industries plc 102-2 Activities, brands, products, and services About James Hardie, page 2 102-3 Location of headquarters About James Hardie, page 2 102-4 Location of operations Operations overview, page 6 102-5 Ownership and legal form James Hardie Industries plc is a “public limited company” incorporated and existing under the laws of Ireland. 102-6 Markets served Operations overview, page 6 102-7 Scale of the organization Operations overview, page 6 102-8 Information on employees and other workers ESG data summary, page 32 102-9 Supply chain Fiscal Year 2022 Annual Report, page 6 102-10 Significant changes to the organization and its supply chain No significant changes 102-11 Precautionary principle or approach The precautionary principle is applied through our Zero Harm culture and covers our approach to both environmental and health and safety risks. 102-12 External initiatives A message from the CEO, page 5 James Hardie endorses the Global Reporting Initiative (GRI), the Value Reporting Foundation (VRF), CDP, the Task Force on Climate-related Financial Disclosures (TCFD), and the United Nations Sustainable Development Goals (SDGs). DISCLOSURE NO. DESCRIPTION RESPONSE 102-13 Membership of associations Technical ASTM International C17 Chair | American National Standards Institute (ANSI) A108.01 Committee Member | Tile Council of North America (TCNA) Committee Member Marketing National Association of Home Builders (NAHB) NGBS Green Certified | NARI National Association of the Remodeling Industry (NARI) | Southern Living Exclusive siding partner | American Institute of Architects (AIA) Industry Sponsor | National Town Builders Association (NTBA) Sponsor | Zonda Future Place Founding Sponsor In addition to these associations, we are a part of our local Chambers of Commerce and Home Builders Associations. 102-14 Statement from senior decision-maker A message from the CEO, page 5 102-16 Values, principles, standards, and norms of behavior Governance and ethics, page 26 102-18 Governance structure Our cross-functional ESG Steering Committee is headed by the CEO and members of the Executive Leadership Team. The CEO reports to the James Hardie Board. Our Global Working Group led by the Global ESG Leader with representatives from functions across our business reports to the ESG Steering Committee. 102-40 List of stakeholder groups Our stakeholders and material topics, page 25 ↑ ↓ GRI index B u il d in g S u s ta in a b le C o m m u n it ie s 06 Appendix Sustainability Report | FY 2022 37 01 Overview 02 Building Better Systems 03 Building Community 04 Building Value 05 Building Our Foundation
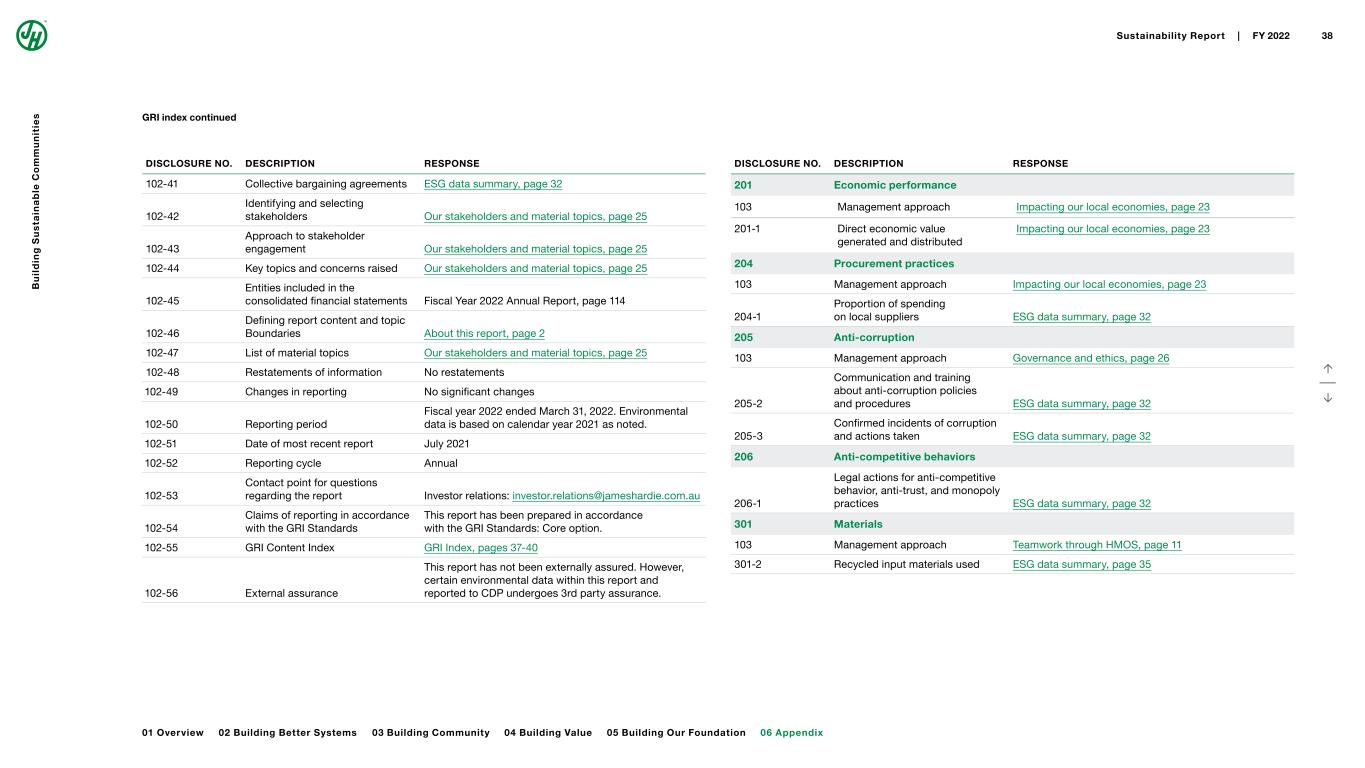
DISCLOSURE NO. DESCRIPTION RESPONSE 102-41 Collective bargaining agreements ESG data summary, page 32 102-42 Identifying and selecting stakeholders Our stakeholders and material topics, page 25 102-43 Approach to stakeholder engagement Our stakeholders and material topics, page 25 102-44 Key topics and concerns raised Our stakeholders and material topics, page 25 102-45 Entities included in the consolidated financial statements Fiscal Year 2022 Annual Report, page 114 102-46 Defining report content and topic Boundaries About this report, page 2 102-47 List of material topics Our stakeholders and material topics, page 25 102-48 Restatements of information No restatements 102-49 Changes in reporting No significant changes 102-50 Reporting period Fiscal year 2022 ended March 31, 2022. Environmental data is based on calendar year 2021 as noted. 102-51 Date of most recent report July 2021 102-52 Reporting cycle Annual 102-53 Contact point for questions regarding the report Investor relations: [email protected] 102-54 Claims of reporting in accordance with the GRI Standards This report has been prepared in accordance with the GRI Standards: Core option. 102-55 GRI Content Index GRI Index, pages 37-40 102-56 External assurance This report has not been externally assured. However, certain environmental data within this report and reported to CDP undergoes 3rd party assurance. DISCLOSURE NO. DESCRIPTION RESPONSE 201 Economic performance 103 Management approach Impacting our local economies, page 23 201-1 Direct economic value generated and distributed Impacting our local economies, page 23 204 Procurement practices 103 Management approach Impacting our local economies, page 23 204-1 Proportion of spending on local suppliers ESG data summary, page 32 205 Anti-corruption 103 Management approach Governance and ethics, page 26 205-2 Communication and training about anti-corruption policies and procedures ESG data summary, page 32 205-3 Confirmed incidents of corruption and actions taken ESG data summary, page 32 206 Anti-competitive behaviors 206-1 Legal actions for anti-competitive behavior, anti-trust, and monopoly practices ESG data summary, page 32 301 Materials 103 Management approach Teamwork through HMOS, page 11 301-2 Recycled input materials used ESG data summary, page 35 ↑ ↓ GRI index continued B u il d in g S u s ta in a b le C o m m u n it ie s 06 Appendix Sustainability Report | FY 2022 38 01 Overview 02 Building Better Systems 03 Building Community 04 Building Value 05 Building Our Foundation
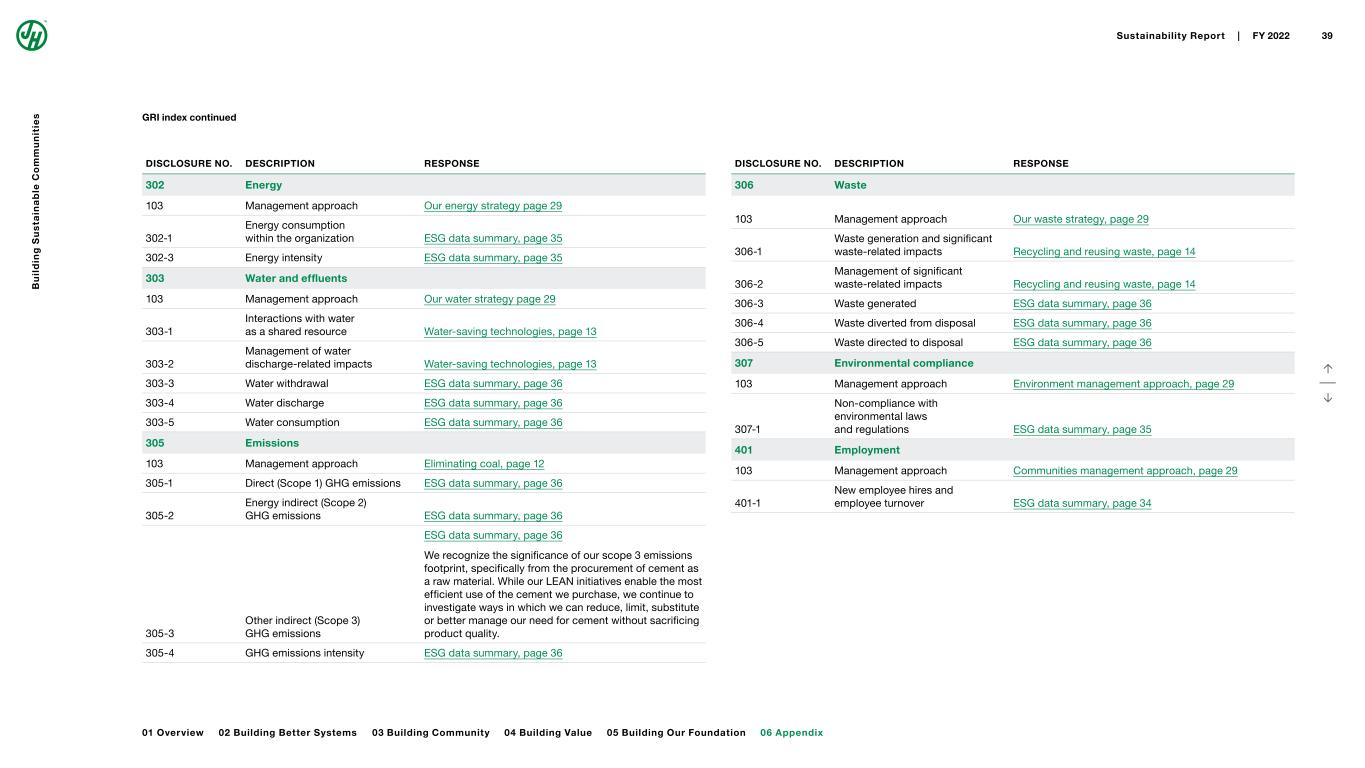
DISCLOSURE NO. DESCRIPTION RESPONSE 302 Energy 103 Management approach Our energy strategy page 29 302-1 Energy consumption within the organization ESG data summary, page 35 302-3 Energy intensity ESG data summary, page 35 303 Water and effluents 103 Management approach Our water strategy page 29 303-1 Interactions with water as a shared resource Water-saving technologies, page 13 303-2 Management of water discharge-related impacts Water-saving technologies, page 13 303-3 Water withdrawal ESG data summary, page 36 303-4 Water discharge ESG data summary, page 36 303-5 Water consumption ESG data summary, page 36 305 Emissions 103 Management approach Eliminating coal, page 12 305-1 Direct (Scope 1) GHG emissions ESG data summary, page 36 305-2 Energy indirect (Scope 2) GHG emissions ESG data summary, page 36 305-3 Other indirect (Scope 3) GHG emissions ESG data summary, page 36 We recognize the significance of our scope 3 emissions footprint, specifically from the procurement of cement as a raw material. While our LEAN initiatives enable the most efficient use of the cement we purchase, we continue to investigate ways in which we can reduce, limit, substitute or better manage our need for cement without sacrificing product quality. 305-4 GHG emissions intensity ESG data summary, page 36 DISCLOSURE NO. DESCRIPTION RESPONSE 306 Waste 103 Management approach Our waste strategy, page 29 306-1 Waste generation and significant waste-related impacts Recycling and reusing waste, page 14 306-2 Management of significant waste-related impacts Recycling and reusing waste, page 14 306-3 Waste generated ESG data summary, page 36 306-4 Waste diverted from disposal ESG data summary, page 36 306-5 Waste directed to disposal ESG data summary, page 36 307 Environmental compliance 103 Management approach Environment management approach, page 29 307-1 Non-compliance with environmental laws and regulations ESG data summary, page 35 401 Employment 103 Management approach Communities management approach, page 29 401-1 New employee hires and employee turnover ESG data summary, page 34 ↑ ↓ GRI index continued B u il d in g S u s ta in a b le C o m m u n it ie s 06 Appendix Sustainability Report | FY 2022 39 01 Overview 02 Building Better Systems 03 Building Community 04 Building Value 05 Building Our Foundation
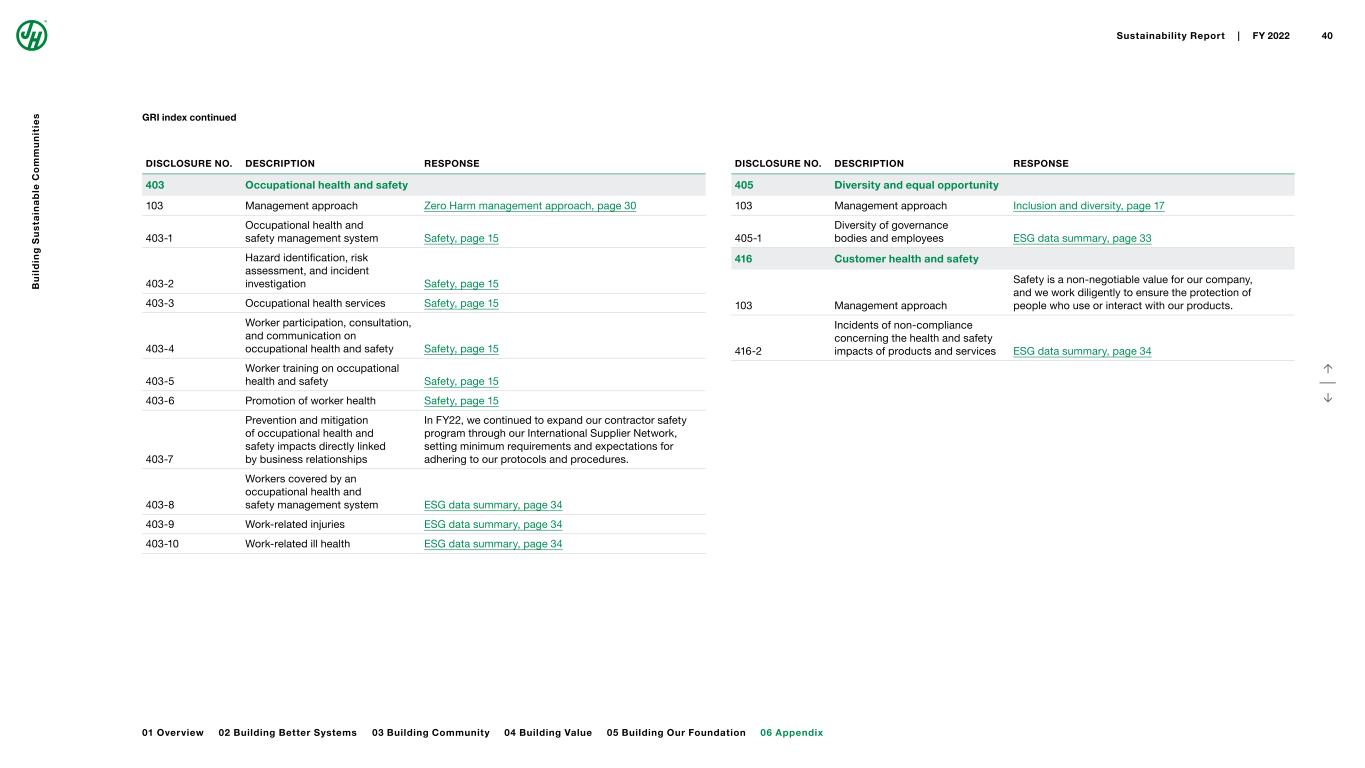
DISCLOSURE NO. DESCRIPTION RESPONSE 403 Occupational health and safety 103 Management approach Zero Harm management approach, page 30 403-1 Occupational health and safety management system Safety, page 15 403-2 Hazard identification, risk assessment, and incident investigation Safety, page 15 403-3 Occupational health services Safety, page 15 403-4 Worker participation, consultation, and communication on occupational health and safety Safety, page 15 403-5 Worker training on occupational health and safety Safety, page 15 403-6 Promotion of worker health Safety, page 15 403-7 Prevention and mitigation of occupational health and safety impacts directly linked by business relationships In FY22, we continued to expand our contractor safety program through our International Supplier Network, setting minimum requirements and expectations for adhering to our protocols and procedures. 403-8 Workers covered by an occupational health and safety management system ESG data summary, page 34 403-9 Work-related injuries ESG data summary, page 34 403-10 Work-related ill health ESG data summary, page 34 DISCLOSURE NO. DESCRIPTION RESPONSE 405 Diversity and equal opportunity 103 Management approach Inclusion and diversity, page 17 405-1 Diversity of governance bodies and employees ESG data summary, page 33 416 Customer health and safety 103 Management approach Safety is a non-negotiable value for our company, and we work diligently to ensure the protection of people who use or interact with our products. 416-2 Incidents of non-compliance concerning the health and safety impacts of products and services ESG data summary, page 34 GRI index continued ↑ ↓ B u il d in g S u s ta in a b le C o m m u n it ie s 06 Appendix Sustainability Report | FY 2022 40 01 Overview 02 Building Better Systems 03 Building Community 04 Building Value 05 Building Our Foundation
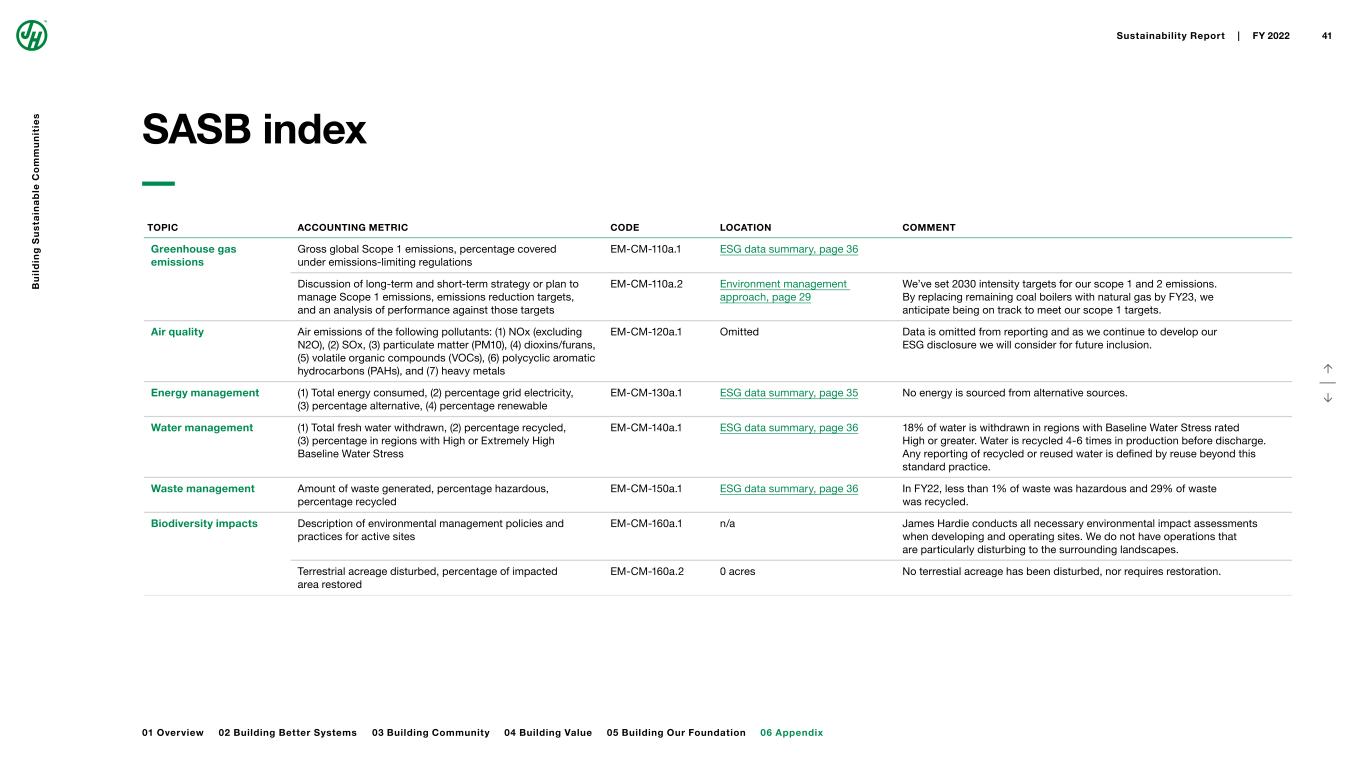
TOPIC ACCOUNTING METRIC CODE LOCATION COMMENT Greenhouse gas emissions Gross global Scope 1 emissions, percentage covered under emissions-limiting regulations EM-CM-110a.1 ESG data summary, page 36 Discussion of long-term and short-term strategy or plan to manage Scope 1 emissions, emissions reduction targets, and an analysis of performance against those targets EM-CM-110a.2 Environment management approach, page 29 We’ve set 2030 intensity targets for our scope 1 and 2 emissions. By replacing remaining coal boilers with natural gas by FY23, we anticipate being on track to meet our scope 1 targets. Air quality Air emissions of the following pollutants: (1) NOx (excluding N2O), (2) SOx, (3) particulate matter (PM10), (4) dioxins/furans, (5) volatile organic compounds (VOCs), (6) polycyclic aromatic hydrocarbons (PAHs), and (7) heavy metals EM-CM-120a.1 Omitted Data is omitted from reporting and as we continue to develop our ESG disclosure we will consider for future inclusion. Energy management (1) Total energy consumed, (2) percentage grid electricity, (3) percentage alternative, (4) percentage renewable EM-CM-130a.1 ESG data summary, page 35 No energy is sourced from alternative sources. Water management (1) Total fresh water withdrawn, (2) percentage recycled, (3) percentage in regions with High or Extremely High Baseline Water Stress EM-CM-140a.1 ESG data summary, page 36 18% of water is withdrawn in regions with Baseline Water Stress rated High or greater. Water is recycled 4-6 times in production before discharge. Any reporting of recycled or reused water is defined by reuse beyond this standard practice. Waste management Amount of waste generated, percentage hazardous, percentage recycled EM-CM-150a.1 ESG data summary, page 36 In FY22, less than 1% of waste was hazardous and 29% of waste was recycled. Biodiversity impacts Description of environmental management policies and practices for active sites EM-CM-160a.1 n/a James Hardie conducts all necessary environmental impact assessments when developing and operating sites. We do not have operations that are particularly disturbing to the surrounding landscapes. Terrestrial acreage disturbed, percentage of impacted area restored EM-CM-160a.2 0 acres No terrestial acreage has been disturbed, nor requires restoration. ↑ ↓ SASB index B u il d in g S u s ta in a b le C o m m u n it ie s 06 Appendix Sustainability Report | FY 2022 41 01 Overview 02 Building Better Systems 03 Building Community 04 Building Value 05 Building Our Foundation
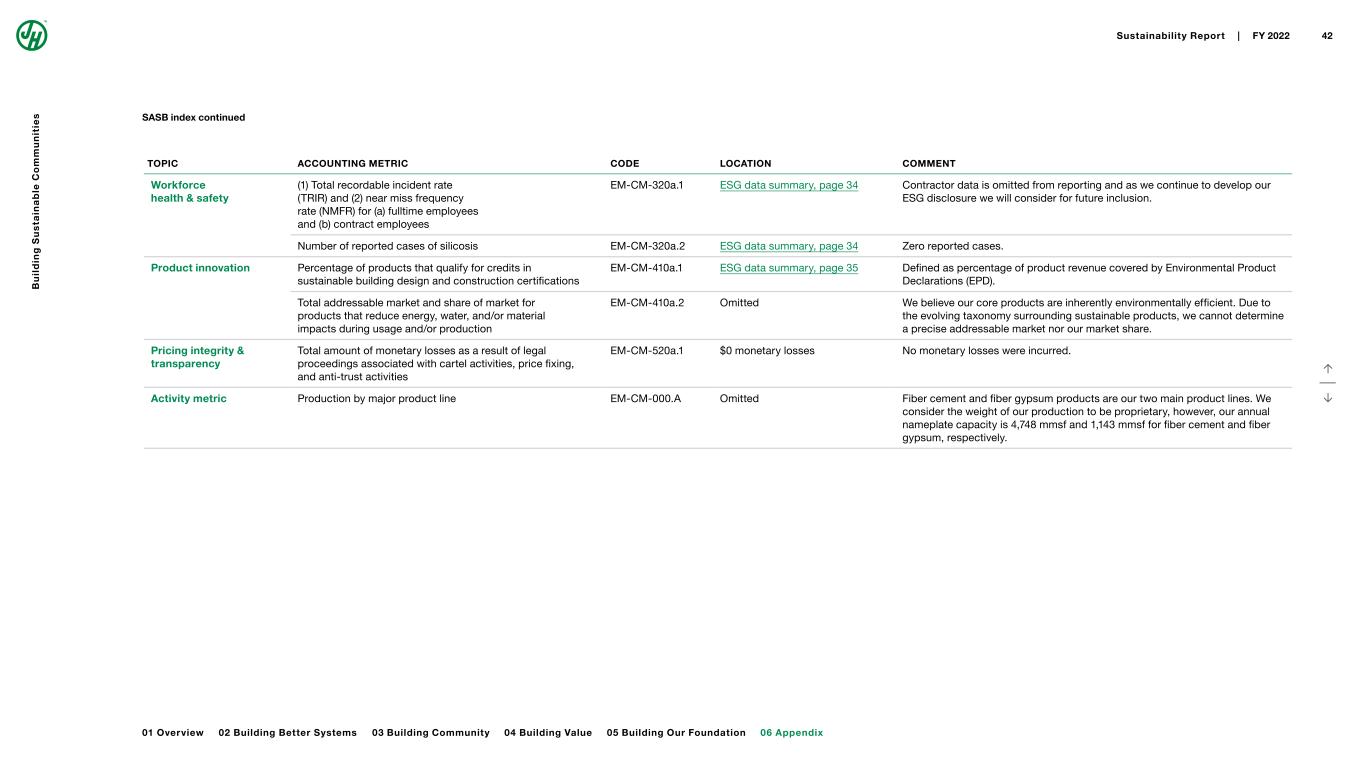
TOPIC ACCOUNTING METRIC CODE LOCATION COMMENT Workforce health & safety (1) Total recordable incident rate (TRIR) and (2) near miss frequency rate (NMFR) for (a) fulltime employees and (b) contract employees EM-CM-320a.1 ESG data summary, page 34 Contractor data is omitted from reporting and as we continue to develop our ESG disclosure we will consider for future inclusion. Number of reported cases of silicosis EM-CM-320a.2 ESG data summary, page 34 Zero reported cases. Product innovation Percentage of products that qualify for credits in sustainable building design and construction certifications EM-CM-410a.1 ESG data summary, page 35 Defined as percentage of product revenue covered by Environmental Product Declarations (EPD). Total addressable market and share of market for products that reduce energy, water, and/or material impacts during usage and/or production EM-CM-410a.2 Omitted We believe our core products are inherently environmentally efficient. Due to the evolving taxonomy surrounding sustainable products, we cannot determine a precise addressable market nor our market share. Pricing integrity & transparency Total amount of monetary losses as a result of legal proceedings associated with cartel activities, price fixing, and anti-trust activities EM-CM-520a.1 $0 monetary losses No monetary losses were incurred. Activity metric Production by major product line EM-CM-000.A Omitted Fiber cement and fiber gypsum products are our two main product lines. We consider the weight of our production to be proprietary, however, our annual nameplate capacity is 4,748 mmsf and 1,143 mmsf for fiber cement and fiber gypsum, respectively. SASB index continued ↑ ↓ B u il d in g S u s ta in a b le C o m m u n it ie s 06 Appendix Sustainability Report | FY 2022 42 01 Overview 02 Building Better Systems 03 Building Community 04 Building Value 05 Building Our Foundation
© 2022 James Hardie Building Products Inc. All Rights Reserved. TM, SM, and ® denote trademarks or registered trademarks of James Hardie Technology Limited. HS2227 07/2022 ↑