
Q3 FY23 MANAGEMENT PRESENTATION 14 February 2023
Page 2 James Hardie Q3 FY23 Results CAUTIONARY NOTE ON FORWARD‐LOOKING STATEMENTS This Management Presentation contains forward looking statements within the meaning of the Private Securities Litigation Reform Act of 1995. James Hardie Industries plc (the “Company”) may from time to time make forward‐looking statements in its periodic reports filed with or furnished to the Securities and Exchange Commission on Forms 20‐F and 6‐K, in its annual reports to shareholders, in media releases and other written materials and in oral statements made by the Company’s officers, directors or employees to analysts, institutional investors, representatives of the media and others. Words such as “believe,” “anticipate,” “plan,” “expect,” “intend,” “target,” “estimate,” “project,” “predict,” “forecast,” “guideline,” “aim,” “will,” “should,” “likely,” “continue,” “may,” “objective,” “outlook” and similar expressions are intended to identify forward‐looking statements but are not the exclusive means of identifying such statements. These forward‐looking statements are based upon management's current expectations, estimates, assumptions and beliefs concerning future events and conditions. Readers are cautioned not to place undue reliance on any forward‐ looking statements. Forward‐looking statements are necessarily subject to risks, uncertainties and other factors, many of which are unforeseeable and beyond the Company’s control. Many factors could cause actual results, performance or achievements to be materially different from those expressed or implied in this Management Presentation, including, among others, the risks and uncertainties set forth in Section 3 “Risk Factors” in James Hardie’s Annual Report on Form 20‐F for the year ended 31 March 2022; changes in general economic, political, governmental and business conditions globally and in the countries in which the Company does business, including the impact of COVID‐19; changes in interest rates; changes in inflation rates; changes in exchange rates; the level of construction generally; changes in cement demand and prices; changes in raw material and energy prices; changes in business strategy and various other factors. Should one or more of these risks or uncertainties materialize, or should underlying assumptions prove incorrect, actual results may vary materially from those described herein. James Hardie assumes no obligation to update or correct the information contained in this Management Presentation except as required by law. This Management Presentation includes financial measures that are not considered a measure of financial performance under generally accepted accounting principles in the United States (GAAP). These financial measures are designed to provide investors with an alternative method for assessing our performance from on‐going operations, capital efficiency and profit generation. Management uses these financial measures for the same purposes. These financial measures are or may be non‐GAAP financial measures as defined in the rules of the U.S. Securities and Exchange Commission and may exclude or include amounts that are included or excluded, as applicable, in the calculation of the most directly comparable financial measures calculated in accordance with GAAP. These non‐GAAP financial measures should not be considered to be more meaningful than the equivalent GAAP measure. Management has included such measures to provide investors with an alternative method for assessing its operating results in a manner that is focused on the performance of its ongoing operations and excludes the impact of certain legacy items, such as asbestos adjustments. Additionally, management uses such non‐GAAP financial measures for the same purposes. However, these non‐GAAP financial measures are not prepared in accordance with GAAP, may not be reported by all of the Company’s competitors and may not be directly comparable to similarly titled measures of the Company’s competitors due to potential differences in the exact method of calculation. For additional information regarding the non‐GAAP financial measures presented in this Management Presentation, including a reconciliation of each non‐GAAP financial measure to the equivalent GAAP measure, see the slide titled “Non‐GAAP Financial Measures” included in the Appendix to this Management Presentation. In addition, this Management Presentation includes financial measures and descriptions that are considered to not be in accordance with GAAP, but which are consistent with financial measures reported by Australian companies, such as operating profit, EBIT and EBIT margin. Since the Company prepares its Consolidated Financial Statements in accordance with GAAP, the Company provides investors with definitions and a cross‐reference from the non‐GAAP financial measure used in this Management Presentation to the equivalent GAAP financial measure used in the Company’s Consolidated Financial Statements. See the section titled “Non‐GAAP Financial Measures” included in the Appendix to this Management Presentation. CAUTIONARY NOTE ON FORWARD‐LOOKING STATEMENTS USE OF NON‐GAAP FINANCIAL INFORMATION; AUSTRALIAN EQUIVALENT TERMINOLOGY
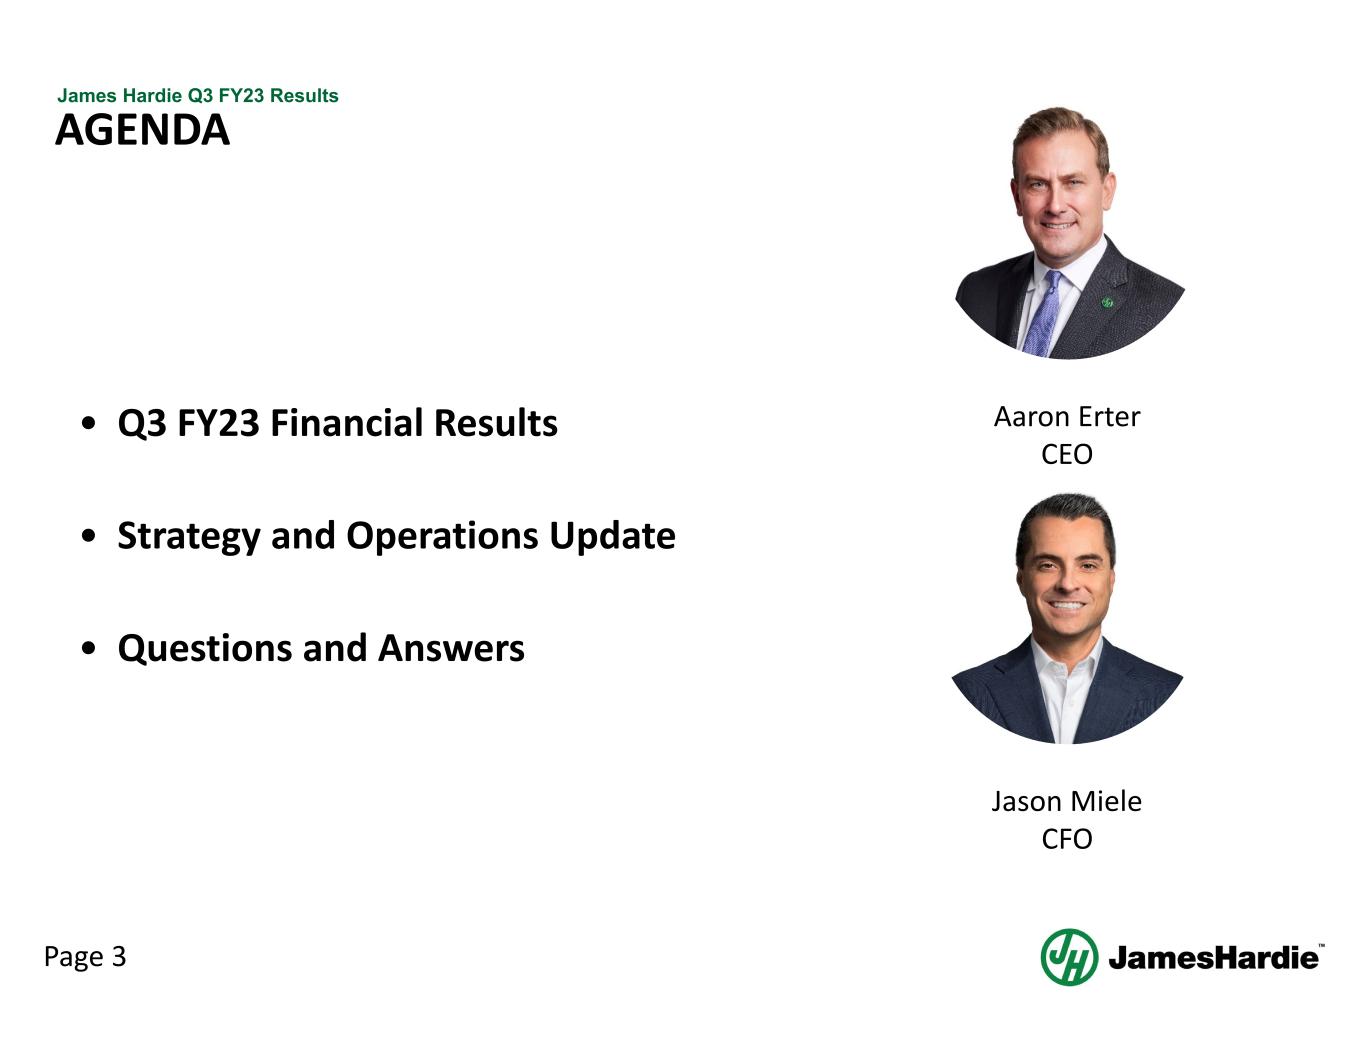
Page 3 James Hardie Q3 FY23 Results AGENDA • Q3 FY23 Financial Results • Strategy and Operations Update • Questions and Answers Aaron Erter CEO Jason Miele CFO

Q3 FY23 FINANCIAL RESULTS
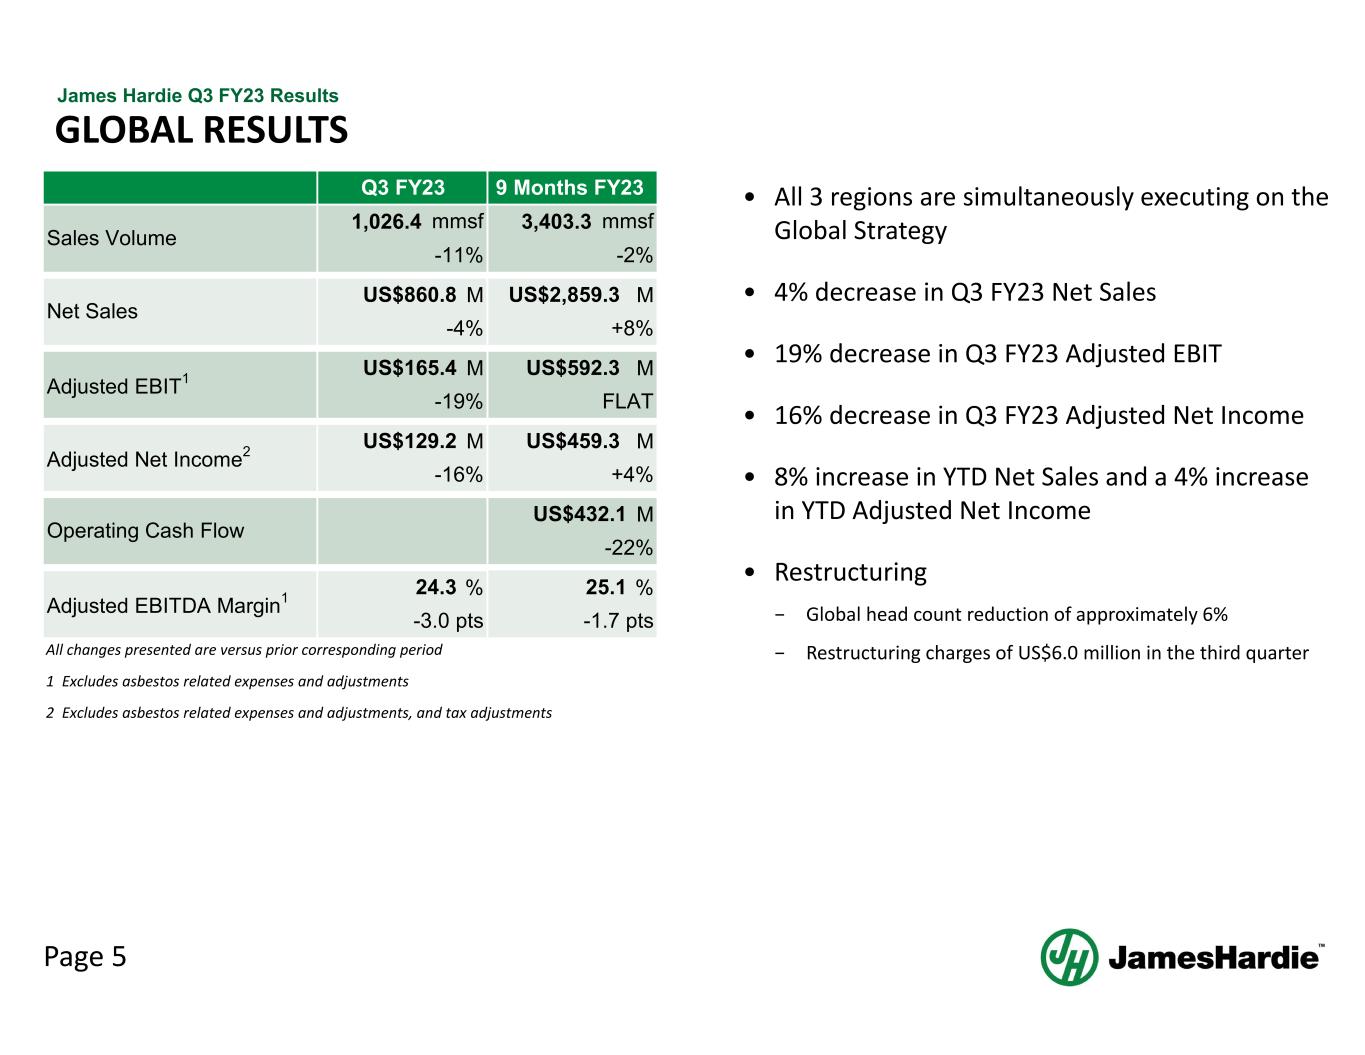
Page 5 James Hardie Q3 FY23 Results • All 3 regions are simultaneously executing on the Global Strategy • 4% decrease in Q3 FY23 Net Sales • 19% decrease in Q3 FY23 Adjusted EBIT • 16% decrease in Q3 FY23 Adjusted Net Income • 8% increase in YTD Net Sales and a 4% increase in YTD Adjusted Net Income • Restructuring − Global head count reduction of approximately 6% − Restructuring charges of US$6.0 million in the third quarter GLOBAL RESULTS M M M M M M M % % 1 Excludes asbestos related expenses and adjustments 2 Excludes asbestos related expenses and adjustments, and tax adjustments mmsf -2% US$2,859.3 +8% Adjusted EBITDA Margin1 24.3 -3.0 pts US$592.3 US$860.8 -4% -19% -11% All changes presented are versus prior corresponding period Operating Cash Flow Adjusted Net Income2 Adjusted EBIT1 Sales Volume Net Sales Q3 FY23 1,026.4 -16% US$165.4 mmsf US$129.2 9 Months FY23 3,403.3 -1.7 pts 25.1 FLAT US$459.3 +4% US$432.1 -22%
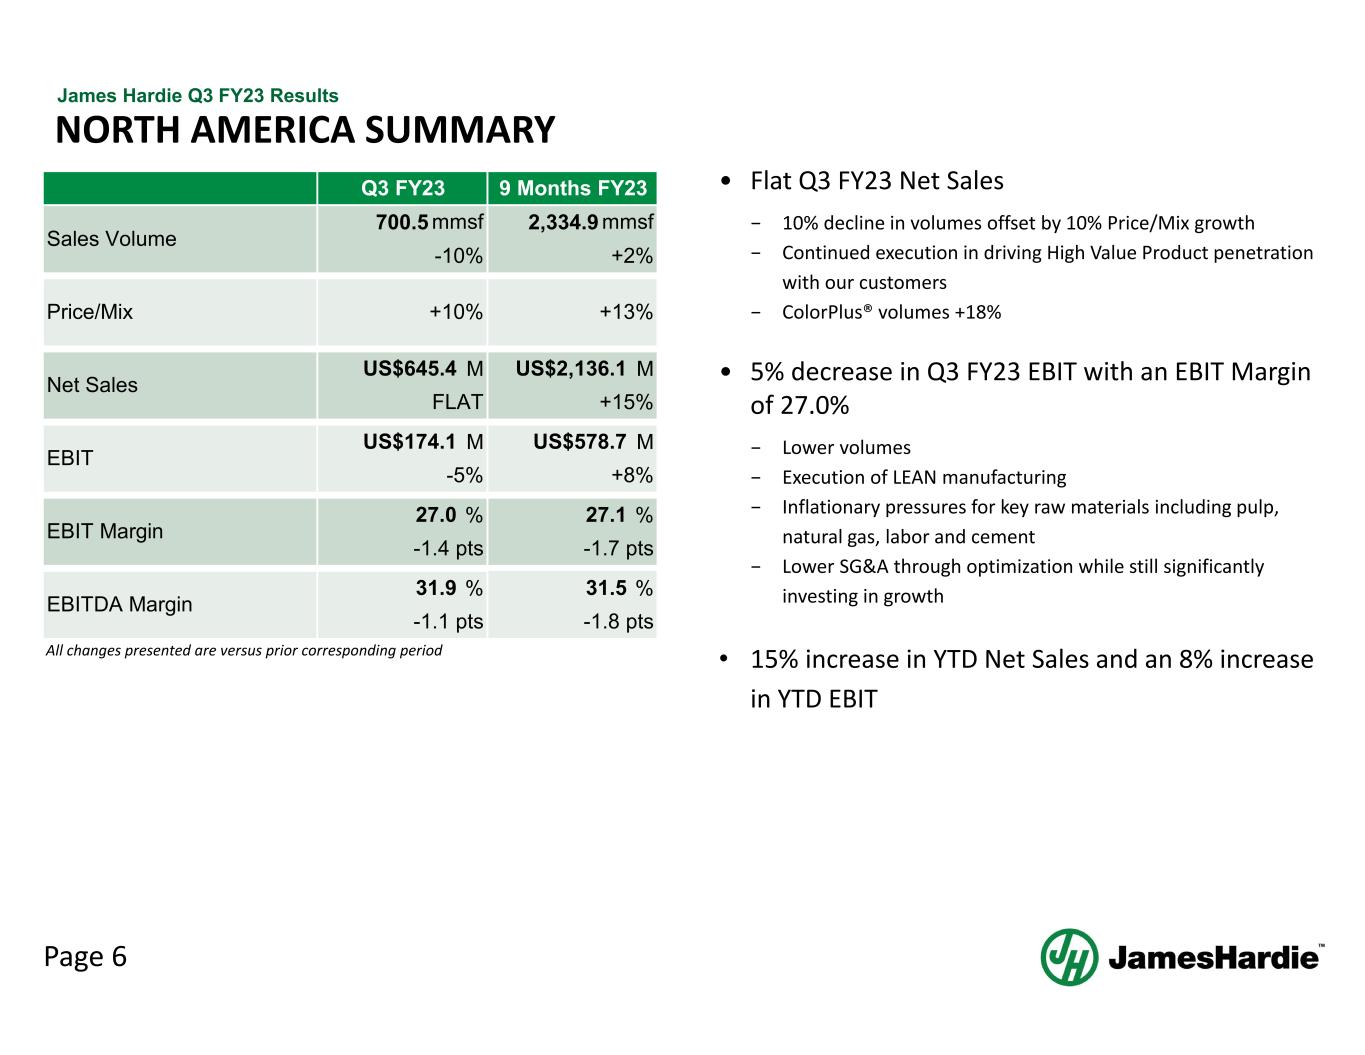
Page 6 James Hardie Q3 FY23 Results NORTH AMERICA SUMMARY • Flat Q3 FY23 Net Sales − 10% decline in volumes offset by 10% Price/Mix growth − Continued execution in driving High Value Product penetration with our customers − ColorPlus® volumes +18% • 5% decrease in Q3 FY23 EBIT with an EBIT Margin of 27.0% − Lower volumes − Execution of LEAN manufacturing − Inflationary pressures for key raw materials including pulp, natural gas, labor and cement − Lower SG&A through optimization while still significantly investing in growth • 15% increase in YTD Net Sales and an 8% increase in YTD EBIT M M M M % % % % Q3 FY23 700.5 mmsf -10% mmsf +2% 27.1 -1.7 pts EBITDA Margin 31.9 -1.1 pts +10%Price/Mix US$645.4 +13% Sales Volume Net Sales EBIT Margin EBIT 27.0 -1.4 pts US$174.1 -5% FLAT All changes presented are versus prior corresponding period 31.5 -1.8 pts US$2,136.1 +15% US$578.7 +8% 9 Months FY23 2,334.9
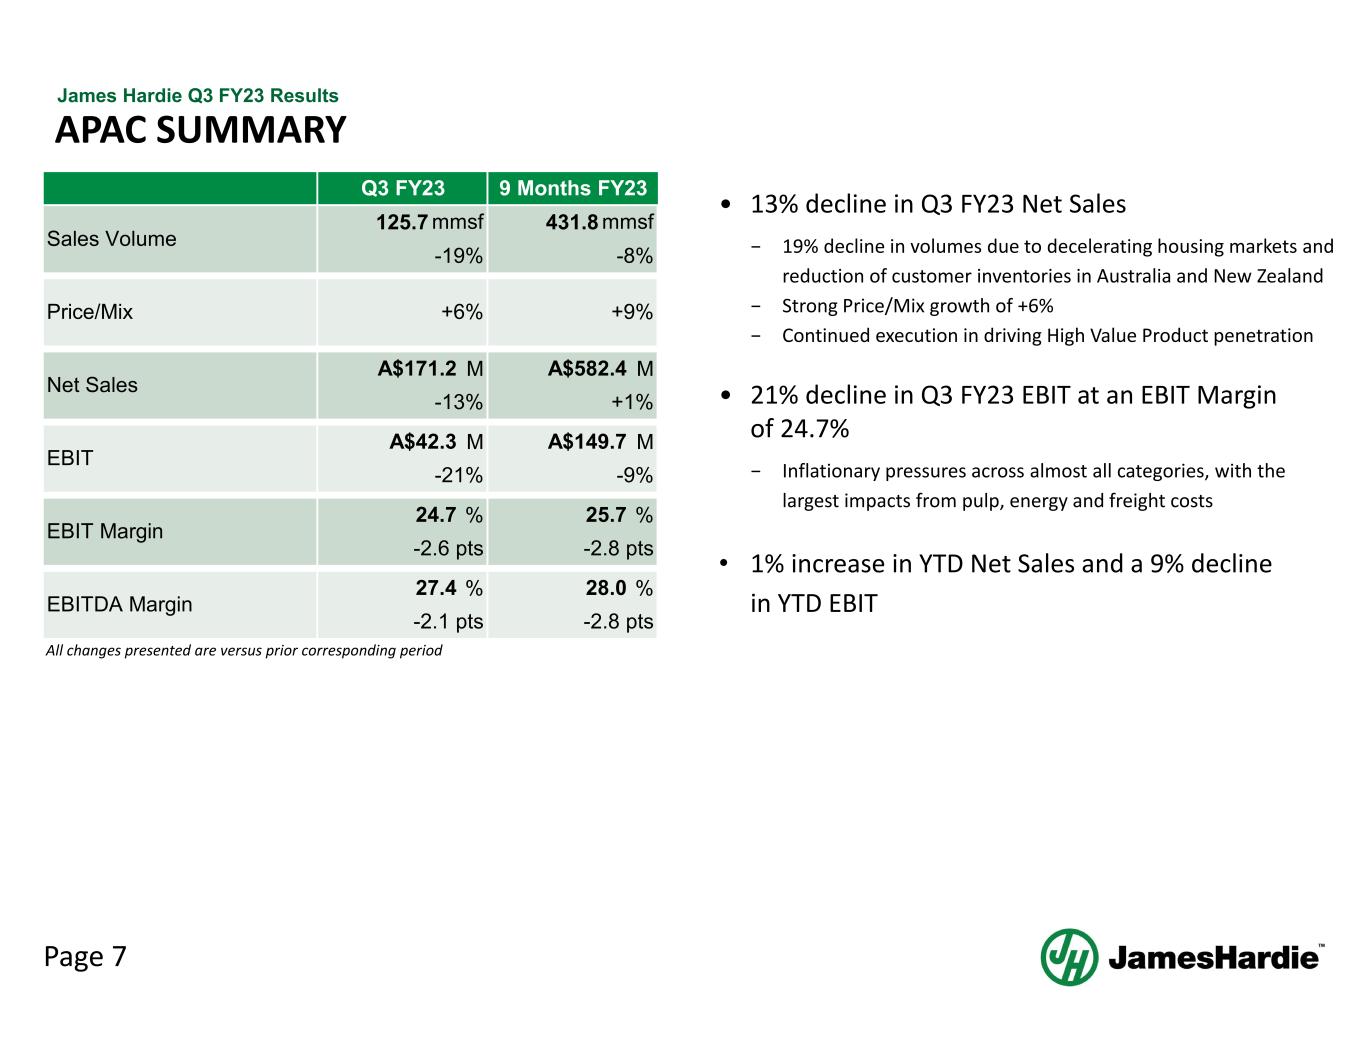
Page 7 James Hardie Q3 FY23 Results M M M M % % % % Q3 FY23 -19% EBIT Margin 24.7 Price/Mix -2.6 pts +6% EBIT A$42.3 -21% Net Sales A$171.2 -13% Sales Volume 125.7 mmsf 25.7 -2.8 pts 28.0 9 Months FY23 431.8 mmsf -8% 27.4 A$582.4 +1% +9% -2.8 pts A$149.7 -9% EBITDA Margin -2.1 pts All changes presented are versus prior corresponding period APAC SUMMARY • 13% decline in Q3 FY23 Net Sales − 19% decline in volumes due to decelerating housing markets and reduction of customer inventories in Australia and New Zealand − Strong Price/Mix growth of +6% − Continued execution in driving High Value Product penetration • 21% decline in Q3 FY23 EBIT at an EBIT Margin of 24.7% − Inflationary pressures across almost all categories, with the largest impacts from pulp, energy and freight costs • 1% increase in YTD Net Sales and a 9% decline in YTD EBIT
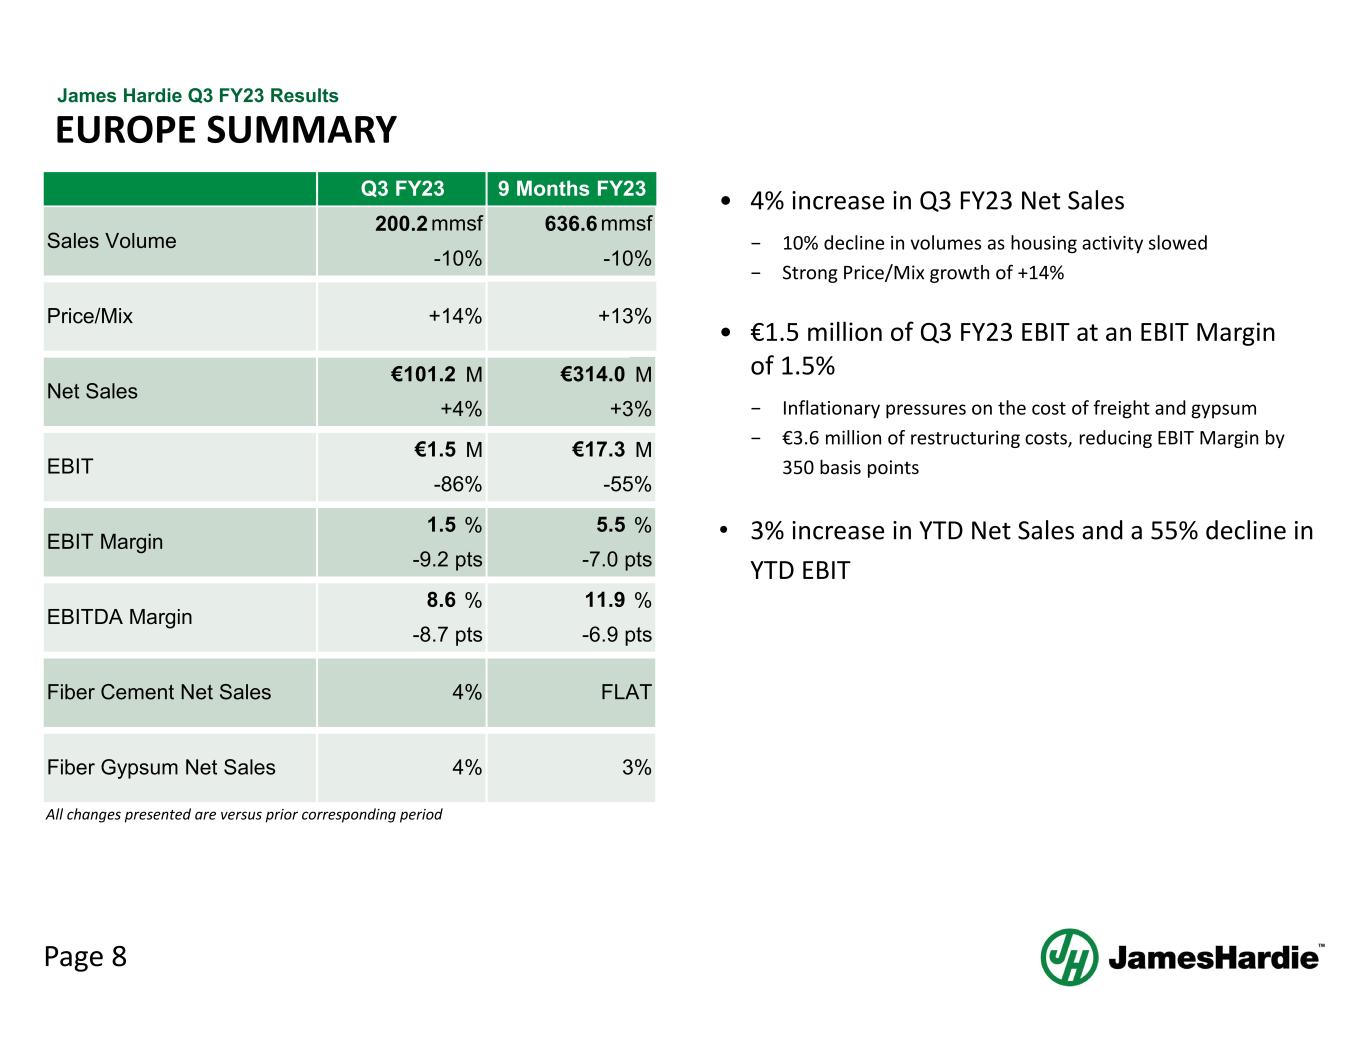
Page 8 James Hardie Q3 FY23 Results M M M M % % % % Net Sales +4% €101.2 +14% EBITDA Margin 8.6 -8.7 pts EBIT EBIT Margin 1.5 Price/Mix Q3 FY23 Sales Volume 200.2 mmsf -10% 11.9 -6.9 pts 9 Months FY23 636.6 mmsf -10% €314.0 +3% €17.3 -55% Fiber Gypsum Net Sales Fiber Cement Net Sales All changes presented are versus prior corresponding period +13% 4% FLAT 4% 3% 5.5 -7.0 pts-9.2 pts €1.5 -86% EUROPE SUMMARY • 4% increase in Q3 FY23 Net Sales − 10% decline in volumes as housing activity slowed − Strong Price/Mix growth of +14% • €1.5 million of Q3 FY23 EBIT at an EBIT Margin of 1.5% − Inflationary pressures on the cost of freight and gypsum − €3.6 million of restructuring costs, reducing EBIT Margin by 350 basis points • 3% increase in YTD Net Sales and a 55% decline in YTD EBIT
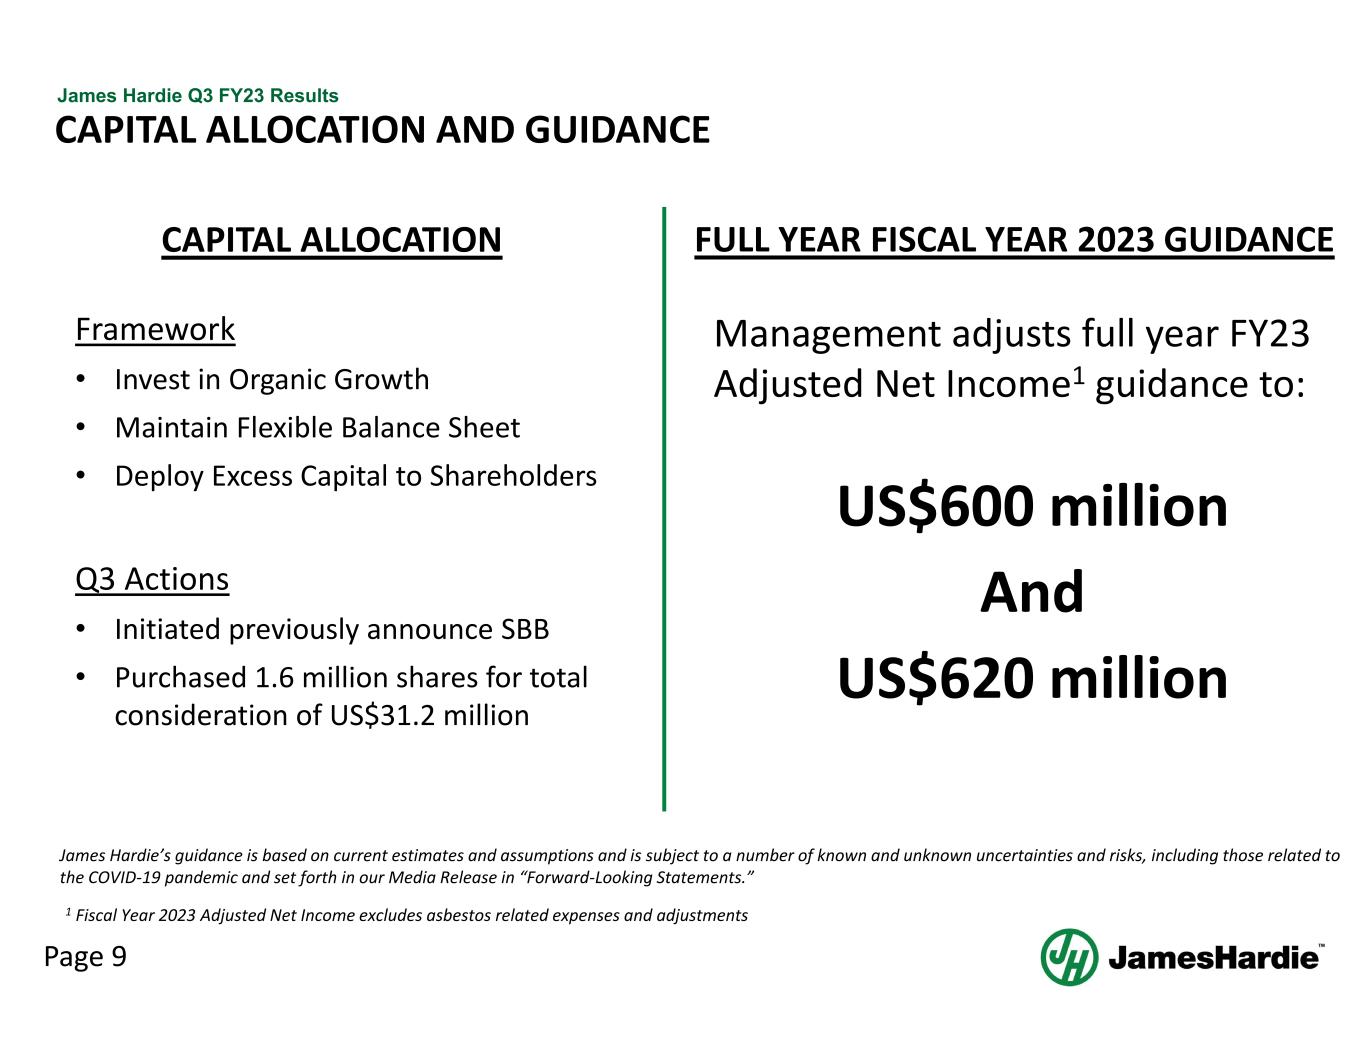
Page 9 James Hardie Q3 FY23 Results CAPITAL ALLOCATION AND GUIDANCE Management adjusts full year FY23 Adjusted Net Income1 guidance to: US$600 million And US$620 million Framework • Invest in Organic Growth • Maintain Flexible Balance Sheet • Deploy Excess Capital to Shareholders Q3 Actions • Initiated previously announce SBB • Purchased 1.6 million shares for total consideration of US$31.2 million James Hardie’s guidance is based on current estimates and assumptions and is subject to a number of known and unknown uncertainties and risks, including those related to the COVID‐19 pandemic and set forth in our Media Release in “Forward‐Looking Statements.” 1 Fiscal Year 2023 Adjusted Net Income excludes asbestos related expenses and adjustments FULL YEAR FISCAL YEAR 2023 GUIDANCECAPITAL ALLOCATION

STRATEGY AND OPERATIONS UPDATE
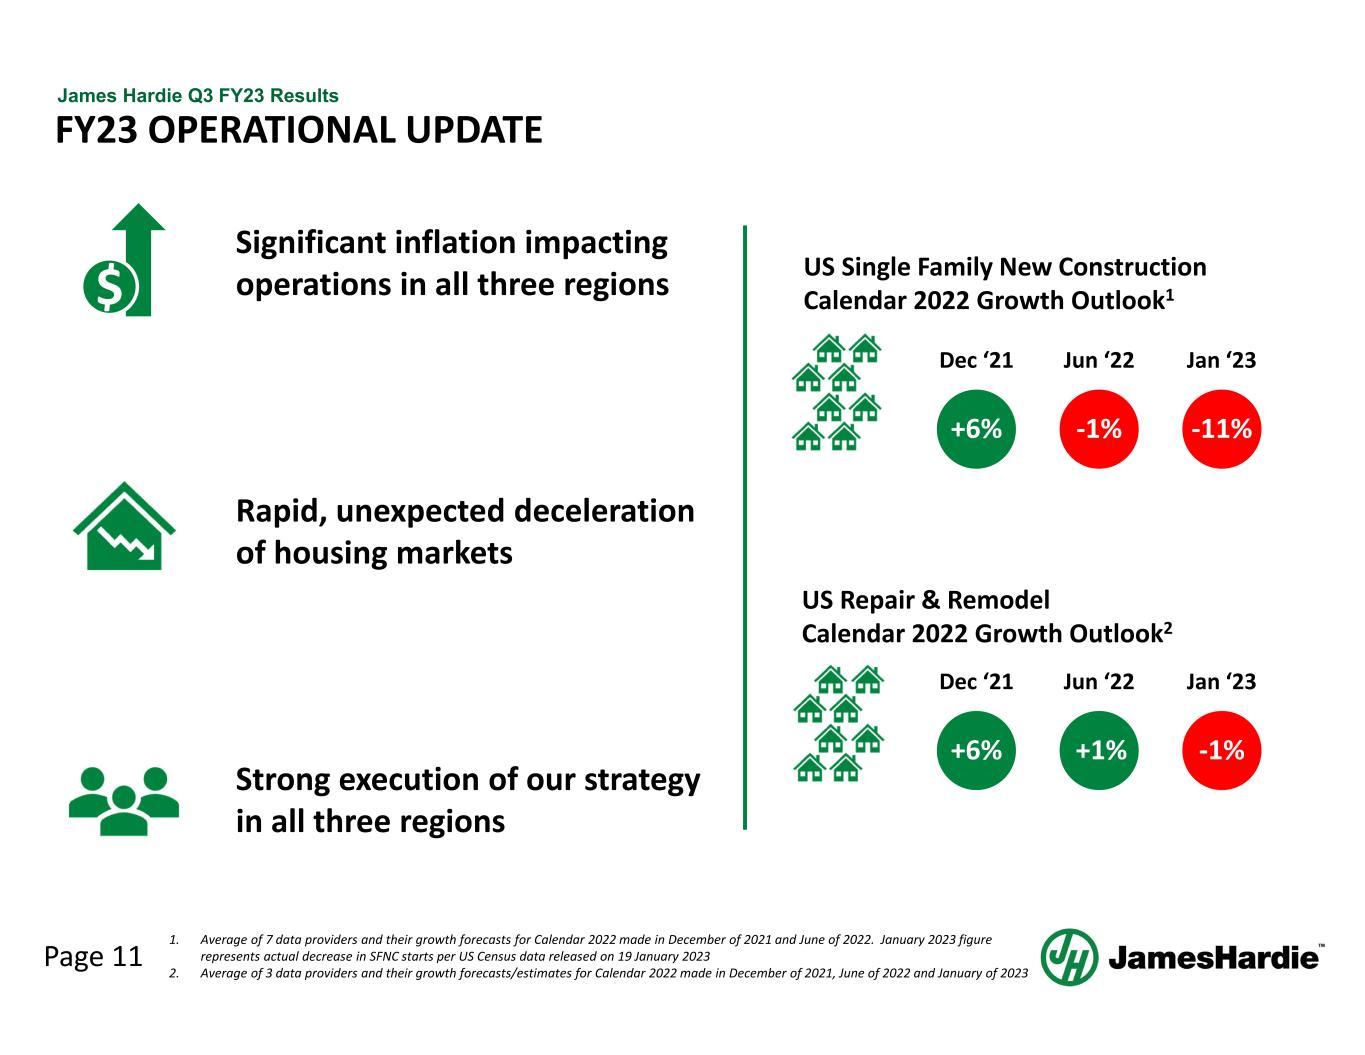
Page 11 James Hardie Q3 FY23 Results FY23 OPERATIONAL UPDATE Significant inflation impacting operations in all three regions Rapid, unexpected deceleration of housing markets Strong execution of our strategy in all three regions $ US Single Family New Construction Calendar 2022 Growth Outlook1 Dec ‘21 +6% Jan ‘23 ‐11% 1. Average of 7 data providers and their growth forecasts for Calendar 2022 made in December of 2021 and June of 2022. January 2023 figure represents actual decrease in SFNC starts per US Census data released on 19 January 2023 2. Average of 3 data providers and their growth forecasts/estimates for Calendar 2022 made in December of 2021, June of 2022 and January of 2023 US Repair & Remodel Calendar 2022 Growth Outlook2 Jun ‘22 ‐1% +5%+11% Dec ‘21 +6% Jan ‘23 ‐1% Jun ‘22 1
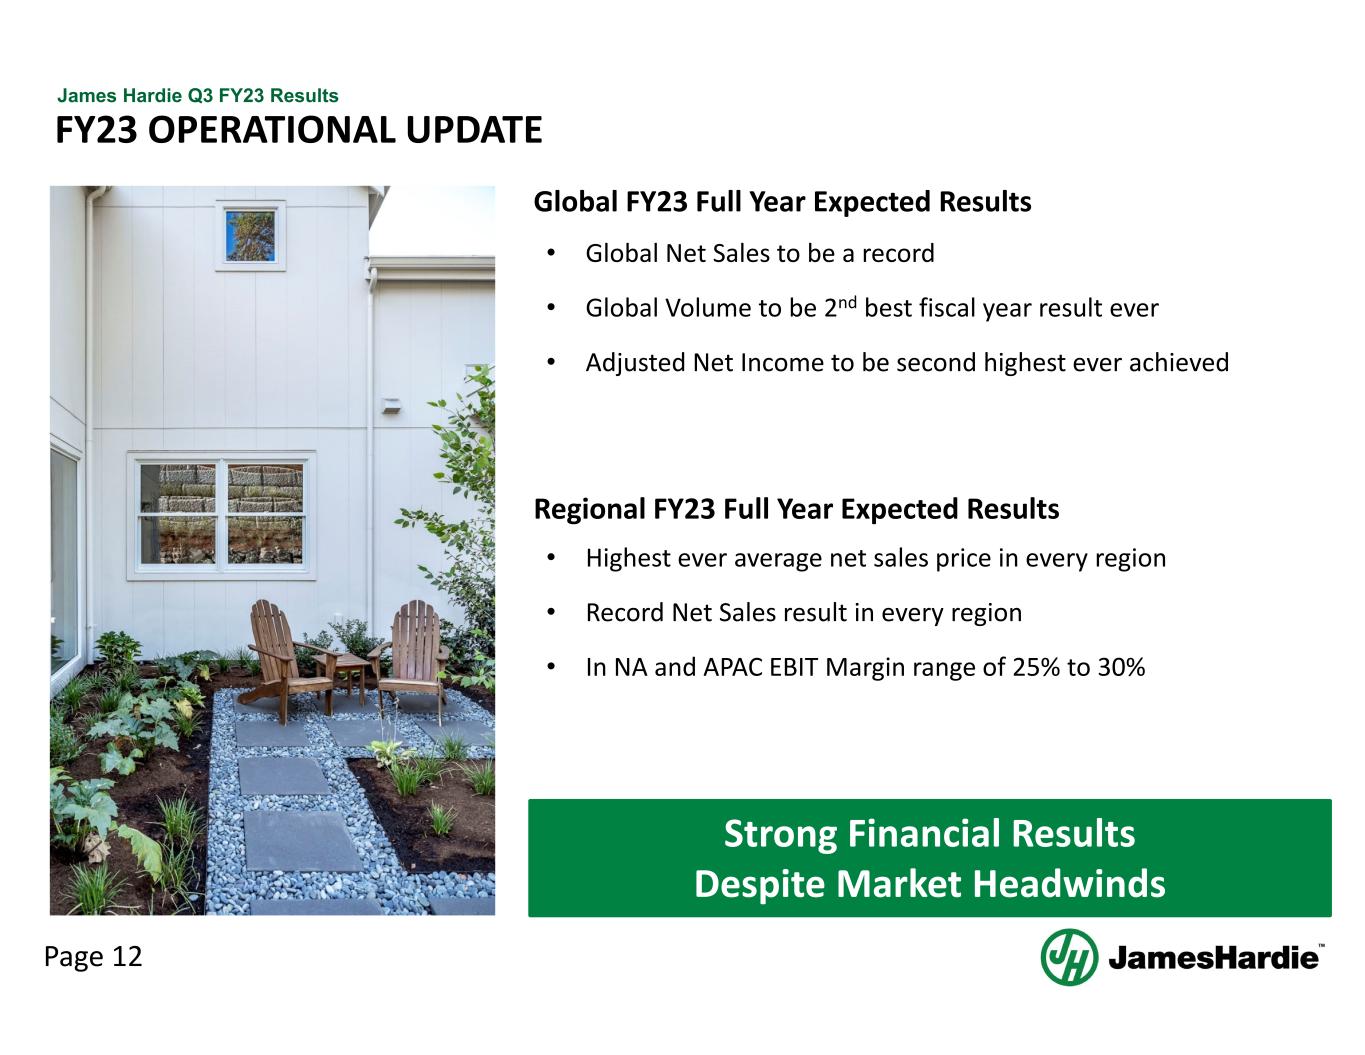
Page 12 James Hardie Q3 FY23 Results FY23 OPERATIONAL UPDATE Strong Financial Results Despite Market Headwinds • Global Net Sales to be a record • Global Volume to be 2nd best fiscal year result ever • Adjusted Net Income to be second highest ever achieved Global FY23 Full Year Expected Results • Highest ever average net sales price in every region • Record Net Sales result in every region • In NA and APAC EBIT Margin range of 25% to 30% Regional FY23 Full Year Expected Results
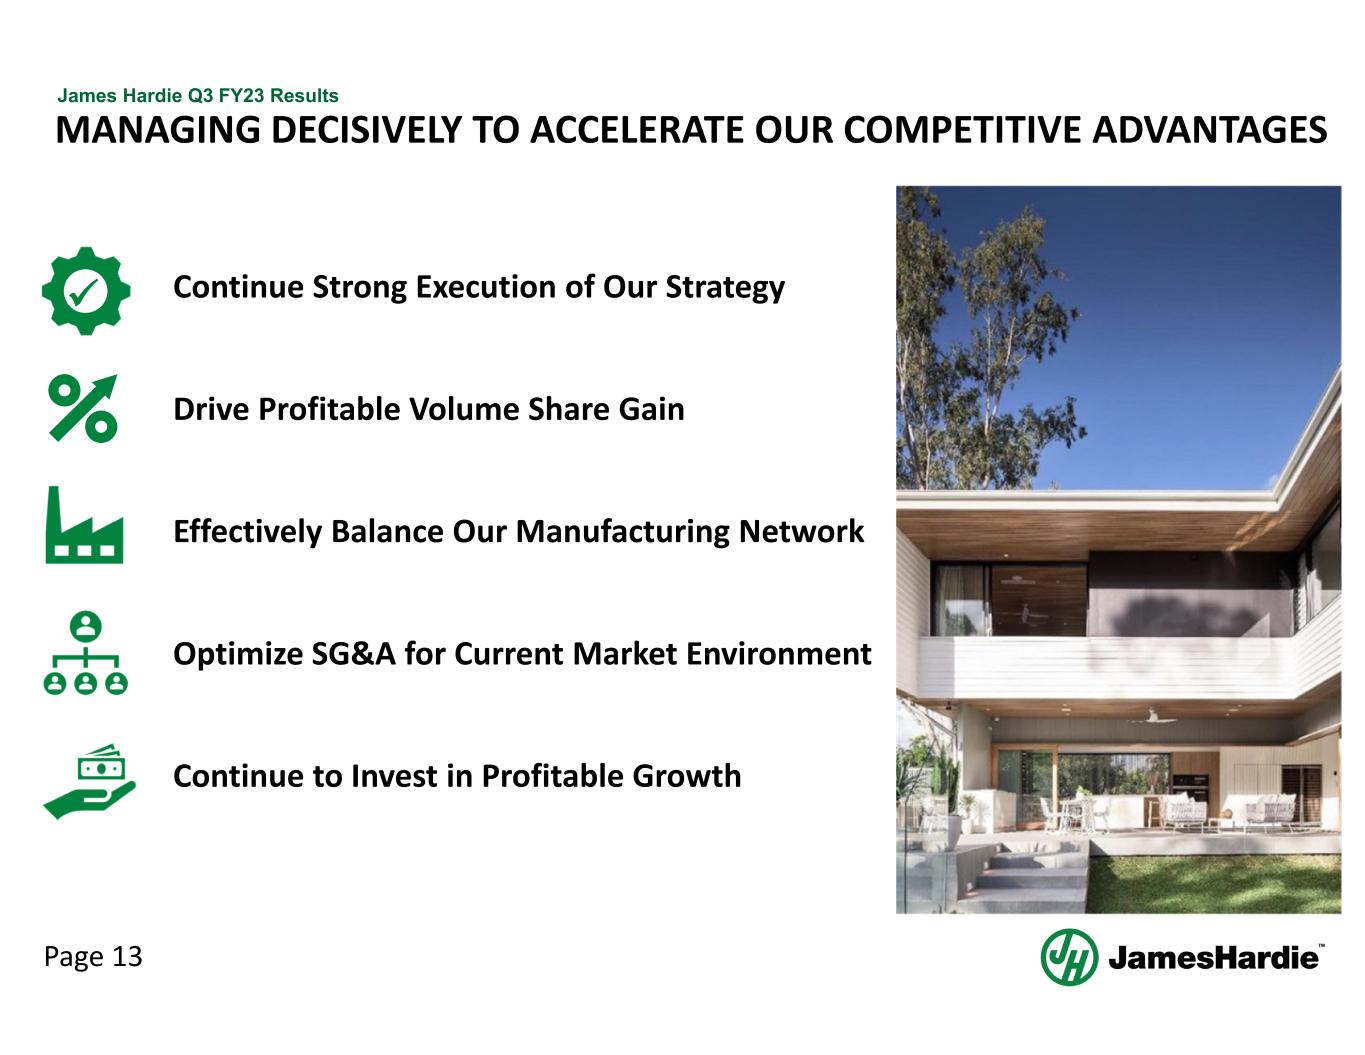
Page 13 James Hardie Q3 FY23 Results MANAGING DECISIVELY TO ACCELERATE OUR COMPETITIVE ADVANTAGES Continue Strong Execution of Our Strategy Drive Profitable Volume Share Gain Effectively Balance Our Manufacturing Network Optimize SG&A for Current Market Environment Continue to Invest in Profitable Growth
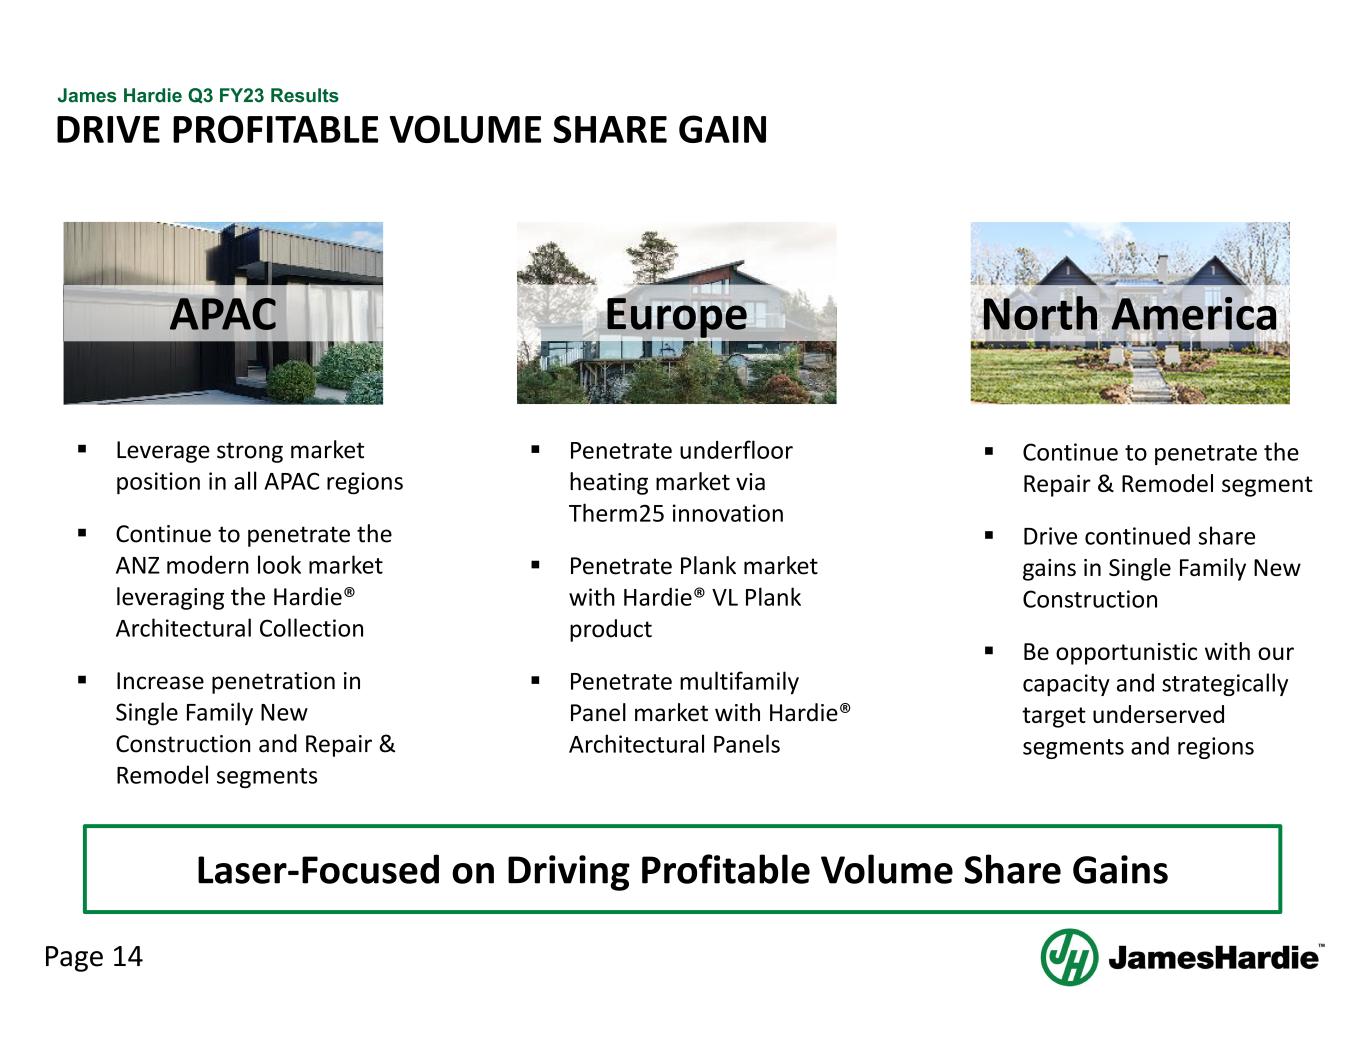
Page 14 James Hardie Q3 FY23 Results Europe North AmericaAPAC DRIVE PROFITABLE VOLUME SHARE GAIN Laser‐Focused on Driving Profitable Volume Share Gains Penetrate underfloor heating market via Therm25 innovation Penetrate Plank market with Hardie® VL Plank product Penetrate multifamily Panel market with Hardie® Architectural Panels Continue to penetrate the Repair & Remodel segment Drive continued share gains in Single Family New Construction Be opportunistic with our capacity and strategically target underserved segments and regions Leverage strong market position in all APAC regions Continue to penetrate the ANZ modern look market leveraging the Hardie® Architectural Collection Increase penetration in Single Family New Construction and Repair & Remodel segments
Page 15 James Hardie Q3 FY23 Results DRIVE PROFITABLE VOLUME SHARE GAIN – NORTH AMERICA NEW CONSTRUCTION Aggressively Driving Profitable Volume Share Gain 1. JH Estimates Secured contracts with 24 of the top 25 national builders Leveraging our best‐in‐class products and solutions to meet our changing customers needs Key Accomplishments~35%1 of James Hardie Volume is New Construction vs ~65%1 R&R Deploying largest and most knowledgeable sales team in the category Leverage tactical pricing as necessary Continue to convert competitive siding materials and substrates Named vendor of the year by 4 customers/builders

Page 16 James Hardie Q3 FY23 Results EFFECTIVELY BALANCE OUR MANUFACTURING NETWORK Leveraging Embedded HMOS Discipline Globally Effectively Balance Our Manufacturing Organization to Better Align Supply With Demand APACNorth America Europe Deliver a lower cost per unit Retain flexibility to adjust production upwards as market conditions warrant Leverage our localized supply chain to minimize costs and ensure timely delivery of products and solutions
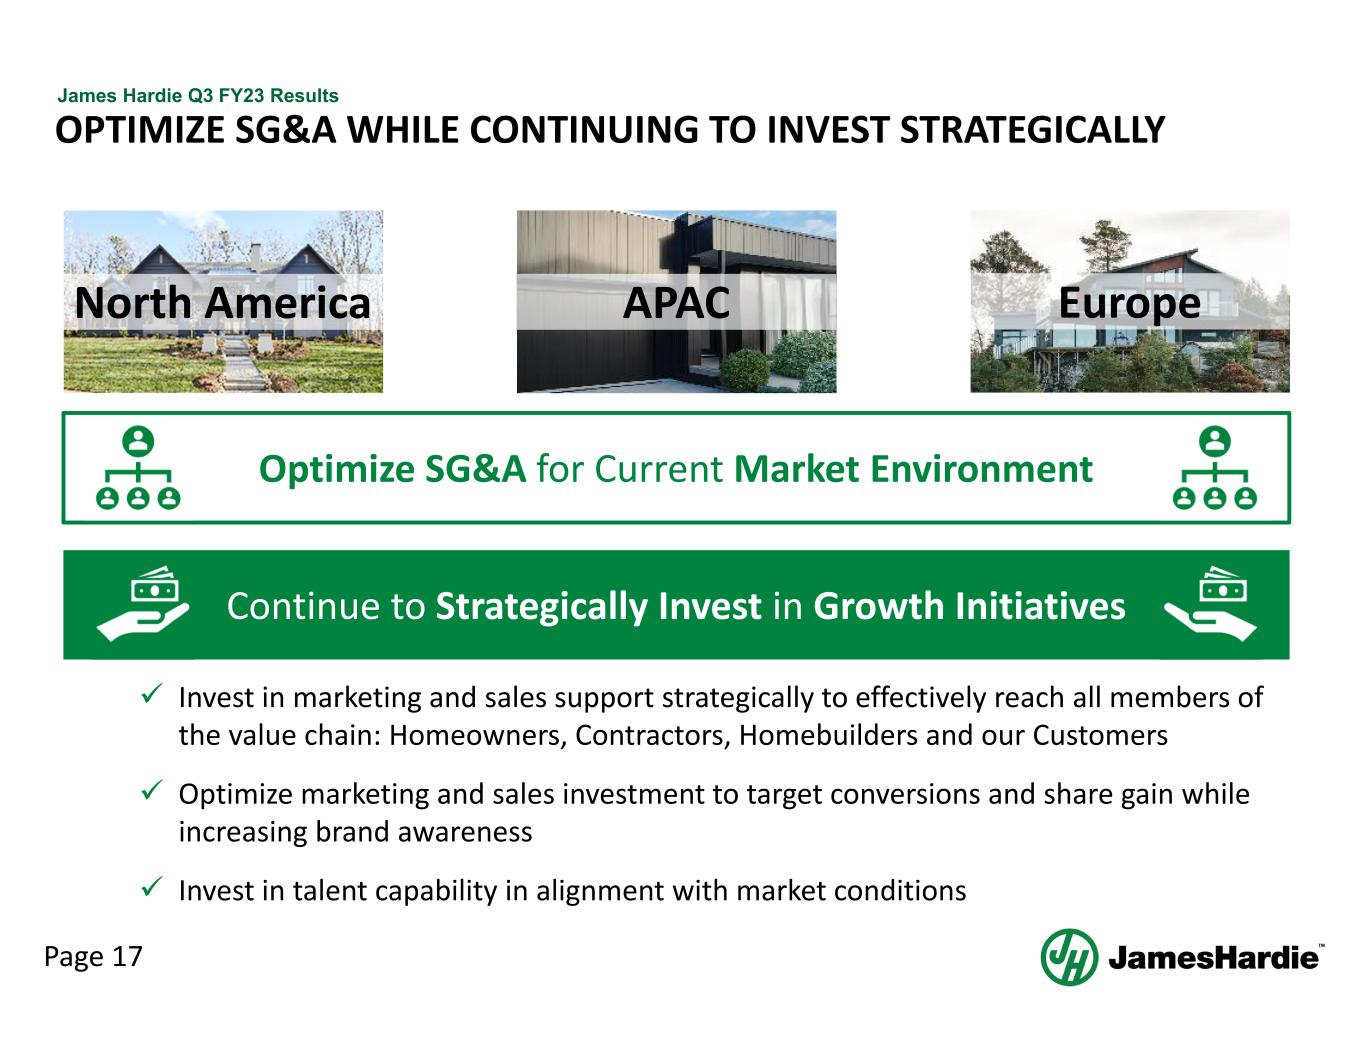
Page 17 James Hardie Q3 FY23 Results OPTIMIZE SG&A WHILE CONTINUING TO INVEST STRATEGICALLY Optimize SG&A for Current Market Environment APACNorth America Europe Invest in marketing and sales support strategically to effectively reach all members of the value chain: Homeowners, Contractors, Homebuilders and our Customers Optimize marketing and sales investment to target conversions and share gain while increasing brand awareness Invest in talent capability in alignment with market conditions Continue to Strategically Invest in Growth Initiatives
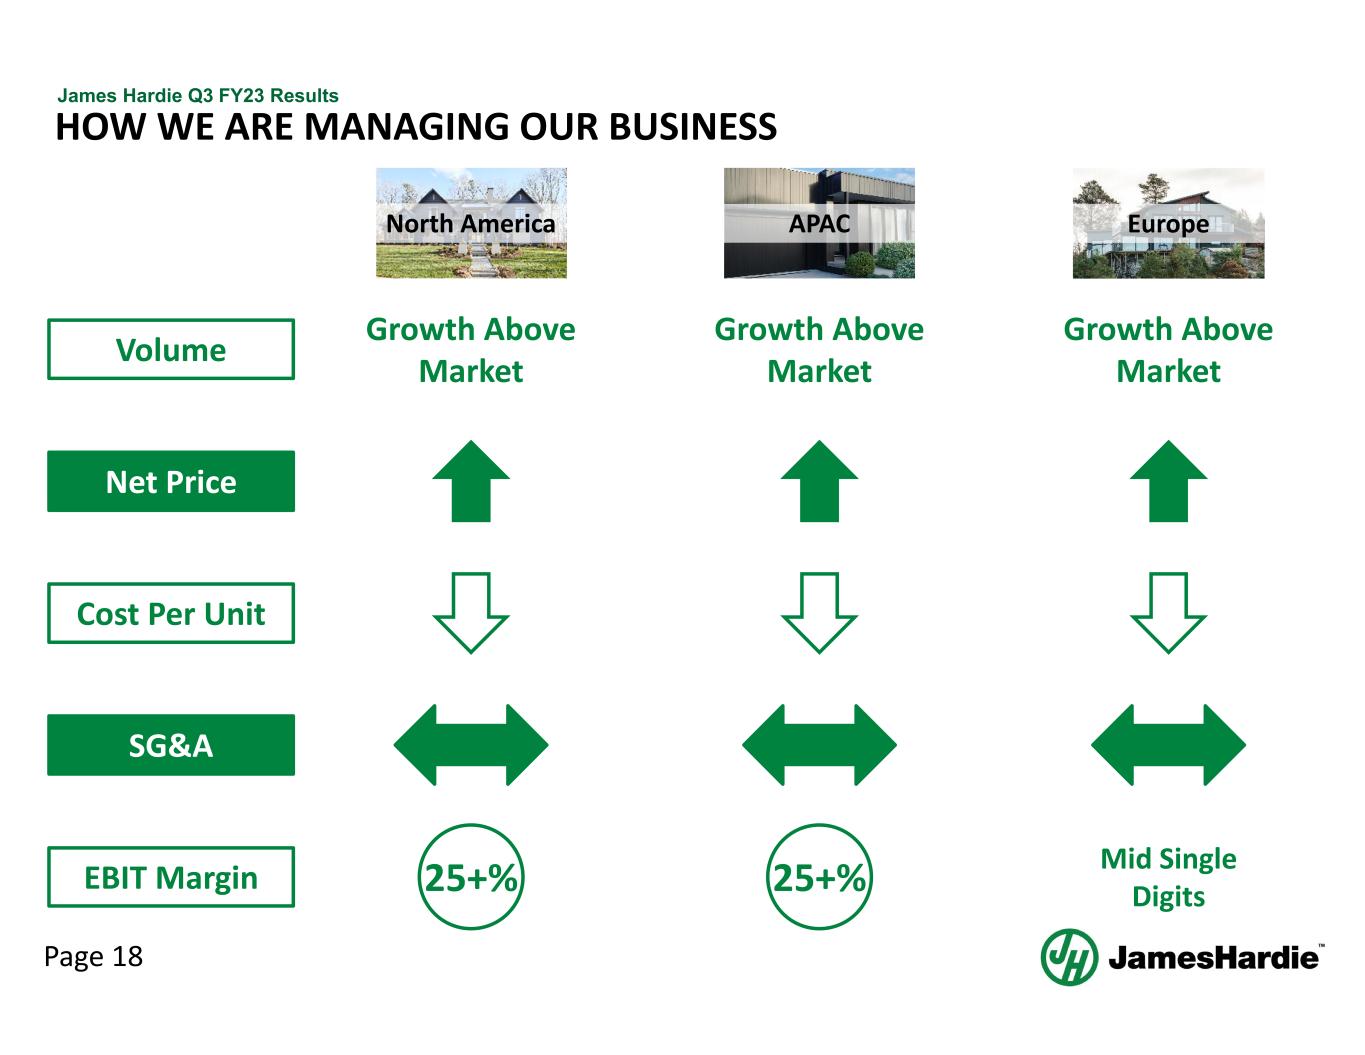
Page 18 James Hardie Q3 FY23 Results HOW WE ARE MANAGING OUR BUSINESS Net Price EBIT Margin North America APAC Europe 25+% Cost Per Unit SG&A 25+% Mid Single Digits Volume Growth Above Market Growth Above Market Growth Above Market
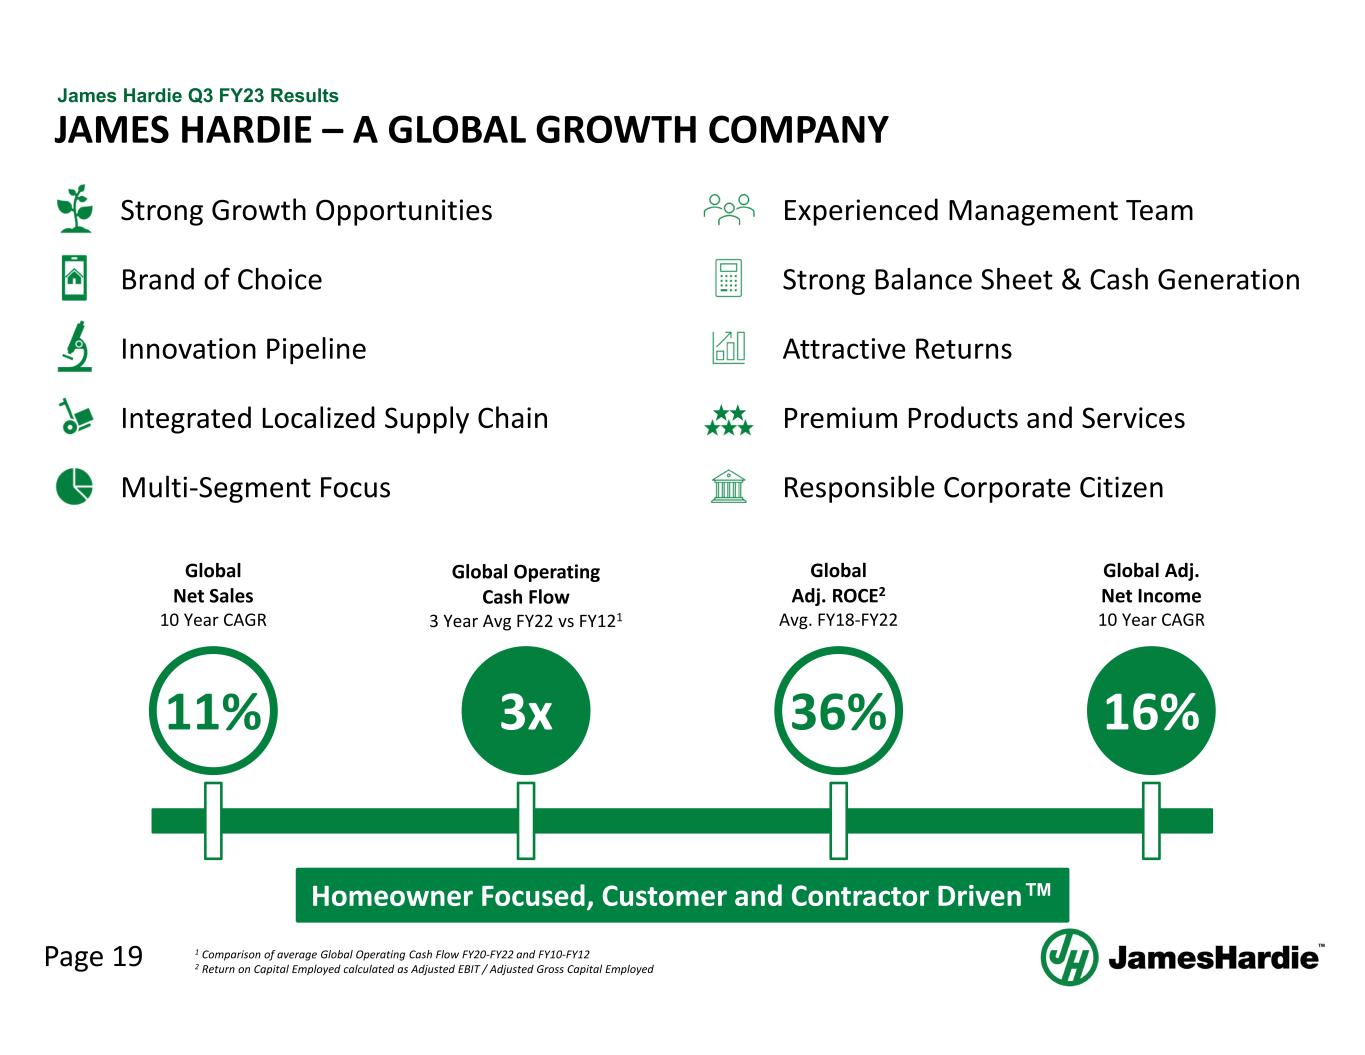
Page 19 James Hardie Q3 FY23 Results JAMES HARDIE – A GLOBAL GROWTH COMPANY Homeowner Focused, Customer and Contractor Driven™ 1 Comparison of average Global Operating Cash Flow FY20‐FY22 and FY10‐FY12 2 Return on Capital Employed calculated as Adjusted EBIT / Adjusted Gross Capital Employed Strong Growth Opportunities Brand of Choice Innovation Pipeline Integrated Localized Supply Chain Multi‐Segment Focus Experienced Management Team Strong Balance Sheet & Cash Generation Attractive Returns Premium Products and Services Responsible Corporate Citizen Global Net Sales 10 Year CAGR 11% 16% Global Adj. Net Income 10 Year CAGR 3x Global Operating Cash Flow 3 Year Avg FY22 vs FY121 Global Adj. ROCE2 Avg. FY18‐FY22 36%

QUESTIONS
APPENDIX
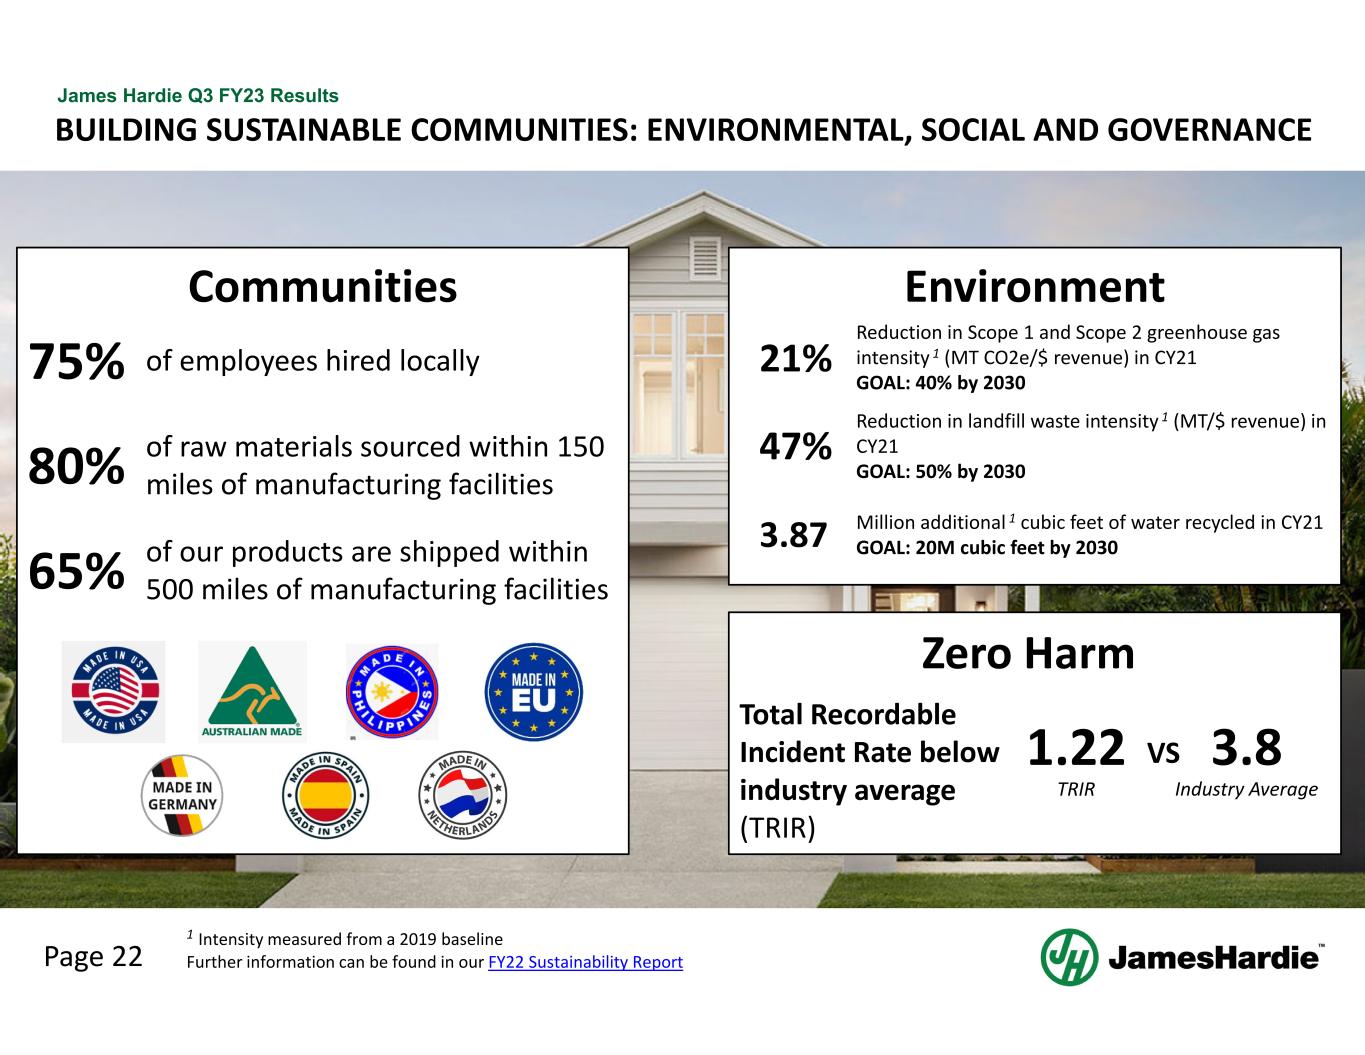
Page 22 James Hardie Q3 FY23 Results BUILDING SUSTAINABLE COMMUNITIES: ENVIRONMENTAL, SOCIAL AND GOVERNANCE 80% of raw materials sourced within 150 miles of manufacturing facilities 75% of employees hired locally 65% of our products are shipped within 500 miles of manufacturing facilities Total Recordable Incident Rate below industry average (TRIR) 1.22 TRIR Environment Zero Harm Communities 1 Intensity measured from a 2019 baseline Further information can be found in our FY22 Sustainability Report 3.8 Industry Average VS Reduction in Scope 1 and Scope 2 greenhouse gas intensity 1 (MT CO2e/$ revenue) in CY21 GOAL: 40% by 2030 21% Reduction in landfill waste intensity 1 (MT/$ revenue) in CY21 GOAL: 50% by 2030 47% Million additional 1 cubic feet of water recycled in CY21 GOAL: 20M cubic feet by 20303.87
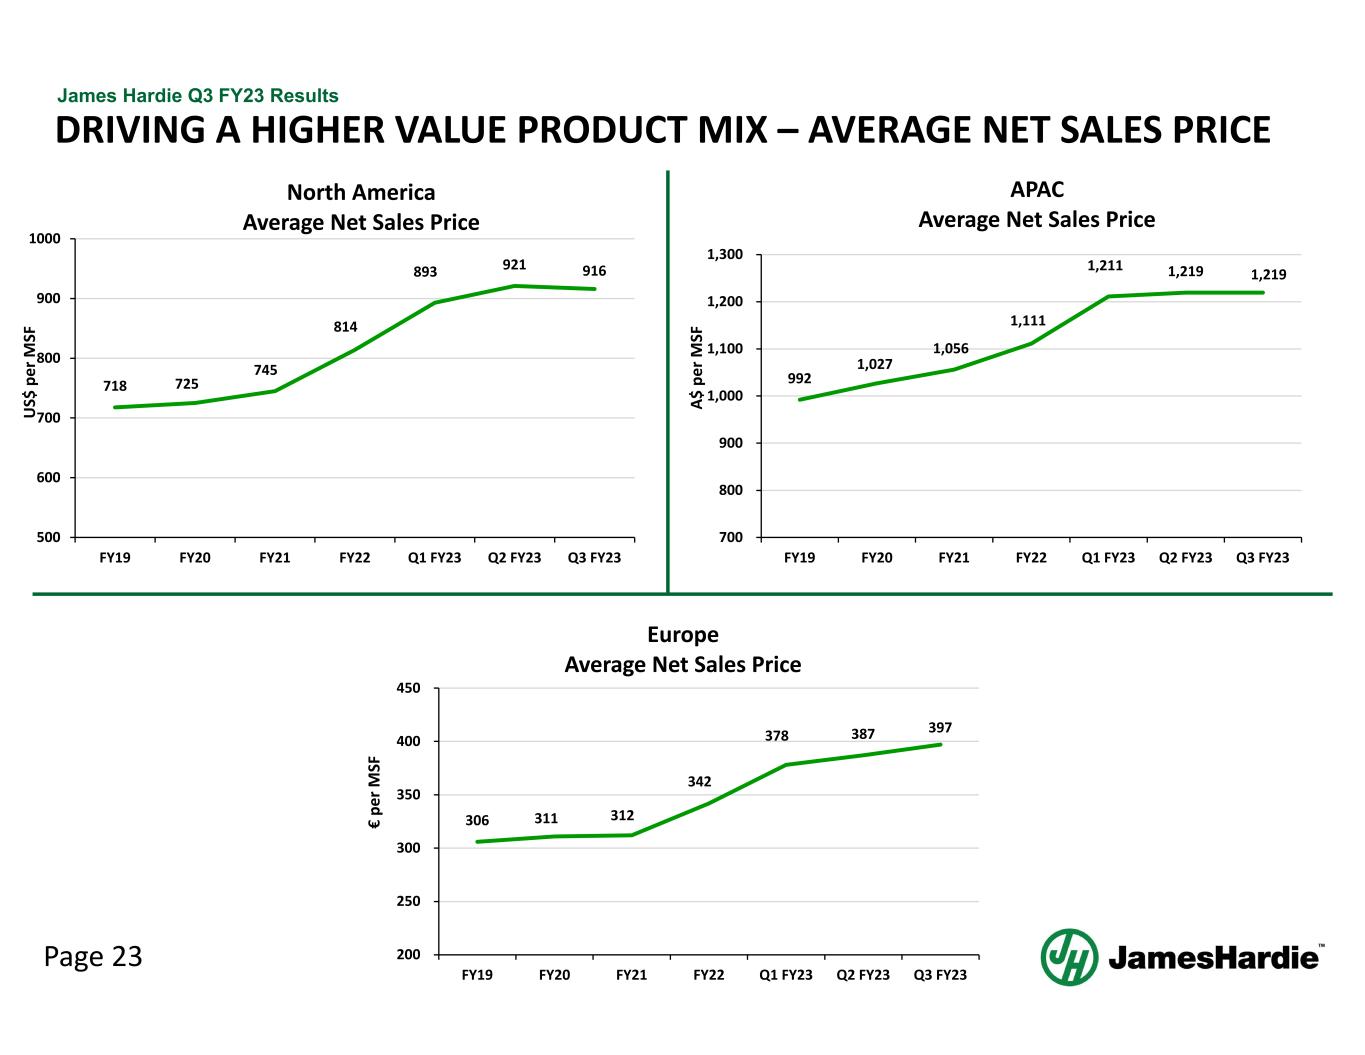
Page 23 James Hardie Q3 FY23 Results DRIVING A HIGHER VALUE PRODUCT MIX – AVERAGE NET SALES PRICE 718 725 745 814 893 921 916 500 600 700 800 900 1000 FY19 FY20 FY21 FY22 Q1 FY23 Q2 FY23 Q3 FY23 U S$ p er M SF North America Average Net Sales Price 992 1,027 1,056 1,111 1,211 1,219 1,219 700 800 900 1,000 1,100 1,200 1,300 FY19 FY20 FY21 FY22 Q1 FY23 Q2 FY23 Q3 FY23 A$ p er M SF APAC Average Net Sales Price 306 311 312 342 378 387 397 200 250 300 350 400 450 FY19 FY20 FY21 FY22 Q1 FY23 Q2 FY23 Q3 FY23 € pe r M SF Europe Average Net Sales Price
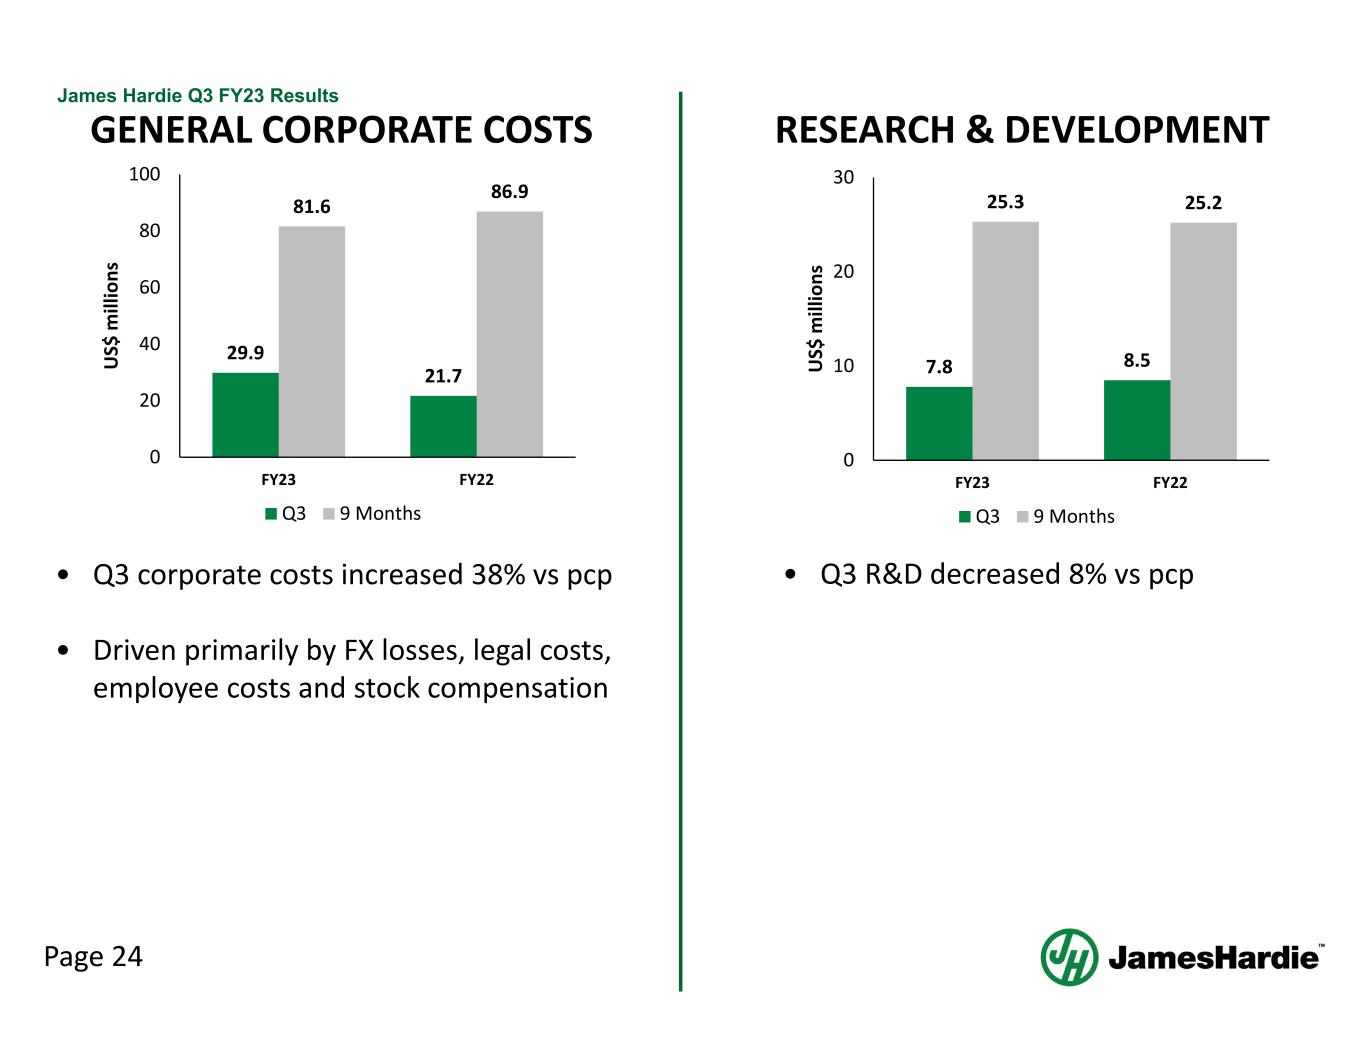
Page 24 James Hardie Q3 FY23 Results GENERAL CORPORATE COSTS • Q3 corporate costs increased 38% vs pcp • Driven primarily by FX losses, legal costs, employee costs and stock compensation • Q3 R&D decreased 8% vs pcp RESEARCH & DEVELOPMENT 29.9 21.7 81.6 86.9 0 20 40 60 80 100 FY23 FY22 U S$ m ill io ns Q3 9 Months 7.8 8.5 25.3 25.2 0 10 20 30 FY23 FY22 U S$ m ill io ns Q3 9 Months
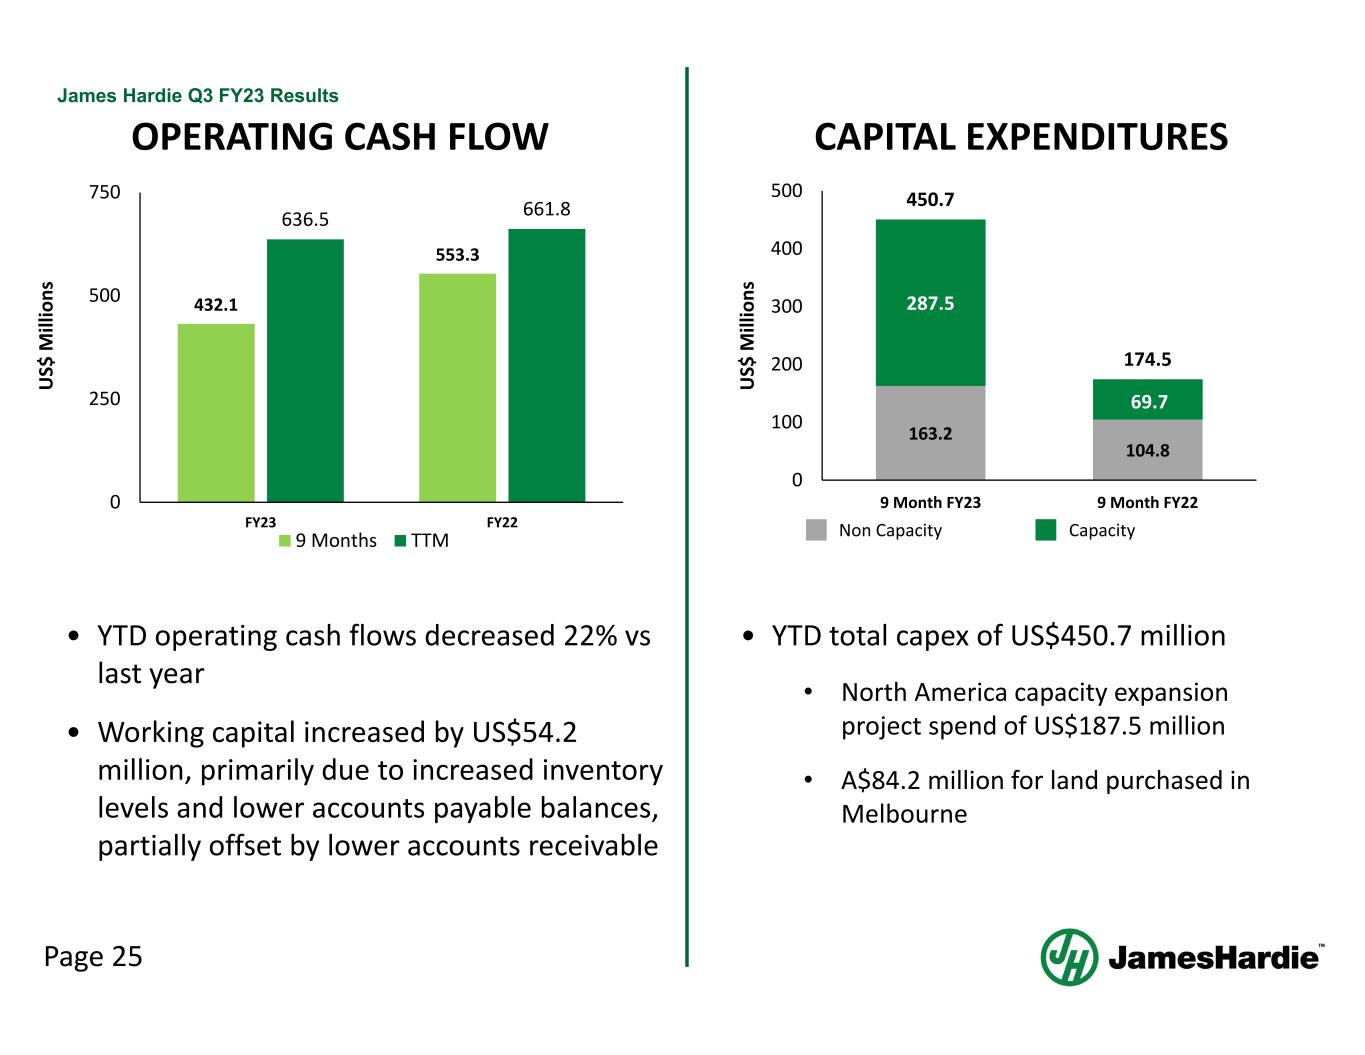
Page 25 James Hardie Q3 FY23 Results 1 OPERATING CASH FLOW CAPITAL EXPENDITURES • YTD total capex of US$450.7 million • North America capacity expansion project spend of US$187.5 million • A$84.2 million for land purchased in Melbourne • YTD operating cash flows decreased 22% vs last year • Working capital increased by US$54.2 million, primarily due to increased inventory levels and lower accounts payable balances, partially offset by lower accounts receivable U S$ M ill io ns 432.1 553.3 636.5 661.8 0 250 500 750 FY23 FY22 9 Months TTM 163.2 104.8 287.5 69.7 450.7 174.5 0 100 200 300 400 500 9 Month FY23 9 Month FY22 U S$ M ill io ns Non Capacity Capacity
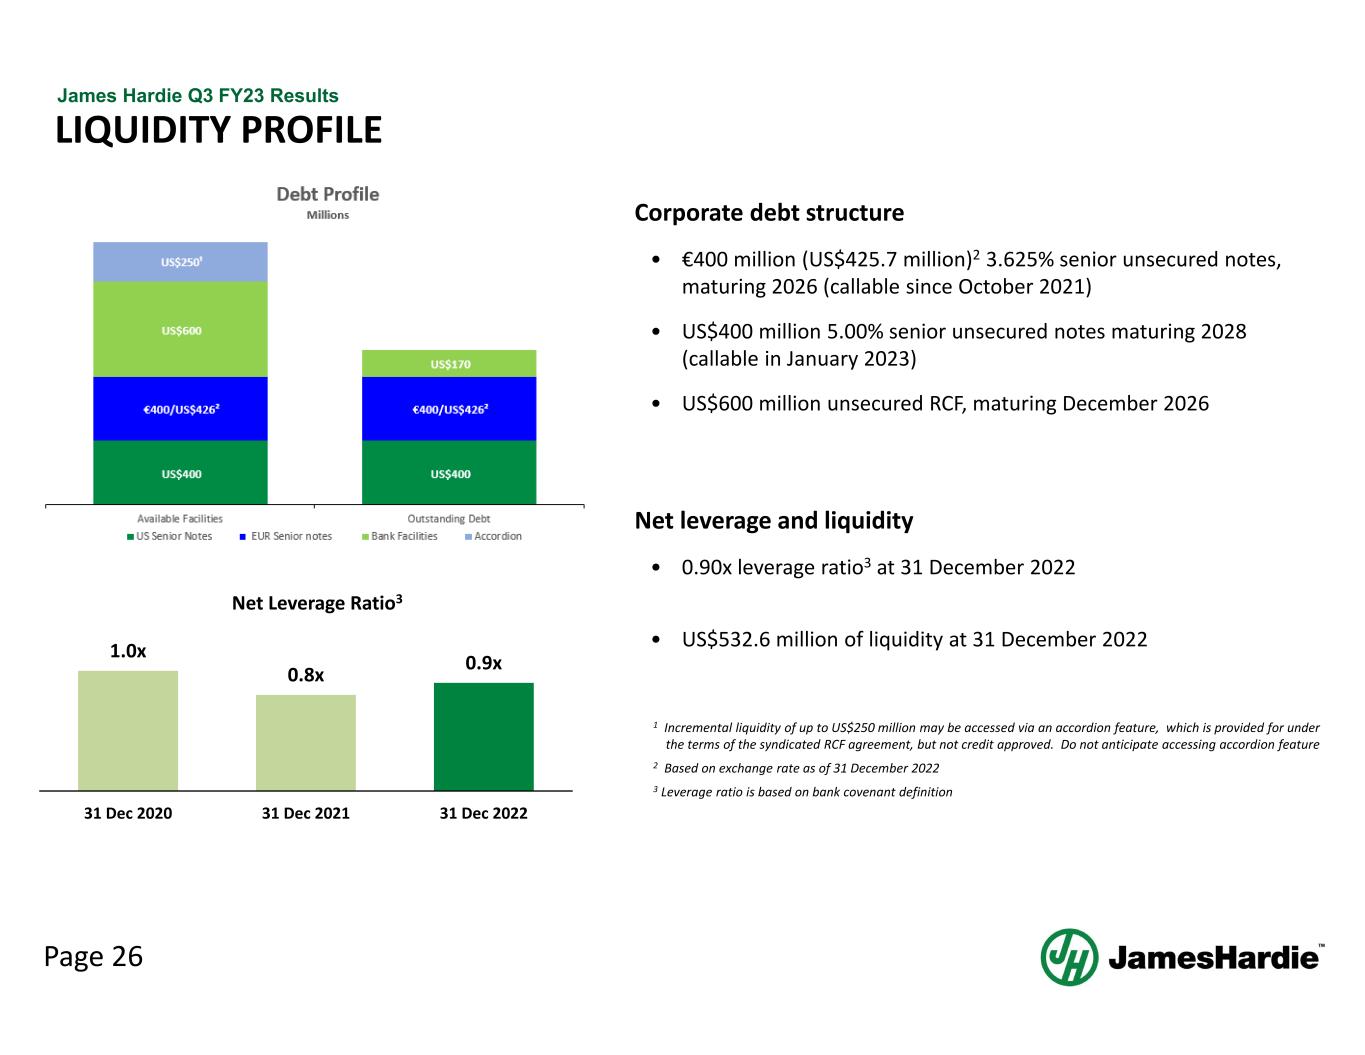
Page 26 James Hardie Q3 FY23 Results LIQUIDITY PROFILE 2 1 Incremental liquidity of up to US$250 million may be accessed via an accordion feature, which is provided for under the terms of the syndicated RCF agreement, but not credit approved. Do not anticipate accessing accordion feature 2 Based on exchange rate as of 31 December 2022 3 Leverage ratio is based on bank covenant definition 1.0x 0.8x 0.9x 31 Dec 2020 31 Dec 2021 31 Dec 2022 Net Leverage Ratio3 Corporate debt structure • €400 million (US$425.7 million)2 3.625% senior unsecured notes, maturing 2026 (callable since October 2021) • US$400 million 5.00% senior unsecured notes maturing 2028 (callable in January 2023) • US$600 million unsecured RCF, maturing December 2026 Net leverage and liquidity • 0.90x leverage ratio3 at 31 December 2022 • US$532.6 million of liquidity at 31 December 2022
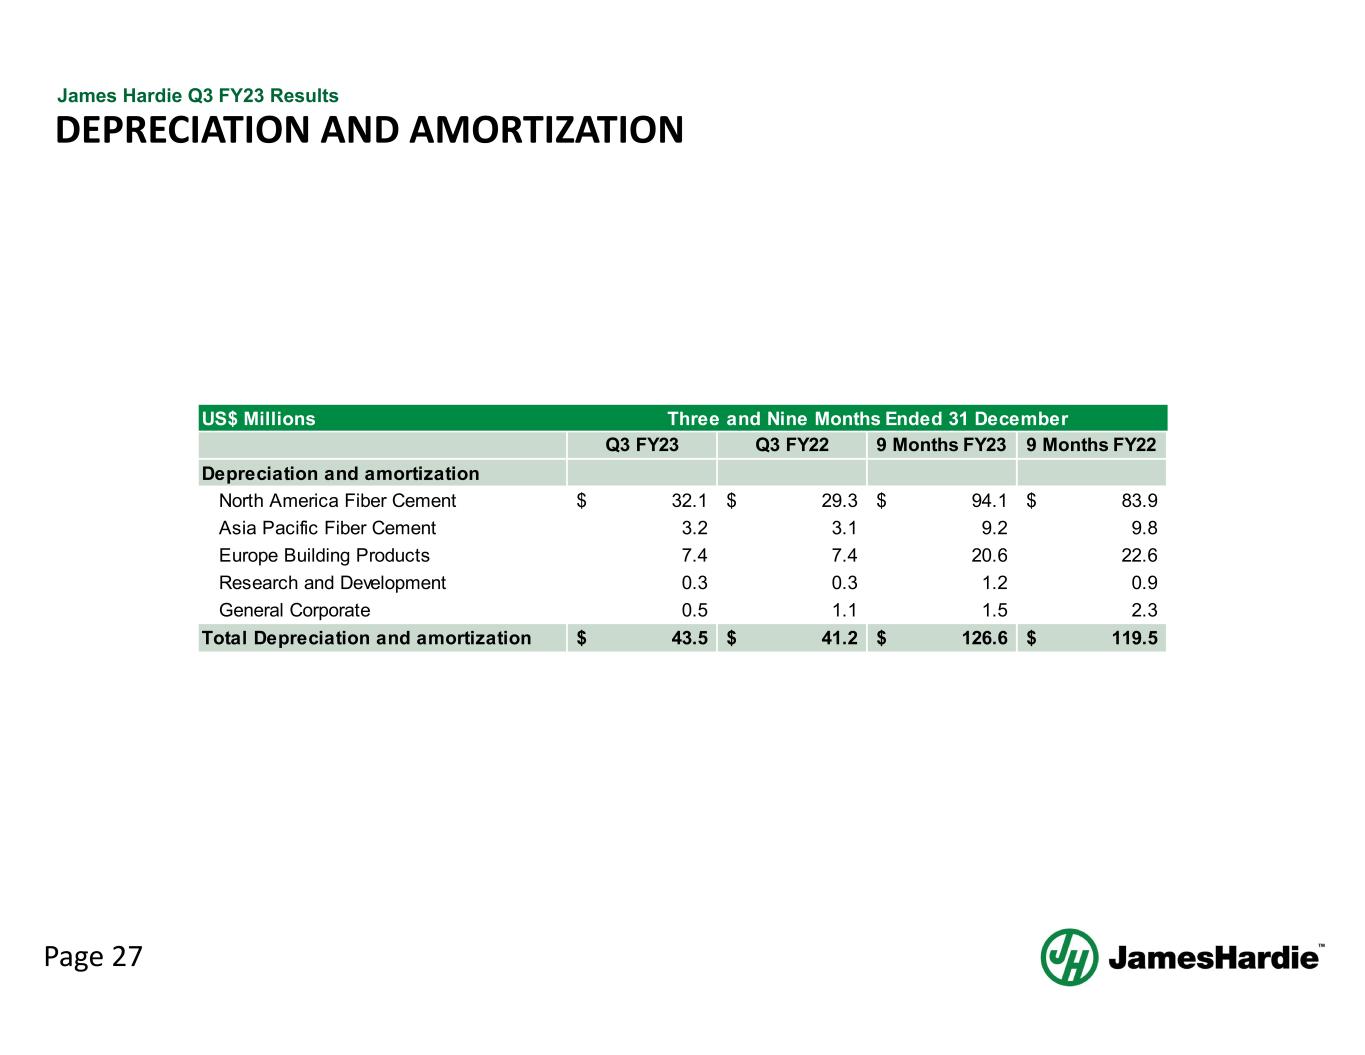
Page 27 James Hardie Q3 FY23 Results DEPRECIATION AND AMORTIZATION US$ Millions Q3 FY23 Q3 FY22 9 Months FY23 9 Months FY22 Depreciation and amortization North America Fiber Cement 32.1$ 29.3$ 94.1$ 83.9$ Asia Pacific Fiber Cement 3.2 3.1 9.2 9.8 Europe Building Products 7.4 7.4 20.6 22.6 Research and Development 0.3 0.3 1.2 0.9 General Corporate 0.5 1.1 1.5 2.3 Total Depreciation and amortization 43.5$ 41.2$ 126.6$ 119.5$ Three and Nine Months Ended 31 December
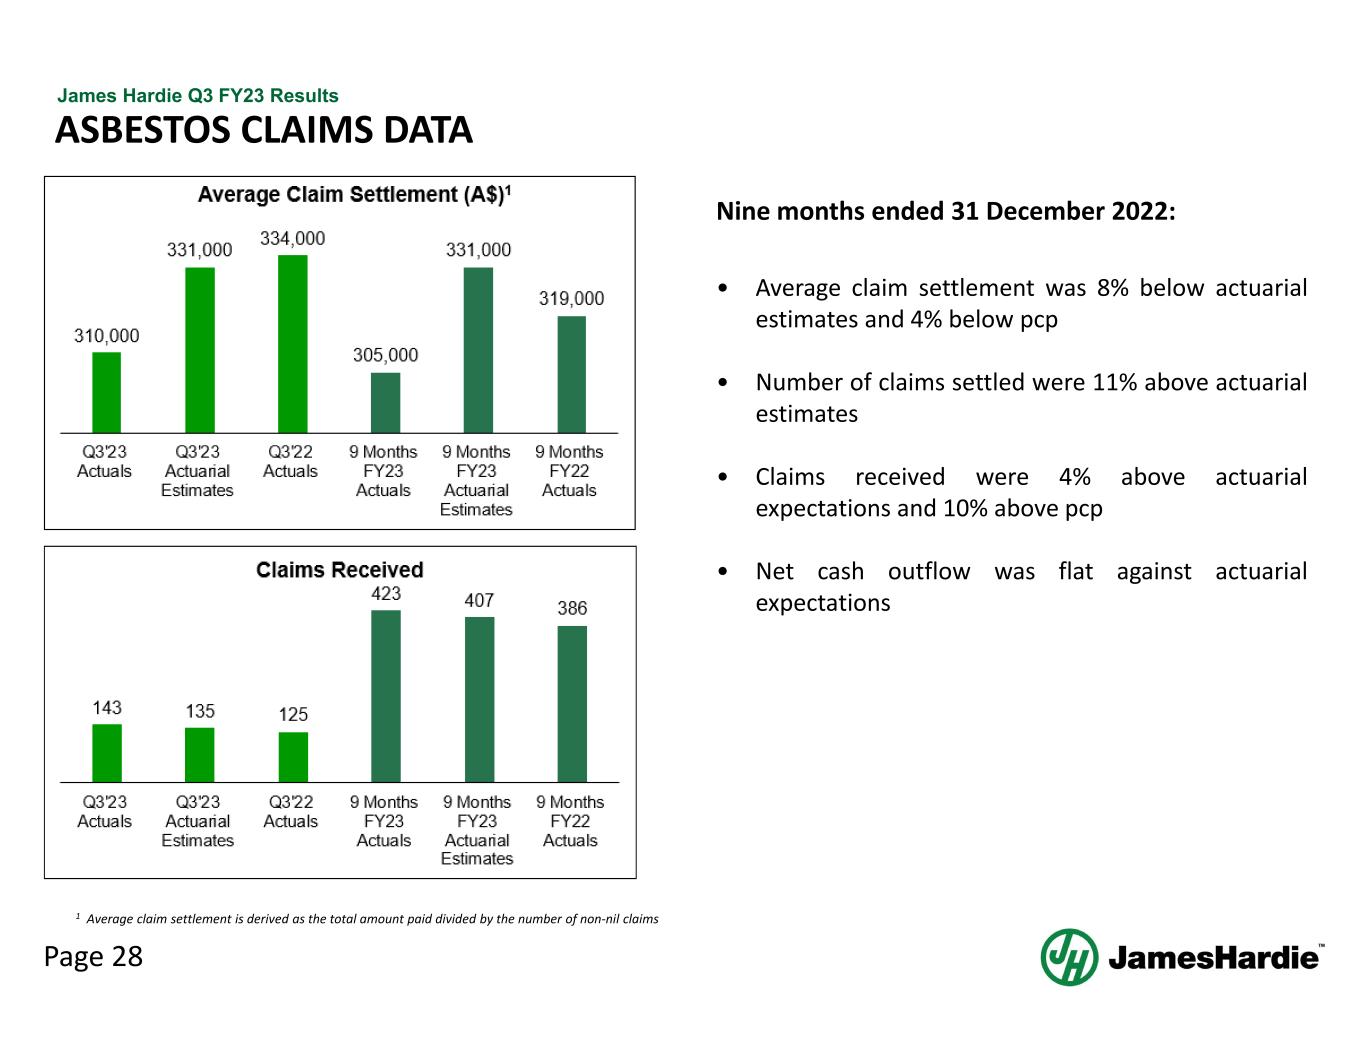
Page 28 James Hardie Q3 FY23 Results Nine months ended 31 December 2022: • Average claim settlement was 8% below actuarial estimates and 4% below pcp • Number of claims settled were 11% above actuarial estimates • Claims received were 4% above actuarial expectations and 10% above pcp • Net cash outflow was flat against actuarial expectations ASBESTOS CLAIMS DATA 1 Average claim settlement is derived as the total amount paid divided by the number of non‐nil claims
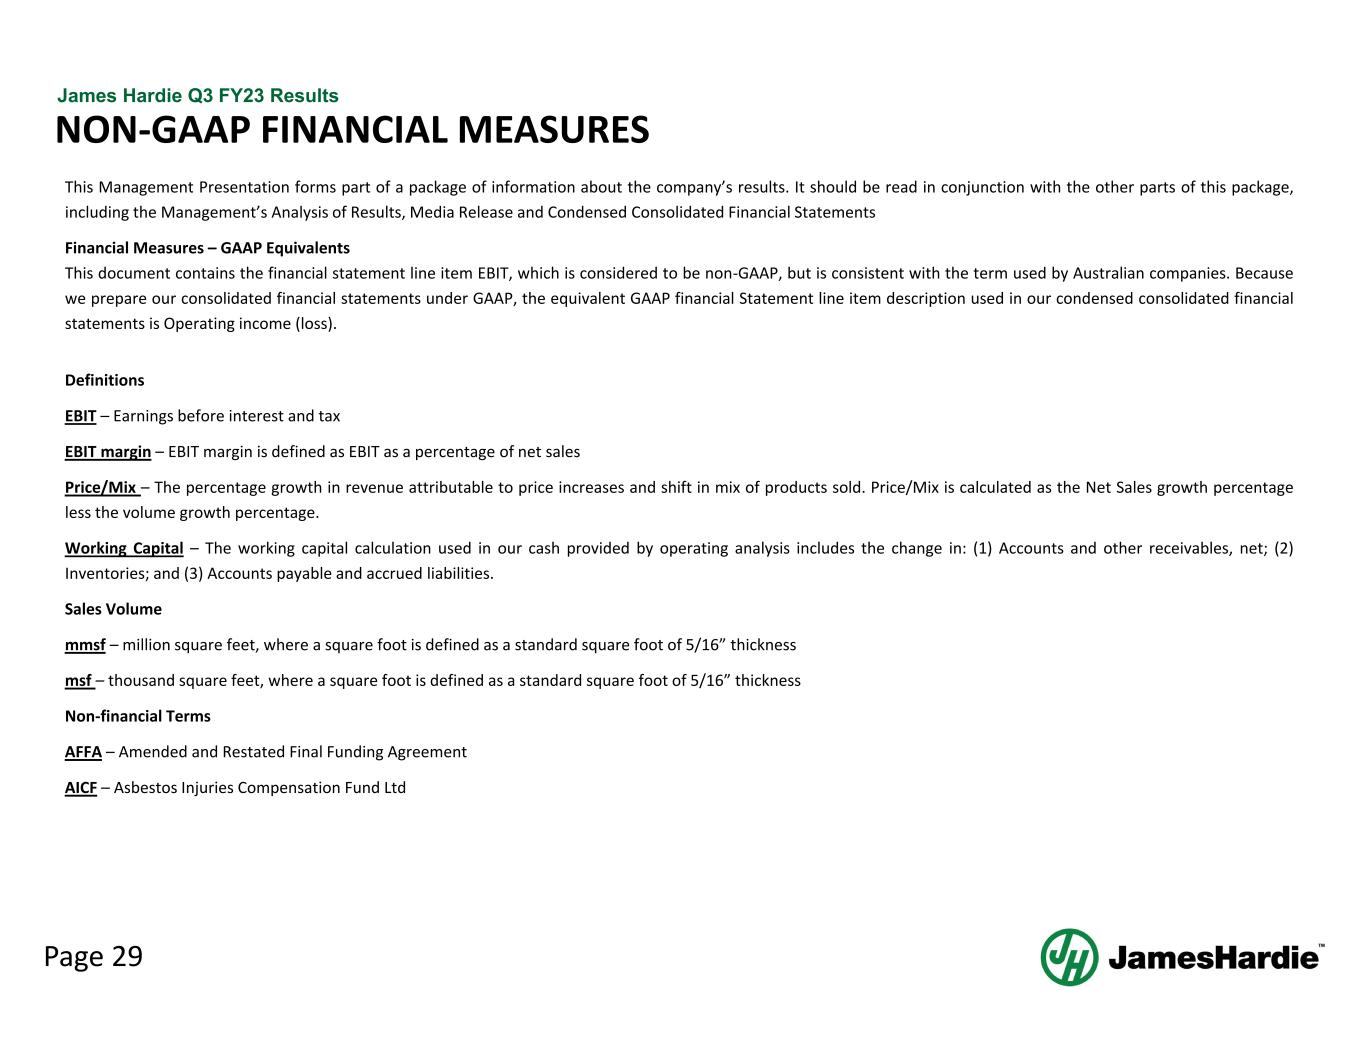
Page 29 James Hardie Q3 FY23 Results This Management Presentation forms part of a package of information about the company’s results. It should be read in conjunction with the other parts of this package, including the Management’s Analysis of Results, Media Release and Condensed Consolidated Financial Statements Financial Measures – GAAP Equivalents This document contains the financial statement line item EBIT, which is considered to be non‐GAAP, but is consistent with the term used by Australian companies. Because we prepare our consolidated financial statements under GAAP, the equivalent GAAP financial Statement line item description used in our condensed consolidated financial statements is Operating income (loss). Definitions EBIT – Earnings before interest and tax EBIT margin – EBIT margin is defined as EBIT as a percentage of net sales Price/Mix – The percentage growth in revenue attributable to price increases and shift in mix of products sold. Price/Mix is calculated as the Net Sales growth percentage less the volume growth percentage. Working Capital – The working capital calculation used in our cash provided by operating analysis includes the change in: (1) Accounts and other receivables, net; (2) Inventories; and (3) Accounts payable and accrued liabilities. Sales Volume mmsf –million square feet, where a square foot is defined as a standard square foot of 5/16” thickness msf – thousand square feet, where a square foot is defined as a standard square foot of 5/16” thickness Non‐financial Terms AFFA – Amended and Restated Final Funding Agreement AICF – Asbestos Injuries Compensation Fund Ltd NON‐GAAP FINANCIAL MEASURES
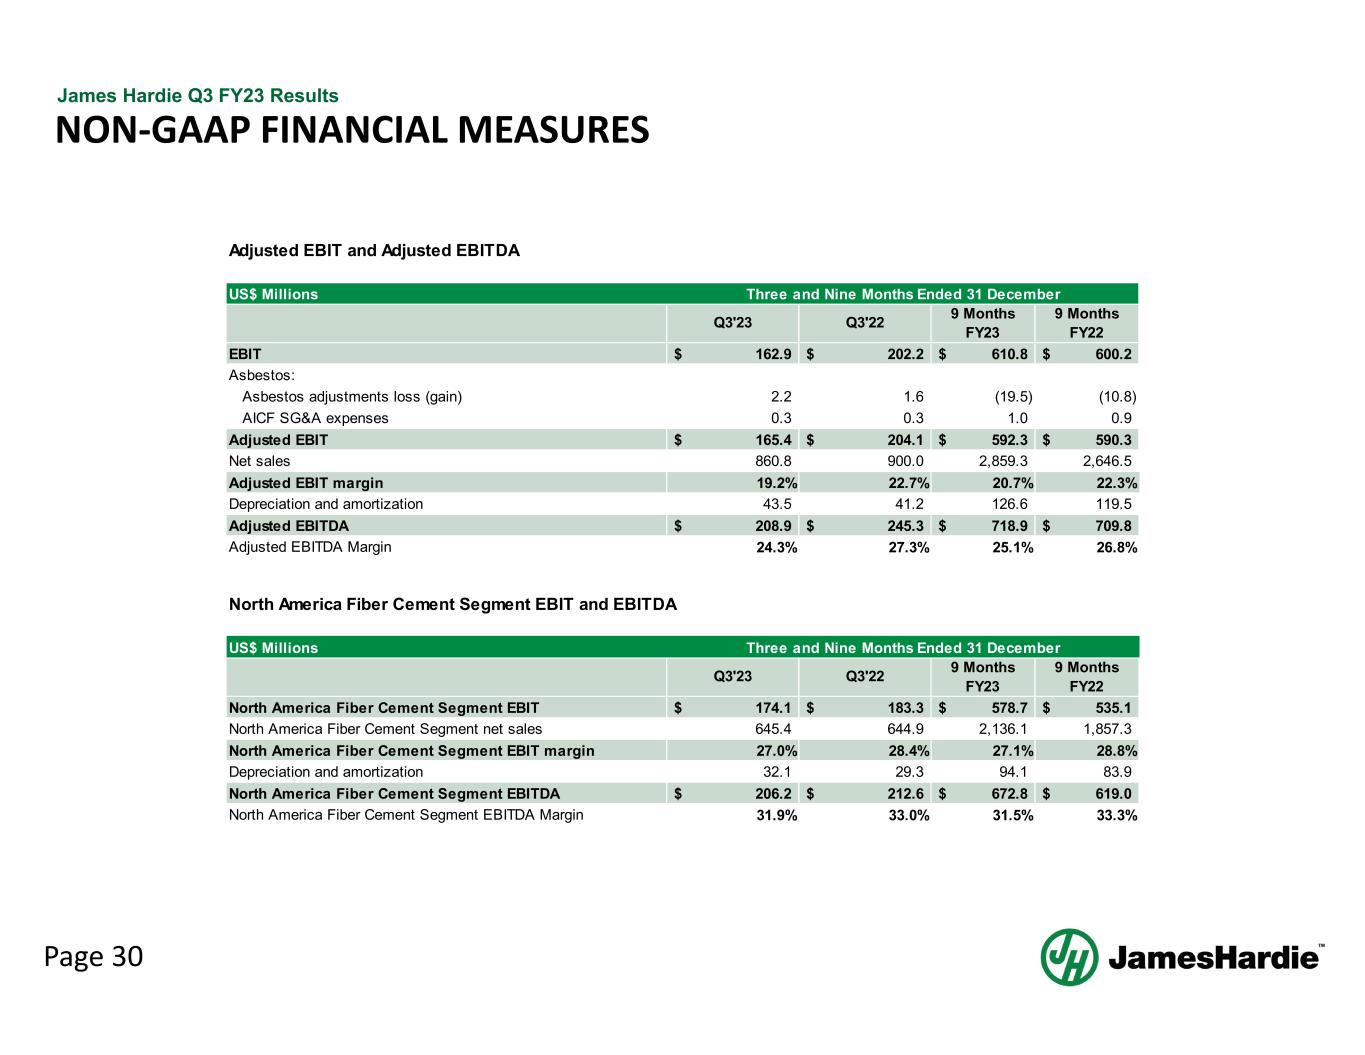
Page 30 James Hardie Q3 FY23 Results NON‐GAAP FINANCIAL MEASURES Adjusted EBIT and Adjusted EBITDA US$ Millions Q3'23 Q3'22 9 Months FY23 9 Months FY22 EBIT 162.9$ 202.2$ 610.8$ 600.2$ Asbestos: Asbestos adjustments loss (gain) 2.2 1.6 (19.5) (10.8) AICF SG&A expenses 0.3 0.3 1.0 0.9 Adjusted EBIT 165.4$ 204.1$ 592.3$ 590.3$ Net sales 860.8 900.0 2,859.3 2,646.5 Adjusted EBIT margin 19.2% 22.7% 20.7% 22.3% Depreciation and amortization 43.5 41.2 126.6 119.5 Adjusted EBITDA 208.9$ 245.3$ 718.9$ 709.8$ Adjusted EBITDA Margin 24.3% 27.3% 25.1% 26.8% Three and Nine Months Ended 31 December US$ Millions Q3'23 Q3'22 9 Months FY23 9 Months FY22 North America Fiber Cement Segment EBIT 174.1$ 183.3$ 578.7$ 535.1$ North America Fiber Cement Segment net sales 645.4 644.9 2,136.1 1,857.3 North America Fiber Cement Segment EBIT margin 27.0% 28.4% 27.1% 28.8% Depreciation and amortization 32.1 29.3 94.1 83.9 North America Fiber Cement Segment EBITDA 206.2$ 212.6$ 672.8$ 619.0$ North America Fiber Cement Segment EBITDA Margin 31.9% 33.0% 31.5% 33.3% North America Fiber Cement Segment EBIT and EBITDA Three and Nine Months Ended 31 December
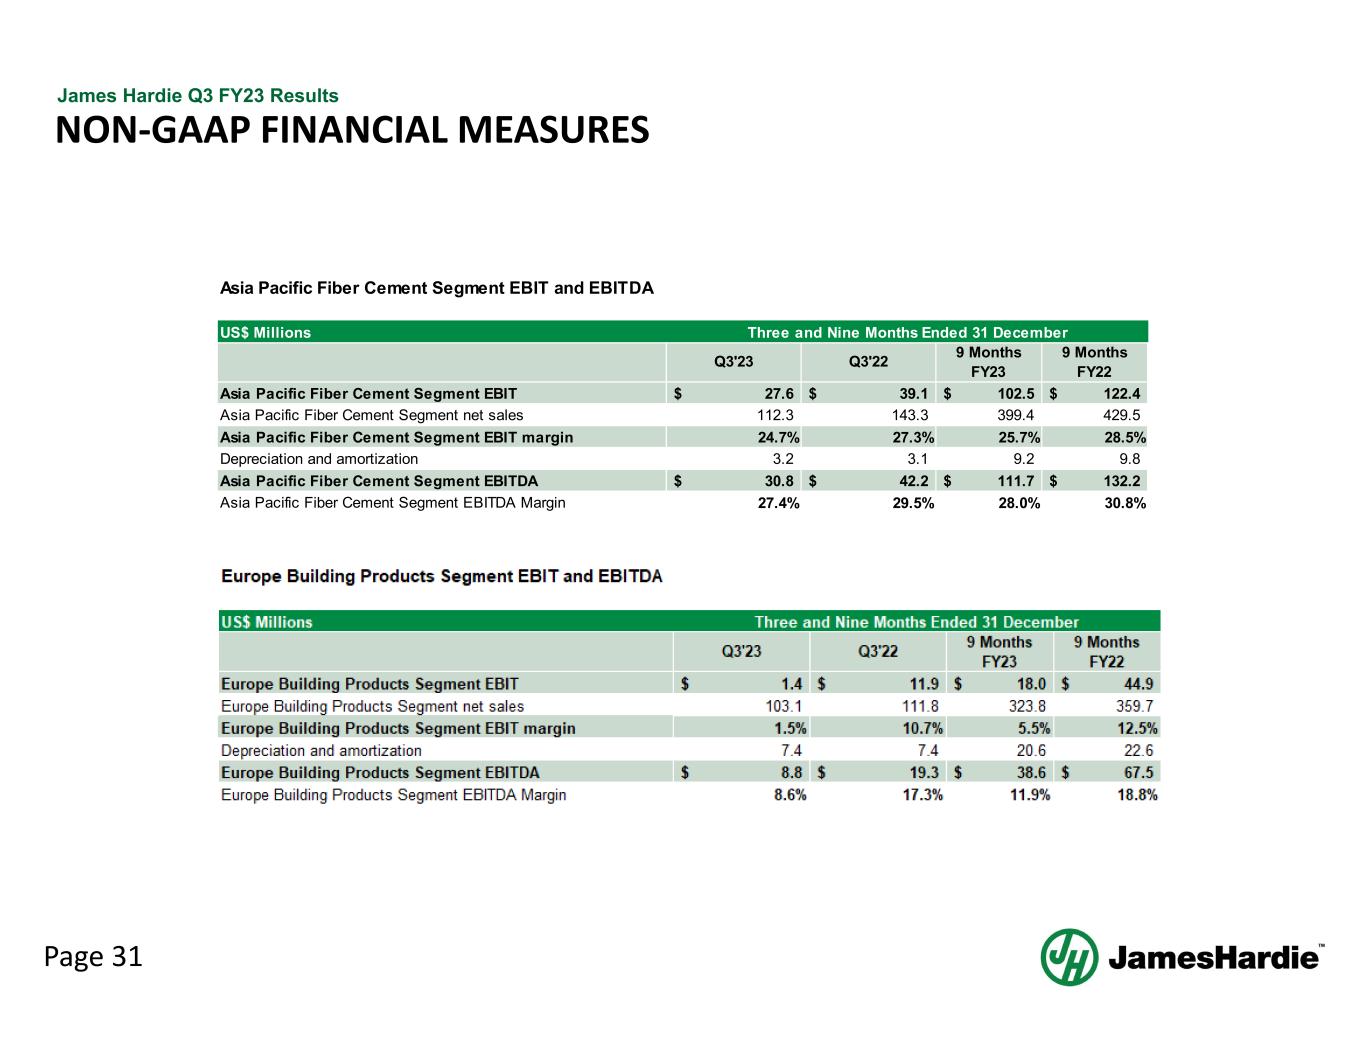
Page 31 James Hardie Q3 FY23 Results NON‐GAAP FINANCIAL MEASURES US$ Millions Q3'23 Q3'22 9 Months FY23 9 Months FY22 Asia Pacific Fiber Cement Segment EBIT 27.6$ 39.1$ 102.5$ 122.4$ Asia Pacific Fiber Cement Segment net sales 112.3 143.3 399.4 429.5 Asia Pacific Fiber Cement Segment EBIT margin 24.7% 27.3% 25.7% 28.5% Depreciation and amortization 3.2 3.1 9.2 9.8 Asia Pacific Fiber Cement Segment EBITDA 30.8$ 42.2$ 111.7$ 132.2$ Asia Pacific Fiber Cement Segment EBITDA Margin 27.4% 29.5% 28.0% 30.8% Asia Pacific Fiber Cement Segment EBIT and EBITDA Three and Nine Months Ended 31 December
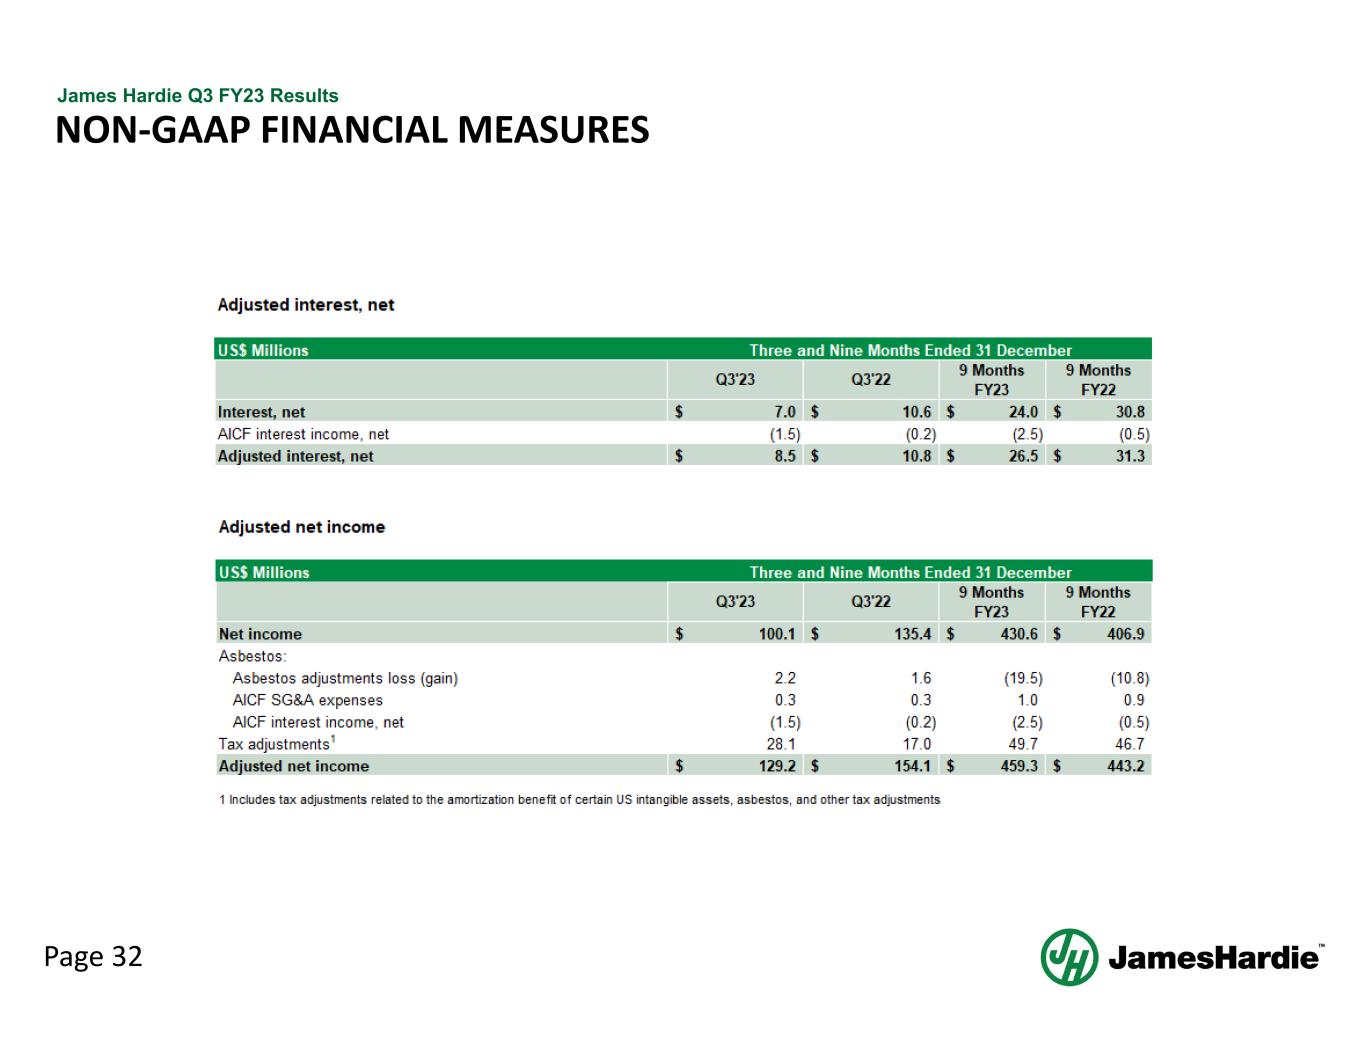
Page 32 James Hardie Q3 FY23 Results NON‐GAAP FINANCIAL MEASURES
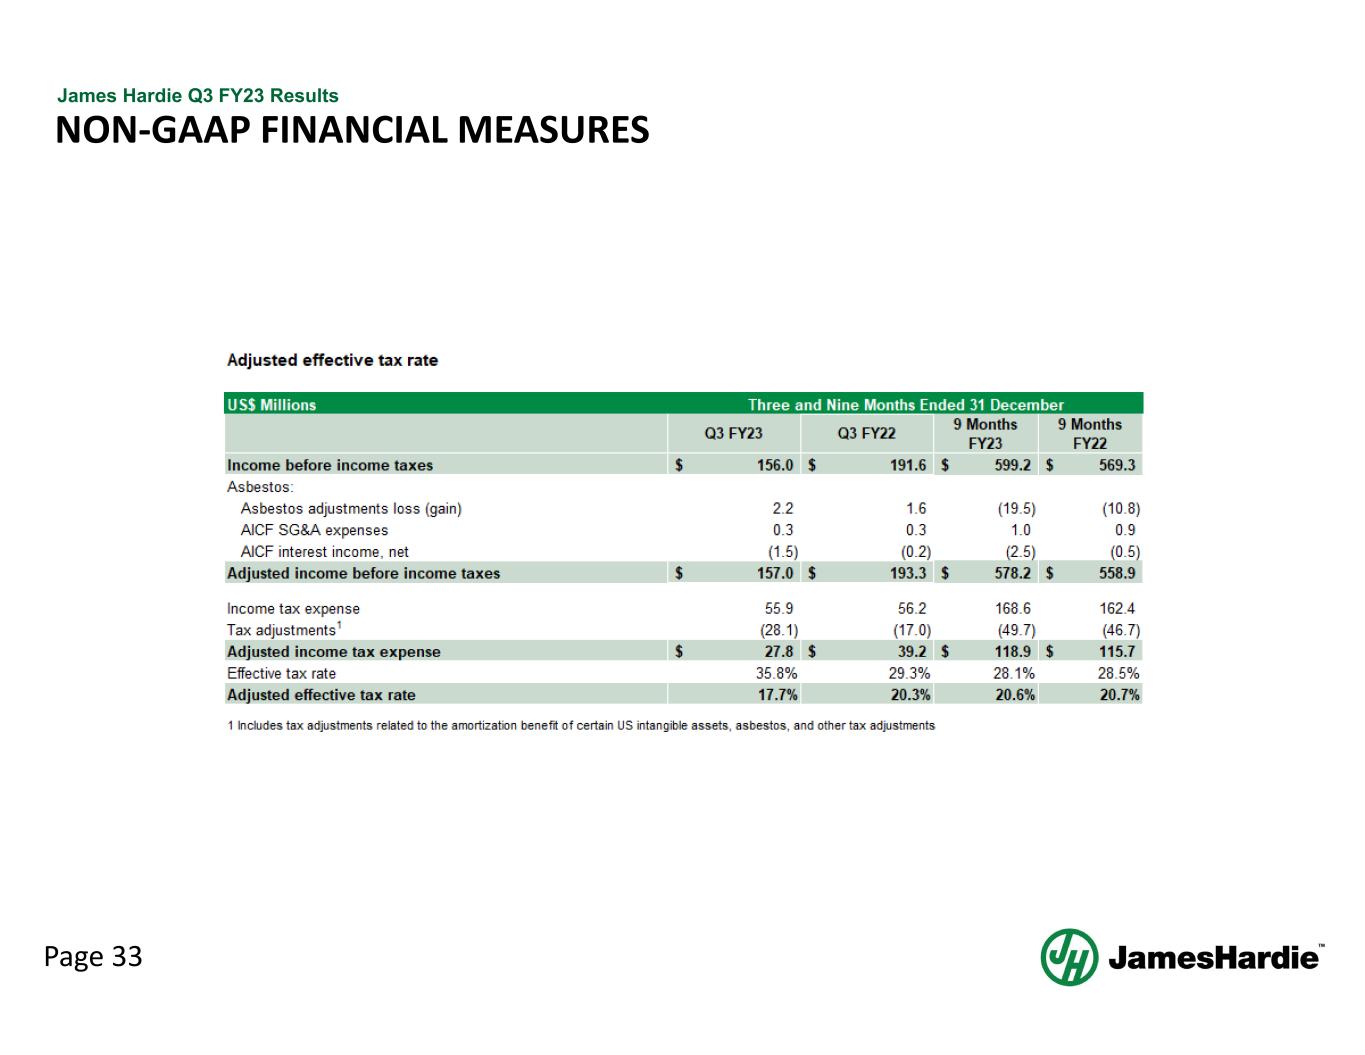
Page 33 James Hardie Q3 FY23 Results NON‐GAAP FINANCIAL MEASURES

Q3 FY23 MANAGEMENT PRESENTATION 14 February 2023