
8 NOVEMBER 2023 Q2 FY24 Management Presentation E X H I B I T 9 9 . 5
Page 2 J A M E S H A R D I E Q 2 F Y 2 4 R E S U L T S CAUTIONARY NOTE ON FORWARD-LOOKING STATEMENTS This Management Presentation contains forward looking statements within the meaning of the Private Securities Litigation Reform Act of 1995. James Hardie Industries plc (the “Company”) may from time to time make forward-looking statements in its periodic reports filed with or furnished to the Securities and Exchange Commission on Forms 20-F and 6-K, in its annual reports to shareholders, in media releases and other written materials and in oral statements made by the Company’s officers, directors or employees to analysts, institutional investors, representatives of the media and others. Words such as “believe,” “anticipate,” “plan,” “expect,” “intend,” “target,” “estimate,” “project,” “predict,” “forecast,” “guideline,” “aim,” “will,” “should,” “likely,” “continue,” “may,” “objective,” “outlook” and similar expressions are intended to identify forward-looking statements but are not the exclusive means of identifying such statements. These forward-looking statements are based upon management's current expectations, estimates, assumptions and beliefs concerning future events and conditions. Readers are cautioned not to place undue reliance on any forward-looking statements. Forward-looking statements are necessarily subject to risks, uncertainties and other factors, many of which are unforeseeable and beyond the Company’s control. Many factors could cause actual results, performance or achievements to be materially different from those expressed or implied in this Management Presentation, including, among others, the risks and uncertainties set forth in Section 3 “Risk Factors” in James Hardie’s Annual Report on Form 20-F for the year ended 31 March 2023; changes in general economic, political, governmental and business conditions globally and in the countries in which the Company does business, including; changes in interest rates; changes in inflation rates; changes in exchange rates; the level of construction generally; changes in cement demand and prices; changes in raw material and energy prices; changes in business strategy and various other factors. Should one or more of these risks or uncertainties materialize, or should underlying assumptions prove incorrect, actual results may vary materially from those described herein. James Hardie assumes no obligation to update or correct the information contained in this Management Presentation except as required by law. This Management Presentation includes financial measures that are not considered a measure of financial performance under generally accepted accounting principles in the United States (GAAP). These financial measures are designed to provide investors with an alternative method for assessing our performance from on-going operations, capital efficiency and profit generation. Management uses these financial measures for the same purposes. These financial measures are or may be non-GAAP financial measures as defined in the rules of the U.S. Securities and Exchange Commission and may exclude or include amounts that are included or excluded, as applicable, in the calculation of the most directly comparable financial measures calculated in accordance with GAAP. These non-GAAP financial measures should not be considered to be more meaningful than the equivalent GAAP measure. Management has included such measures to provide investors with an alternative method for assessing its operating results in a manner that is focused on the performance of its ongoing operations and excludes the impact of certain legacy items, such as asbestos adjustments. Additionally, management uses such non-GAAP financial measures for the same purposes. However, these non-GAAP financial measures are not prepared in accordance with GAAP, may not be reported by all of the Company’s competitors and may not be directly comparable to similarly titled measures of the Company’s competitors due to potential differences in the exact method of calculation. For additional information regarding the non-GAAP financial measures presented in this Management Presentation, including a reconciliation of each non-GAAP financial measure to the equivalent GAAP measure, see the slide titled “Non-GAAP Financial Measures” included in the Appendix to this Management Presentation. In addition, this Management Presentation includes financial measures and descriptions that are considered to not be in accordance with GAAP, but which are consistent with financial measures reported by Australian companies, such as operating profit, EBIT and EBIT margin. Since the Company prepares its Condensed Consolidated Financial Statements in accordance with GAAP, the Company provides investors with definitions and a cross-reference from the non-GAAP financial measure used in this Management Presentation to the equivalent GAAP financial measure used in the Company’s Condensed Consolidated Financial Statements. See the section titled “Non-GAAP Financial Measures” included in the Appendix to this Management Presentation. All amounts are in US Dollars, unless otherwise noted CAUTIONARY NOTE ON FORWARD-LOOKING STATEMENTS USE OF NON-GAAP FINANCIAL INFORMATION; AUSTRALIAN EQUIVALENT TERMINOLOGY

Page 3 J A M E S H A R D I E Q 2 F Y 2 4 R E S U L T S AGENDA • Introduction: Rachel Wilson, CFO • Strategy, Zero Harm & HOS Update • Financial Results • Outlook and Guidance • Q&A Aaron Erter CEO Rachel Wilson CFO

Strategy, Zero Harm & HOS Update 8 NOVEMBER 2023
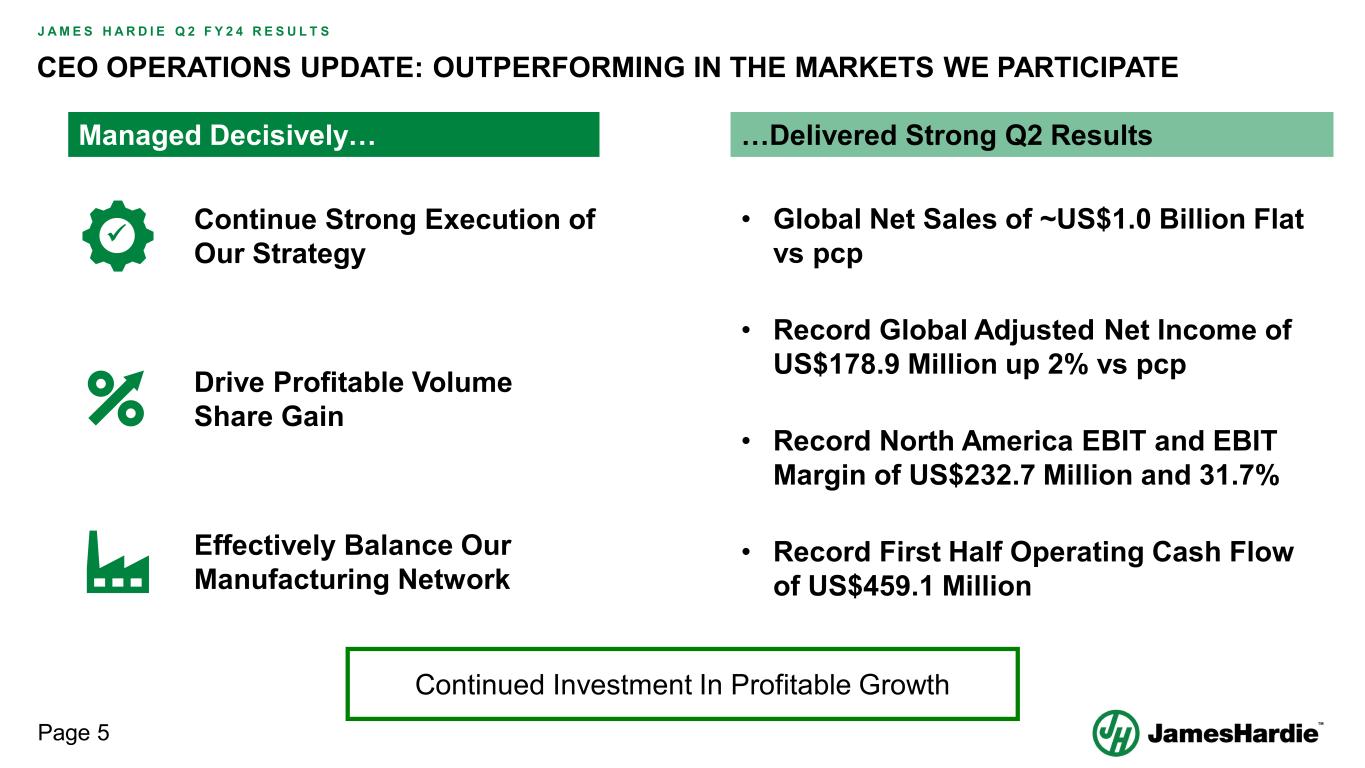
Page 5 J A M E S H A R D I E Q 2 F Y 2 4 R E S U L T S CEO OPERATIONS UPDATE: OUTPERFORMING IN THE MARKETS WE PARTICIPATE Managed Decisively… …Delivered Strong Q2 Results Continue Strong Execution of Our Strategy Drive Profitable Volume Share Gain Effectively Balance Our Manufacturing Network • Global Net Sales of ~US$1.0 Billion Flat vs pcp • Record Global Adjusted Net Income of US$178.9 Million up 2% vs pcp • Record North America EBIT and EBIT Margin of US$232.7 Million and 31.7% • Record First Half Operating Cash Flow of US$459.1 Million Continued Investment In Profitable Growth
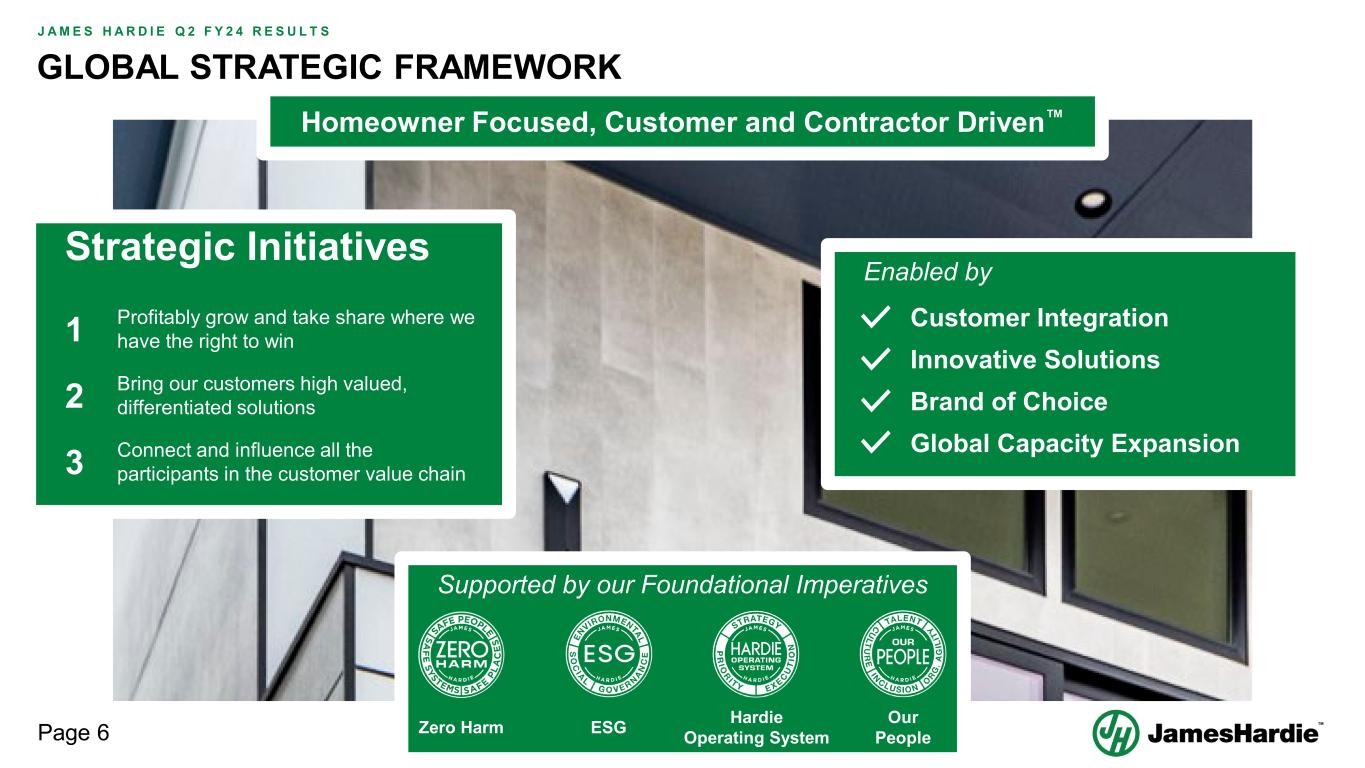
Page 6 J A M E S H A R D I E Q 2 F Y 2 4 R E S U L T S Strategic Initiatives 1 Profitably grow and take share where we have the right to win 2 Bring our customers high valued, differentiated solutions 3 Connect and influence all the participants in the customer value chain Enabled by Customer Integration Innovative Solutions Brand of Choice Global Capacity Expansion Homeowner Focused, Customer and Contractor Driven™ Supported by our Foundational Imperatives Our People GLOBAL STRATEGIC FRAMEWORK ESGZero Harm Hardie Operating System
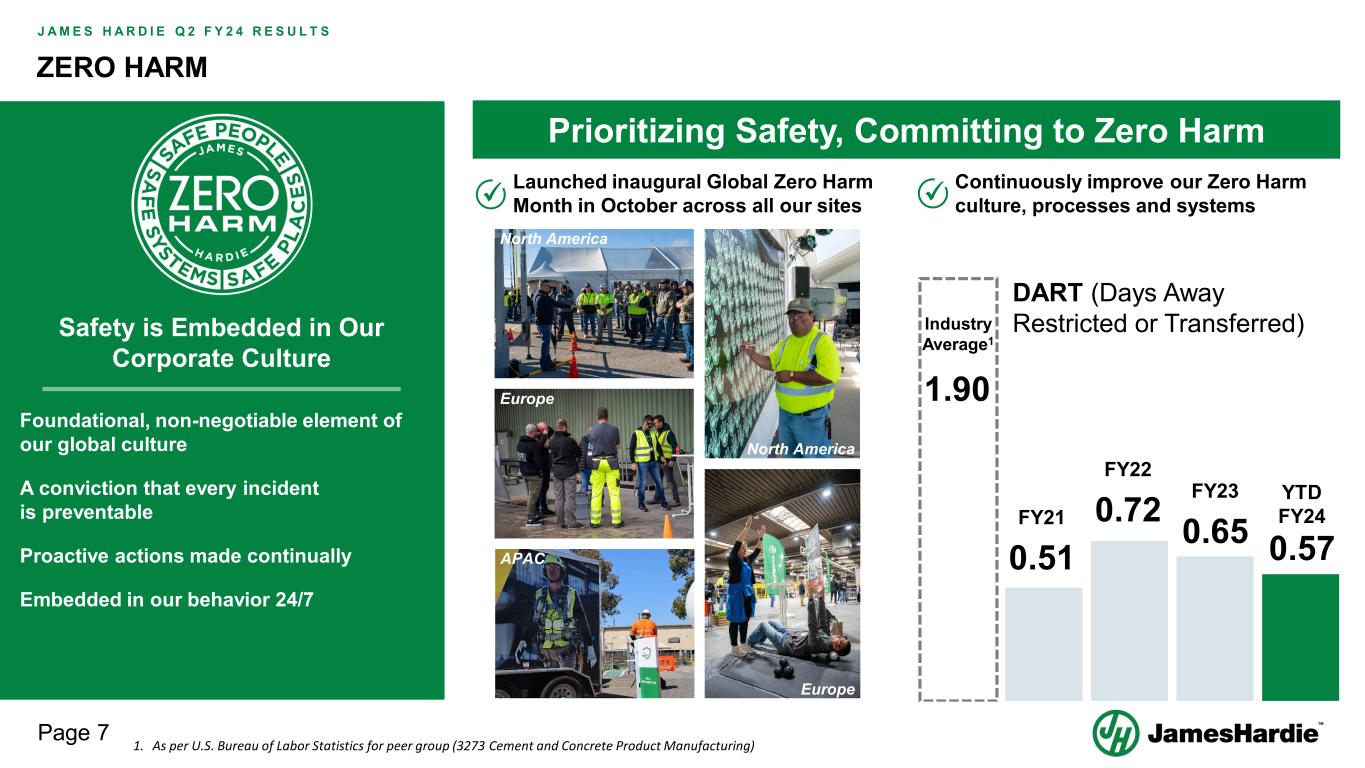
Page 7 J A M E S H A R D I E Q 2 F Y 2 4 R E S U L T S ZERO HARM Foundational, non-negotiable element of our global culture A conviction that every incident is preventable Proactive actions made continually Embedded in our behavior 24/7 Safety is Embedded in Our Corporate Culture Prioritizing Safety, Committing to Zero Harm Continuously improve our Zero Harm culture, processes and systems Industry Average1 1.90 DART (Days Away Restricted or Transferred) 0.72 FY22 0.51 FY21 0.65 FY23 1. As per U.S. Bureau of Labor Statistics for peer group (3273 Cement and Concrete Product Manufacturing) Launched inaugural Global Zero Harm Month in October across all our sites 0.57 YTD FY24 North America North America Europe APAC Europe
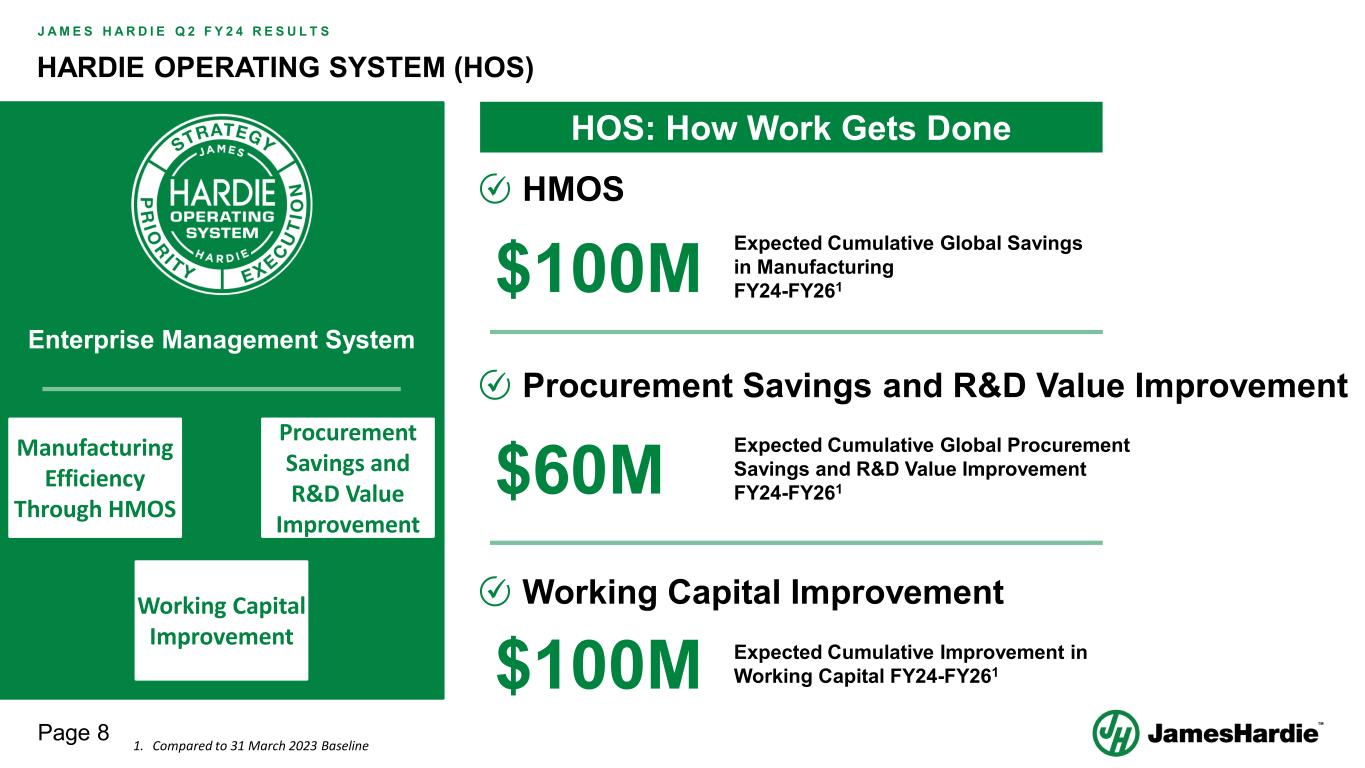
Page 8 J A M E S H A R D I E Q 2 F Y 2 4 R E S U L T S HARDIE OPERATING SYSTEM (HOS) Manufacturing Efficiency Through HMOS Working Capital Improvement Procurement Savings and R&D Value Improvement HOS: How Work Gets Done Procurement Savings and R&D Value Improvement Expected Cumulative Global Savings in Manufacturing FY24-FY261 $60M Expected Cumulative Global Procurement Savings and R&D Value Improvement FY24-FY261 HMOS Working Capital Improvement $100M Expected Cumulative Improvement in Working Capital FY24-FY261 $100M Enterprise Management System 1. Compared to 31 March 2023 Baseline

8 NOVEMBER 2023 Financial Results
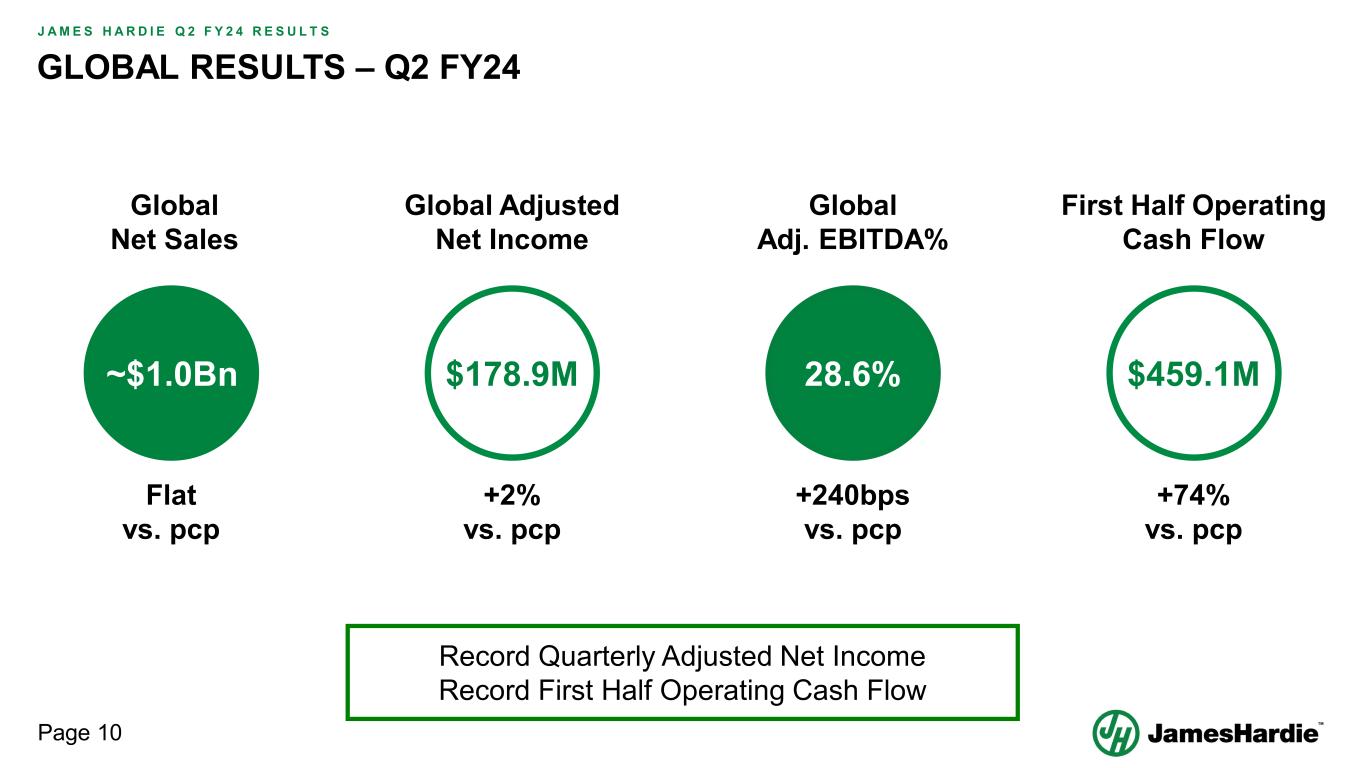
Page 10 J A M E S H A R D I E Q 2 F Y 2 4 R E S U L T S GLOBAL RESULTS – Q2 FY24 $459.1M$178.9M~$1.0Bn 28.6% Global Net Sales Flat vs. pcp +2% vs. pcp Global Adjusted Net Income Global Adj. EBITDA% +240bps vs. pcp First Half Operating Cash Flow +74% vs. pcp Record Quarterly Adjusted Net Income Record First Half Operating Cash Flow
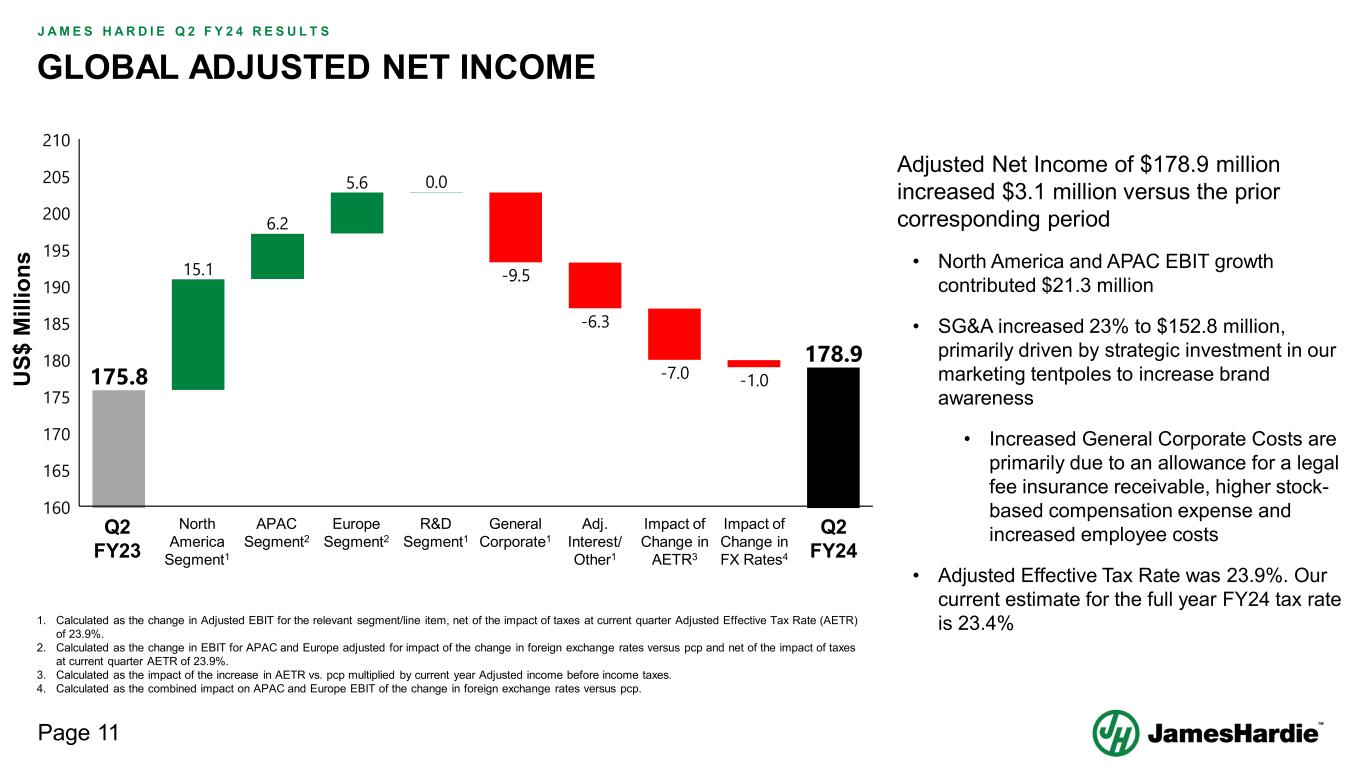
Page 11 J A M E S H A R D I E Q 2 F Y 2 4 R E S U L T S GLOBAL ADJUSTED NET INCOME Adjusted Net Income of $178.9 million increased $3.1 million versus the prior corresponding period • North America and APAC EBIT growth contributed $21.3 million • SG&A increased 23% to $152.8 million, primarily driven by strategic investment in our marketing tentpoles to increase brand awareness • Increased General Corporate Costs are primarily due to an allowance for a legal fee insurance receivable, higher stock- based compensation expense and increased employee costs • Adjusted Effective Tax Rate was 23.9%. Our current estimate for the full year FY24 tax rate is 23.4% North America Segment1 Europe Segment2 R&D Segment1 General Corporate1 Adj. Interest/ Other1 Impact of Change in AETR3 Impact of Change in FX Rates4 Q2 FY23 Q2 FY24 APAC Segment2 U S$ M ill io ns 1. Calculated as the change in Adjusted EBIT for the relevant segment/line item, net of the impact of taxes at current quarter Adjusted Effective Tax Rate (AETR) of 23.9%. 2. Calculated as the change in EBIT for APAC and Europe adjusted for impact of the change in foreign exchange rates versus pcp and net of the impact of taxes at current quarter AETR of 23.9%. 3. Calculated as the impact of the increase in AETR vs. pcp multiplied by current year Adjusted income before income taxes. 4. Calculated as the combined impact on APAC and Europe EBIT of the change in foreign exchange rates versus pcp.
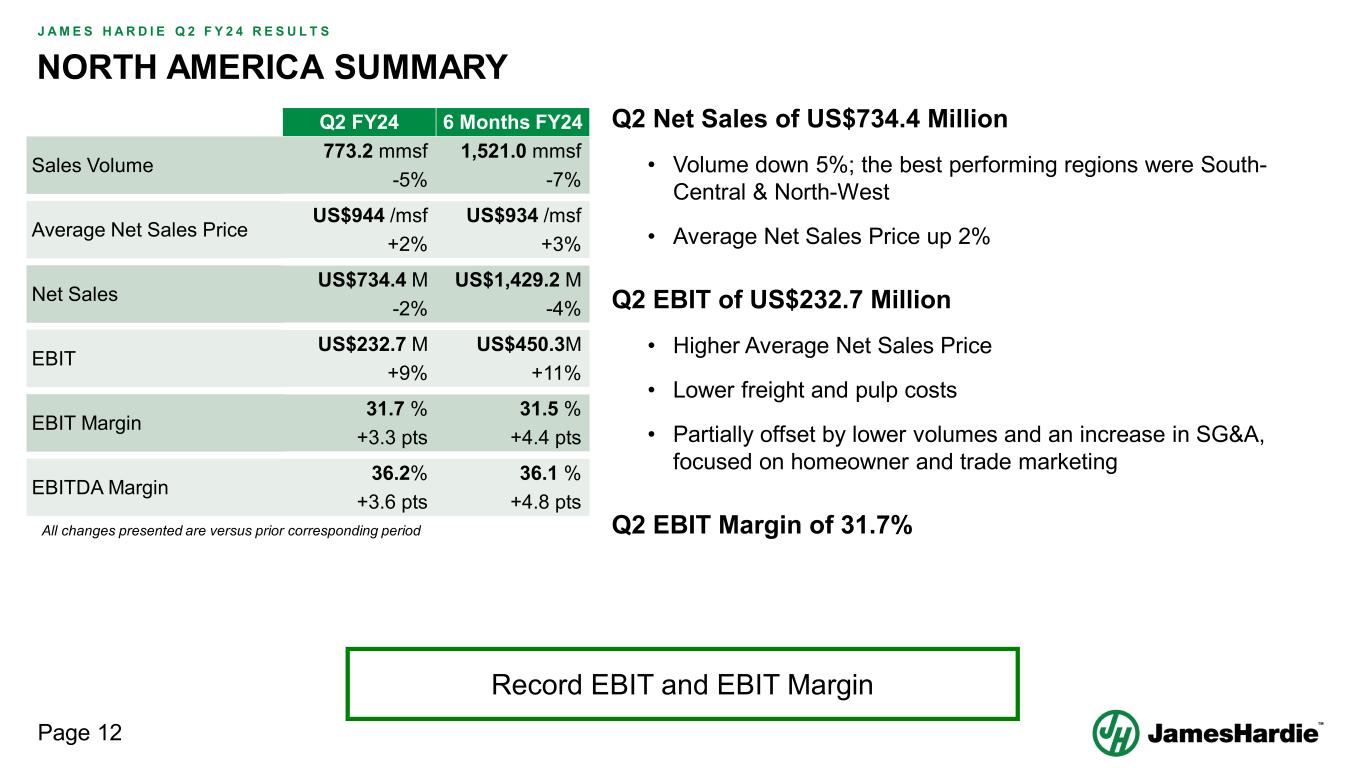
Page 12 J A M E S H A R D I E Q 2 F Y 2 4 R E S U L T S NORTH AMERICA SUMMARY Q2 Net Sales of US$734.4 Million • Volume down 5%; the best performing regions were South- Central & North-West • Average Net Sales Price up 2% Q2 EBIT of US$232.7 Million • Higher Average Net Sales Price • Lower freight and pulp costs • Partially offset by lower volumes and an increase in SG&A, focused on homeowner and trade marketing Q2 EBIT Margin of 31.7% Record EBIT and EBIT Margin Q2 FY24 6 Months FY24 Sales Volume 773.2 mmsf 1,521.0 mmsf -5% -7% Average Net Sales Price US$944 /msf US$934 /msf +2% +3% Net Sales US$734.4 M US$1,429.2 M -2% -4% EBIT US$232.7 M US$450.3M +9% +11% EBIT Margin 31.7 % 31.5 % +3.3 pts +4.4 pts EBITDA Margin 36.2% 36.1 % +3.6 pts +4.8 pts All changes presented are versus prior corresponding period
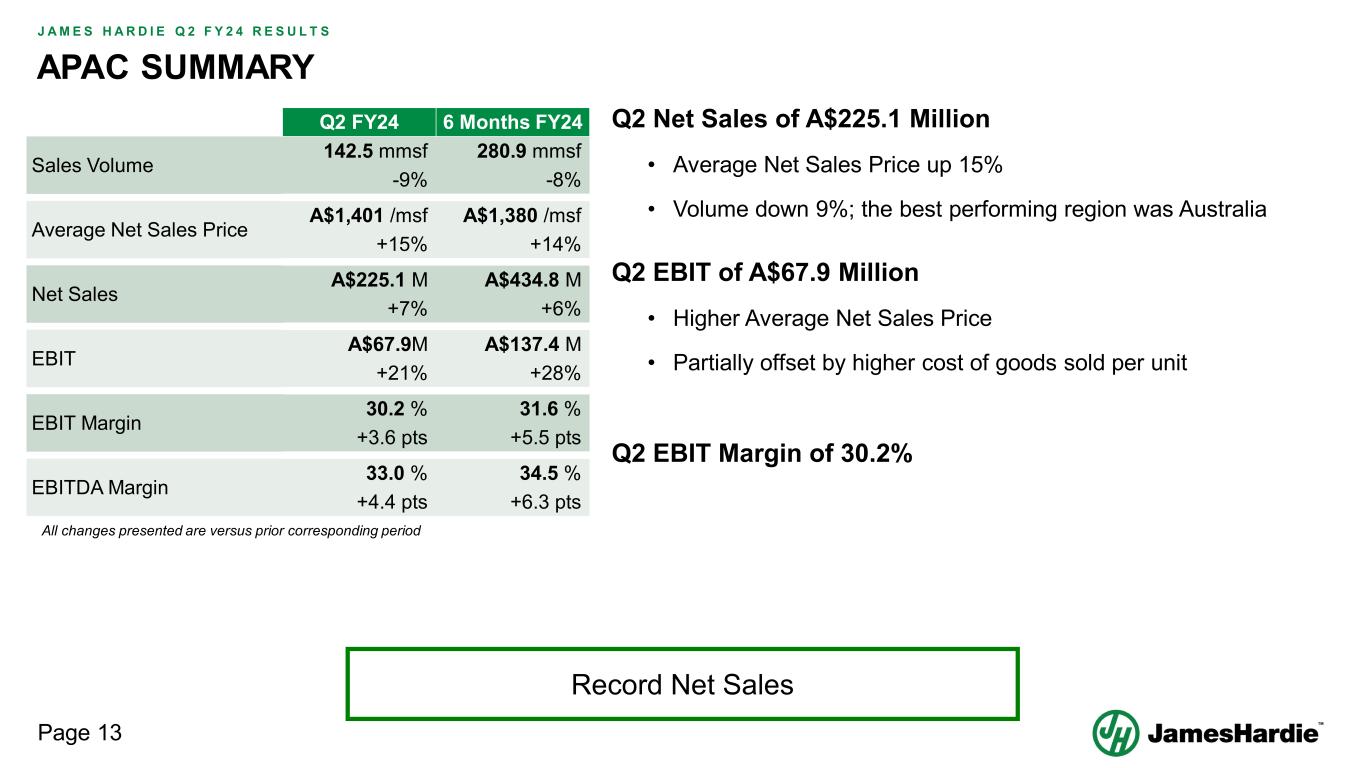
Page 13 J A M E S H A R D I E Q 2 F Y 2 4 R E S U L T S APAC SUMMARY Record Net Sales Q2 Net Sales of A$225.1 Million • Average Net Sales Price up 15% • Volume down 9%; the best performing region was Australia Q2 EBIT of A$67.9 Million • Higher Average Net Sales Price • Partially offset by higher cost of goods sold per unit Q2 EBIT Margin of 30.2% Q2 FY24 6 Months FY24 Sales Volume 142.5 mmsf 280.9 mmsf -9% -8% Average Net Sales Price A$1,401 /msf A$1,380 /msf +15% +14% Net Sales A$225.1 M A$434.8 M +7% +6% EBIT A$67.9M A$137.4 M +21% +28% EBIT Margin 30.2 % 31.6 % +3.6 pts +5.5 pts EBITDA Margin 33.0 % 34.5 % +4.4 pts +6.3 pts All changes presented are versus prior corresponding period
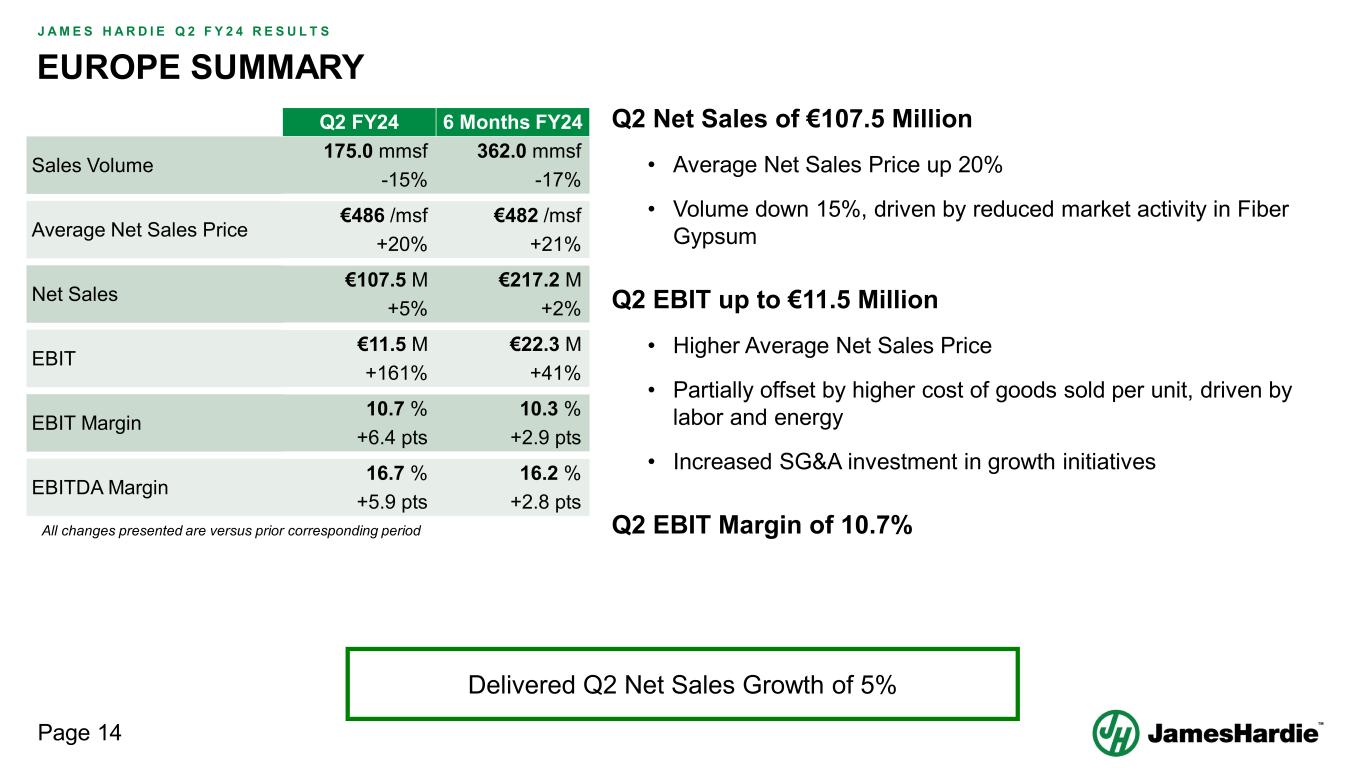
Page 14 J A M E S H A R D I E Q 2 F Y 2 4 R E S U L T S EUROPE SUMMARY Delivered Q2 Net Sales Growth of 5% Q2 Net Sales of €107.5 Million • Average Net Sales Price up 20% • Volume down 15%, driven by reduced market activity in Fiber Gypsum Q2 EBIT up to €11.5 Million • Higher Average Net Sales Price • Partially offset by higher cost of goods sold per unit, driven by labor and energy • Increased SG&A investment in growth initiatives Q2 EBIT Margin of 10.7% Q2 FY24 6 Months FY24 Sales Volume 175.0 mmsf 362.0 mmsf -15% -17% Average Net Sales Price €486 /msf €482 /msf +20% +21% Net Sales €107.5 M €217.2 M +5% +2% EBIT €11.5 M €22.3 M +161% +41% EBIT Margin 10.7 % 10.3 % +6.4 pts +2.9 pts EBITDA Margin 16.7 % 16.2 % +5.9 pts +2.8 pts All changes presented are versus prior corresponding period
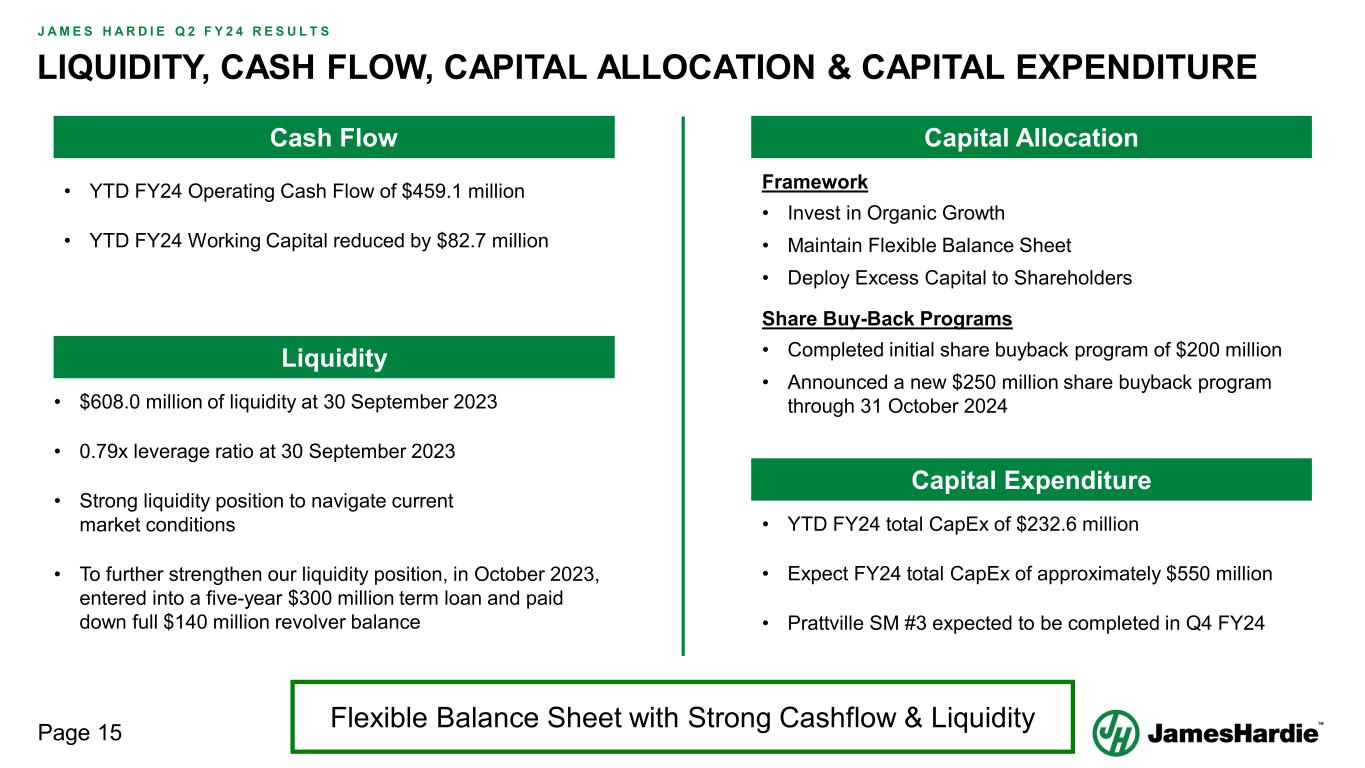
Page 15 J A M E S H A R D I E Q 2 F Y 2 4 R E S U L T S LIQUIDITY, CASH FLOW, CAPITAL ALLOCATION & CAPITAL EXPENDITURE • YTD FY24 Operating Cash Flow of $459.1 million • YTD FY24 Working Capital reduced by $82.7 million • $608.0 million of liquidity at 30 September 2023 • 0.79x leverage ratio at 30 September 2023 • Strong liquidity position to navigate current market conditions • To further strengthen our liquidity position, in October 2023, entered into a five-year $300 million term loan and paid down full $140 million revolver balance Cash Flow Liquidity Capital Allocation Framework • Invest in Organic Growth • Maintain Flexible Balance Sheet • Deploy Excess Capital to Shareholders Share Buy-Back Programs • Completed initial share buyback program of $200 million • Announced a new $250 million share buyback program through 31 October 2024 • YTD FY24 total CapEx of $232.6 million • Expect FY24 total CapEx of approximately $550 million • Prattville SM #3 expected to be completed in Q4 FY24 Capital Expenditure Flexible Balance Sheet with Strong Cashflow & Liquidity

Outlook and Guidance 8 NOVEMBER 2023
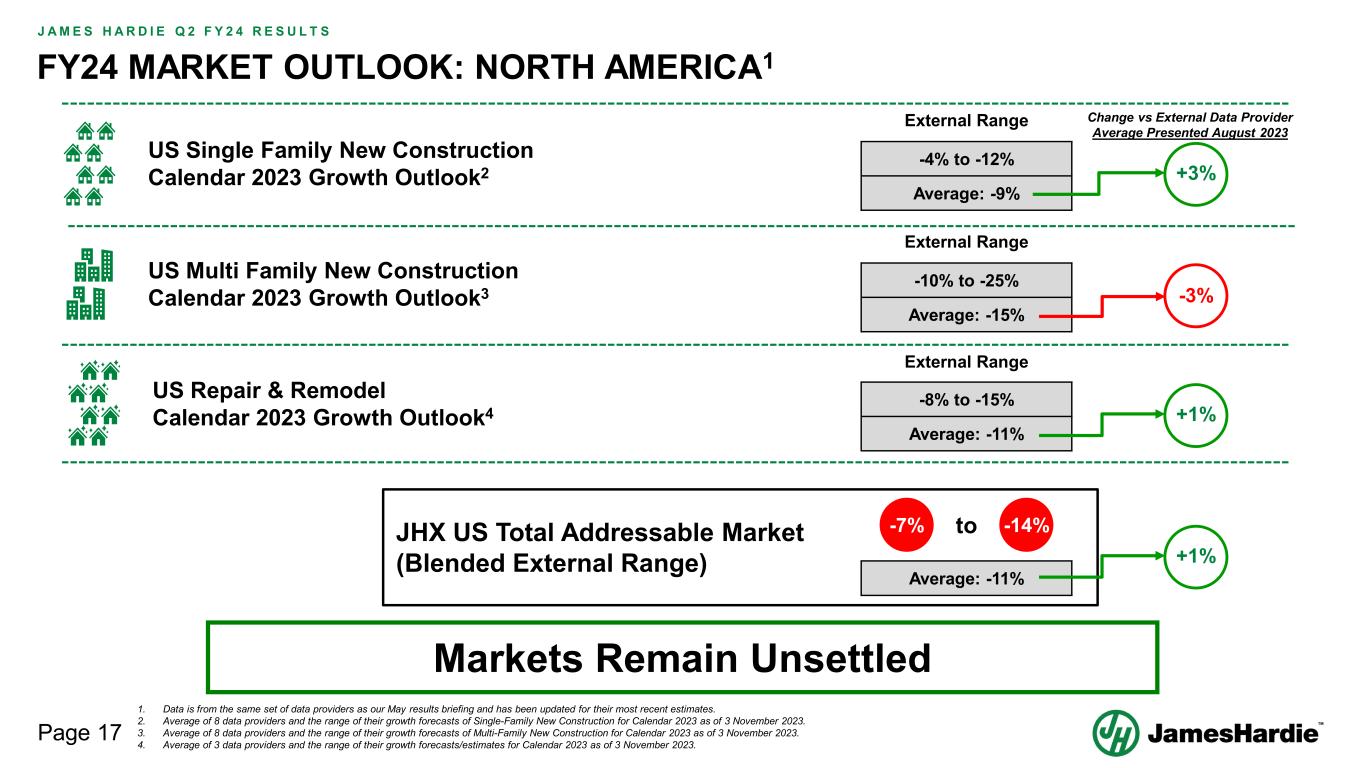
Page 17 J A M E S H A R D I E Q 2 F Y 2 4 R E S U L T S FY24 MARKET OUTLOOK: NORTH AMERICA1 1. Data is from the same set of data providers as our May results briefing and has been updated for their most recent estimates. 2. Average of 8 data providers and the range of their growth forecasts of Single-Family New Construction for Calendar 2023 as of 3 November 2023. 3. Average of 8 data providers and the range of their growth forecasts of Multi-Family New Construction for Calendar 2023 as of 3 November 2023. 4. Average of 3 data providers and the range of their growth forecasts/estimates for Calendar 2023 as of 3 November 2023. US Single Family New Construction Calendar 2023 Growth Outlook2 US Repair & Remodel Calendar 2023 Growth Outlook4 External Range -4% to -12% Average: -9% +3% External Range -10% to -25% Average: -15% US Multi Family New Construction Calendar 2023 Growth Outlook3 External Range -8% to -15% Average: -11% -7% -14%toJHX US Total Addressable Market (Blended External Range) Markets Remain Unsettled +X% Average: -11% -3 Change vs External Data Provider Average Presented August 2023 +1% +1%
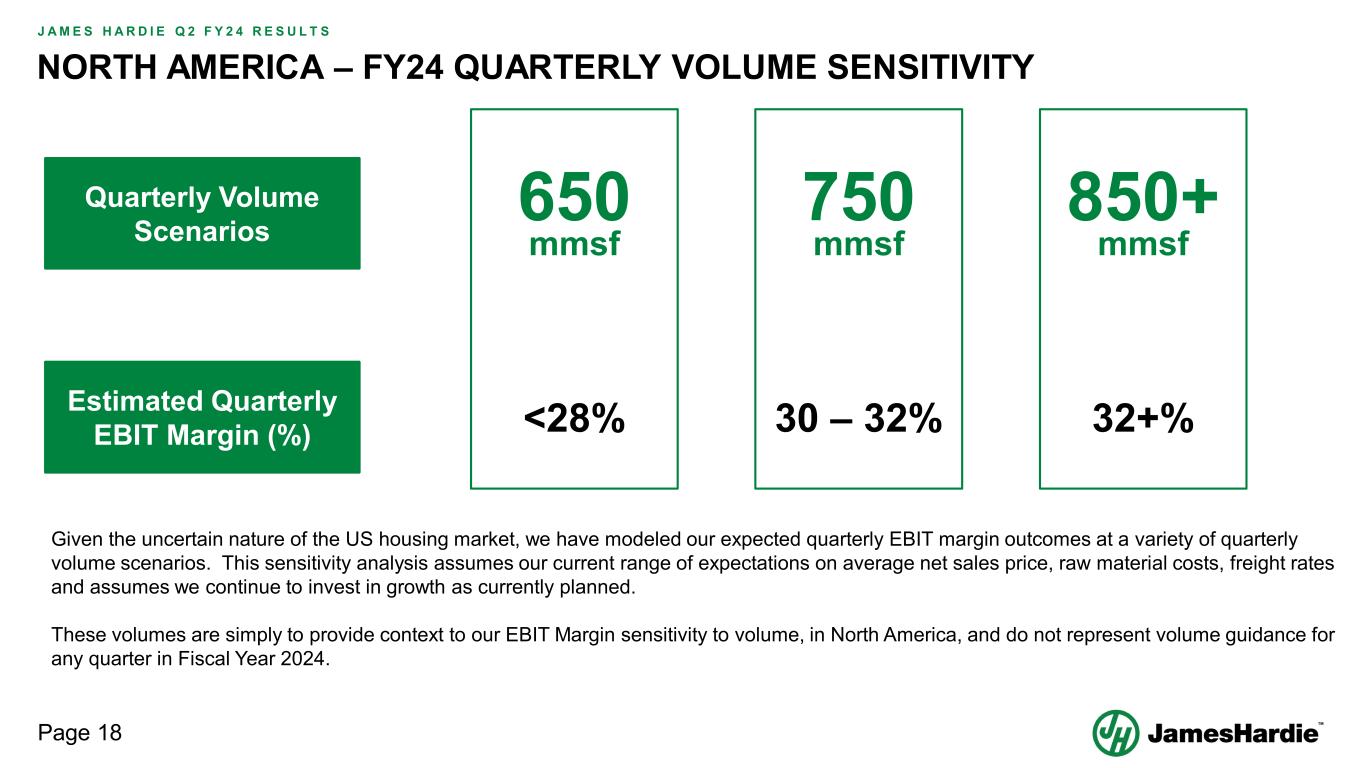
Page 18 J A M E S H A R D I E Q 2 F Y 2 4 R E S U L T S NORTH AMERICA – FY24 QUARTERLY VOLUME SENSITIVITY Estimated Quarterly EBIT Margin (%) 30 – 32% 750 mmsf <28% 650 mmsf Quarterly Volume Scenarios Given the uncertain nature of the US housing market, we have modeled our expected quarterly EBIT margin outcomes at a variety of quarterly volume scenarios. This sensitivity analysis assumes our current range of expectations on average net sales price, raw material costs, freight rates and assumes we continue to invest in growth as currently planned. These volumes are simply to provide context to our EBIT Margin sensitivity to volume, in North America, and do not represent volume guidance for any quarter in Fiscal Year 2024. 32+% 850+ mmsf
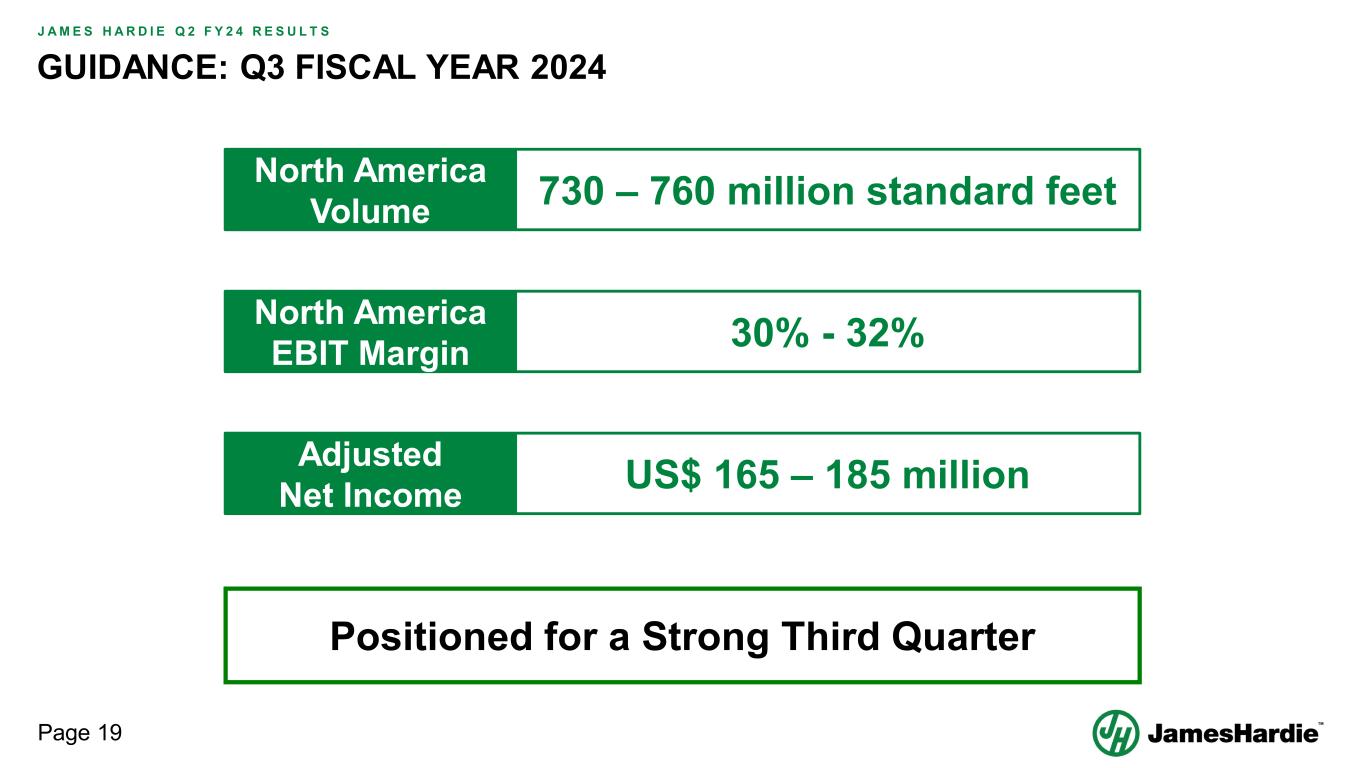
Page 19 J A M E S H A R D I E Q 2 F Y 2 4 R E S U L T S GUIDANCE: Q3 FISCAL YEAR 2024 Adjusted Net Income US$ 165 – 185 million North America Volume 730 – 760 million standard feet North America EBIT Margin 30% - 32% Positioned for a Strong Third Quarter
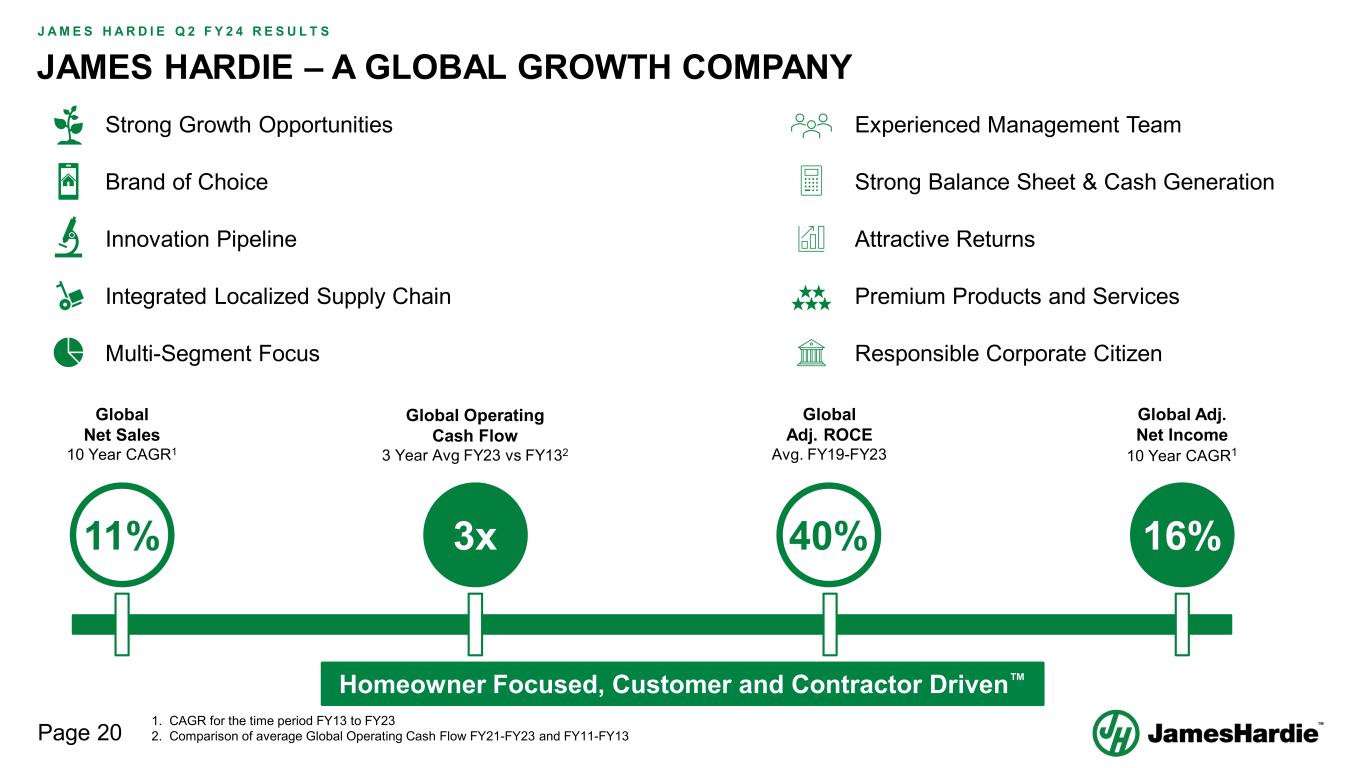
Page 20 J A M E S H A R D I E Q 2 F Y 2 4 R E S U L T S JAMES HARDIE – A GLOBAL GROWTH COMPANY Strong Growth Opportunities Brand of Choice Innovation Pipeline Integrated Localized Supply Chain Multi-Segment Focus Experienced Management Team Strong Balance Sheet & Cash Generation Attractive Returns Premium Products and Services Responsible Corporate Citizen Homeowner Focused, Customer and Contractor Driven™ 11% 16%3x 40% Global Net Sales 10 Year CAGR1 Global Adj. ROCE Avg. FY19-FY23 1. CAGR for the time period FY13 to FY23 2. Comparison of average Global Operating Cash Flow FY21-FY23 and FY11-FY13 Global Operating Cash Flow 3 Year Avg FY23 vs FY132 Global Adj. Net Income 10 Year CAGR1

Questions 8 NOVEMBER 2023

Appendix 8 NOVEMBER 2023
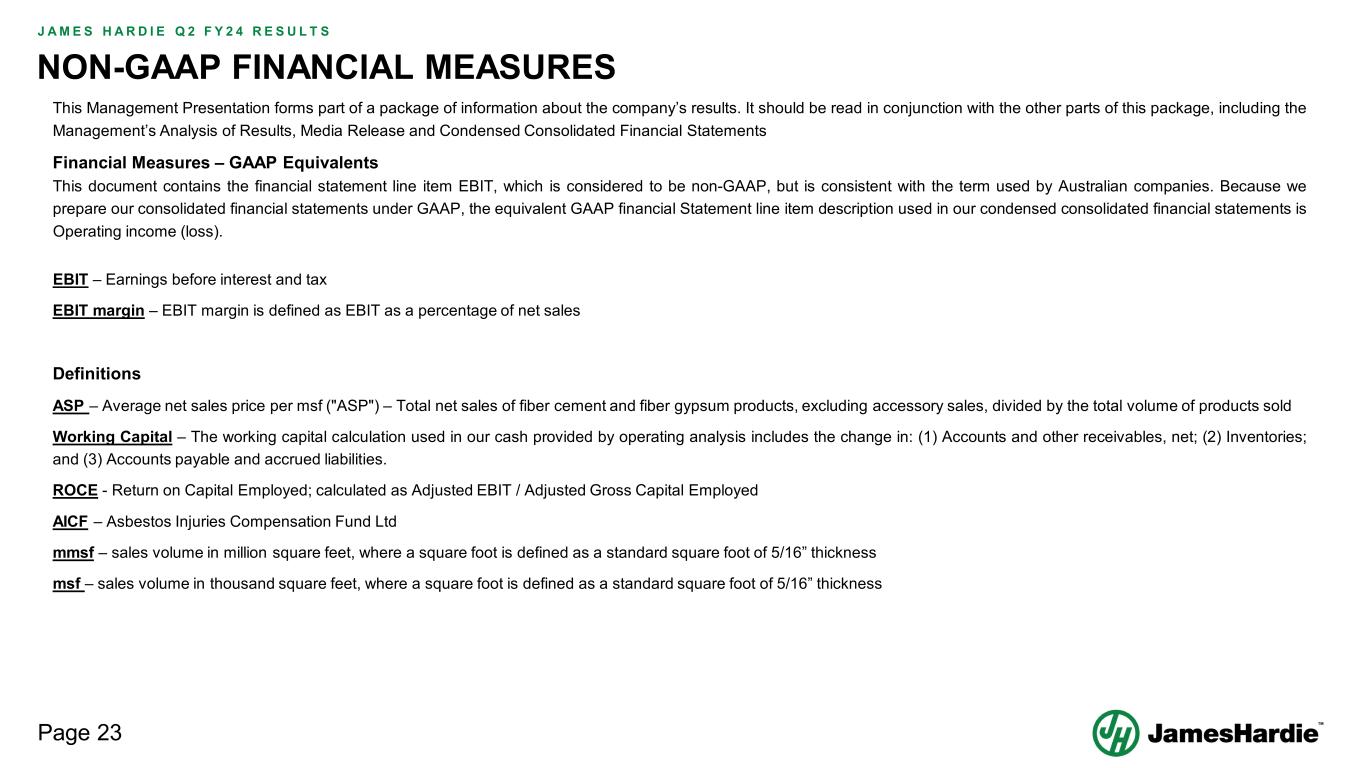
Page 23 J A M E S H A R D I E Q 2 F Y 2 4 R E S U L T S NON-GAAP FINANCIAL MEASURES This Management Presentation forms part of a package of information about the company’s results. It should be read in conjunction with the other parts of this package, including the Management’s Analysis of Results, Media Release and Condensed Consolidated Financial Statements Financial Measures – GAAP Equivalents This document contains the financial statement line item EBIT, which is considered to be non-GAAP, but is consistent with the term used by Australian companies. Because we prepare our consolidated financial statements under GAAP, the equivalent GAAP financial Statement line item description used in our condensed consolidated financial statements is Operating income (loss). EBIT – Earnings before interest and tax EBIT margin – EBIT margin is defined as EBIT as a percentage of net sales Definitions ASP – Average net sales price per msf ("ASP") – Total net sales of fiber cement and fiber gypsum products, excluding accessory sales, divided by the total volume of products sold Working Capital – The working capital calculation used in our cash provided by operating analysis includes the change in: (1) Accounts and other receivables, net; (2) Inventories; and (3) Accounts payable and accrued liabilities. ROCE - Return on Capital Employed; calculated as Adjusted EBIT / Adjusted Gross Capital Employed AICF – Asbestos Injuries Compensation Fund Ltd mmsf – sales volume in million square feet, where a square foot is defined as a standard square foot of 5/16” thickness msf – sales volume in thousand square feet, where a square foot is defined as a standard square foot of 5/16” thickness
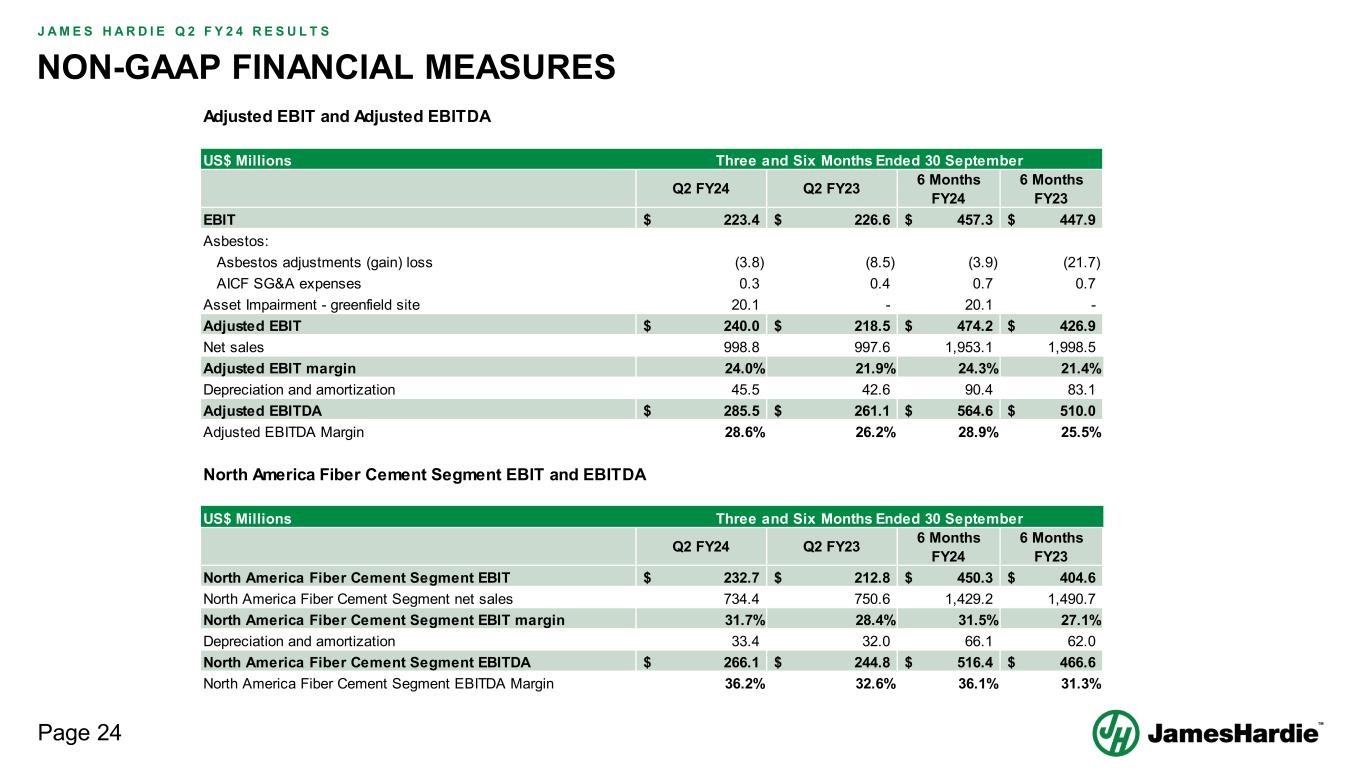
Page 24 J A M E S H A R D I E Q 2 F Y 2 4 R E S U L T S NON-GAAP FINANCIAL MEASURES US$ Millions Q2 FY24 Q2 FY23 6 Months FY24 6 Months FY23 North America Fiber Cement Segment EBIT 232.7$ 212.8$ 450.3$ 404.6$ North America Fiber Cement Segment net sales 734.4 750.6 1,429.2 1,490.7 North America Fiber Cement Segment EBIT margin 31.7% 28.4% 31.5% 27.1% Depreciation and amortization 33.4 32.0 66.1 62.0 North America Fiber Cement Segment EBITDA 266.1$ 244.8$ 516.4$ 466.6$ North America Fiber Cement Segment EBITDA Margin 36.2% 32.6% 36.1% 31.3% North America Fiber Cement Segment EBIT and EBITDA Three and Six Months Ended 30 September Adjusted EBIT and Adjusted EBITDA US$ Millions Q2 FY24 Q2 FY23 6 Months FY24 6 Months FY23 EBIT 223.4$ 226.6$ 457.3$ 447.9$ Asbestos: Asbestos adjustments (gain) loss (3.8) (8.5) (3.9) (21.7) AICF SG&A expenses 0.3 0.4 0.7 0.7 Asset Impairment - greenfield site 20.1 - 20.1 - Adjusted EBIT 240.0$ 218.5$ 474.2$ 426.9$ Net sales 998.8 997.6 1,953.1 1,998.5 Adjusted EBIT margin 24.0% 21.9% 24.3% 21.4% Depreciation and amortization 45.5 42.6 90.4 83.1 Adjusted EBITDA 285.5$ 261.1$ 564.6$ 510.0$ Adjusted EBITDA Margin 28.6% 26.2% 28.9% 25.5% Three and Six Months Ended 30 September
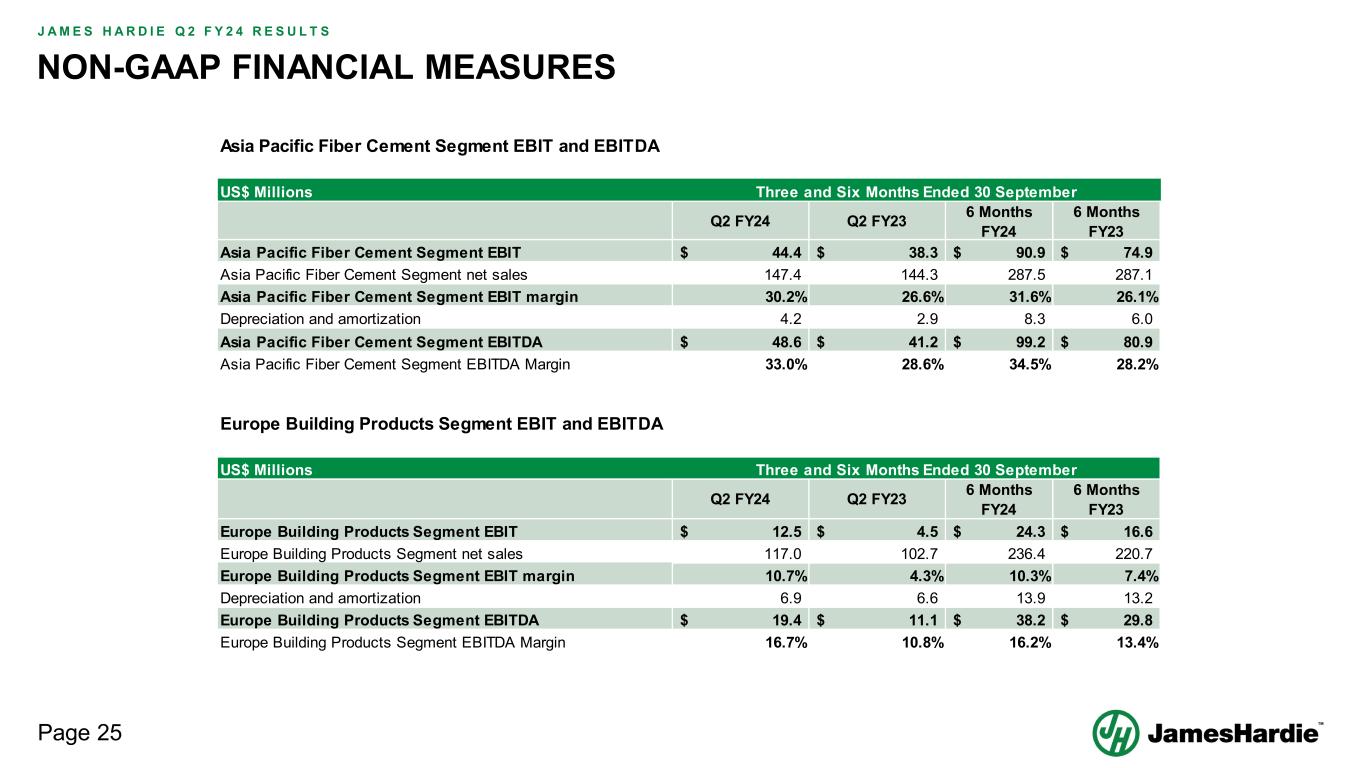
Page 25 J A M E S H A R D I E Q 2 F Y 2 4 R E S U L T S NON-GAAP FINANCIAL MEASURES US$ Millions Q2 FY24 Q2 FY23 6 Months FY24 6 Months FY23 Asia Pacific Fiber Cement Segment EBIT 44.4$ 38.3$ 90.9$ 74.9$ Asia Pacific Fiber Cement Segment net sales 147.4 144.3 287.5 287.1 Asia Pacific Fiber Cement Segment EBIT margin 30.2% 26.6% 31.6% 26.1% Depreciation and amortization 4.2 2.9 8.3 6.0 Asia Pacific Fiber Cement Segment EBITDA 48.6$ 41.2$ 99.2$ 80.9$ Asia Pacific Fiber Cement Segment EBITDA Margin 33.0% 28.6% 34.5% 28.2% Asia Pacific Fiber Cement Segment EBIT and EBITDA Three and Six Months Ended 30 September US$ Millions Q2 FY24 Q2 FY23 6 Months FY24 6 Months FY23 Europe Building Products Segment EBIT 12.5$ 4.5$ 24.3$ 16.6$ Europe Building Products Segment net sales 117.0 102.7 236.4 220.7 Europe Building Products Segment EBIT margin 10.7% 4.3% 10.3% 7.4% Depreciation and amortization 6.9 6.6 13.9 13.2 Europe Building Products Segment EBITDA 19.4$ 11.1$ 38.2$ 29.8$ Europe Building Products Segment EBITDA Margin 16.7% 10.8% 16.2% 13.4% Three and Six Months Ended 30 September Europe Building Products Segment EBIT and EBITDA
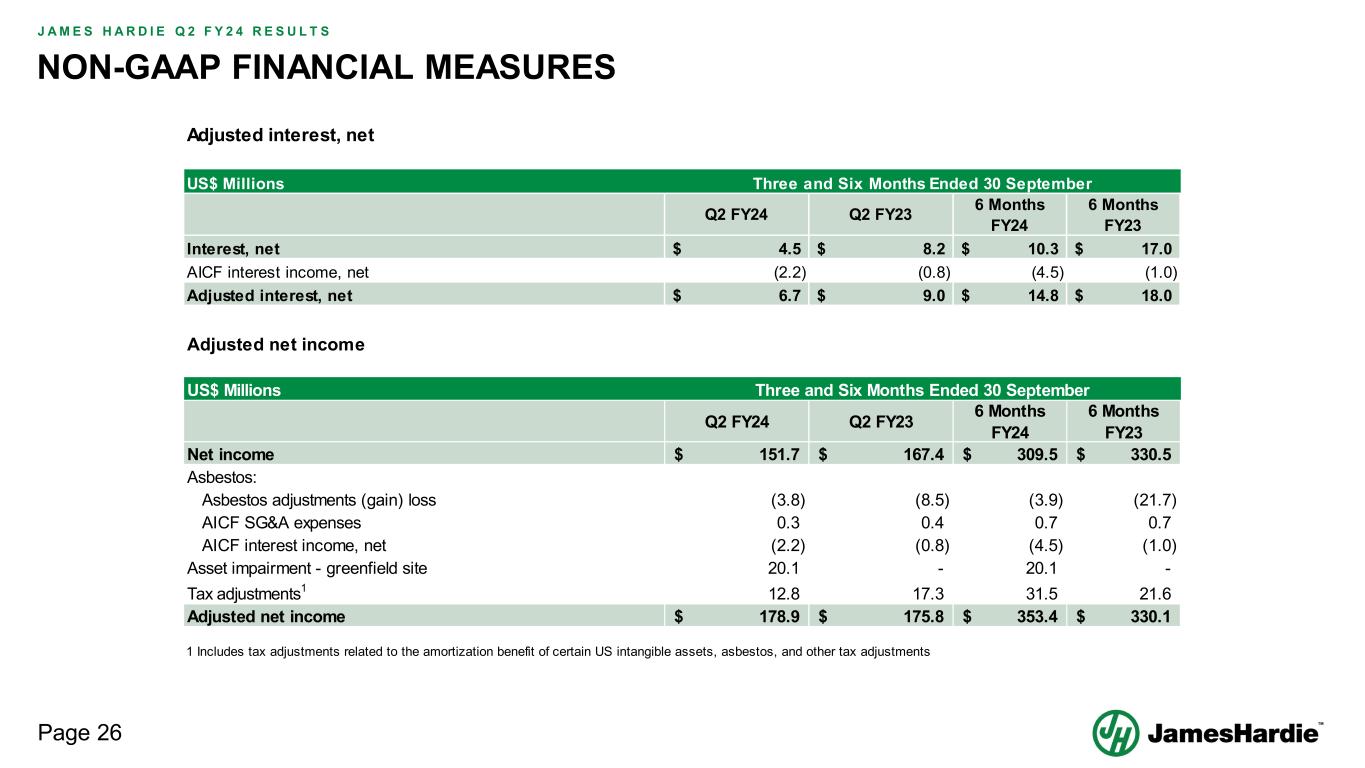
Page 26 J A M E S H A R D I E Q 2 F Y 2 4 R E S U L T S NON-GAAP FINANCIAL MEASURES US$ Millions Q2 FY24 Q2 FY23 6 Months FY24 6 Months FY23 Interest, net 4.5$ 8.2$ 10.3$ 17.0$ AICF interest income, net (2.2) (0.8) (4.5) (1.0) Adjusted interest, net 6.7$ 9.0$ 14.8$ 18.0$ Adjusted interest, net Three and Six Months Ended 30 September Adjusted net income US$ Millions Q2 FY24 Q2 FY23 6 Months FY24 6 Months FY23 Net income 151.7$ 167.4$ 309.5$ 330.5$ Asbestos: Asbestos adjustments (gain) loss (3.8) (8.5) (3.9) (21.7) AICF SG&A expenses 0.3 0.4 0.7 0.7 AICF interest income, net (2.2) (0.8) (4.5) (1.0) Asset impairment - greenfield site 20.1 - 20.1 - Tax adjustments1 12.8 17.3 31.5 21.6 Adjusted net income 178.9$ 175.8$ 353.4$ 330.1$ 1 Includes tax adjustments related to the amortization benefit of certain US intangible assets, asbestos, and other tax adjustments Three and Six Months Ended 30 September
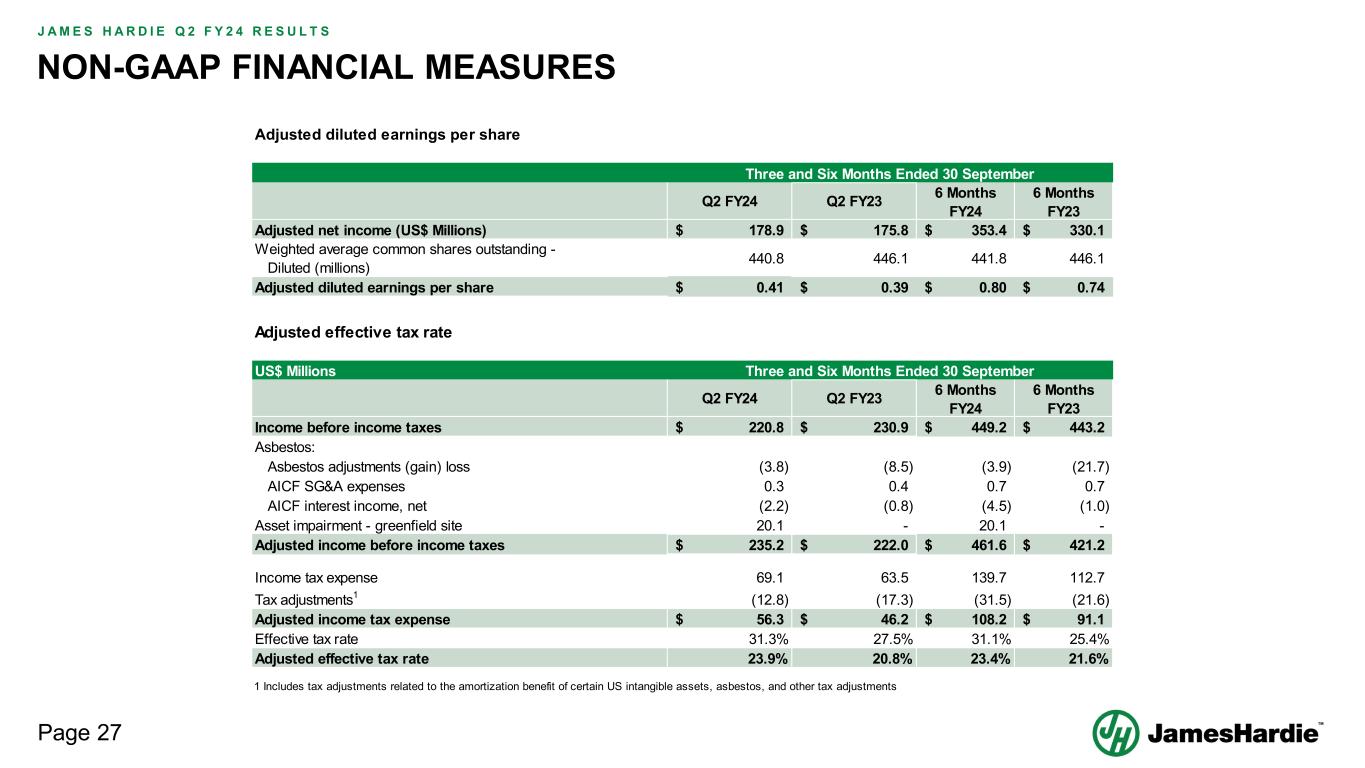
Page 27 J A M E S H A R D I E Q 2 F Y 2 4 R E S U L T S NON-GAAP FINANCIAL MEASURES Adjusted diluted earnings per share Q2 FY24 Q2 FY23 6 Months FY24 6 Months FY23 Adjusted net income (US$ Millions) 178.9$ 175.8$ 353.4$ 330.1$ Weighted average common shares outstanding - Diluted (millions) 440.8 446.1 441.8 446.1 Adjusted diluted earnings per share 0.41$ 0.39$ 0.80$ 0.74$ Three and Six Months Ended 30 September US$ Millions Q2 FY24 Q2 FY23 6 Months FY24 6 Months FY23 Income before income taxes 220.8$ 230.9$ 449.2$ 443.2$ Asbestos: Asbestos adjustments (gain) loss (3.8) (8.5) (3.9) (21.7) AICF SG&A expenses 0.3 0.4 0.7 0.7 AICF interest income, net (2.2) (0.8) (4.5) (1.0) Asset impairment - greenfield site 20.1 - 20.1 - Adjusted income before income taxes 235.2$ 222.0$ 461.6$ 421.2$ Income tax expense 69.1 63.5 139.7 112.7 Tax adjustments1 (12.8) (17.3) (31.5) (21.6) Adjusted income tax expense 56.3$ 46.2$ 108.2$ 91.1$ Effective tax rate 31.3% 27.5% 31.1% 25.4% Adjusted effective tax rate 23.9% 20.8% 23.4% 21.6% 1 Includes tax adjustments related to the amortization benefit of certain US intangible assets, asbestos, and other tax adjustments Three and Six Months Ended 30 September Adjusted effective tax rate

8 NOVEMBER 2023 Q2 FY24 Management Presentation