21 MAY 2024 Q4 FY24 Management Presentation Exhibit 99.4
Page 2 J A M E S H A R D I E Q 4 F Y 2 4 R E S U L T S CAUTIONARY NOTE ON FORWARD-LOOKING STATEMENTS This Management Presentation contains forward looking statements within the meaning of the Private Securities Litigation Reform Act of 1995. James Hardie Industries plc (the “Company”) may from time to time make forward-looking statements in its periodic reports filed with or furnished to the Securities and Exchange Commission on Forms 20-F and 6-K, in its annual reports to shareholders, in media releases and other written materials and in oral statements made by the Company’s officers, directors or employees to analysts, institutional investors, representatives of the media and others. Words such as “believe,” “anticipate,” “plan,” “expect,” “intend,” “target,” “estimate,” “project,” “predict,” “forecast,” “guideline,” “aim,” “will,” “should,” “likely,” “continue,” “may,” “objective,” “outlook” and similar expressions are intended to identify forward-looking statements but are not the exclusive means of identifying such statements. These forward-looking statements are based upon management's current expectations, estimates, assumptions and beliefs concerning future events and conditions. Readers are cautioned not to place undue reliance on any forward-looking statements. Forward-looking statements are necessarily subject to risks, uncertainties and other factors, many of which are unforeseeable and beyond the Company’s control. Many factors could cause actual results, performance or achievements to be materially different from those expressed or implied in this Management Presentation, including, among others, the risks and uncertainties set forth in Section 3 “Risk Factors” in James Hardie’s Annual Report on Form 20-F for the year ended 31 March 2024; changes in general economic, political, governmental and business conditions globally and in the countries in which the Company does business, including; changes in interest rates; changes in inflation rates; changes in exchange rates; the level of construction generally; changes in cement demand and prices; changes in raw material and energy prices; changes in business strategy and various other factors. Should one or more of these risks or uncertainties materialize, or should underlying assumptions prove incorrect, actual results may vary materially from those described herein. James Hardie assumes no obligation to update or correct the information contained in this Management Presentation except as required by law. This Management Presentation includes financial measures that are not considered a measure of financial performance under generally accepted accounting principles in the United States (GAAP). These financial measures are designed to provide investors with an alternative method for assessing our performance from on-going operations, capital efficiency and profit generation. Management uses these financial measures for the same purposes. These financial measures are or may be non-GAAP financial measures as defined in the rules of the U.S. Securities and Exchange Commission and may exclude or include amounts that are included or excluded, as applicable, in the calculation of the most directly comparable financial measures calculated in accordance with GAAP. These non-GAAP financial measures should not be considered to be more meaningful than the equivalent GAAP measure. Management has included such measures to provide investors with an alternative method for assessing its operating results in a manner that is focused on the performance of its ongoing operations and excludes the impact of certain legacy items, such as asbestos adjustments. Additionally, management uses such non-GAAP financial measures for the same purposes. However, these non-GAAP financial measures are not prepared in accordance with GAAP, may not be reported by all of the Company’s competitors and may not be directly comparable to similarly titled measures of the Company’s competitors due to potential differences in the exact method of calculation. For additional information regarding the non-GAAP financial measures presented in this Management Presentation, including a reconciliation of each non-GAAP financial measure to the equivalent GAAP measure, see the slide titled “Non-GAAP Financial Measures” included in the Appendix to this Management Presentation. In addition, this Management Presentation includes financial measures and descriptions that are considered to not be in accordance with GAAP, but which are consistent with financial measures reported by Australian companies, such as operating profit, EBIT and EBIT margin. Since the Company prepares its Consolidated Financial Statements in accordance with GAAP, the Company provides investors with definitions and a cross- reference from the non-GAAP financial measure used in this Management Presentation to the equivalent GAAP financial measure used in the Company’s Consolidated Financial Statements. See the section titled “Non- GAAP Financial Measures” included in the Appendix to this Management Presentation. All amounts are in US Dollars, unless otherwise noted CAUTIONARY NOTE ON FORWARD-LOOKING STATEMENTS USE OF NON-GAAP FINANCIAL INFORMATION; AUSTRALIAN EQUIVALENT TERMINOLOGY

Page 3 J A M E S H A R D I E Q 4 F Y 2 4 R E S U L T S AGENDA • Strategy and Operations • Financial Results • Outlook and Guidance • Q&A Aaron Erter CEO Rachel Wilson CFO

Strategy and Operations 21 MAY 2024
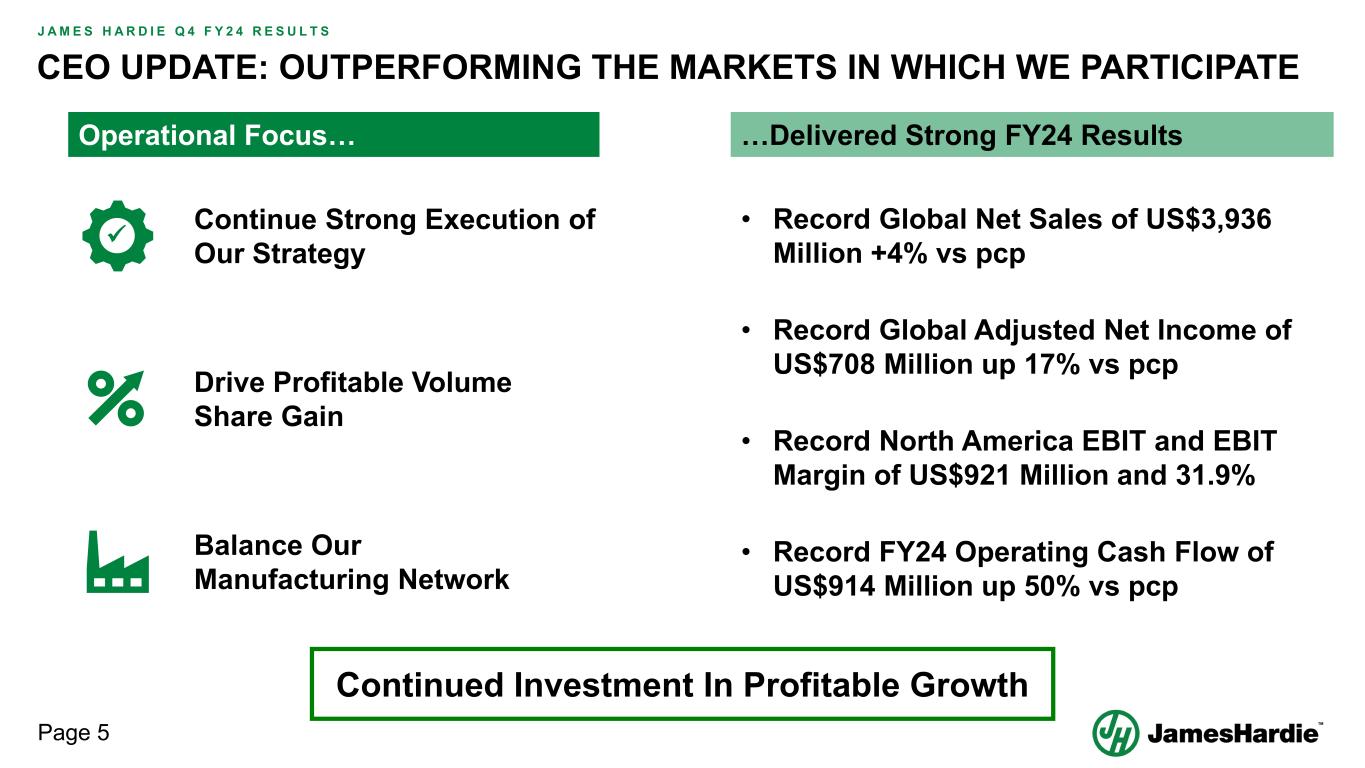
Page 5 J A M E S H A R D I E Q 4 F Y 2 4 R E S U L T S CEO UPDATE: OUTPERFORMING THE MARKETS IN WHICH WE PARTICIPATE Operational Focus… …Delivered Strong FY24 Results Continue Strong Execution of Our Strategy Drive Profitable Volume Share Gain Balance Our Manufacturing Network • Record Global Net Sales of US$3,936 Million +4% vs pcp • Record Global Adjusted Net Income of US$708 Million up 17% vs pcp • Record North America EBIT and EBIT Margin of US$921 Million and 31.9% • Record FY24 Operating Cash Flow of US$914 Million up 50% vs pcp Continued Investment In Profitable Growth
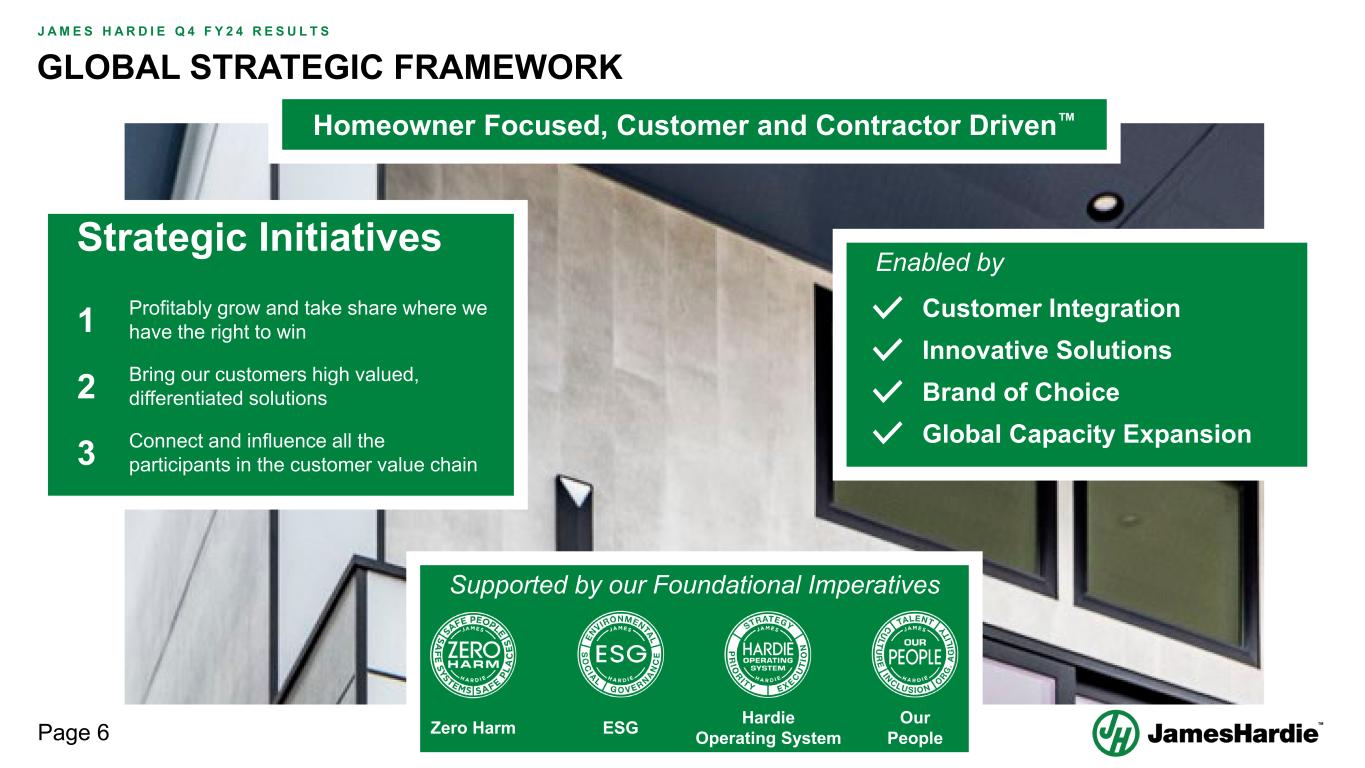
Page 6 J A M E S H A R D I E Q 4 F Y 2 4 R E S U L T S GLOBAL STRATEGIC FRAMEWORK Strategic Initiatives 1 Profitably grow and take share where we have the right to win 2 Bring our customers high valued, differentiated solutions 3 Connect and influence all the participants in the customer value chain Enabled by Customer Integration Innovative Solutions Brand of Choice Global Capacity Expansion Supported by our Foundational Imperatives Our PeopleESGZero Harm Hardie Operating System Homeowner Focused, Customer and Contractor Driven
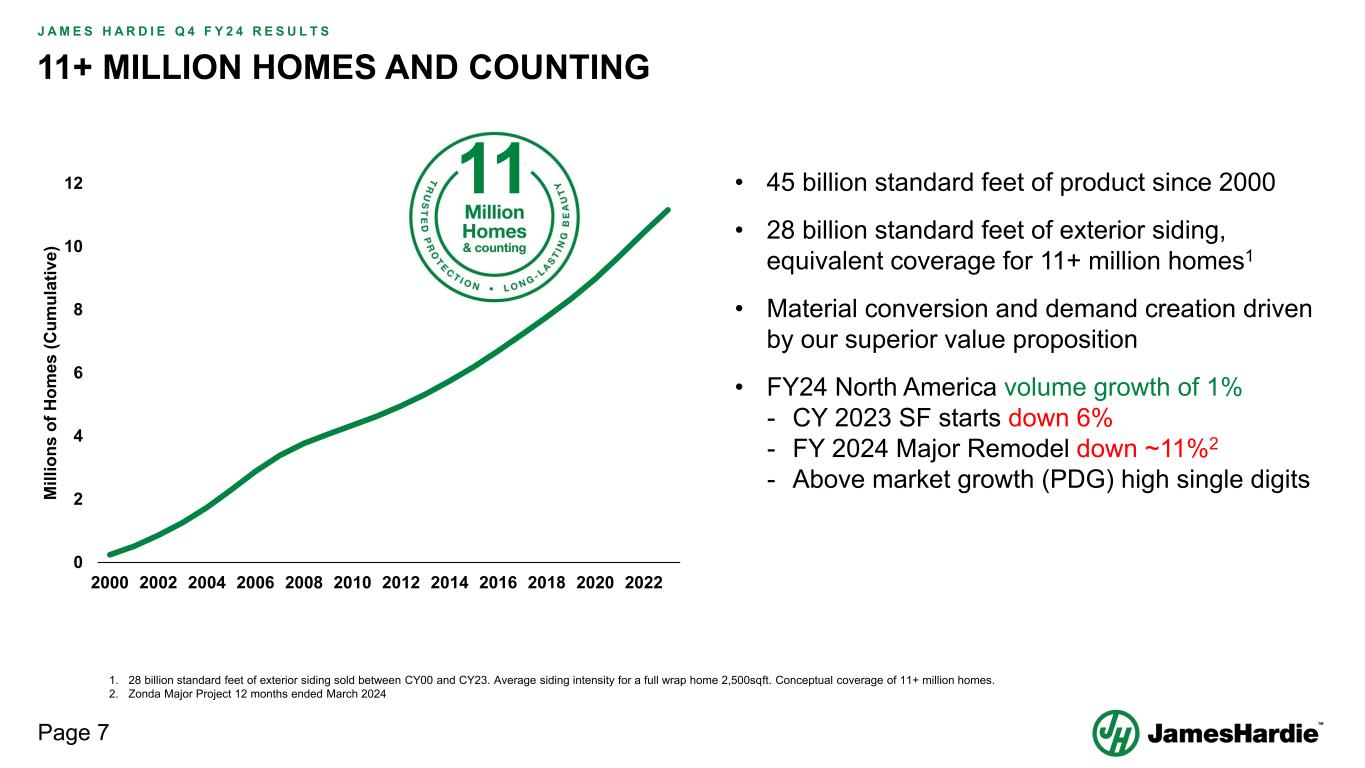
Page 7 J A M E S H A R D I E Q 4 F Y 2 4 R E S U L T S 11+ MILLION HOMES AND COUNTING • 45 billion standard feet of product since 2000 • 28 billion standard feet of exterior siding, equivalent coverage for 11+ million homes1 • Material conversion and demand creation driven by our superior value proposition • FY24 North America volume growth of 1% - CY 2023 SF starts down 6% - FY 2024 Major Remodel down ~11%2 - Above market growth (PDG) high single digits 1. 28 billion standard feet of exterior siding sold between CY00 and CY23. Average siding intensity for a full wrap home 2,500sqft. Conceptual coverage of 11+ million homes. 2. Zonda Major Project 12 months ended March 2024 0 2 4 6 8 10 12 2000 2002 2004 2006 2008 2010 2012 2014 2016 2018 2020 2022 M ill io ns o f H om es (C um ul at iv e) 11
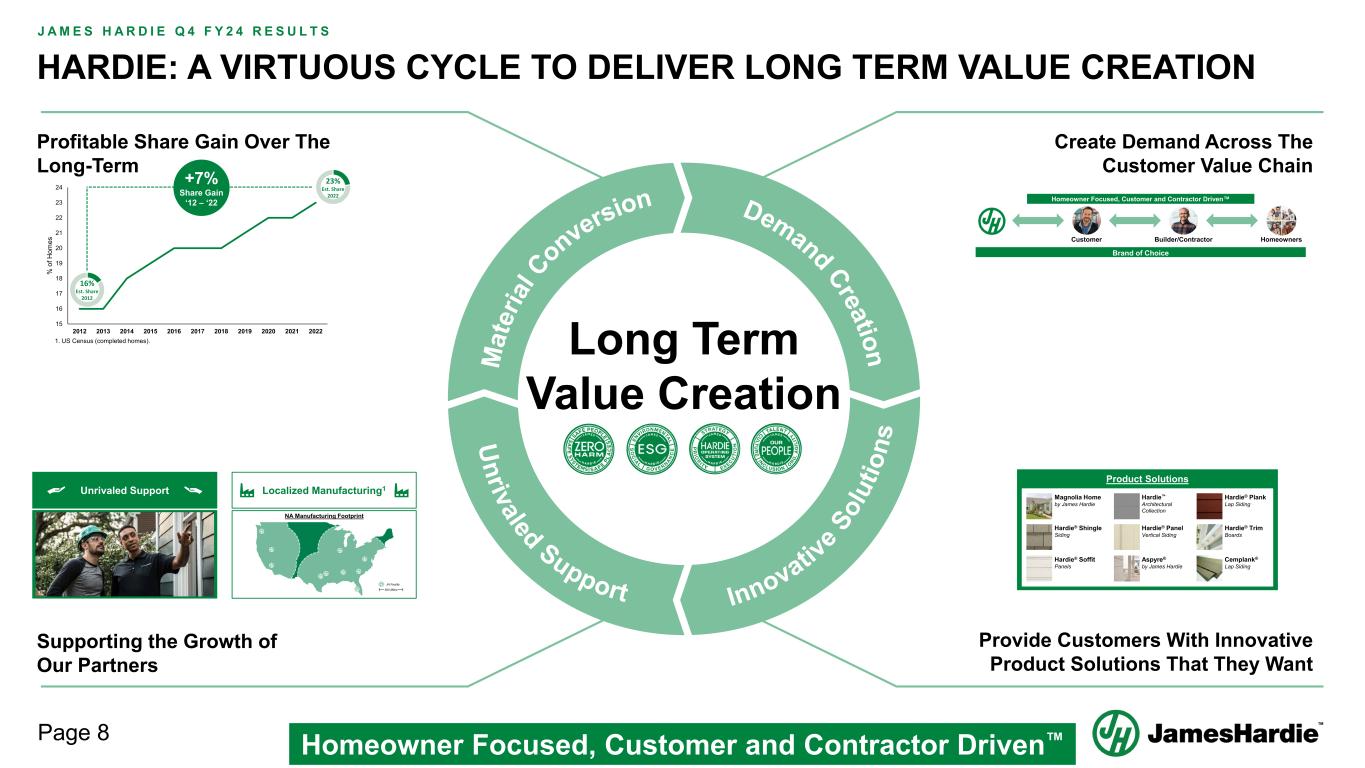
Page 8 J A M E S H A R D I E Q 4 F Y 2 4 R E S U L T S HARDIE: A VIRTUOUS CYCLE TO DELIVER LONG TERM VALUE CREATION 15 16 17 18 19 20 21 22 23 24 2012 2013 2014 2015 2016 2017 2018 2019 2020 2021 2022 % o f H om es 1. US Census (completed homes). 16% Est. Share 2012 23% Est. Share 2022 +7% Share Gain ‘12 – ‘22 Profitable Share Gain Over The Long-Term Brand of Choice Customer Builder/Contractor Homeowners Homeowner Focused, Customer and Contractor Driven™ Create Demand Across The Customer Value Chain Provide Customers With Innovative Product Solutions That They Want Supporting the Growth of Our Partners Product Solutions Magnolia Home by James Hardie Hardie® Shingle Siding Hardie® Soffit Panels Hardie™ Architectural Collection Aspyre® by James Hardie Hardie® Trim Boards Cemplank® Lap Siding Hardie® Panel Vertical Siding Hardie® Plank Lap Siding Unrivaled Support Localized Manufacturing1 NA Manufacturing Footprint 500 Miles JH Facility Long Term Value Creation Homeowner Focused, Customer and Contractor Driven

21 MAY 2024 Financial Results
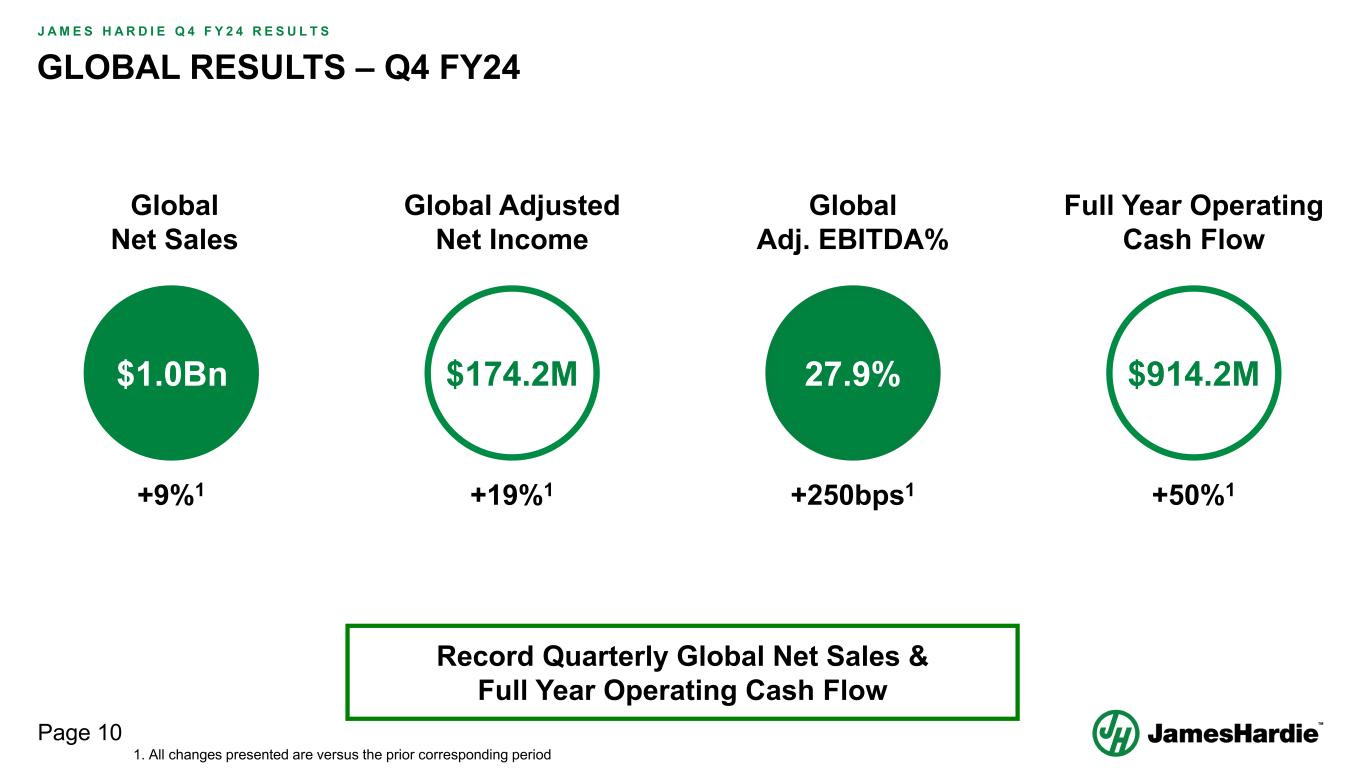
Page 10 J A M E S H A R D I E Q 4 F Y 2 4 R E S U L T S GLOBAL RESULTS – Q4 FY24 $914.2M$174.2M$1.0Bn 27.9% Global Net Sales +9%1 +19%1 Global Adjusted Net Income Global Adj. EBITDA% +250bps1 Full Year Operating Cash Flow +50%1 Record Quarterly Global Net Sales & Full Year Operating Cash Flow 1. All changes presented are versus the prior corresponding period
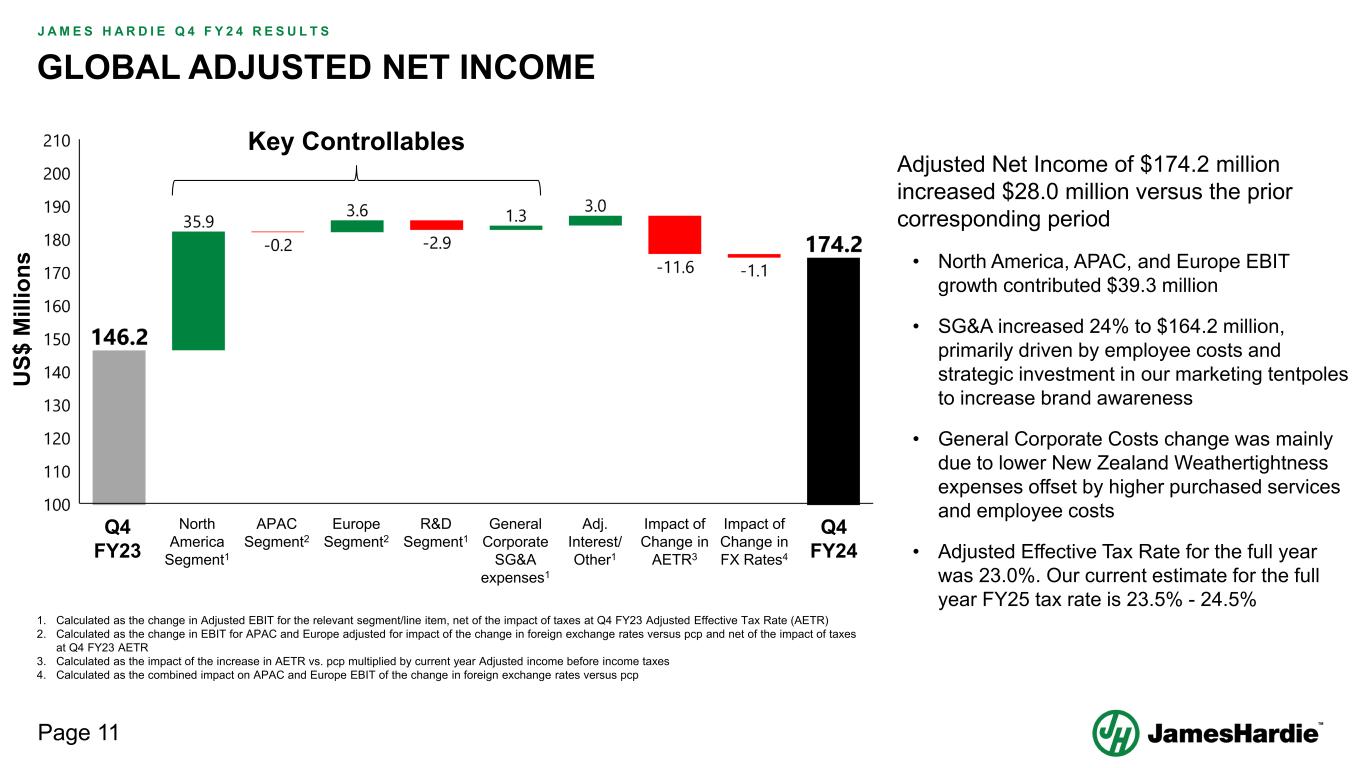
Page 11 J A M E S H A R D I E Q 4 F Y 2 4 R E S U L T S GLOBAL ADJUSTED NET INCOME Adjusted Net Income of $174.2 million increased $28.0 million versus the prior corresponding period • North America, APAC, and Europe EBIT growth contributed $39.3 million • SG&A increased 24% to $164.2 million, primarily driven by employee costs and strategic investment in our marketing tentpoles to increase brand awareness • General Corporate Costs change was mainly due to lower New Zealand Weathertightness expenses offset by higher purchased services and employee costs • Adjusted Effective Tax Rate for the full year was 23.0%. Our current estimate for the full year FY25 tax rate is 23.5% - 24.5% North America Segment1 Europe Segment2 R&D Segment1 General Corporate SG&A expenses1 Adj. Interest/ Other1 Impact of Change in AETR3 Impact of Change in FX Rates4 Q4 FY23 Q4 FY24 APAC Segment2 U S$ M ill io ns 1. Calculated as the change in Adjusted EBIT for the relevant segment/line item, net of the impact of taxes at Q4 FY23 Adjusted Effective Tax Rate (AETR) 2. Calculated as the change in EBIT for APAC and Europe adjusted for impact of the change in foreign exchange rates versus pcp and net of the impact of taxes at Q4 FY23 AETR 3. Calculated as the impact of the increase in AETR vs. pcp multiplied by current year Adjusted income before income taxes 4. Calculated as the combined impact on APAC and Europe EBIT of the change in foreign exchange rates versus pcp Key Controllables
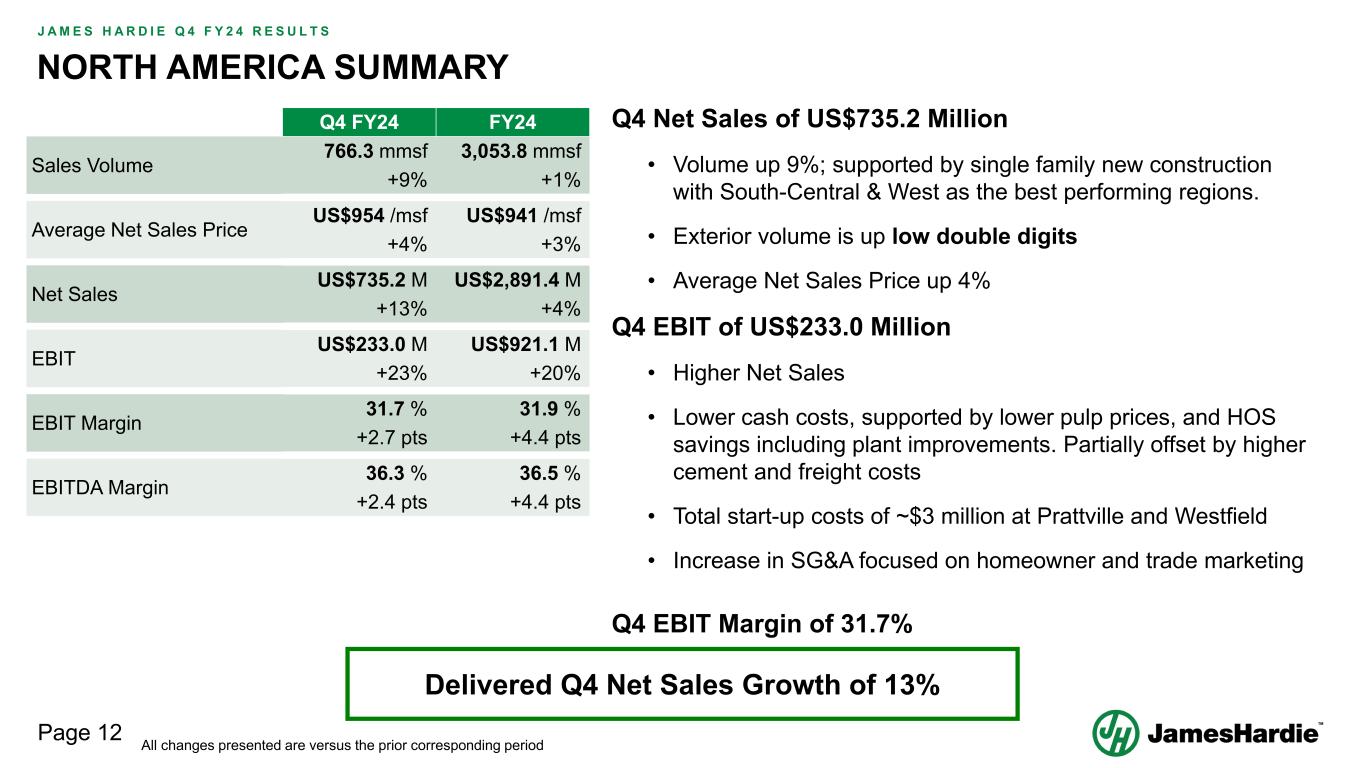
Page 12 J A M E S H A R D I E Q 4 F Y 2 4 R E S U L T S NORTH AMERICA SUMMARY Q4 Net Sales of US$735.2 Million • Volume up 9%; supported by single family new construction with South-Central & West as the best performing regions. • Exterior volume is up low double digits • Average Net Sales Price up 4% Q4 EBIT of US$233.0 Million • Higher Net Sales • Lower cash costs, supported by lower pulp prices, and HOS savings including plant improvements. Partially offset by higher cement and freight costs • Total start-up costs of ~$3 million at Prattville and Westfield • Increase in SG&A focused on homeowner and trade marketing Q4 EBIT Margin of 31.7% Delivered Q4 Net Sales Growth of 13% Q4 FY24 FY24 Sales Volume 766.3 mmsf 3,053.8 mmsf +9% +1% Average Net Sales Price US$954 /msf US$941 /msf +4% +3% Net Sales US$735.2 M US$2,891.4 M +13% +4% EBIT US$233.0 M US$921.1 M +23% +20% EBIT Margin 31.7 % 31.9 % +2.7 pts +4.4 pts EBITDA Margin 36.3 % 36.5 % +2.4 pts +4.4 pts All changes presented are versus the prior corresponding period
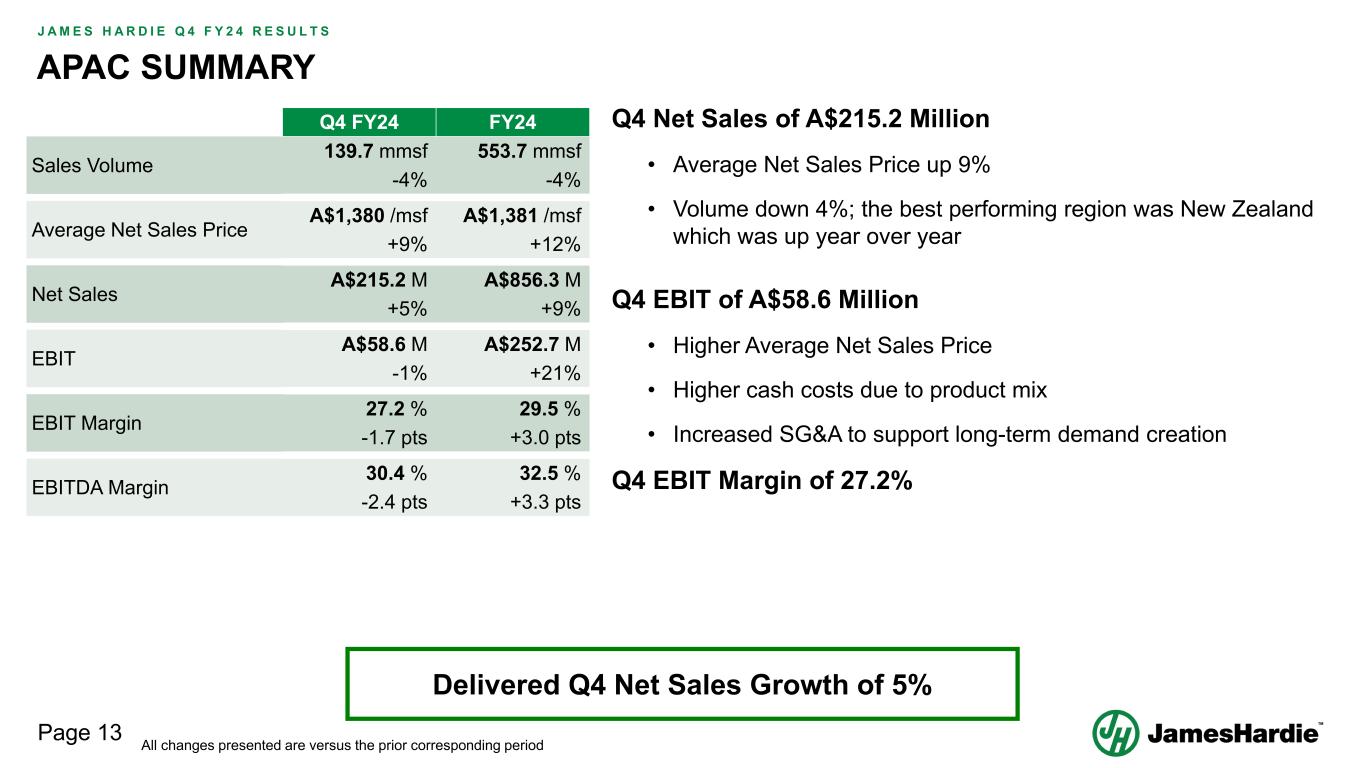
Page 13 J A M E S H A R D I E Q 4 F Y 2 4 R E S U L T S APAC SUMMARY Delivered Q4 Net Sales Growth of 5% Q4 Net Sales of A$215.2 Million • Average Net Sales Price up 9% • Volume down 4%; the best performing region was New Zealand which was up year over year Q4 EBIT of A$58.6 Million • Higher Average Net Sales Price • Higher cash costs due to product mix • Increased SG&A to support long-term demand creation Q4 EBIT Margin of 27.2% Q4 FY24 FY24 Sales Volume 139.7 mmsf 553.7 mmsf -4% -4% Average Net Sales Price A$1,380 /msf A$1,381 /msf +9% +12% Net Sales A$215.2 M A$856.3 M +5% +9% EBIT A$58.6 M A$252.7 M -1% +21% EBIT Margin 27.2 % 29.5 % -1.7 pts +3.0 pts EBITDA Margin 30.4 % 32.5 % -2.4 pts +3.3 pts All changes presented are versus the prior corresponding period
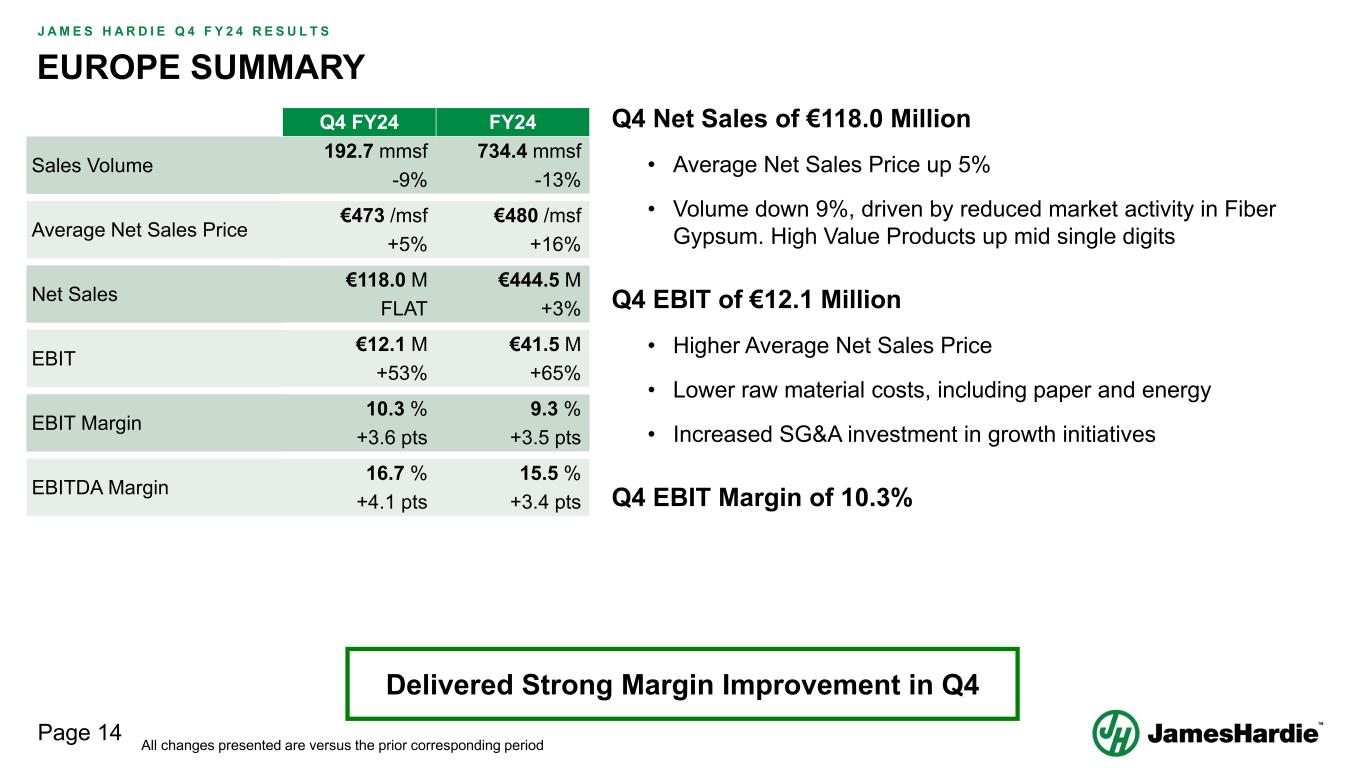
Page 14 J A M E S H A R D I E Q 4 F Y 2 4 R E S U L T S EUROPE SUMMARY Delivered Strong Margin Improvement in Q4 Q4 Net Sales of €118.0 Million • Average Net Sales Price up 5% • Volume down 9%, driven by reduced market activity in Fiber Gypsum. High Value Products up mid single digits Q4 EBIT of €12.1 Million • Higher Average Net Sales Price • Lower raw material costs, including paper and energy • Increased SG&A investment in growth initiatives Q4 EBIT Margin of 10.3% Q4 FY24 FY24 Sales Volume 192.7 mmsf 734.4 mmsf -9% -13% Average Net Sales Price €473 /msf €480 /msf +5% +16% Net Sales €118.0 M €444.5 M FLAT +3% EBIT €12.1 M €41.5 M +53% +65% EBIT Margin 10.3 % 9.3 % +3.6 pts +3.5 pts EBITDA Margin 16.7 % 15.5 % +4.1 pts +3.4 pts All changes presented are versus the prior corresponding period
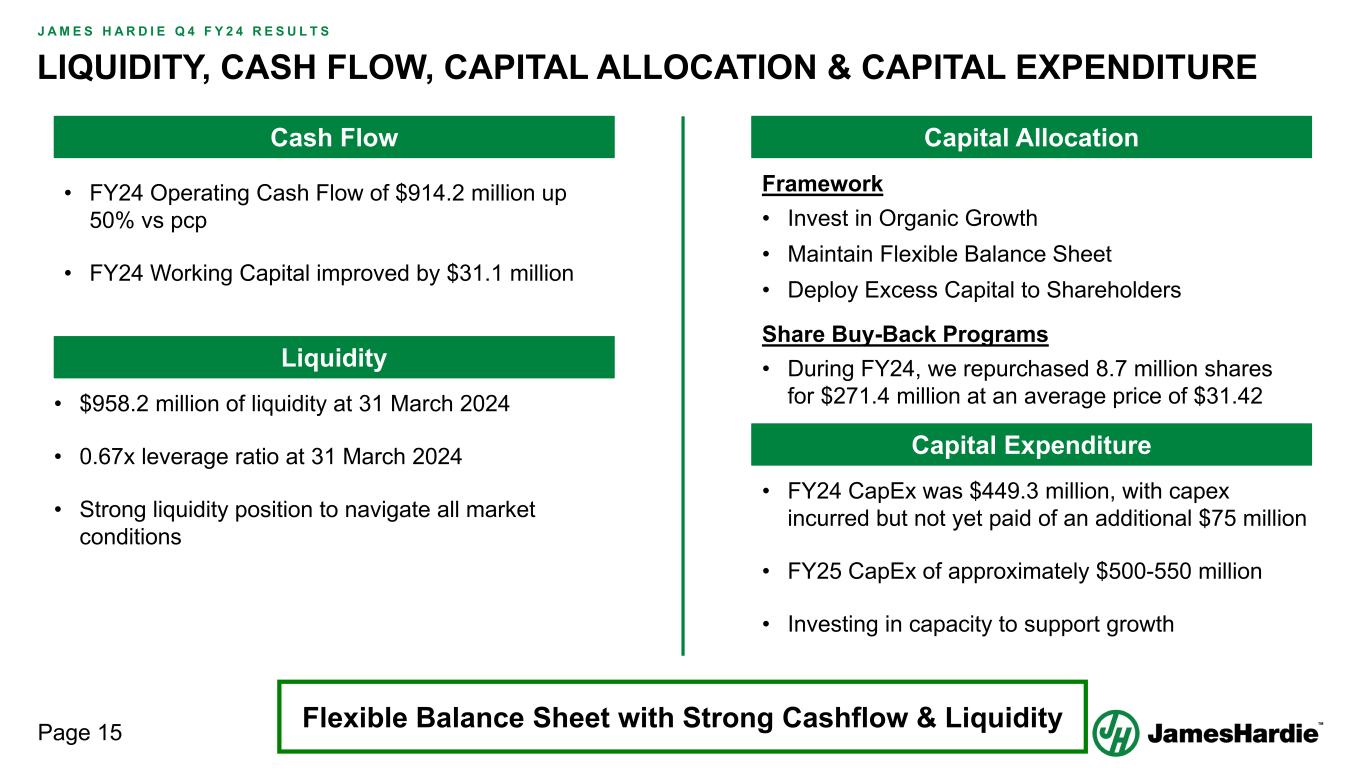
Page 15 J A M E S H A R D I E Q 4 F Y 2 4 R E S U L T S LIQUIDITY, CASH FLOW, CAPITAL ALLOCATION & CAPITAL EXPENDITURE • FY24 Operating Cash Flow of $914.2 million up 50% vs pcp • FY24 Working Capital improved by $31.1 million • $958.2 million of liquidity at 31 March 2024 • 0.67x leverage ratio at 31 March 2024 • Strong liquidity position to navigate all market conditions Cash Flow Liquidity Capital Allocation Framework • Invest in Organic Growth • Maintain Flexible Balance Sheet • Deploy Excess Capital to Shareholders Share Buy-Back Programs • During FY24, we repurchased 8.7 million shares for $271.4 million at an average price of $31.42 • FY24 CapEx was $449.3 million, with capex incurred but not yet paid of an additional $75 million • FY25 CapEx of approximately $500-550 million • Investing in capacity to support growth Capital Expenditure Flexible Balance Sheet with Strong Cashflow & Liquidity
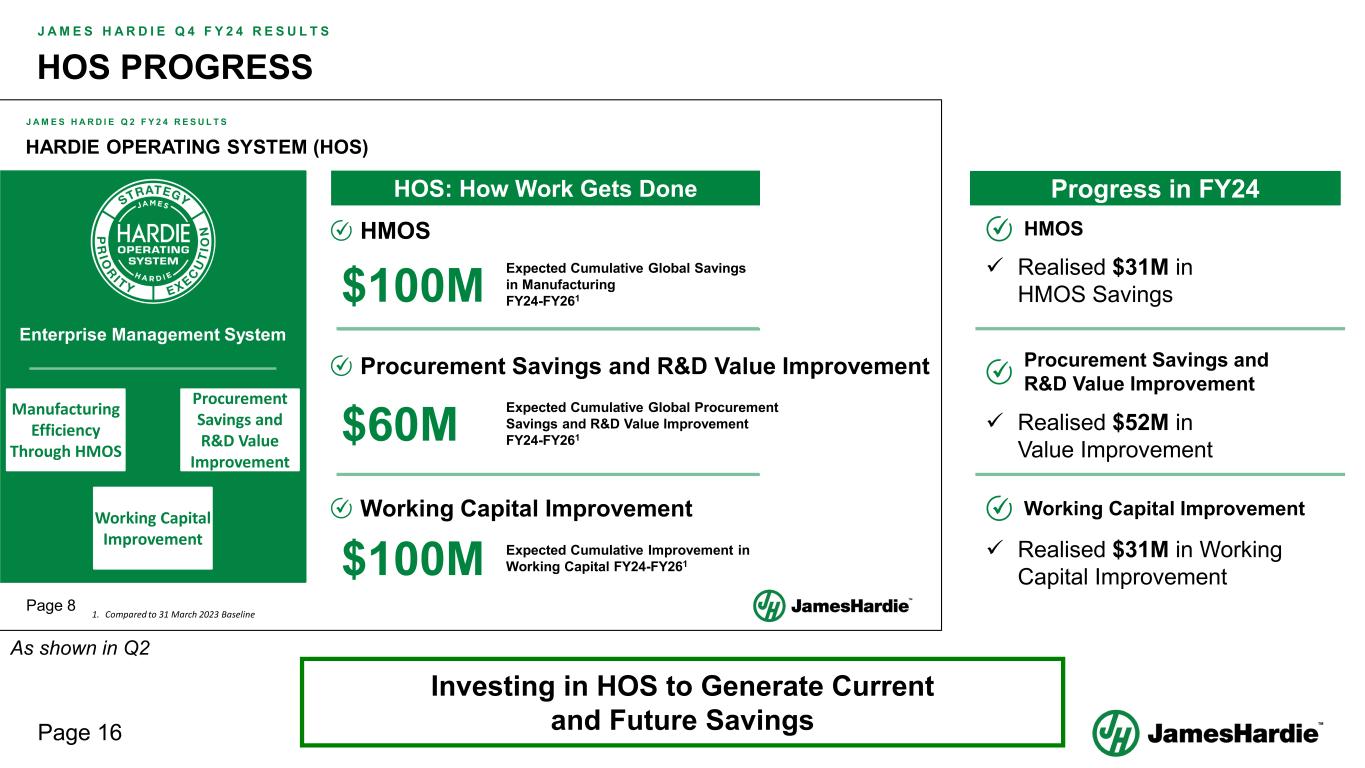
Page 16 J A M E S H A R D I E Q 4 F Y 2 4 R E S U L T S HOS PROGRESS Investing in HOS to Generate Current and Future Savings Page 8 J A M E S H A R D I E Q 2 F Y 2 4 R E S U L T S HARDIE OPERATING SYSTEM (HOS) Manufacturing Efficiency Through HMOS Working Capital Improvement Procurement Savings and R&D Value Improvement HOS: How Work Gets Done Procurement Savings and R&D Value Improvement Expected Cumulative Global Savings in Manufacturing FY24-FY261 $60M Expected Cumulative Global Procurement Savings and R&D Value Improvement FY24-FY261 HMOS Working Capital Improvement $100M Expected Cumulative Improvement in Working Capital FY24-FY261 $100M Enterprise Management System 1. Compared to 31 March 2023 Baseline Realised $31M in HMOS Savings Progress in FY24 As shown in Q2 Procurement Savings and R&D Value Improvement HMOS Realised $52M in Value Improvement Working Capital Improvement Realised $31M in Working Capital Improvement
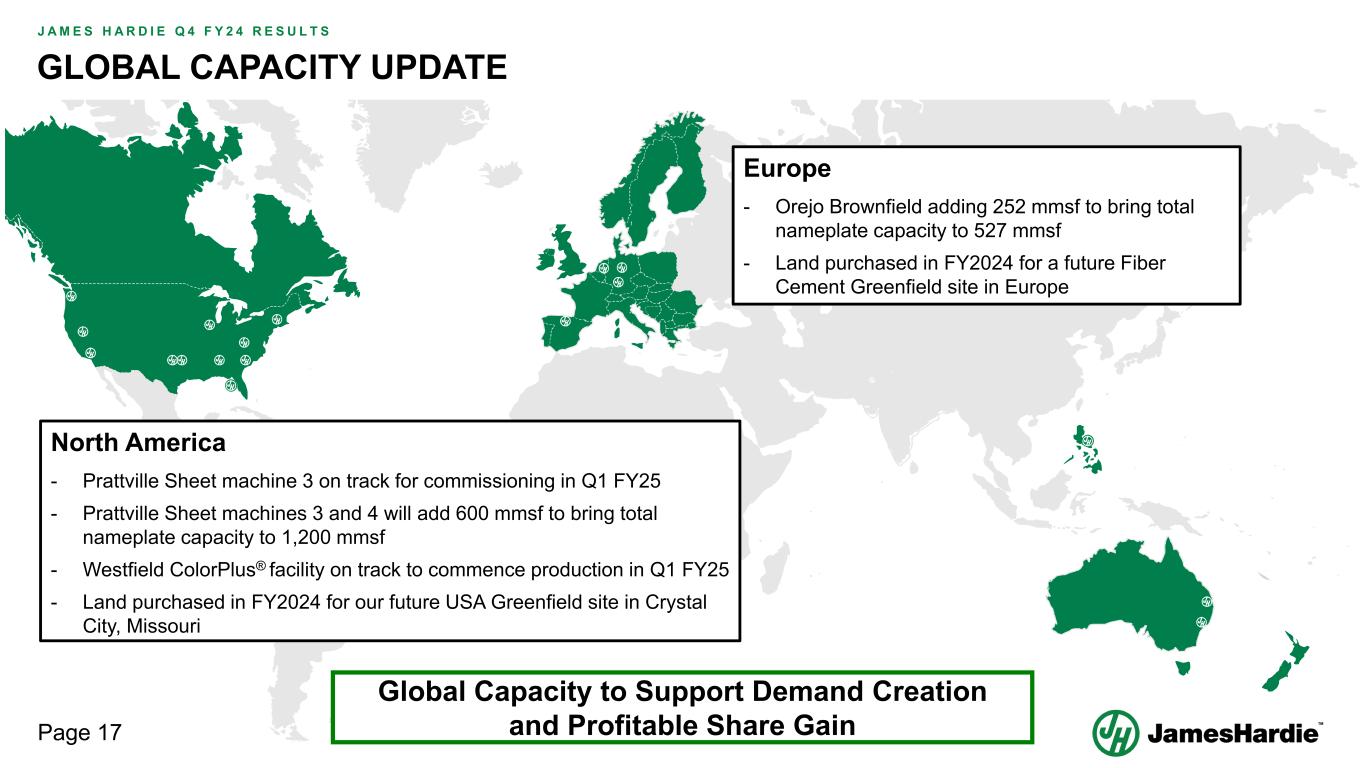
Page 17 J A M E S H A R D I E Q 4 F Y 2 4 R E S U L T S GLOBAL CAPACITY UPDATE North America - Prattville Sheet machine 3 on track for commissioning in Q1 FY25 - Prattville Sheet machines 3 and 4 will add 600 mmsf to bring total nameplate capacity to 1,200 mmsf - Westfield ColorPlus® facility on track to commence production in Q1 FY25 - Land purchased in FY2024 for our future USA Greenfield site in Crystal City, Missouri Global Capacity to Support Demand Creation and Profitable Share Gain Europe - Orejo Brownfield adding 252 mmsf to bring total nameplate capacity to 527 mmsf - Land purchased in FY2024 for a future Fiber Cement Greenfield site in Europe

Outlook and Guidance 21 MAY 2024
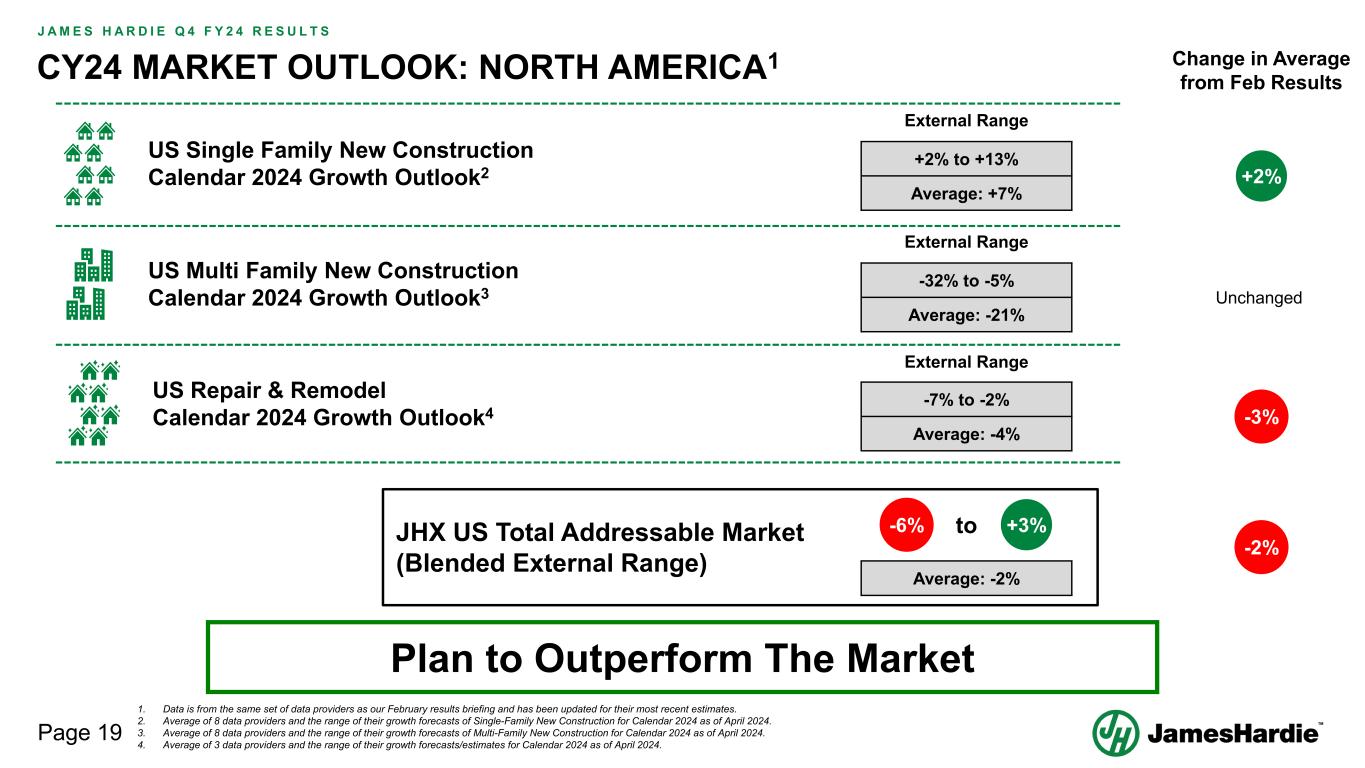
Page 19 J A M E S H A R D I E Q 4 F Y 2 4 R E S U L T S CY24 MARKET OUTLOOK: NORTH AMERICA1 1. Data is from the same set of data providers as our February results briefing and has been updated for their most recent estimates. 2. Average of 8 data providers and the range of their growth forecasts of Single-Family New Construction for Calendar 2024 as of April 2024. 3. Average of 8 data providers and the range of their growth forecasts of Multi-Family New Construction for Calendar 2024 as of April 2024. 4. Average of 3 data providers and the range of their growth forecasts/estimates for Calendar 2024 as of April 2024. US Single Family New Construction Calendar 2024 Growth Outlook2 US Repair & Remodel Calendar 2024 Growth Outlook4 External Range +2% to +13% Average: +7% External Range -32% to -5% Average: -21% US Multi Family New Construction Calendar 2024 Growth Outlook3 External Range -7% to -2% Average: -4% -6% +3%toJHX US Total Addressable Market (Blended External Range) Plan to Outperform The Market Average: -2% -3% -2% +2% Unchanged Change in Average from Feb Results
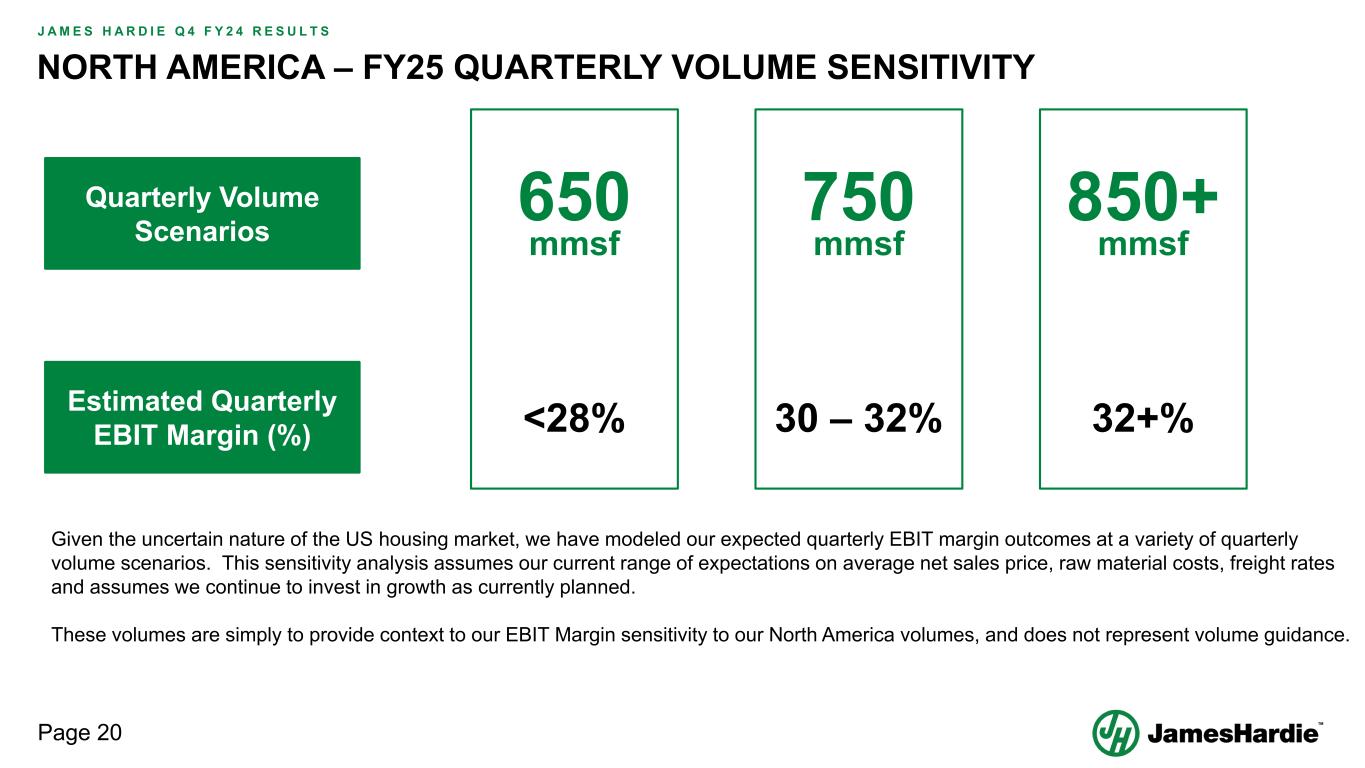
Page 20 J A M E S H A R D I E Q 4 F Y 2 4 R E S U L T S NORTH AMERICA – FY25 QUARTERLY VOLUME SENSITIVITY Estimated Quarterly EBIT Margin (%) 30 – 32% 750 mmsf <28% 650 mmsf Quarterly Volume Scenarios Given the uncertain nature of the US housing market, we have modeled our expected quarterly EBIT margin outcomes at a variety of quarterly volume scenarios. This sensitivity analysis assumes our current range of expectations on average net sales price, raw material costs, freight rates and assumes we continue to invest in growth as currently planned. These volumes are simply to provide context to our EBIT Margin sensitivity to our North America volumes, and does not represent volume guidance. 32+% 850+ mmsf
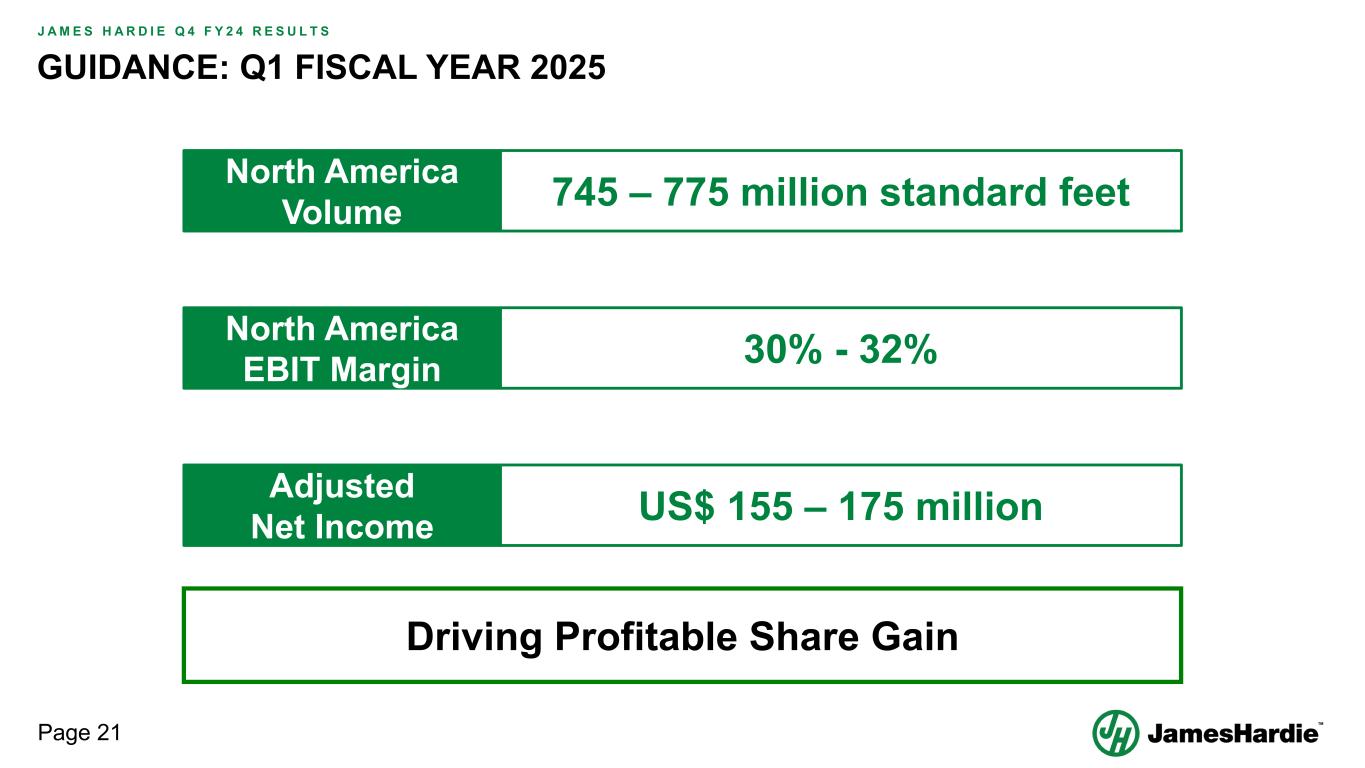
Page 21 J A M E S H A R D I E Q 4 F Y 2 4 R E S U L T S GUIDANCE: Q1 FISCAL YEAR 2025 Driving Profitable Share Gain Adjusted Net Income US$ 155 – 175 million North America Volume 745 – 775 million standard feet North America EBIT Margin 30% - 32%
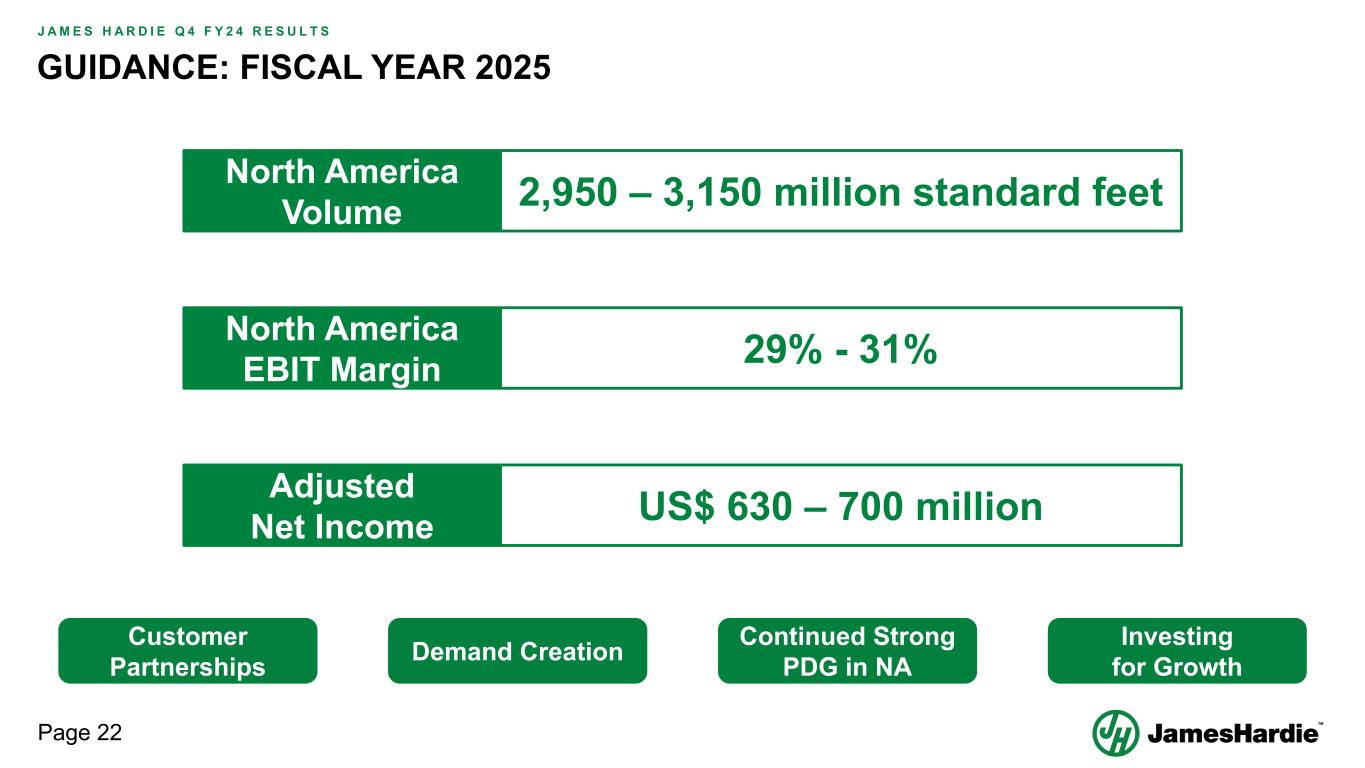
Page 22 J A M E S H A R D I E Q 4 F Y 2 4 R E S U L T S GUIDANCE: FISCAL YEAR 2025 Adjusted Net Income US$ 630 – 700 million North America Volume 2,950 – 3,150 million standard feet North America EBIT Margin 29% - 31% Customer Partnerships Demand Creation Continued Strong PDG in NA Investing for Growth
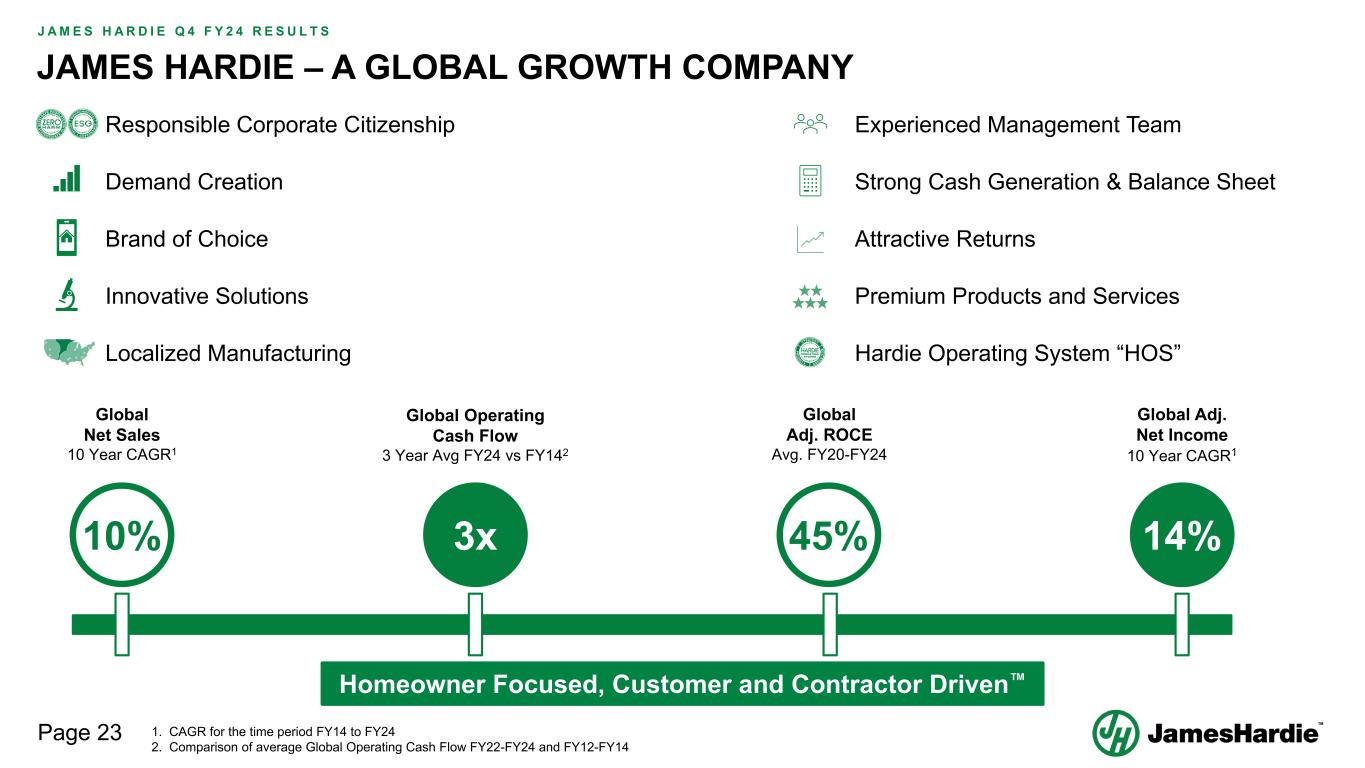
Page 23 J A M E S H A R D I E Q 4 F Y 2 4 R E S U L T S JAMES HARDIE – A GLOBAL GROWTH COMPANY Responsible Corporate Citizenship Demand Creation Brand of Choice Innovative Solutions Localized Manufacturing Experienced Management Team Strong Cash Generation & Balance Sheet Attractive Returns Premium Products and Services Hardie Operating System “HOS” 1. CAGR for the time period FY14 to FY24 2. Comparison of average Global Operating Cash Flow FY22-FY24 and FY12-FY14 Homeowner Focused, Customer and Contractor Driven 10% 14%3x 45% Global Net Sales 10 Year CAGR1 Global Adj. ROCE Avg. FY20-FY24 Global Operating Cash Flow 3 Year Avg FY24 vs FY142 Global Adj. Net Income 10 Year CAGR1

Questions 21 MAY 2024

Appendix 21 MAY 2024
Page 26 J A M E S H A R D I E Q 4 F Y 2 4 R E S U L T S NON-GAAP FINANCIAL MEASURES This Management Presentation forms part of a package of information about the company’s results. It should be read in conjunction with the other parts of this package, including the Management’s Analysis of Results, Media Release and Consolidated Financial Statements Financial Measures – GAAP Equivalents This document contains the financial statement line item EBIT, which is considered to be non-GAAP, but is consistent with the term used by Australian companies. Because we prepare our consolidated financial statements under GAAP, the equivalent GAAP financial Statement line item description used in our consolidated financial statements is Operating income (loss). EBIT – Earnings before interest and tax EBIT margin – EBIT margin is defined as EBIT as a percentage of net sales Definitions ASP – Average net sales price per msf ("ASP") – Total net sales of fiber cement and fiber gypsum products, excluding accessory sales, divided by the total volume of products sold Working Capital – The working capital calculation used in our cash provided by operating analysis includes the change in: (1) Accounts and other receivables, net; (2) Inventories; and (3) Accounts payable and accrued liabilities. ROCE - Return on Capital Employed; calculated as Adjusted EBIT / Adjusted Gross Capital Employed AICF – Asbestos Injuries Compensation Fund Ltd mmsf – sales volume in million square feet, where a square foot is defined as a standard square foot of 5/16” thickness msf – sales volume in thousand square feet, where a square foot is defined as a standard square foot of 5/16” thickness
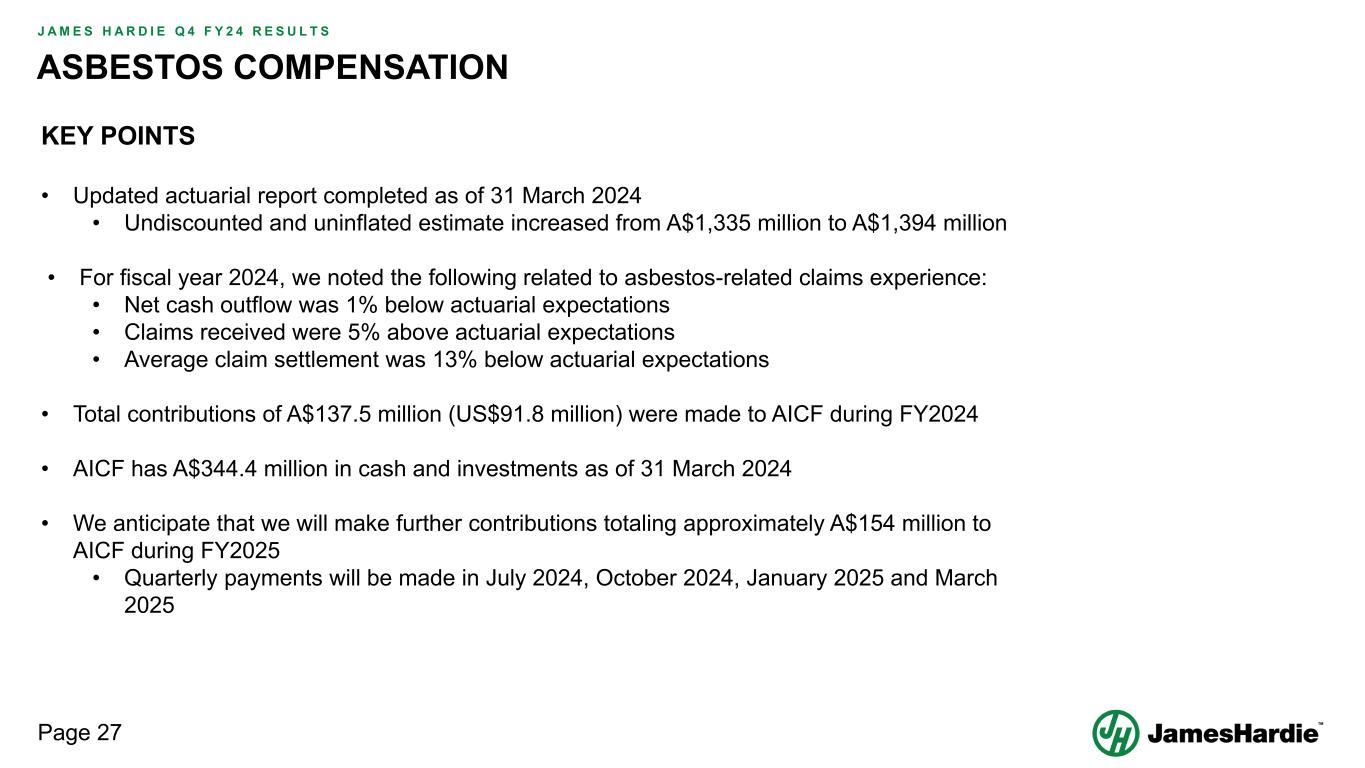
Page 27 J A M E S H A R D I E Q 4 F Y 2 4 R E S U L T S 1 KEY POINTS • Updated actuarial report completed as of 31 March 2024 • Undiscounted and uninflated estimate increased from A$1,335 million to A$1,394 million • For fiscal year 2024, we noted the following related to asbestos-related claims experience: • Net cash outflow was 1% below actuarial expectations • Claims received were 5% above actuarial expectations • Average claim settlement was 13% below actuarial expectations • Total contributions of A$137.5 million (US$91.8 million) were made to AICF during FY2024 • AICF has A$344.4 million in cash and investments as of 31 March 2024 • We anticipate that we will make further contributions totaling approximately A$154 million to AICF during FY2025 • Quarterly payments will be made in July 2024, October 2024, January 2025 and March 2025 ASBESTOS COMPENSATION
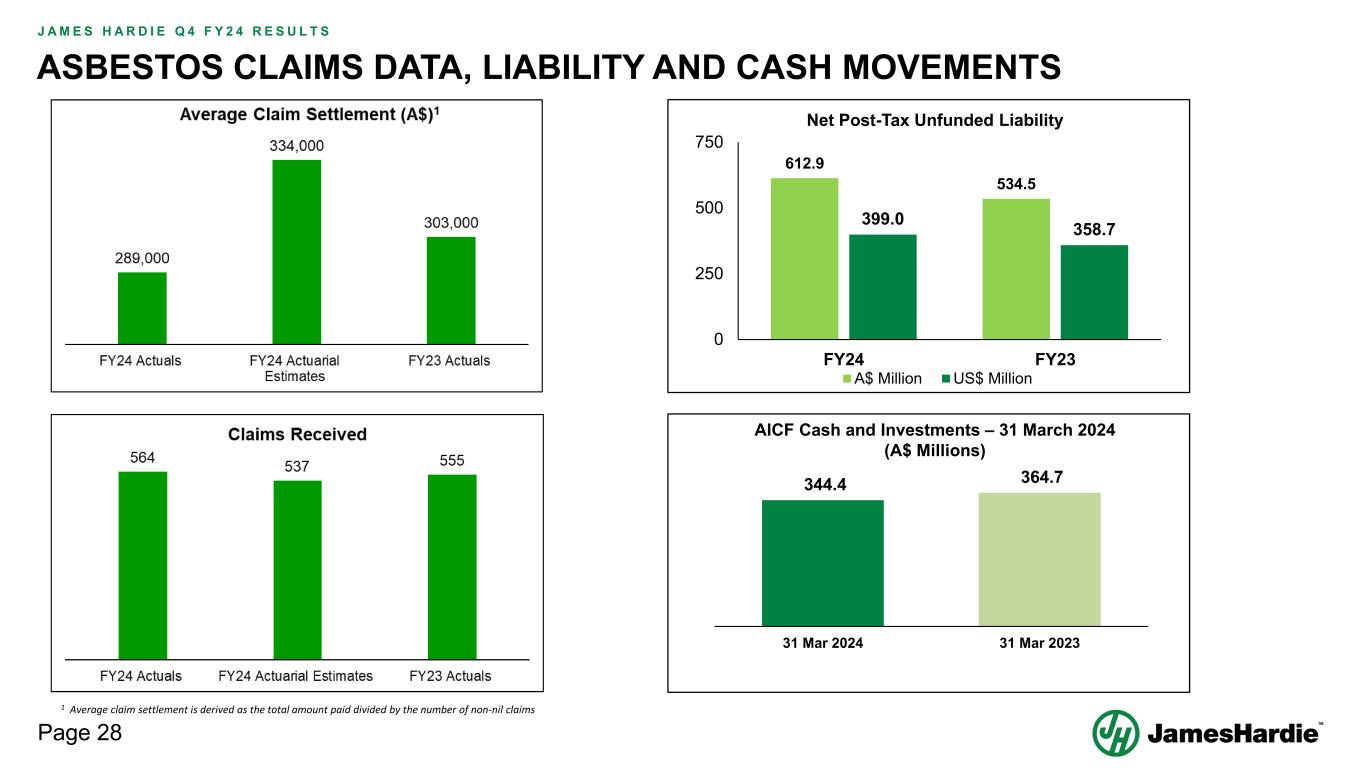
Page 28 J A M E S H A R D I E Q 4 F Y 2 4 R E S U L T S 1 Average claim settlement is derived as the total amount paid divided by the number of non-nil claims 612.9 534.5 399.0 358.7 0 250 500 750 FY24 FY23 A$ Million US$ Million Net Post-Tax Unfunded Liability 344.4 364.7 31 Mar 2024 31 Mar 2023 AICF Cash and Investments – 31 March 2024 (A$ Millions) ASBESTOS CLAIMS DATA, LIABILITY AND CASH MOVEMENTS
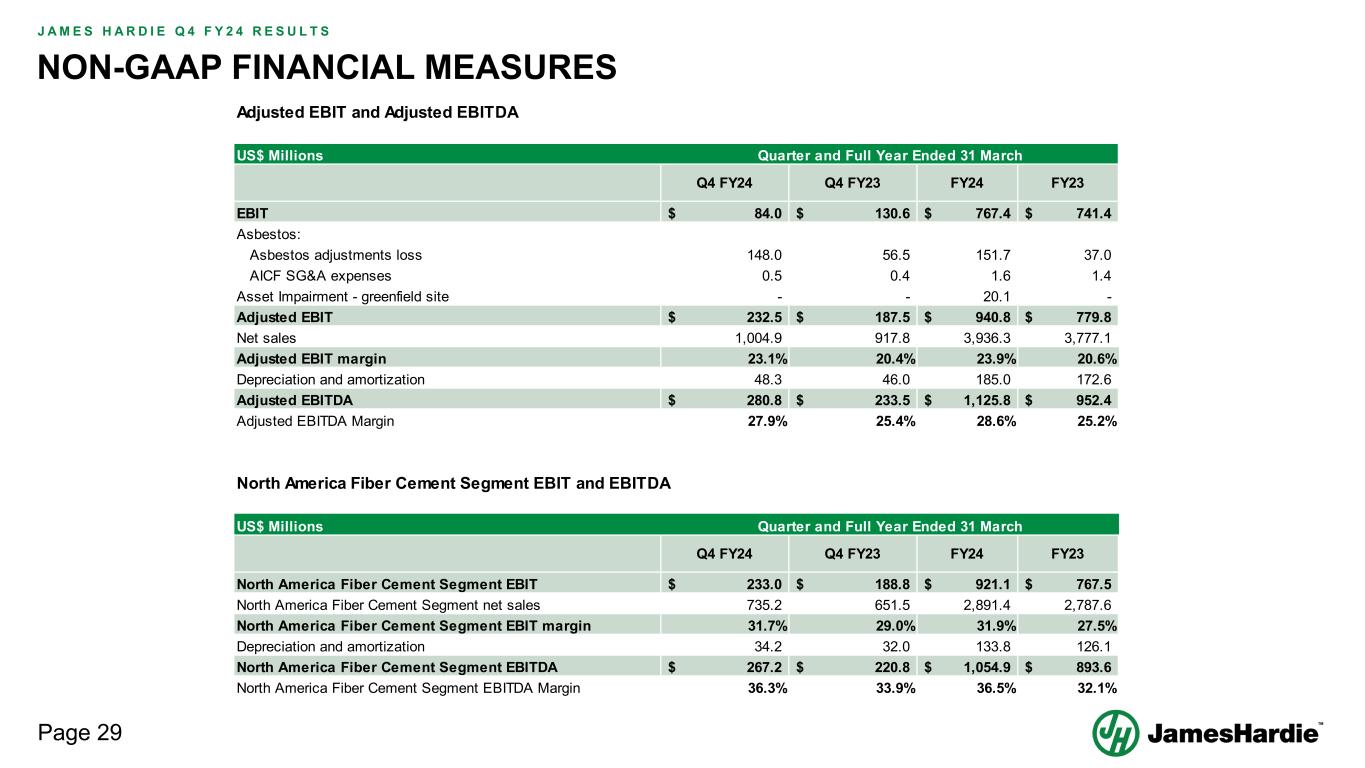
Page 29 J A M E S H A R D I E Q 4 F Y 2 4 R E S U L T S NON-GAAP FINANCIAL MEASURES Adjusted EBIT and Adjusted EBITDA US$ Millions Q4 FY24 Q4 FY23 FY24 FY23 EBIT 84.0$ 130.6$ 767.4$ 741.4$ Asbestos: Asbestos adjustments loss 148.0 56.5 151.7 37.0 AICF SG&A expenses 0.5 0.4 1.6 1.4 Asset Impairment - greenfield site - - 20.1 - Adjusted EBIT 232.5$ 187.5$ 940.8$ 779.8$ Net sales 1,004.9 917.8 3,936.3 3,777.1 Adjusted EBIT margin 23.1% 20.4% 23.9% 20.6% Depreciation and amortization 48.3 46.0 185.0 172.6 Adjusted EBITDA 280.8$ 233.5$ 1,125.8$ 952.4$ Adjusted EBITDA Margin 27.9% 25.4% 28.6% 25.2% Quarter and Full Year Ended 31 March US$ Millions Q4 FY24 Q4 FY23 FY24 FY23 North America Fiber Cement Segment EBIT 233.0$ 188.8$ 921.1$ 767.5$ North America Fiber Cement Segment net sales 735.2 651.5 2,891.4 2,787.6 North America Fiber Cement Segment EBIT margin 31.7% 29.0% 31.9% 27.5% Depreciation and amortization 34.2 32.0 133.8 126.1 North America Fiber Cement Segment EBITDA 267.2$ 220.8$ 1,054.9$ 893.6$ North America Fiber Cement Segment EBITDA Margin 36.3% 33.9% 36.5% 32.1% North America Fiber Cement Segment EBIT and EBITDA Quarter and Full Year Ended 31 March
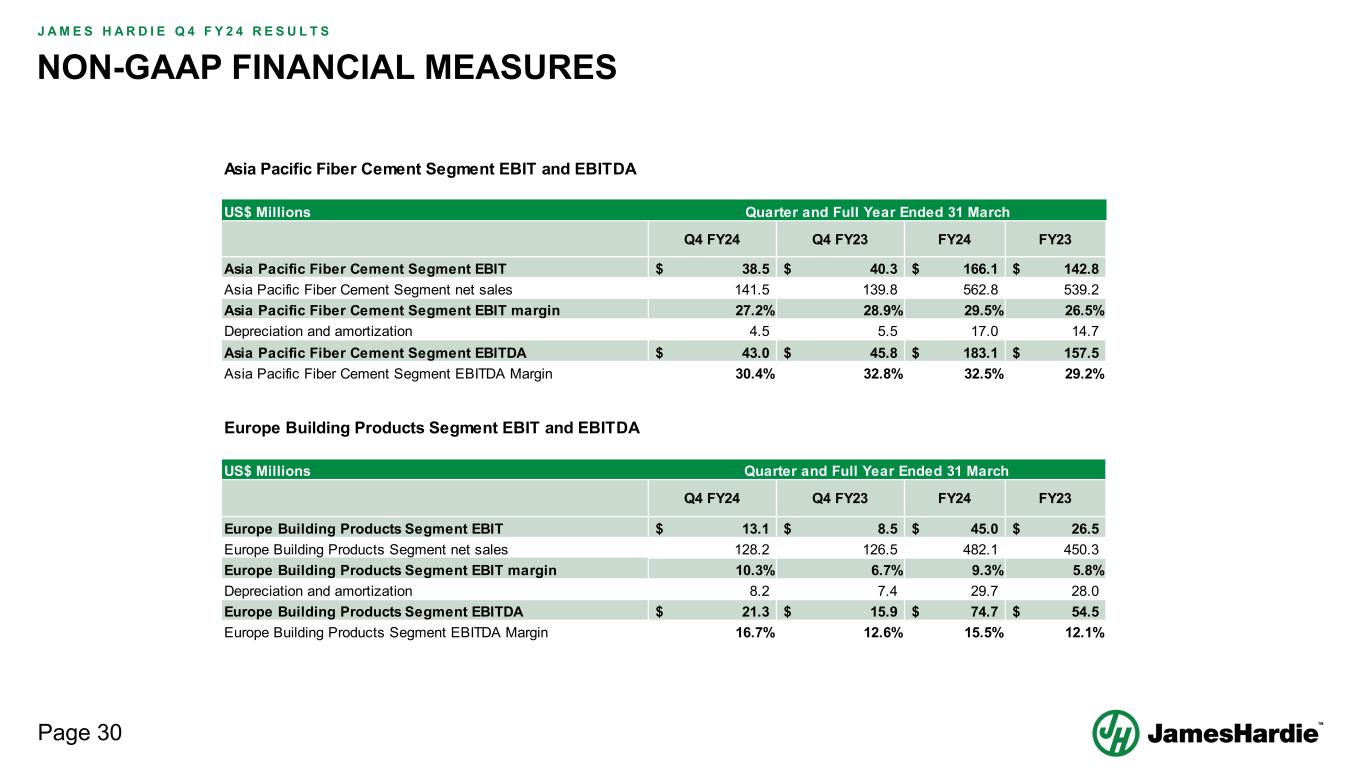
Page 30 J A M E S H A R D I E Q 4 F Y 2 4 R E S U L T S NON-GAAP FINANCIAL MEASURES US$ Millions Q4 FY24 Q4 FY23 FY24 FY23 Asia Pacific Fiber Cement Segment EBIT 38.5$ 40.3$ 166.1$ 142.8$ Asia Pacific Fiber Cement Segment net sales 141.5 139.8 562.8 539.2 Asia Pacific Fiber Cement Segment EBIT margin 27.2% 28.9% 29.5% 26.5% Depreciation and amortization 4.5 5.5 17.0 14.7 Asia Pacific Fiber Cement Segment EBITDA 43.0$ 45.8$ 183.1$ 157.5$ Asia Pacific Fiber Cement Segment EBITDA Margin 30.4% 32.8% 32.5% 29.2% Asia Pacific Fiber Cement Segment EBIT and EBITDA Quarter and Full Year Ended 31 March US$ Millions Q4 FY24 Q4 FY23 FY24 FY23 Europe Building Products Segment EBIT 13.1$ 8.5$ 45.0$ 26.5$ Europe Building Products Segment net sales 128.2 126.5 482.1 450.3 Europe Building Products Segment EBIT margin 10.3% 6.7% 9.3% 5.8% Depreciation and amortization 8.2 7.4 29.7 28.0 Europe Building Products Segment EBITDA 21.3$ 15.9$ 74.7$ 54.5$ Europe Building Products Segment EBITDA Margin 16.7% 12.6% 15.5% 12.1% Quarter and Full Year Ended 31 March Europe Building Products Segment EBIT and EBITDA
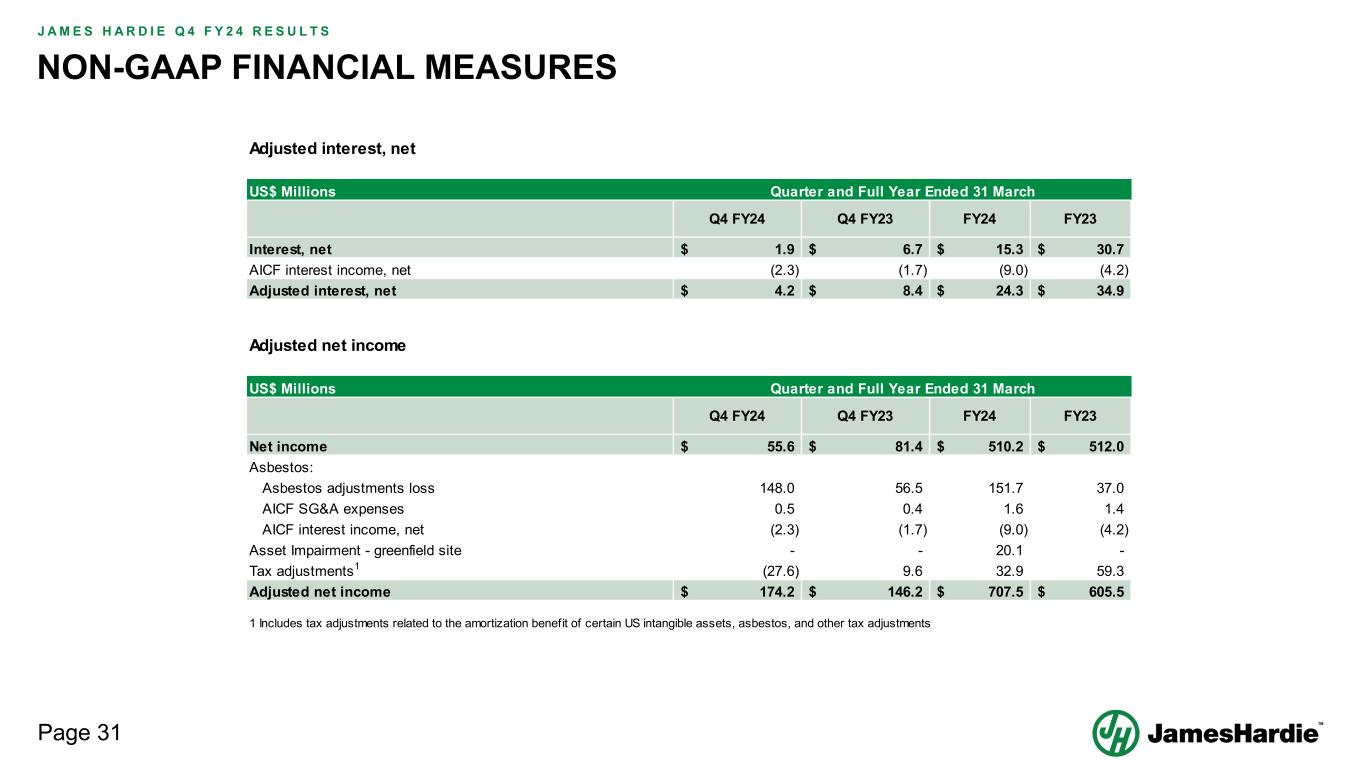
Page 31 J A M E S H A R D I E Q 4 F Y 2 4 R E S U L T S NON-GAAP FINANCIAL MEASURES US$ Millions Q4 FY24 Q4 FY23 FY24 FY23 Interest, net 1.9$ 6.7$ 15.3$ 30.7$ AICF interest income, net (2.3) (1.7) (9.0) (4.2) Adjusted interest, net 4.2$ 8.4$ 24.3$ 34.9$ Adjusted interest, net Quarter and Full Year Ended 31 March Adjusted net income US$ Millions Q4 FY24 Q4 FY23 FY24 FY23 Net income 55.6$ 81.4$ 510.2$ 512.0$ Asbestos: Asbestos adjustments loss 148.0 56.5 151.7 37.0 AICF SG&A expenses 0.5 0.4 1.6 1.4 AICF interest income, net (2.3) (1.7) (9.0) (4.2) Asset Impairment - greenfield site - - 20.1 - Tax adjustments1 (27.6) 9.6 32.9 59.3 Adjusted net income 174.2$ 146.2$ 707.5$ 605.5$ 1 Includes tax adjustments related to the amortization benefit of certain US intangible assets, asbestos, and other tax adjustments Quarter and Full Year Ended 31 March
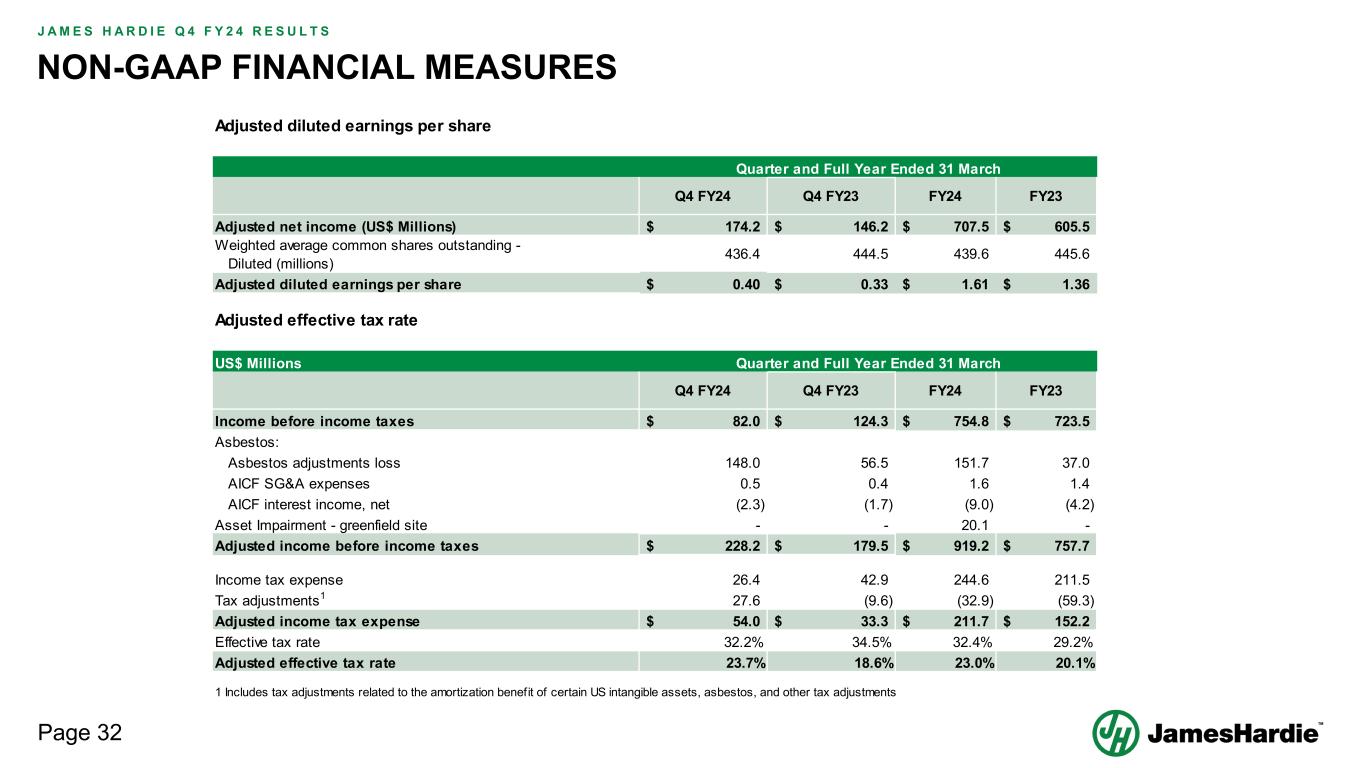
Page 32 J A M E S H A R D I E Q 4 F Y 2 4 R E S U L T S NON-GAAP FINANCIAL MEASURES Adjusted diluted earnings per share Q4 FY24 Q4 FY23 FY24 FY23 Adjusted net income (US$ Millions) 174.2$ 146.2$ 707.5$ 605.5$ Weighted average common shares outstanding - Diluted (millions) 436.4 444.5 439.6 445.6 Adjusted diluted earnings per share 0.40$ 0.33$ 1.61$ 1.36$ Quarter and Full Year Ended 31 March Adjusted effective tax rate US$ Millions Q4 FY24 Q4 FY23 FY24 FY23 Income before income taxes 82.0$ 124.3$ 754.8$ 723.5$ Asbestos: Asbestos adjustments loss 148.0 56.5 151.7 37.0 AICF SG&A expenses 0.5 0.4 1.6 1.4 AICF interest income, net (2.3) (1.7) (9.0) (4.2) Asset Impairment - greenfield site - - 20.1 - Adjusted income before income taxes 228.2$ 179.5$ 919.2$ 757.7$ Income tax expense 26.4 42.9 244.6 211.5 Tax adjustments1 27.6 (9.6) (32.9) (59.3) Adjusted income tax expense 54.0$ 33.3$ 211.7$ 152.2$ Effective tax rate 32.2% 34.5% 32.4% 29.2% Adjusted effective tax rate 23.7% 18.6% 23.0% 20.1% 1 Includes tax adjustments related to the amortization benefit of certain US intangible assets, asbestos, and other tax adjustments Quarter and Full Year Ended 31 March
21 MAY 2024 Q4 FY24 Management Presentation