James Hardie Investor Day 2024 DAY TWO | MONDAY, JUNE 24TH | NEW YORK © 2023 Warner Bros. Discovery, Inc. or its subsidiaries and affiliates. All trademarks are the property of their respective owners. All rights reserved. Exhibit 99.4
2 JAMES HARDIE INVESTOR DAY 2024 Cautionary Note on Forward-Looking Statements Cautionary note on forward-looking statements This Management Presentation contains forward looking statements within the meaning of the Private Securities Litigation Reform Act of 1995. James Hardie Industries plc (the “Company”) may from time to time make forward-looking statements in its periodic reports filed with or furnished to the Securities and Exchange Commission on Forms 20-F and 6-K, in its annual reports to shareholders, in media releases and other written materials and in oral statements made by the Company’s officers, directors or employees to analysts, institutional investors, representatives of the media and others. Words such as “believe,” “anticipate,” “plan,” “expect,” “intend,” “target,” “estimate,” “project,” “predict,” “forecast,” “guideline,” “aim,” “will,” “should,” “likely,” “continue,” “may,” “objective,” “outlook” and similar expressions are intended to identify forward- looking statements but are not the exclusive means of identifying such statements. These forward-looking statements are based upon management's current expectations, estimates, assumptions, beliefs and general good faith evaluation of information available at the time the forward-looking statements were made concerning future events and conditions. Readers are cautioned not to place undue reliance on any forward-looking statements or rely upon them as a guarantee of future performance or results or as an accurate indication of the times at or by which any such performance or results will be achieved. Forward-looking statements are necessarily subject to risks, uncertainties and other factors, many of which are unforeseeable and beyond the Company’s control. Many factors could cause actual results, performance or achievements to be materially different from those expressed or implied in this Management Presentation, including, among others, the risks and uncertainties set forth in Section 3 “Risk Factors” in James Hardie’s Annual Report on Form 20-F for the year ended 31 March 2024, which include, but are not necessarily limited to risks such as changes in general economic, political, governmental and business conditions globally and in the countries in which the Company does business, including; changes in interest rates; changes in inflation rates; changes in exchange rates; the level of construction generally; changes in cement demand and prices; changes in raw material and energy prices; changes in business strategy and various other factors. Should one or more of these risks or uncertainties materialize, or should underlying assumptions prove incorrect, actual results may vary materially from those described herein. James Hardie assumes no obligation to update or correct the information contained in this Management Presentation except as required by law. All amounts are in US Dollars, unless otherwise noted Use of non-GAAP financial information; Australian equivalent terminology This Management Presentation includes financial measures that are not considered a measure of financial performance under generally accepted accounting principles in the United States (GAAP). These financial measures are designed to provide investors with an alternative method for assessing our performance from on-going operations, capital efficiency and profit generation. Management uses these financial measures for the same purposes. These financial measures are or may be non-GAAP financial measures as defined in the rules of the U.S. Securities and Exchange Commission and may exclude or include amounts that are included or excluded, as applicable, in the calculation of the most directly comparable financial measures calculated in accordance with GAAP. These non-GAAP financial measures should not be considered to be more meaningful than the equivalent GAAP measure. Management has included such measures to provide investors with an alternative method for assessing its operating results in a manner that is focused on the performance of its ongoing operations and excludes the impact of certain legacy items, such as asbestos adjustments. Additionally, management uses such non-GAAP financial measures for the same purposes. However, these non-GAAP financial measures are not prepared in accordance with GAAP, may not be reported by all of the Company’s competitors and may not be directly comparable to similarly titled measures of the Company’s competitors due to potential differences in the exact method of calculation. For additional information regarding the non-GAAP financial measures presented in this Management Presentation, including a reconciliation of each non-GAAP financial measure to the equivalent GAAP measure, see slides titled “Non-GAAP Financial Measures” included in this Management Presentation. In addition, this Management Presentation includes financial measures and descriptions that are considered to not be in accordance with GAAP, but which are consistent with financial measures reported by Australian companies, such as operating profit, EBIT and EBIT margin. Since the Company prepares its Consolidated Financial Statements in accordance with GAAP, the Company provides investors with definitions and a cross-reference from the non-GAAP financial measure used in this Management Presentation to the equivalent GAAP financial measure used in the Company’s Consolidated Financial Statements. See slides titled “Non-GAAP Financial Measures” included in this Management Presentation.
3 JAMES HARDIE INVESTOR DAY 2024 Formalities Attendance Presentations Welcome Bags Charging Your Items Badges & Groups Agenda
4 JAMES HARDIE INVESTOR DAY 2024 Agenda: Day Two DAY TWO | MONDAY, JUNE 24TH | NEW YORK Registration/Breakfast at Pendry Hotel All Logistics Overview Joe Ahlersmeyer Welcome Aaron Erter, CEO Finance Strategic Priorities Rachel Wilson, CFO Global Operations Strategic Priorities Ryan Kilcullen 9:00am Break for 5min ESG Roadmap Jill Kolling Innovation Strategic Priorities Joe Liu Long-Term North America Aspirations Aaron Erter, CEO Q&A All ~10:15am Travel to Field Visit #1 Field Visit #1 All Travel to Lunch Lunch All Repair & Remodel Panel John Madson ~3:30pm Travel to Field Visit #2 Field Visit #2 All Travel Dinner at Yankee Stadium All Travel to Pendry Hotel
5 JAMES HARDIE INVESTOR DAY 2024 Zero Harm EXIT WATER Stay Together as a Group Utilize Safety Equipment When Provided (E.g., Hard Hats, etc.) Stay Hydrated and Leverage Facilities as Needed Please be Aware of Your Surroundings and Identify the Nearest Emergency Exit
6 JAMES HARDIE INVESTOR DAY 2024 What The Best Are Made Of
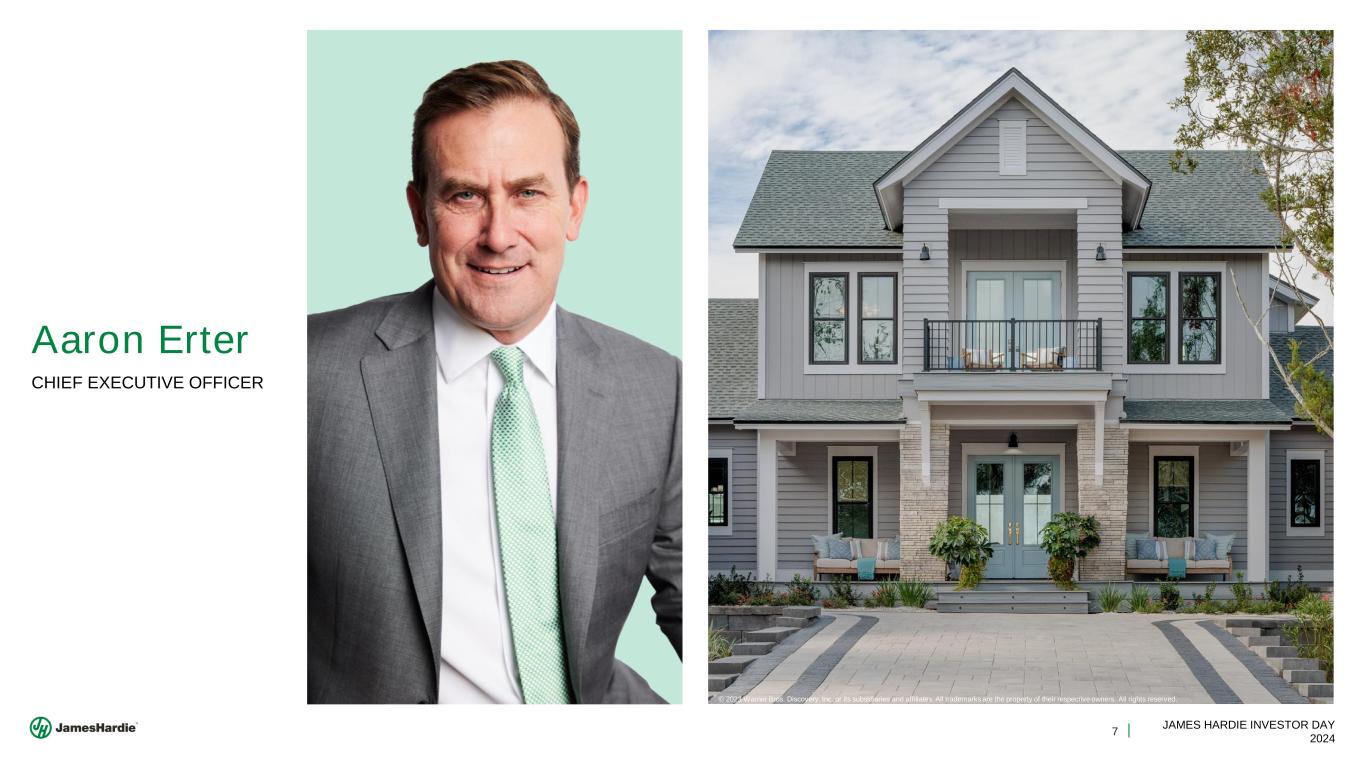
7 JAMES HARDIE INVESTOR DAY 2024 © 2023 Warner Bros. Discovery, Inc. or its subsidiaries and affiliates. All trademarks are the property of their respective owners. All rights reserved. Aaron Erter CHIEF EXECUTIVE OFFICER
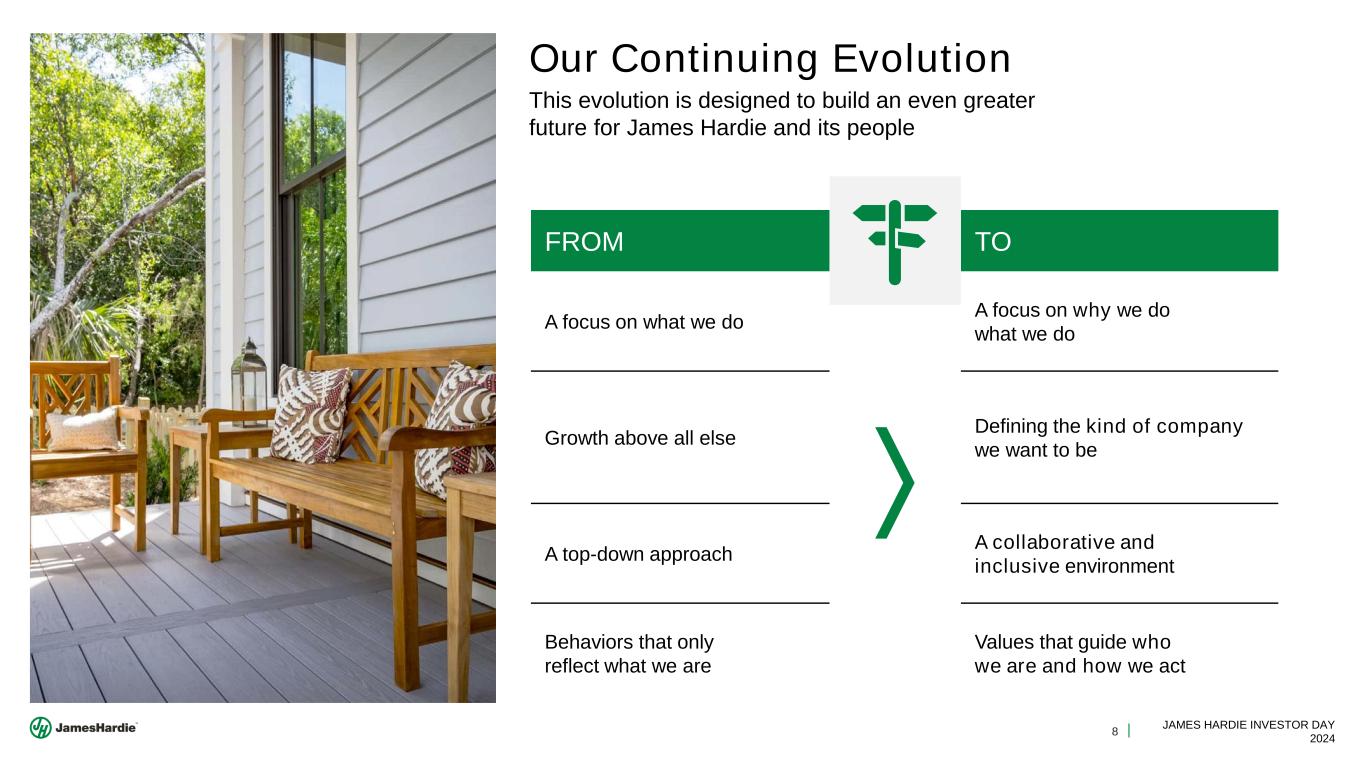
8 JAMES HARDIE INVESTOR DAY 2024 Our Continuing Evolution This evolution is designed to build an even greater future for James Hardie and its people FROM TO A focus on what we do A focus on why we do what we do Growth above all else Defining the kind of company we want to be A top-down approach A collaborative and inclusive environment Behaviors that only reflect what we are Values that guide who we are and how we act
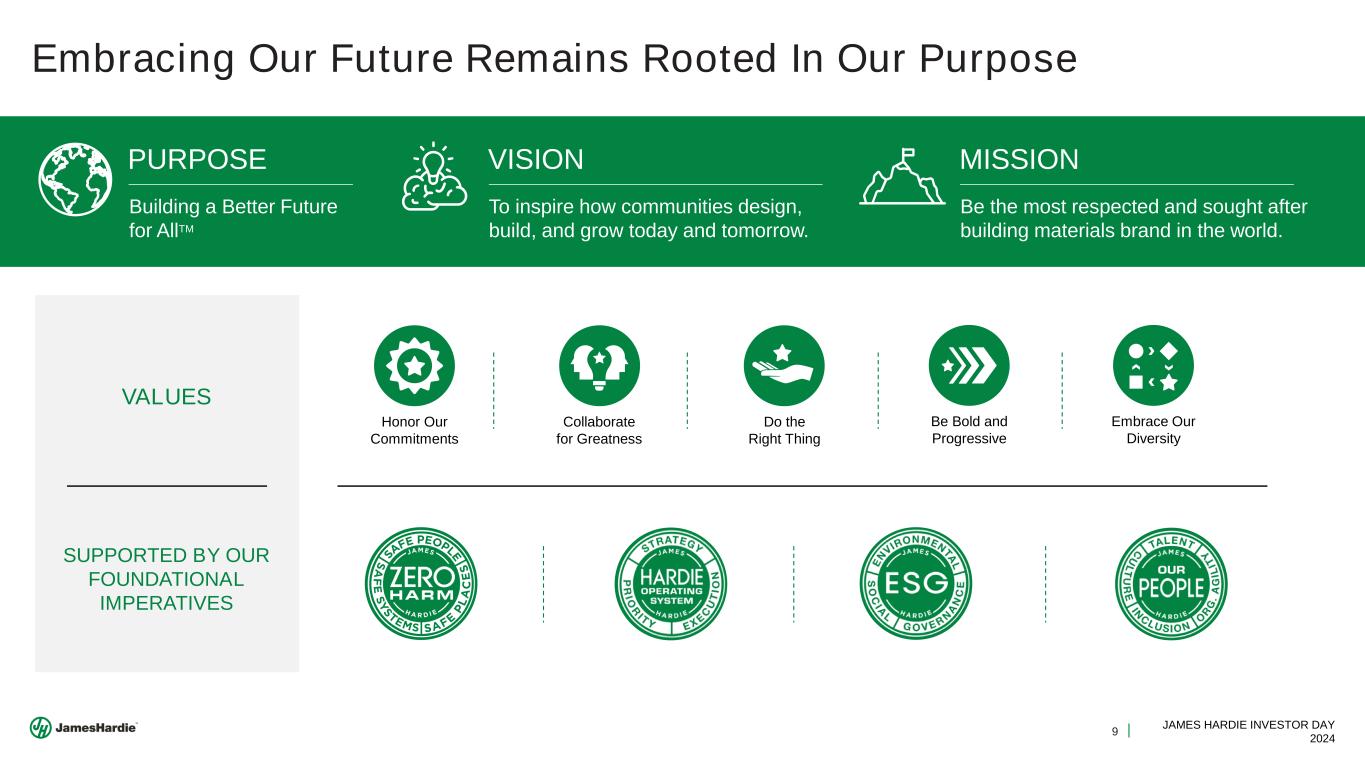
9 JAMES HARDIE INVESTOR DAY 2024 Embracing Our Future Remains Rooted In Our Purpose PURPOSE Building a Better Future for AllTM VISION To inspire how communities design, build, and grow today and tomorrow. MISSION Be the most respected and sought after building materials brand in the world. VALUES SUPPORTED BY OUR FOUNDATIONAL IMPERATIVES Honor Our Commitments Collaborate for Greatness Do the Right Thing Be Bold and Progressive Embrace Our Diversity
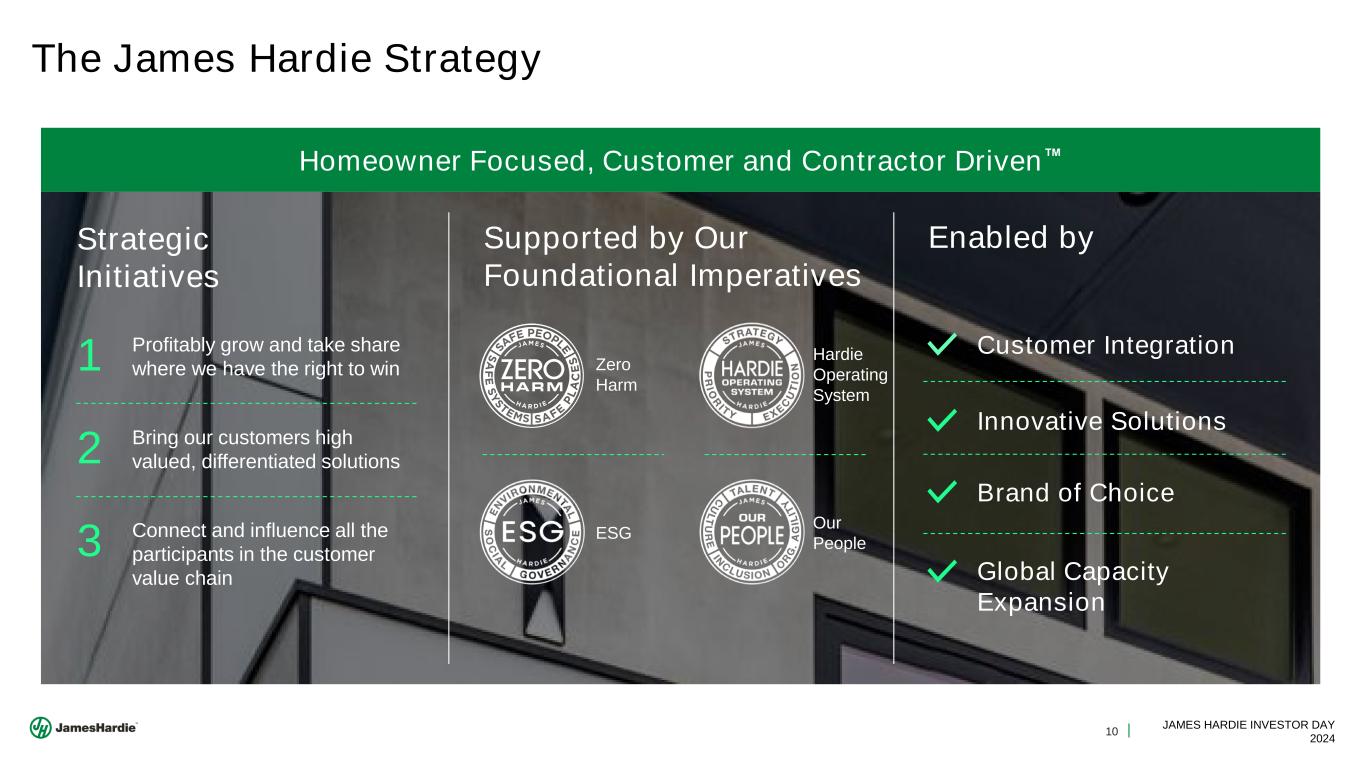
10 JAMES HARDIE INVESTOR DAY 2024 The James Hardie Strategy Homeowner Focused, Customer and Contractor Driven Strategic Initiatives 1 Profitably grow and take share where we have the right to win 2 Bring our customers high valued, differentiated solutions 3 Connect and influence all the participants in the customer value chain Supported by Our Foundational Imperatives Zero Harm Hardie Operating System ESG Our People Enabled by Customer Integration Innovative Solutions Brand of Choice Global Capacity Expansion
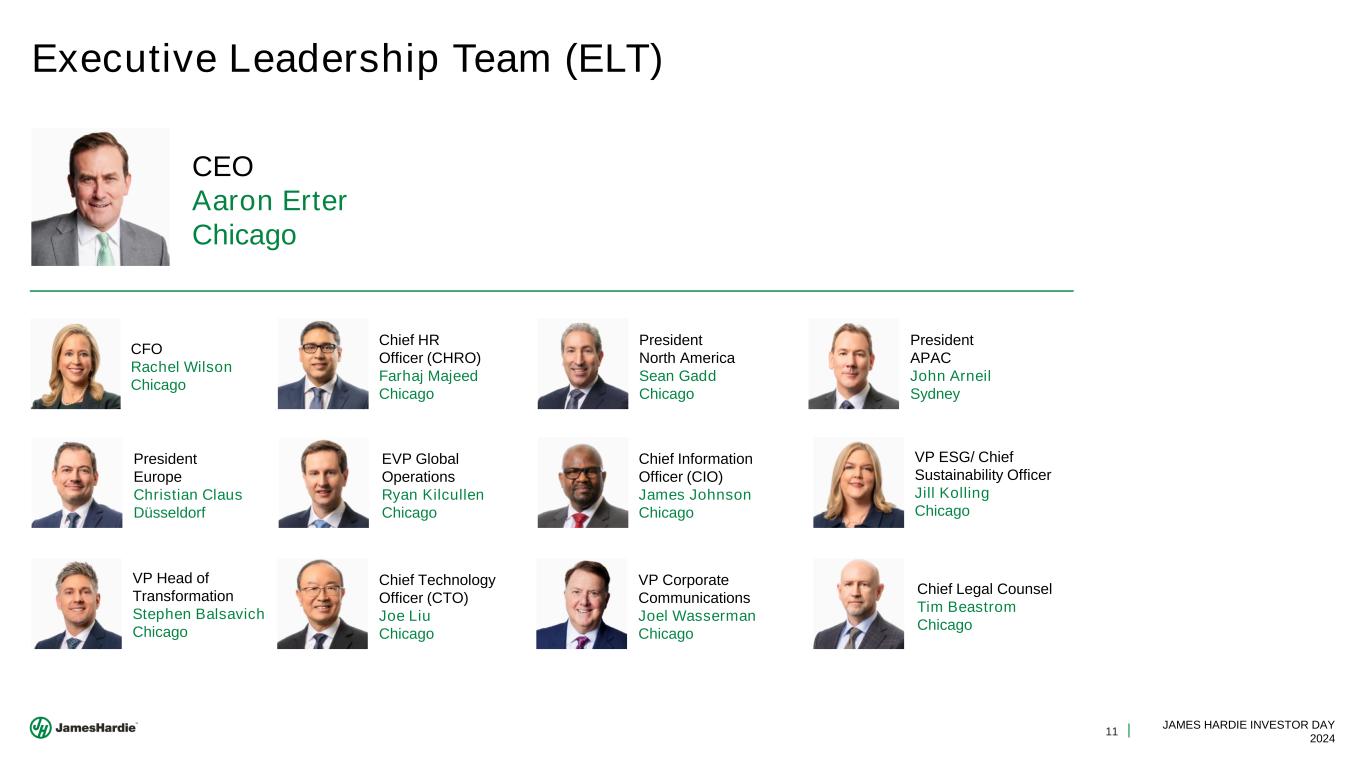
11 JAMES HARDIE INVESTOR DAY 2024 Executive Leadership Team (ELT) CEO Aaron Erter Chicago CFO Rachel Wilson Chicago Chief HR Officer (CHRO) Farhaj Majeed Chicago President North America Sean Gadd Chicago President APAC John Arneil Sydney President Europe Christian Claus Düsseldorf EVP Global Operations Ryan Kilcullen Chicago Chief Information Officer (CIO) James Johnson Chicago VP ESG/ Chief Sustainability Officer Jill Kolling Chicago VP Head of Transformation Stephen Balsavich Chicago Chief Technology Officer (CTO) Joe Liu Chicago VP Corporate Communications Joel Wasserman Chicago Chief Legal Counsel Tim Beastrom Chicago
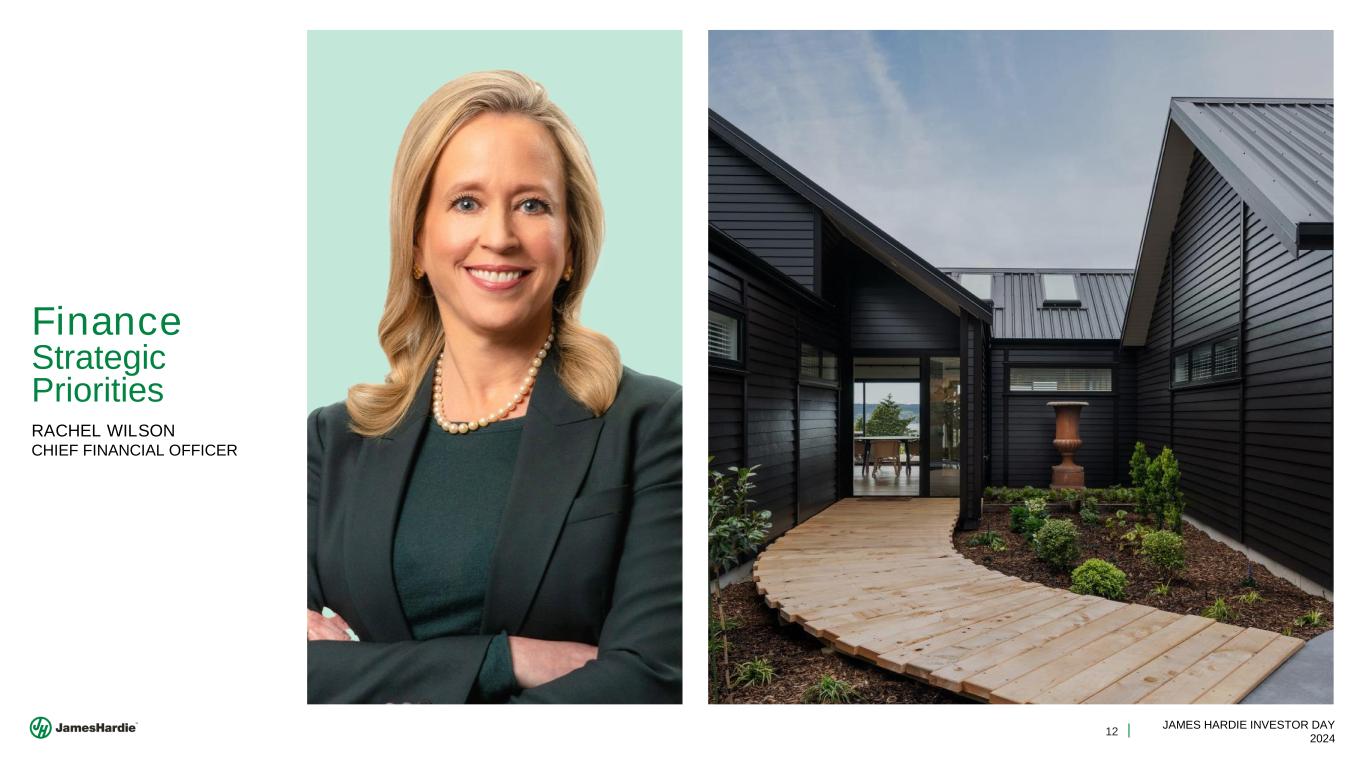
12 JAMES HARDIE INVESTOR DAY 2024 Finance Strategic Priorities RACHEL WILSON CHIEF FINANCIAL OFFICER
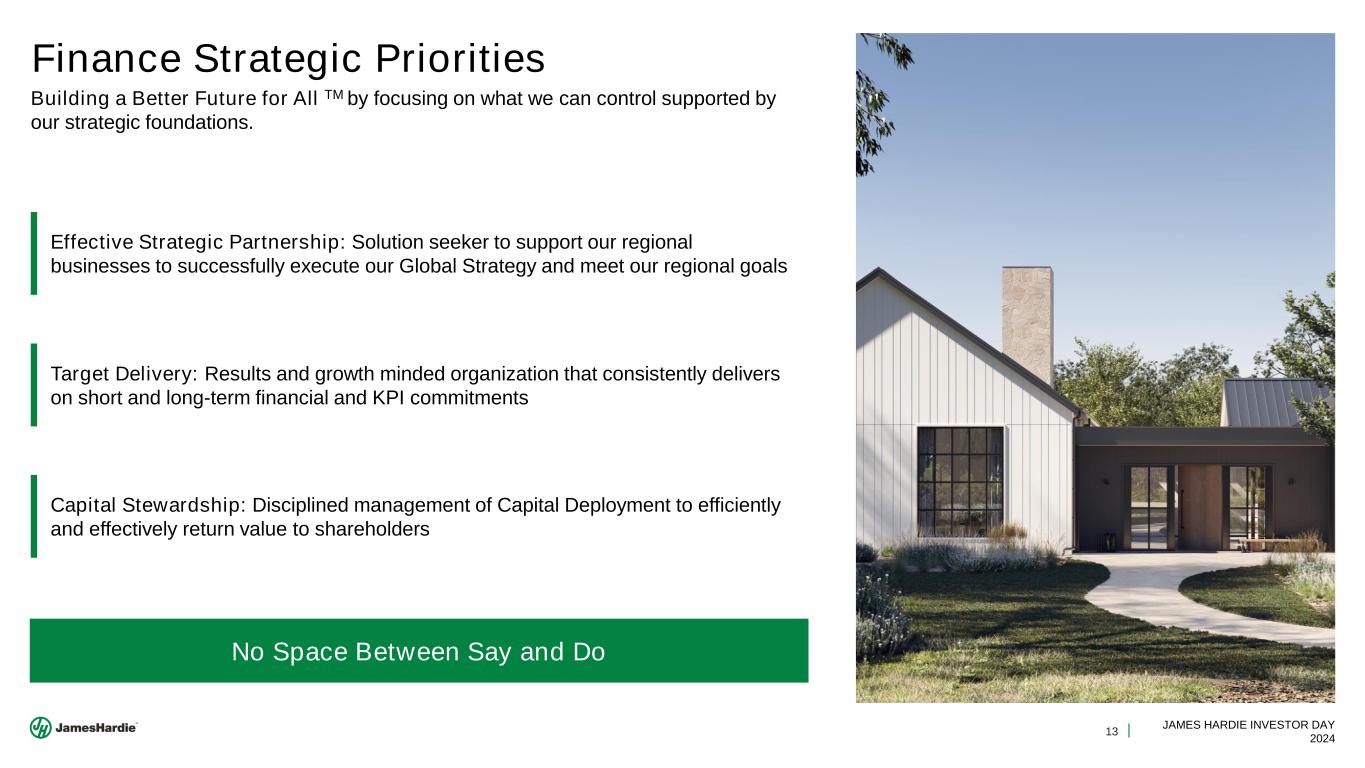
13 JAMES HARDIE INVESTOR DAY 2024 Finance Strategic Priorities Building a Better Future for All TM by focusing on what we can control supported by our strategic foundations. Effective Strategic Partnership: Solution seeker to support our regional businesses to successfully execute our Global Strategy and meet our regional goals Capital Stewardship: Disciplined management of Capital Deployment to efficiently and effectively return value to shareholders Target Delivery: Results and growth minded organization that consistently delivers on short and long-term financial and KPI commitments No Space Between Say and Do
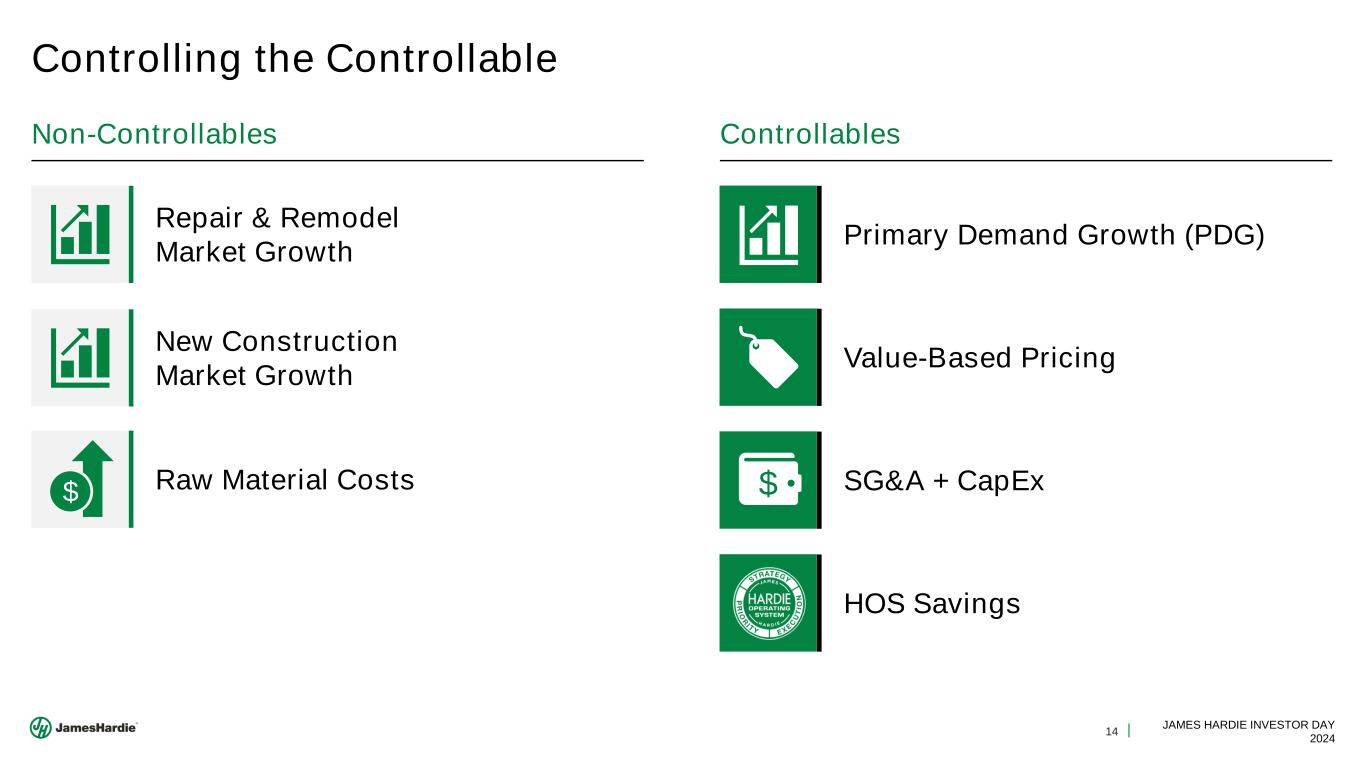
14 JAMES HARDIE INVESTOR DAY 2024 Controlling the Controllable Repair & Remodel Market Growth Non-Controllables New Construction Market Growth Raw Material Costs$ Controllables Primary Demand Growth (PDG) Value-Based Pricing SG&A + CapEx$ HOS Savings
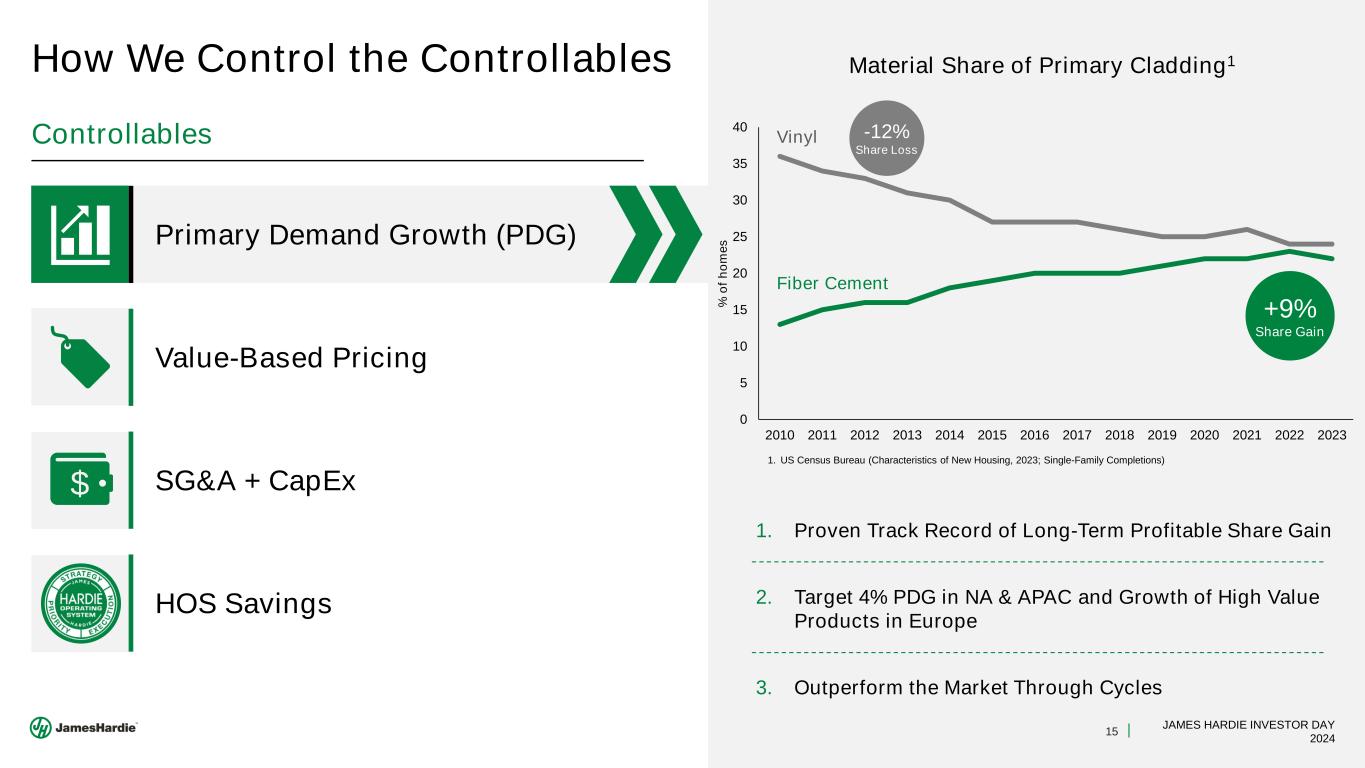
15 JAMES HARDIE INVESTOR DAY 2024 Controllables Primary Demand Growth (PDG) Value-Based Pricing SG&A + CapEx$ HOS Savings How We Control the Controllables 1. Proven Track Record of Long-Term Profitable Share Gain 2. Target 4% PDG in NA & APAC and Growth of High Value Products in Europe 3. Outperform the Market Through Cycles Material Share of Primary Cladding1 Material Share of Primary Cladding1 1. US Census Bureau (Characteristics of New Housing, 2023; Single-Family Completions) 0 5 10 15 20 25 30 35 40 2010 2011 2012 2013 2014 2015 2016 2017 2018 2019 2020 2021 2022 2023 % o f h o m e s +9% Share Gain Vinyl Fiber Cement -12% Share Loss 1. US Census Bureau (Characteristics of New Housing, 2023; Single-Family Completions)
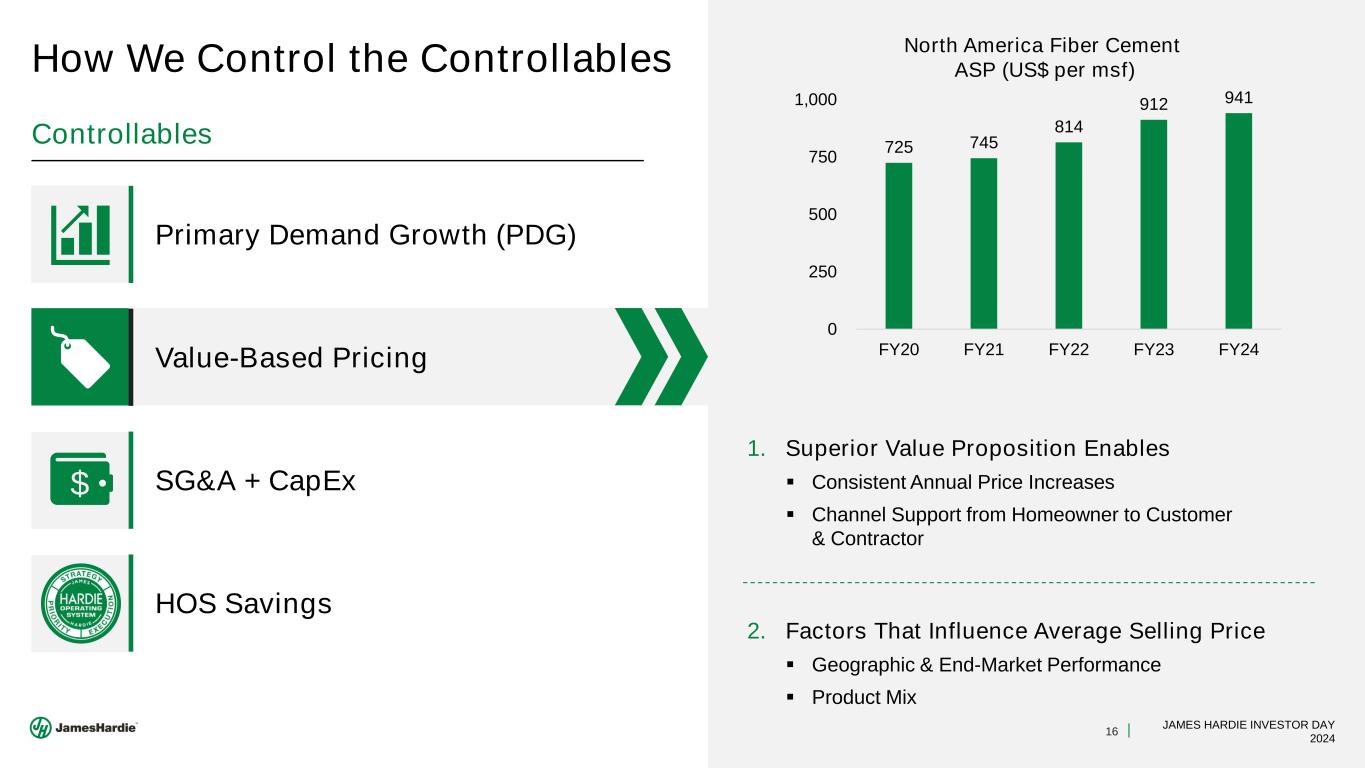
16 JAMES HARDIE INVESTOR DAY 2024 Controllables Primary Demand Growth (PDG) Value-Based Pricing SG&A + CapEx$ HOS Savings How We Control the Controllables 1. Superior Value Proposition Enables ▪ Consistent Annual Price Increases ▪ Channel Support from Homeowner to Customer & Contractor 2. Factors That Influence Average Selling Price ▪ Geographic & End-Market Performance ▪ Product Mix 725 745 814 912 941 0 250 500 750 1,000 FY20 FY21 FY22 FY23 FY24 North America Fiber Cement ASP (US$ per msf)
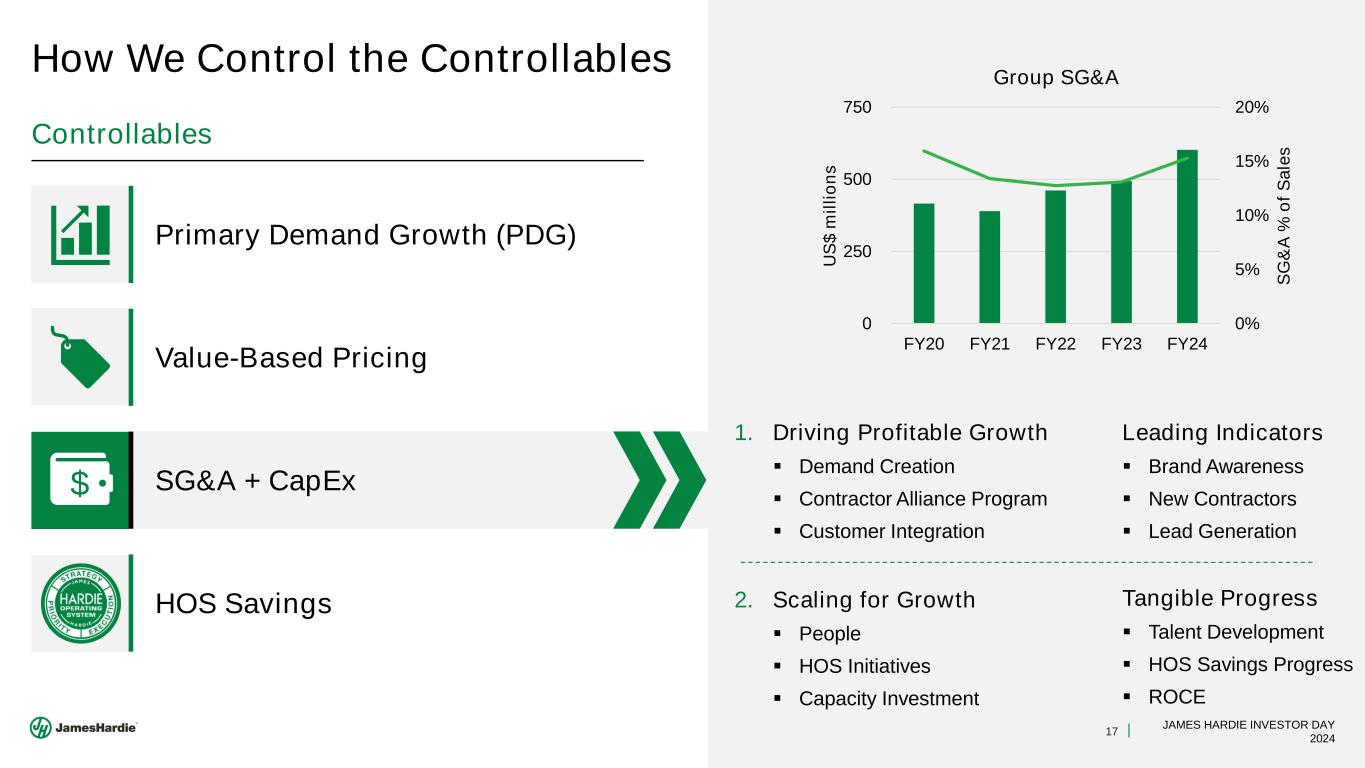
17 JAMES HARDIE INVESTOR DAY 2024 Controllables Primary Demand Growth (PDG) Value-Based Pricing SG&A + CapEx$ HOS Savings How We Control the Controllables 1. Driving Profitable Growth ▪ Demand Creation ▪ Contractor Alliance Program ▪ Customer Integration 2. Scaling for Growth ▪ People ▪ HOS Initiatives ▪ Capacity Investment 0% 5% 10% 15% 20% 0 250 500 750 FY20 FY21 FY22 FY23 FY24 S G & A % o f S a le s U S $ m il li o n s Group SG&A Leading Indicators ▪ Brand Awareness ▪ New Contractors ▪ Lead Generation Tangible Progress ▪ Talent Development ▪ HOS Savings Progress ▪ ROCE
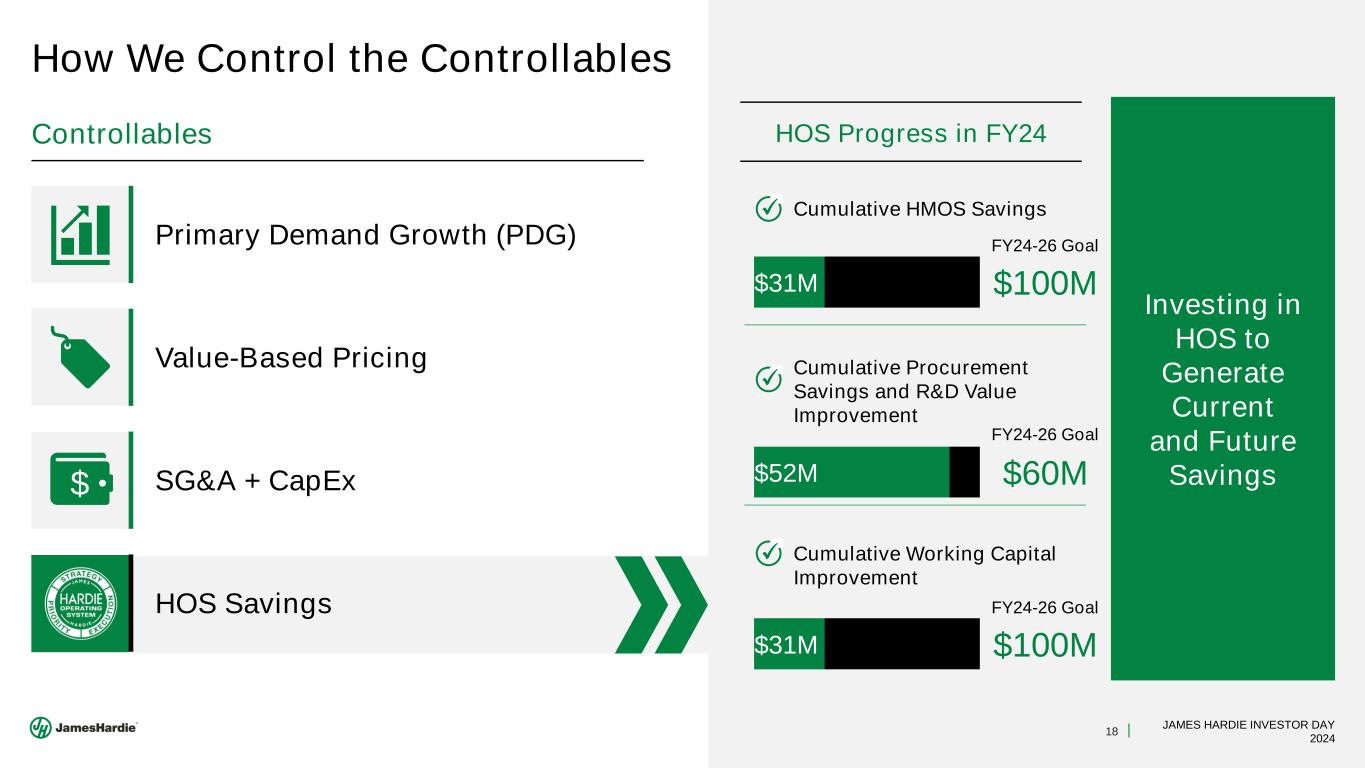
18 JAMES HARDIE INVESTOR DAY 2024 Controllables Primary Demand Growth (PDG) Value-Based Pricing SG&A + CapEx$ HOS Savings How We Control the Controllables HOS Progress in FY24 Cumulative Procurement Savings and R&D Value Improvement Cumulative HMOS Savings Cumulative Working Capital Improvement Investing in HOS to Generate Current and Future Savings $31M $100M FY24-26 Goal $52M $60M FY24-26 Goal $31M $100M FY24-26 Goal
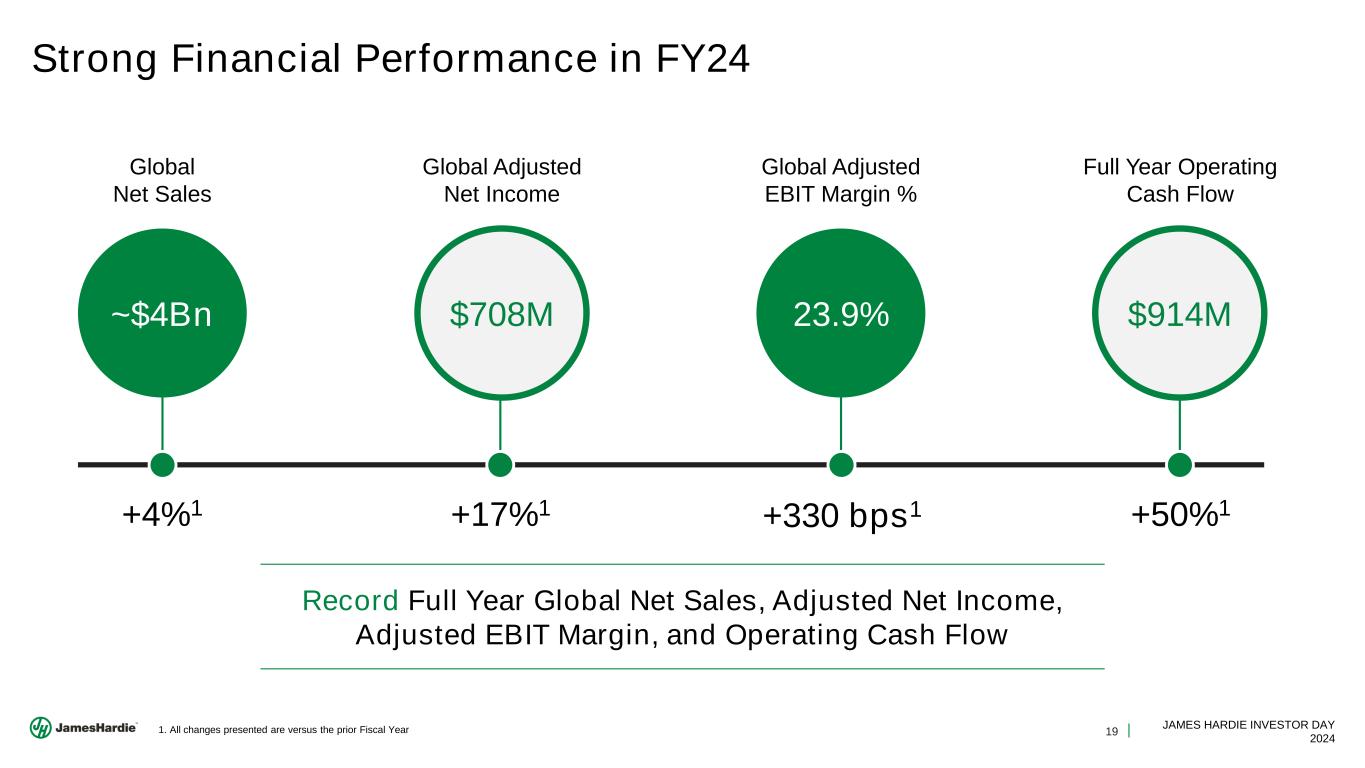
19 JAMES HARDIE INVESTOR DAY 2024 Strong Financial Performance in FY24 Global Net Sales Global Adjusted Net Income Full Year Operating Cash Flow Global Adjusted EBIT Margin % ~$4Bn $708M 23.9% $914M Record Full Year Global Net Sales, Adjusted Net Income, Adjusted EBIT Margin, and Operating Cash Flow +4%1 +17%1 +330 bps1 +50%1 1. All changes presented are versus the prior Fiscal Year
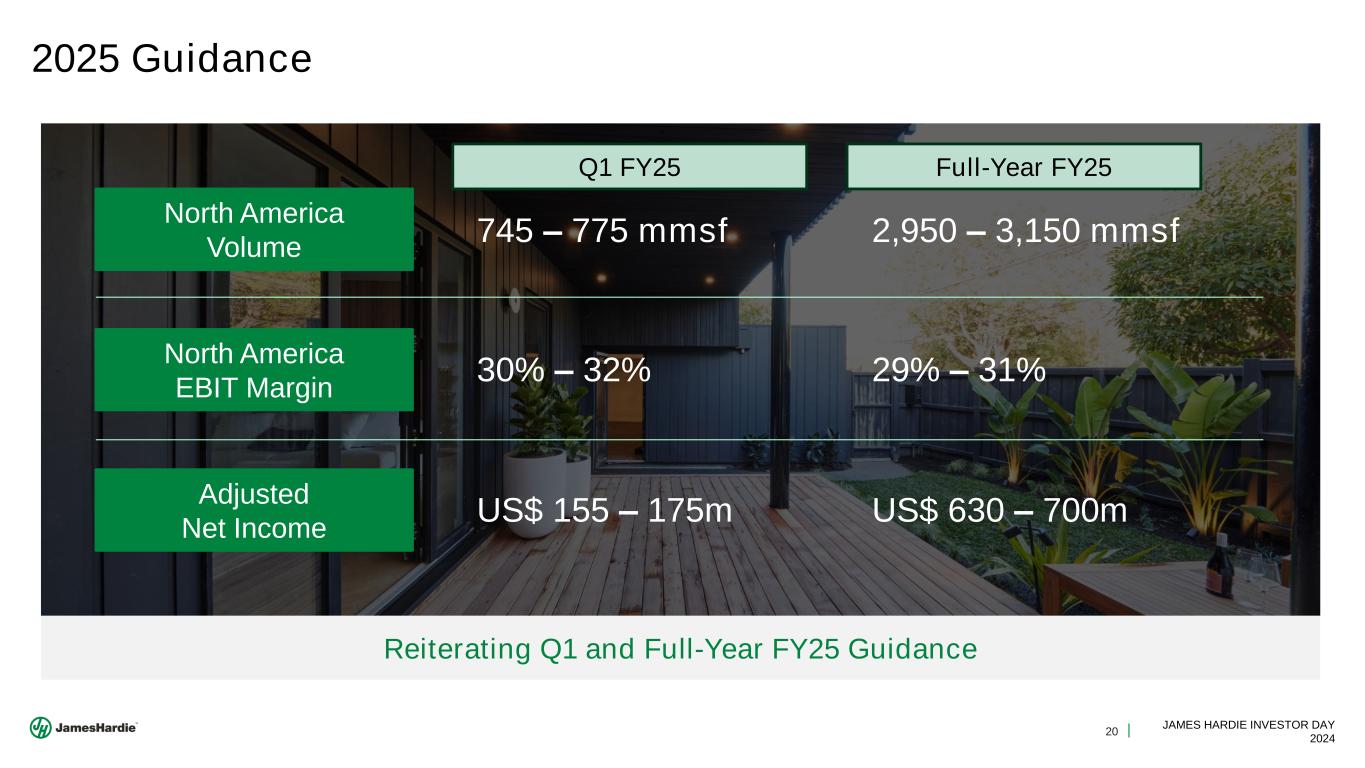
20 JAMES HARDIE INVESTOR DAY 2024 2025 Guidance Adjusted Net Income North America Volume North America EBIT Margin US$ 630 – 700m 2,950 – 3,150 mmsf 29% – 31% US$ 155 – 175m 745 – 775 mmsf 30% – 32% Reiterating Q1 and Full-Year FY25 Guidance Q1 FY25 Full-Year FY25
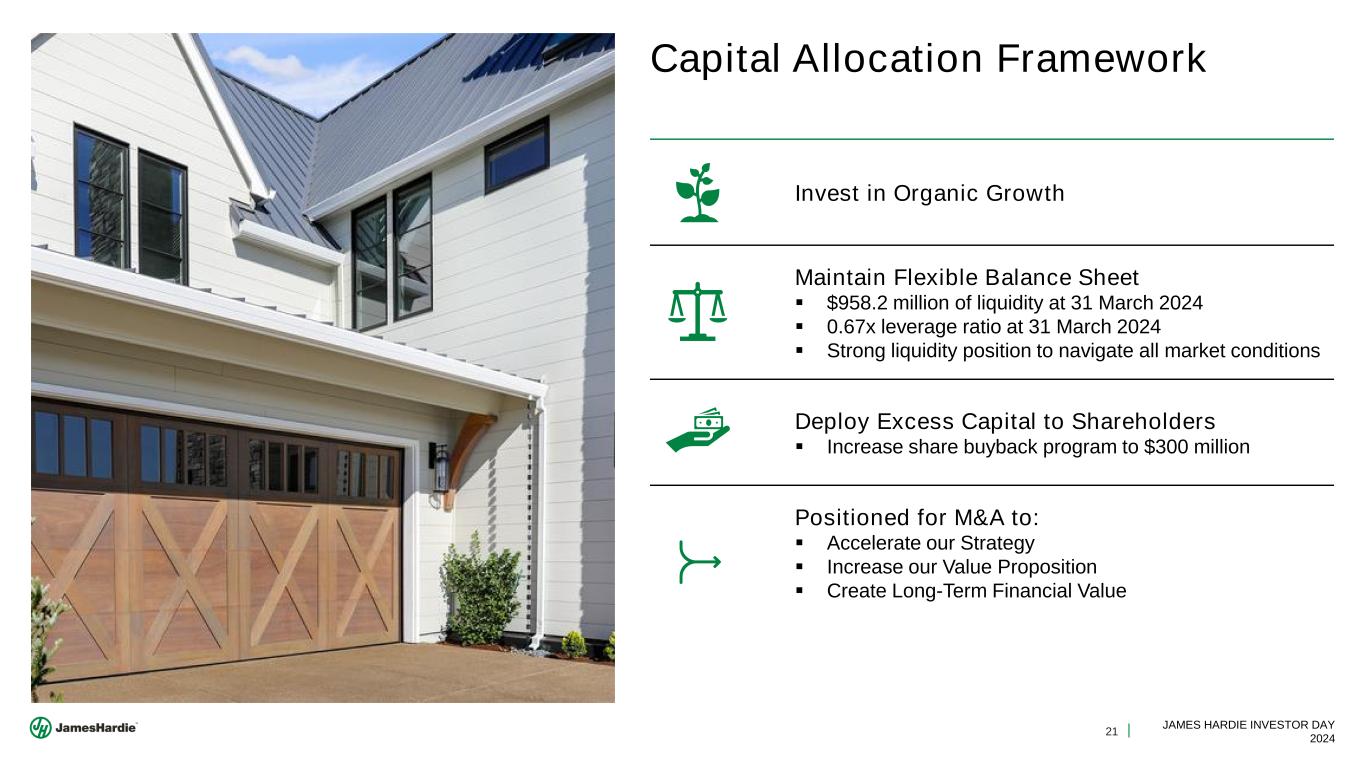
21 JAMES HARDIE INVESTOR DAY 2024 Capital Allocation Framework Invest in Organic Growth Maintain Flexible Balance Sheet ▪ $958.2 million of liquidity at 31 March 2024 ▪ 0.67x leverage ratio at 31 March 2024 ▪ Strong liquidity position to navigate all market conditions Deploy Excess Capital to Shareholders ▪ Increase share buyback program to $300 million Positioned for M&A to: ▪ Accelerate our Strategy ▪ Increase our Value Proposition ▪ Create Long-Term Financial Value
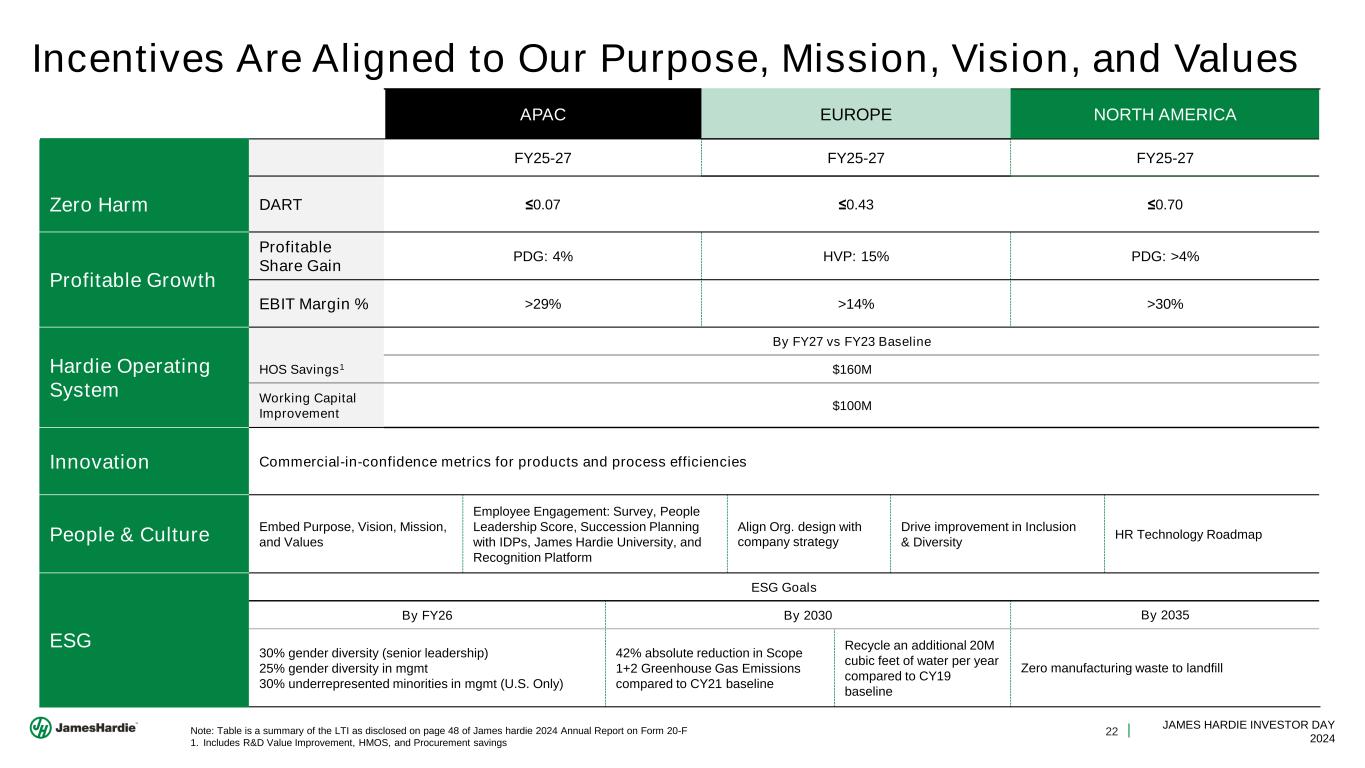
22 JAMES HARDIE INVESTOR DAY 2024 Incentives Are Aligned to Our Purpose, Mission, Vision, and Values APAC EUROPE NORTH AMERICA FY25-27 FY25-27 FY25-27 Zero Harm DART ≤0.07 ≤0.43 ≤0.70 Profitable Growth Profitable Share Gain PDG: 4% HVP: 15% PDG: >4% EBIT Margin % >29% >14% >30% Hardie Operating System By FY27 vs FY23 Baseline HOS Savings1 $160M Working Capital Improvement $100M Innovation Commercial-in-confidence metrics for products and process efficiencies People & Culture Embed Purpose, Vision, Mission, and Values Employee Engagement: Survey, People Leadership Score, Succession Planning with IDPs, James Hardie University, and Recognition Platform Align Org. design with company strategy Drive improvement in Inclusion & Diversity HR Technology Roadmap ESG ESG Goals By FY26 By 2030 By 2035 30% gender diversity (senior leadership) 25% gender diversity in mgmt 30% underrepresented minorities in mgmt (U.S. Only) 42% absolute reduction in Scope 1+2 Greenhouse Gas Emissions compared to CY21 baseline Recycle an additional 20M cubic feet of water per year compared to CY19 baseline Zero manufacturing waste to landfill Note: Table is a summary of the LTI as disclosed on page 48 of James hardie 2024 Annual Report on Form 20-F 1. Includes R&D Value Improvement, HMOS, and Procurement savings
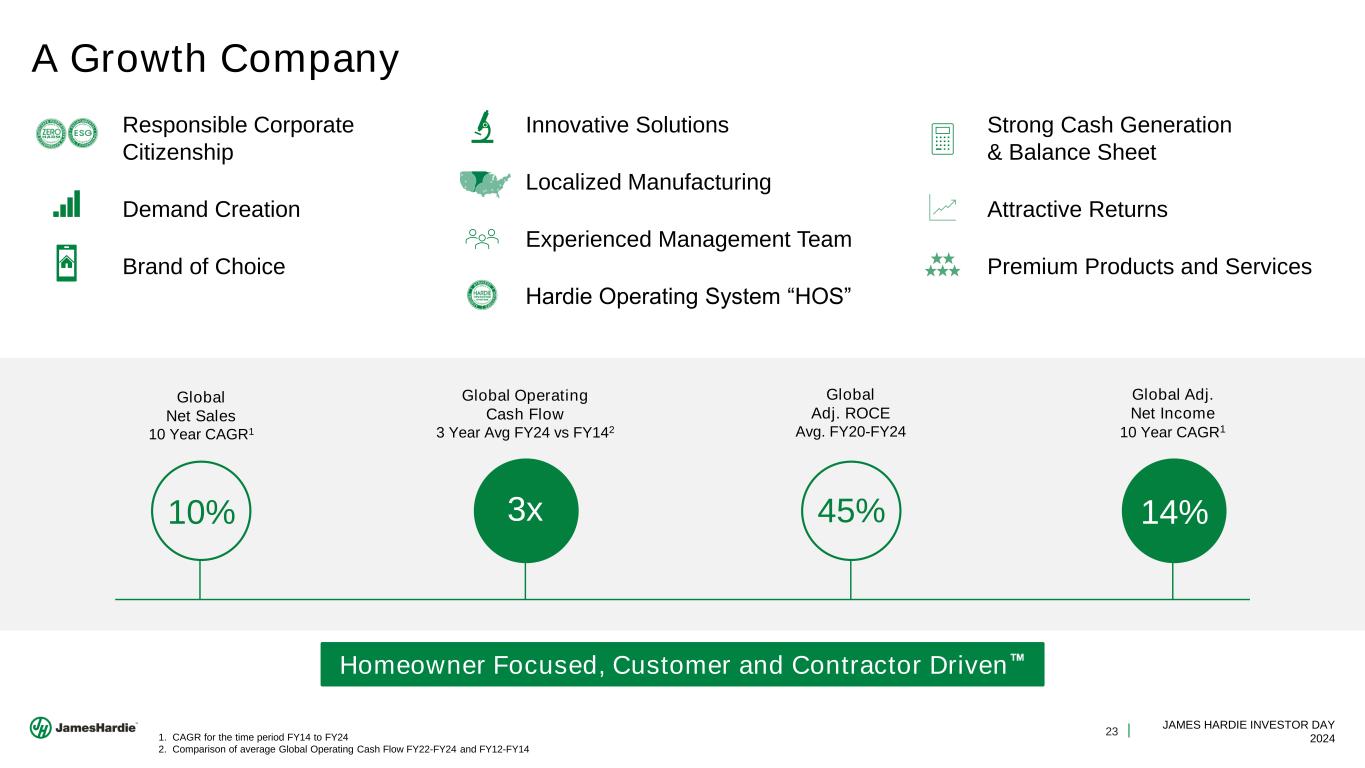
23 JAMES HARDIE INVESTOR DAY 2024 A Growth Company Responsible Corporate Citizenship Demand Creation Brand of Choice Strong Cash Generation & Balance Sheet Attractive Returns Premium Products and Services 10% 14%3x 45% Global Net Sales 10 Year CAGR1 Global Adj. ROCE Avg. FY20-FY24 Global Operating Cash Flow 3 Year Avg FY24 vs FY142 Global Adj. Net Income 10 Year CAGR1 Innovative Solutions Localized Manufacturing Experienced Management Team Hardie Operating System “HOS” 1. CAGR for the time period FY14 to FY24 2. Comparison of average Global Operating Cash Flow FY22-FY24 and FY12-FY14 Homeowner Focused, Customer and Contractor Driven
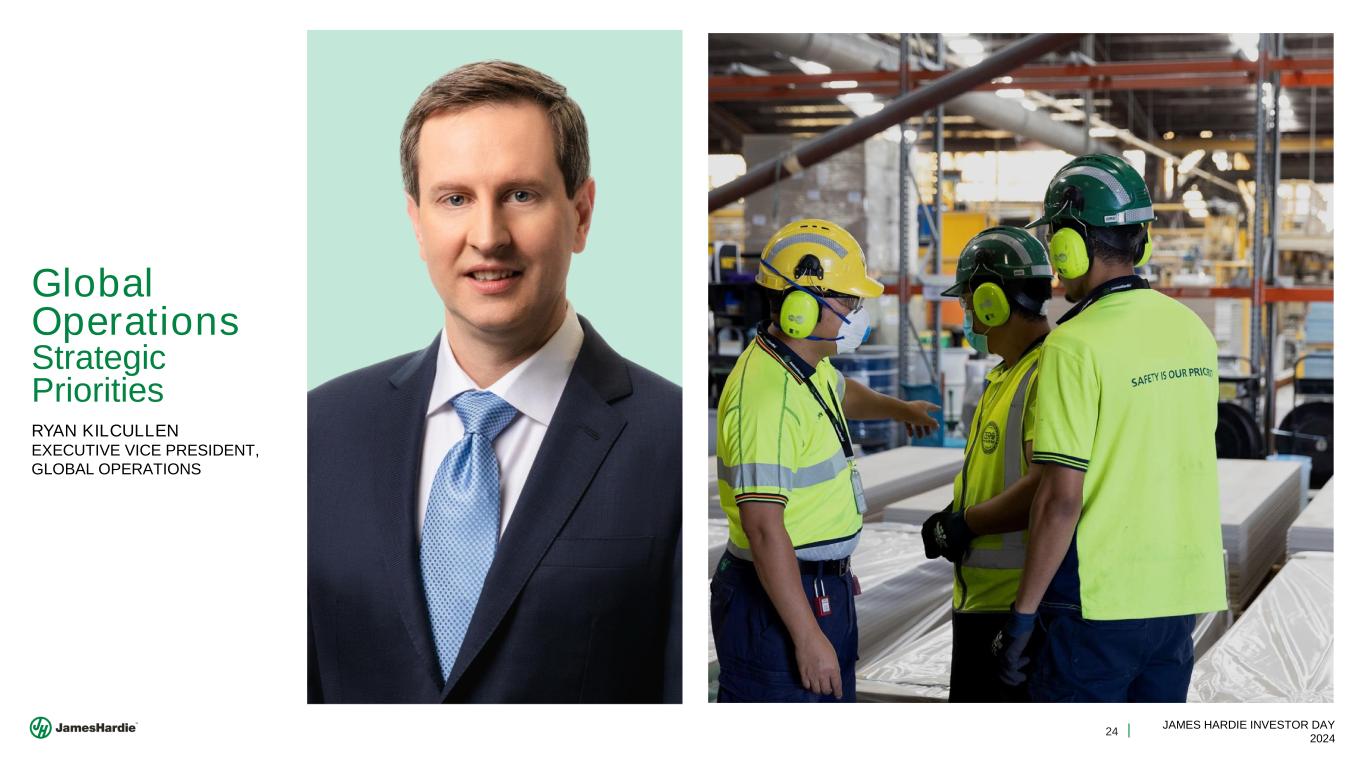
24 JAMES HARDIE INVESTOR DAY 2024 Global Operations Strategic Priorities RYAN KILCULLEN EXECUTIVE VICE PRESIDENT, GLOBAL OPERATIONS
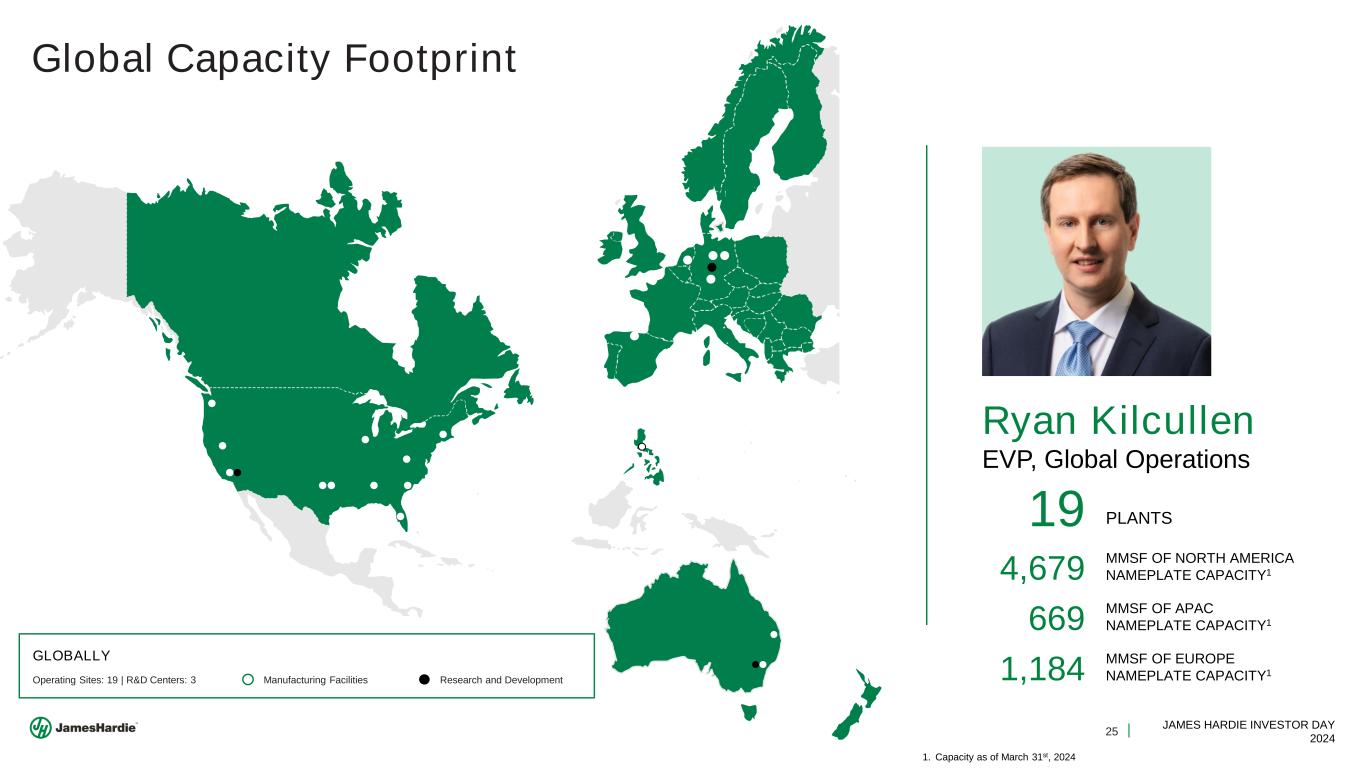
25 JAMES HARDIE INVESTOR DAY 2024 Global Capacity Footprint Ryan Kilcullen EVP, Global Operations 19 PLANTS Operating Sites: 19 | R&D Centers: 3 GLOBALLY Manufacturing Facilities Research and Development 4,679 MMSF OF NORTH AMERICA NAMEPLATE CAPACITY1 669 MMSF OF APAC NAMEPLATE CAPACITY1 1,184 MMSF OF EUROPE NAMEPLATE CAPACITY1 1. Capacity as of March 31st, 2024
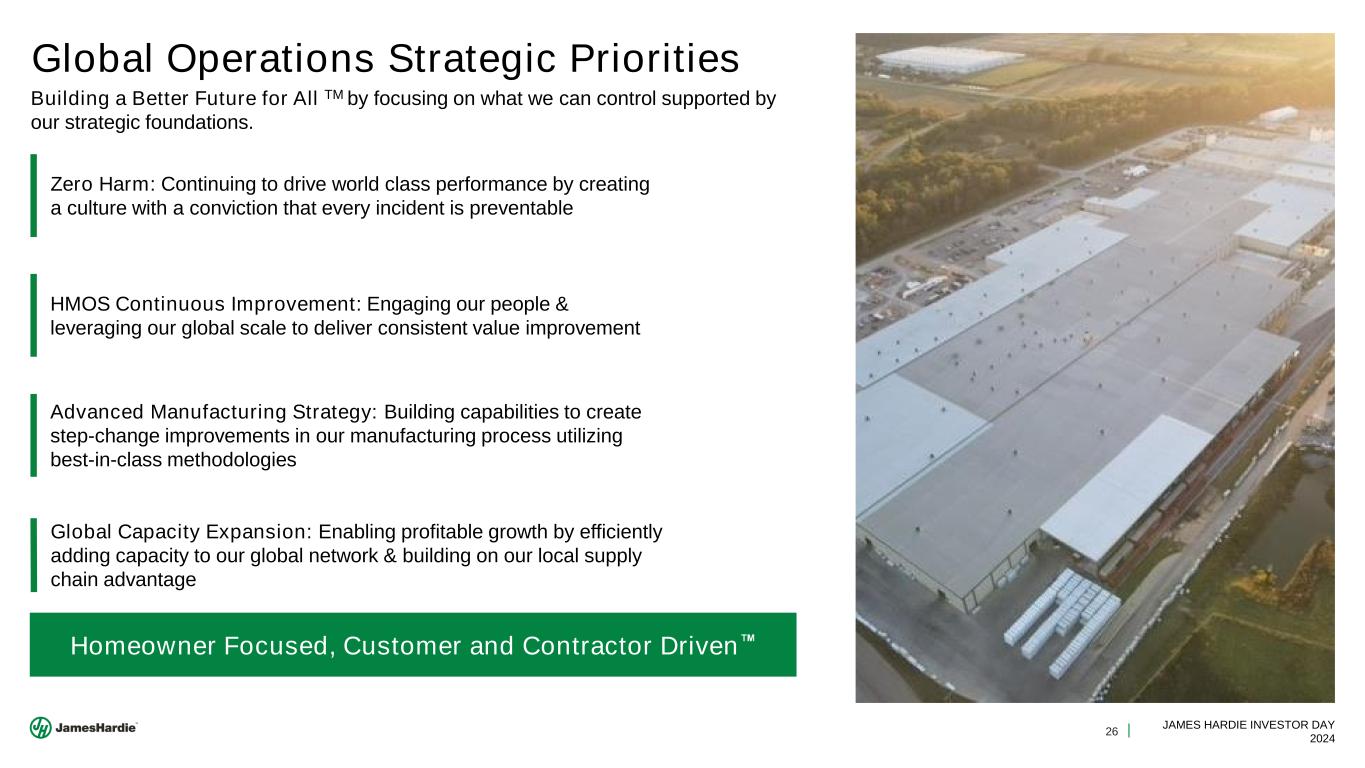
26 JAMES HARDIE INVESTOR DAY 2024 Homeowner Focused, Customer and Contractor Driven HMOS Continuous Improvement: Engaging our people & leveraging our global scale to deliver consistent value improvement Global Capacity Expansion: Enabling profitable growth by efficiently adding capacity to our global network & building on our local supply chain advantage Advanced Manufacturing Strategy: Building capabilities to create step-change improvements in our manufacturing process utilizing best-in-class methodologies Zero Harm: Continuing to drive world class performance by creating a culture with a conviction that every incident is preventable Building a Better Future for All TM by focusing on what we can control supported by our strategic foundations. Global Operations Strategic Priorities
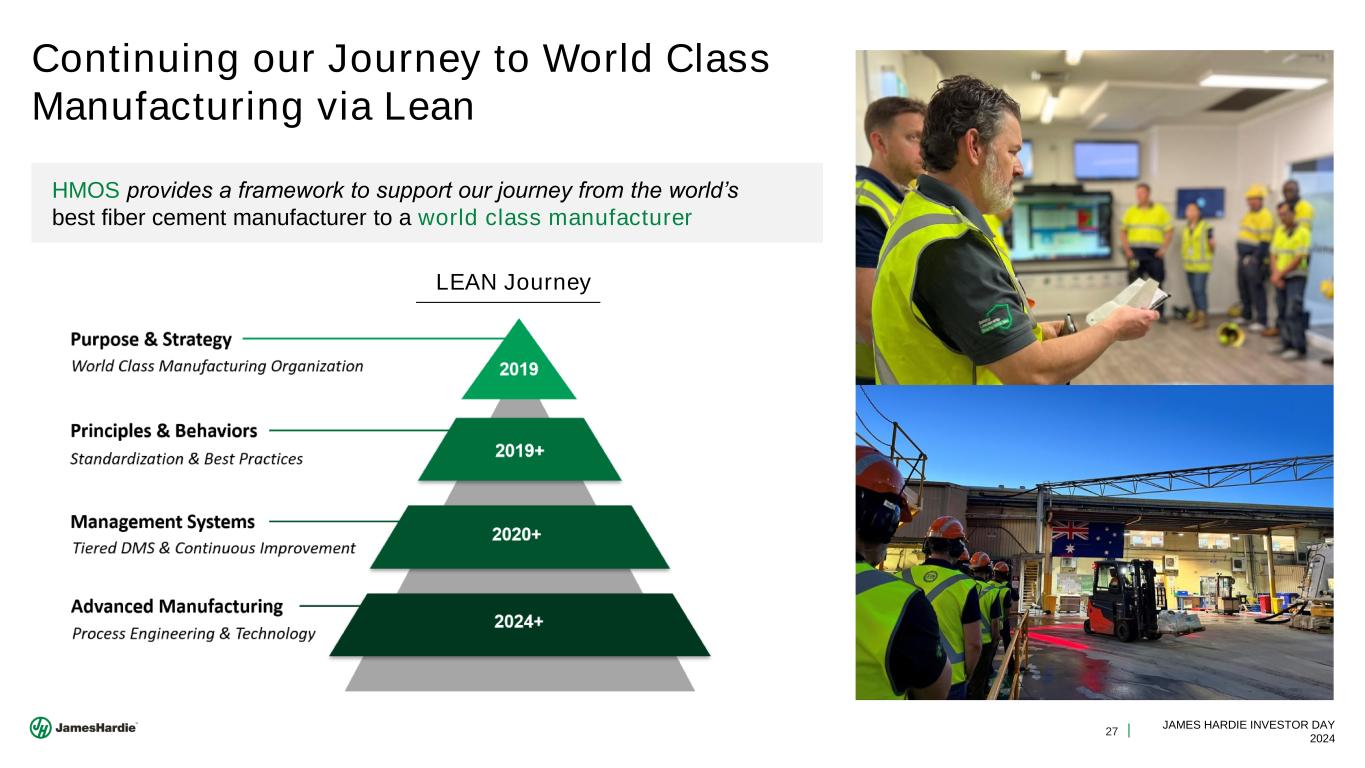
27 JAMES HARDIE INVESTOR DAY 2024 Continuing our Journey to World Class Manufacturing via Lean HMOS provides a framework to support our journey from the world’s best fiber cement manufacturer to a world class manufacturer LEAN Journey ‘19 ‘19 2020 - 2023 2024+
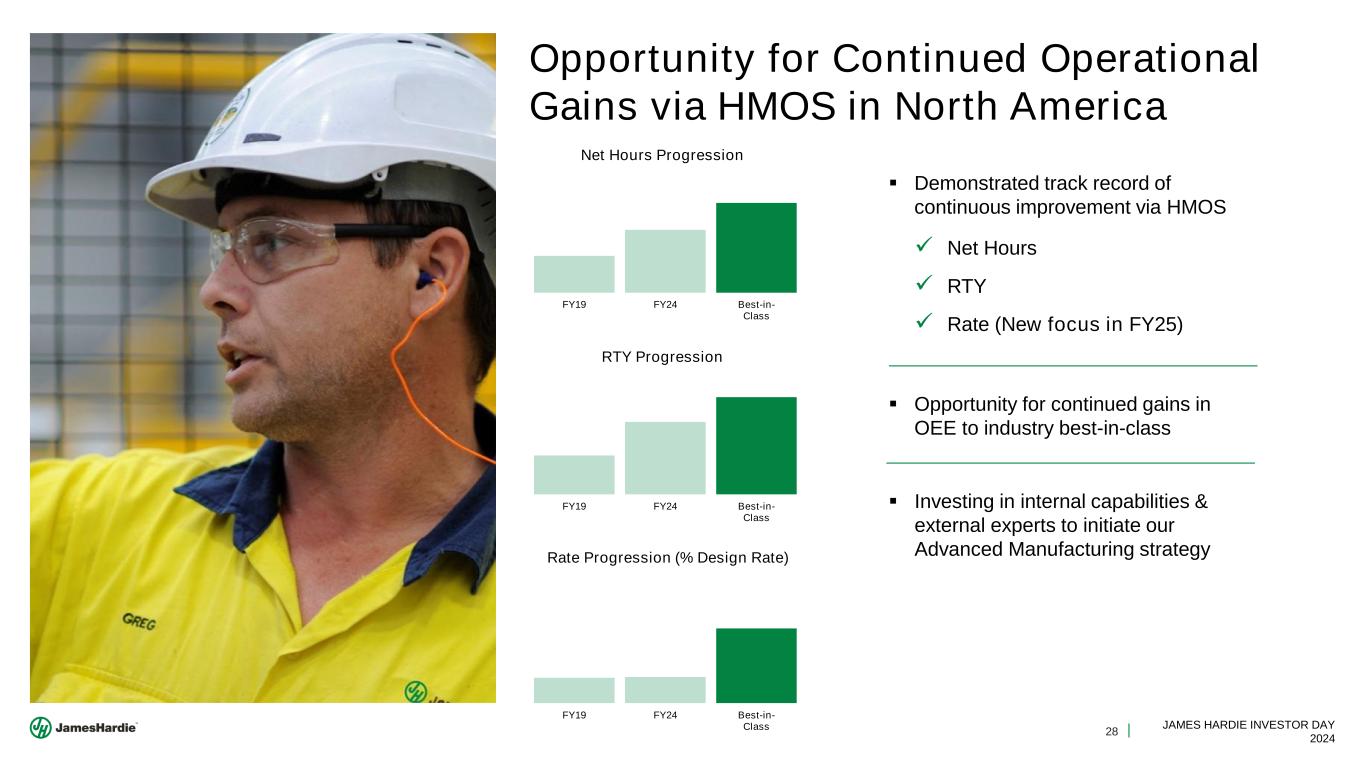
28 JAMES HARDIE INVESTOR DAY 2024 Opportunity for Continued Operational Gains via HMOS in North America ▪ Demonstrated track record of continuous improvement via HMOS ✓ Net Hours ✓ RTY ✓ Rate (New focus in FY25) FY19 FY24 Best-in- Class RTY Progression FY19 FY24 Best-in- Class Net Hours Progression FY19 FY24 Best-in- Class Rate Progression (% Design Rate) ▪ Opportunity for continued gains in OEE to industry best-in-class ▪ Investing in internal capabilities & external experts to initiate our Advanced Manufacturing strategy
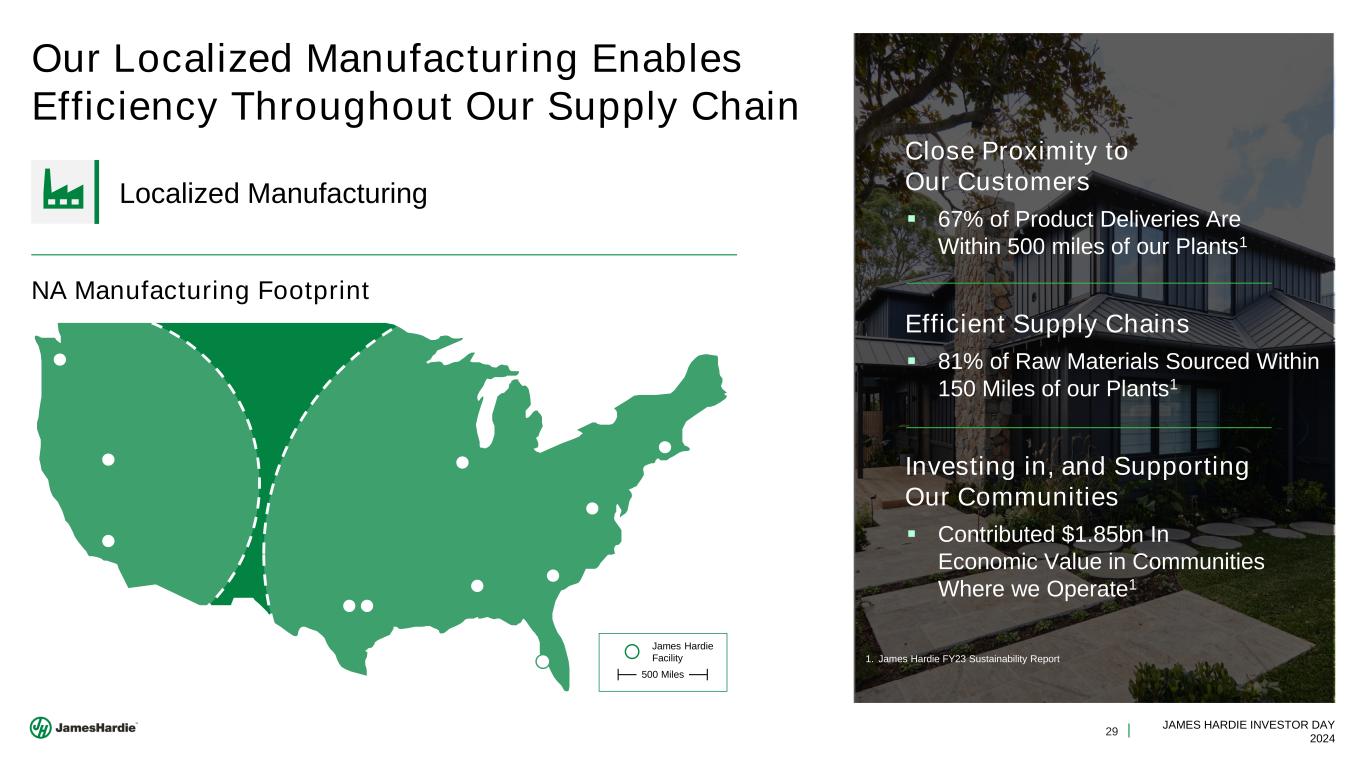
29 JAMES HARDIE INVESTOR DAY 2024 Our Localized Manufacturing Enables Efficiency Throughout Our Supply Chain Localized Manufacturing Close Proximity to Our Customers ▪ 67% of Product Deliveries Are Within 500 miles of our Plants1 Efficient Supply Chains ▪ 81% of Raw Materials Sourced Within 150 Miles of our Plants1 Investing in, and Supporting Our Communities ▪ Contributed $1.85bn In Economic Value in Communities Where we Operate1 NA Manufacturing Footprint 500 Miles James Hardie Facility 1. James Hardie FY23 Sustainability Report

30 JAMES HARDIE INVESTOR DAY 2024 Prattville Mega Site Sheet Machine 3 & 4 Expansion Key Strategic Enabler of Profitable Growth Commissioning execution for FY25 Delivery Focused manufacturing lines & high scale approach PRATTVILLE – JUNE 2018 PRATTVILLE – FEBRUARY 2024 4 1.2B 600 Approx. Sheet machines Standard Feet of Capacity Employees Integrated Safety Plan & Execution Team
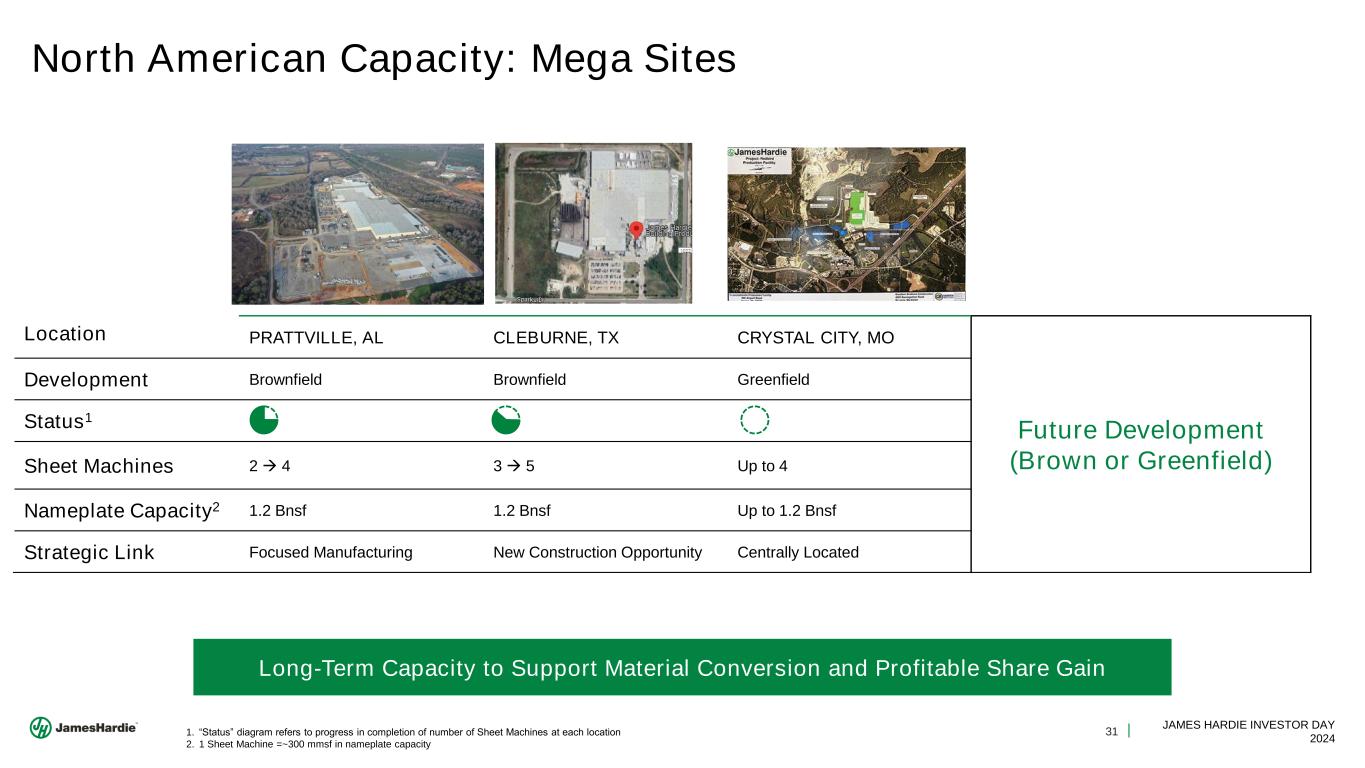
31 JAMES HARDIE INVESTOR DAY 2024 Location PRATTVILLE, AL CLEBURNE, TX CRYSTAL CITY, MO Future Development (Brown or Greenfield) Development Brownfield Brownfield Greenfield Status1 Sheet Machines 2 → 4 3 → 5 Up to 4 Nameplate Capacity2 1.2 Bnsf 1.2 Bnsf Up to 1.2 Bnsf Strategic Link Focused Manufacturing New Construction Opportunity Centrally Located North American Capacity: Mega Sites Long-Term Capacity to Support Material Conversion and Profitable Share Gain 1. “Status” diagram refers to progress in completion of number of Sheet Machines at each location 2. 1 Sheet Machine =~300 mmsf in nameplate capacity
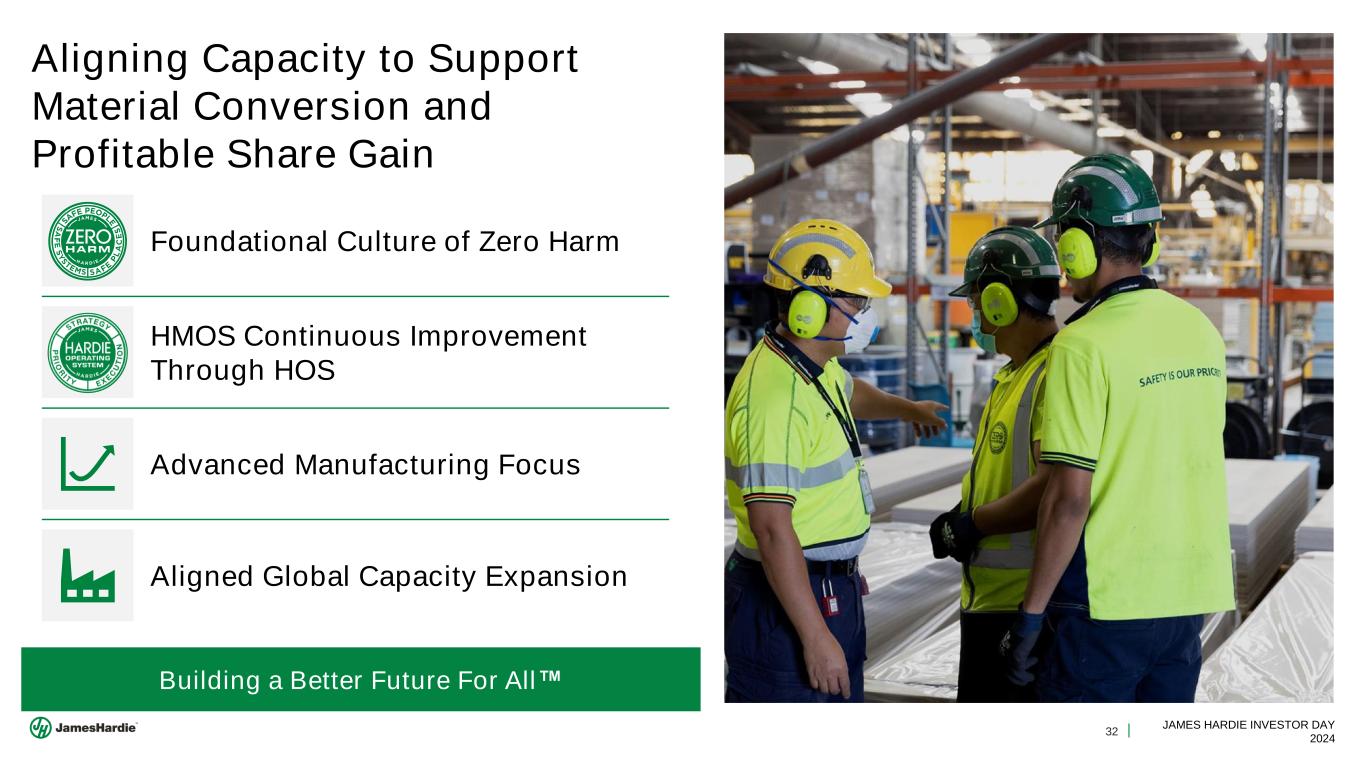
32 JAMES HARDIE INVESTOR DAY 2024 Aligning Capacity to Support Material Conversion and Profitable Share Gain Foundational Culture of Zero Harm HMOS Continuous Improvement Through HOS Advanced Manufacturing Focus Aligned Global Capacity Expansion Building a Better Future For All
33 JAMES HARDIE INVESTOR DAY 2024 ESG Roadmap JILL KOLLING CHIEF SUSTAINABILITY OFFICER
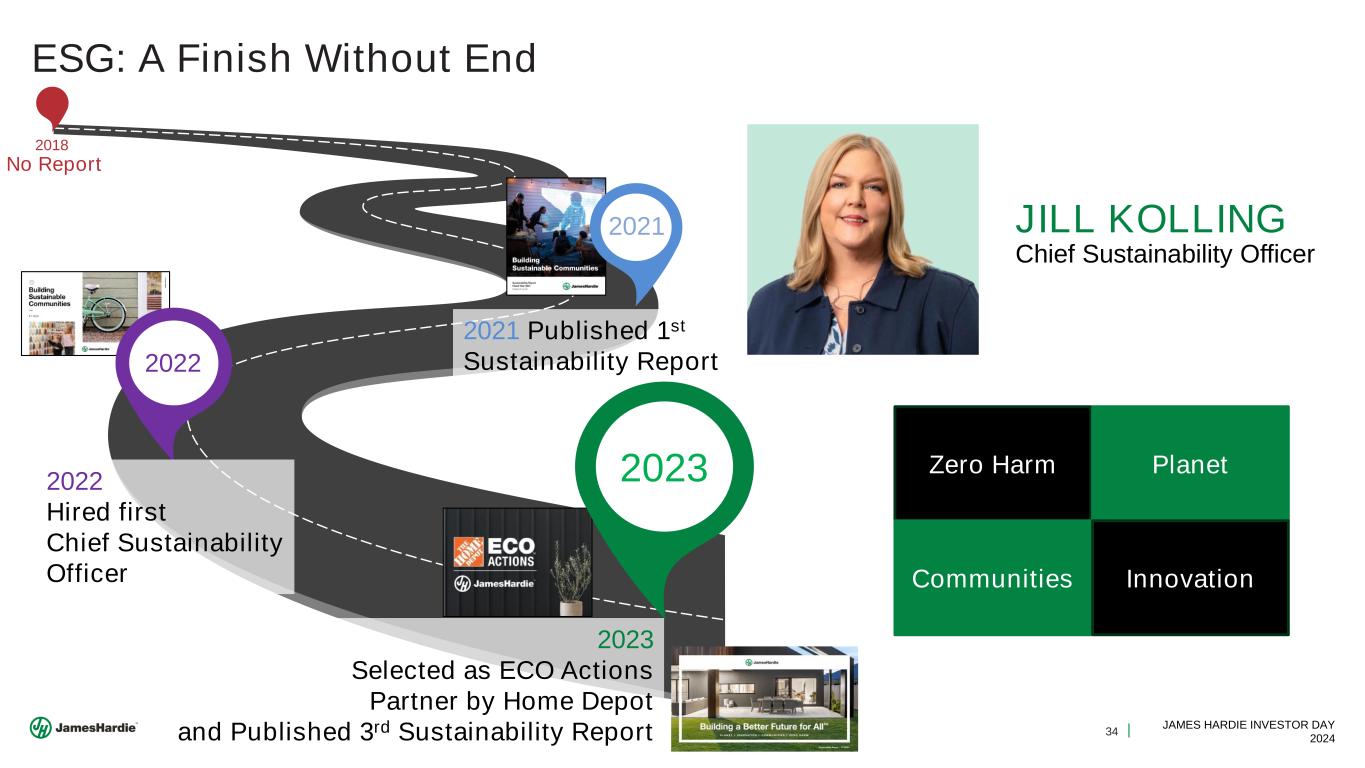
34 JAMES HARDIE INVESTOR DAY 2024 ESG: A Finish Without End No Report 2018 2021 2022 2022 Hired first Chief Sustainability Officer 2021 Published 1st Sustainability Report 2023 2023 Selected as ECO Actions Partner by Home Depot and Published 3rd Sustainability Report Zero Harm Communities Planet Innovation JILL KOLLING Chief Sustainability Officer
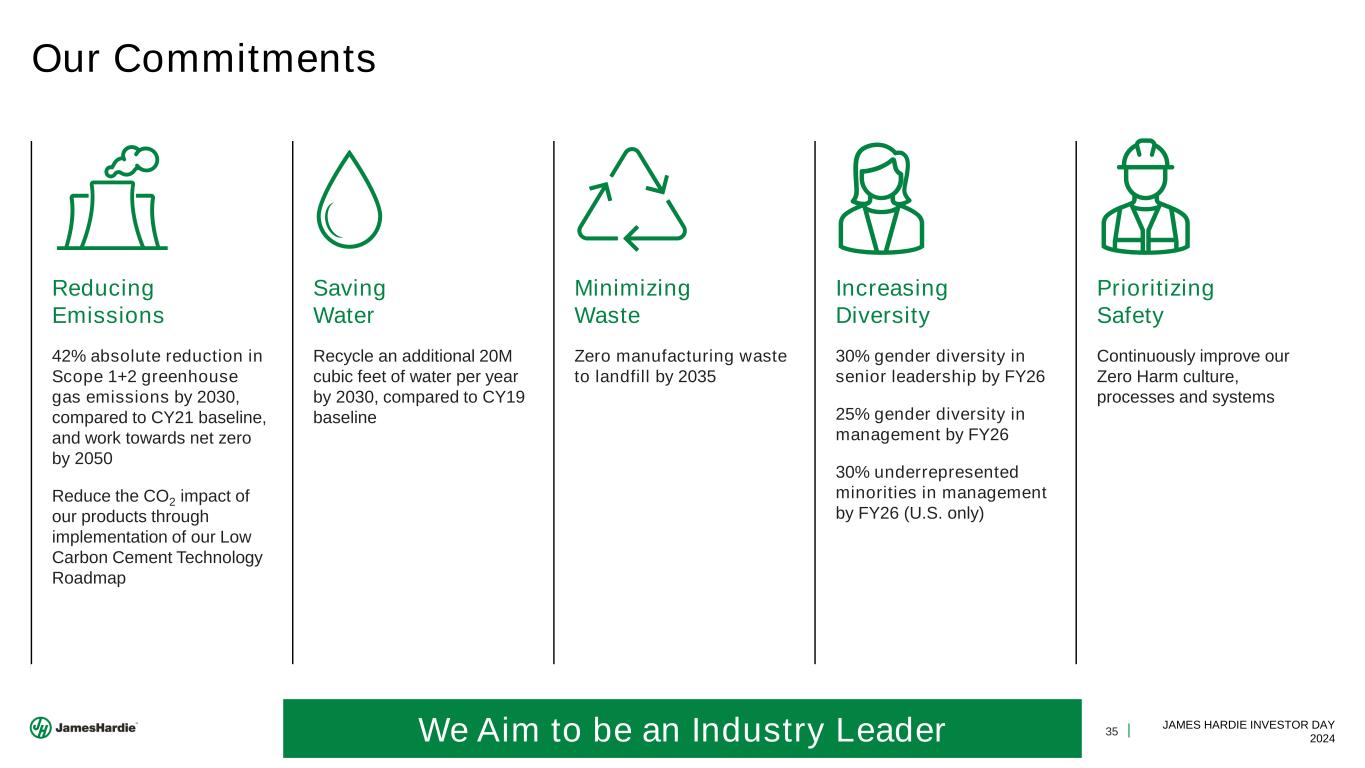
35 JAMES HARDIE INVESTOR DAY 2024 Reducing Emissions 42% absolute reduction in Scope 1+2 greenhouse gas emissions by 2030, compared to CY21 baseline, and work towards net zero by 2050 Reduce the CO2 impact of our products through implementation of our Low Carbon Cement Technology Roadmap Saving Water Recycle an additional 20M cubic feet of water per year by 2030, compared to CY19 baseline Minimizing Waste Zero manufacturing waste to landfill by 2035 Increasing Diversity 30% gender diversity in senior leadership by FY26 25% gender diversity in management by FY26 30% underrepresented minorities in management by FY26 (U.S. only) Prioritizing Safety Continuously improve our Zero Harm culture, processes and systems Our Commitments We Aim to be an Industry Leader
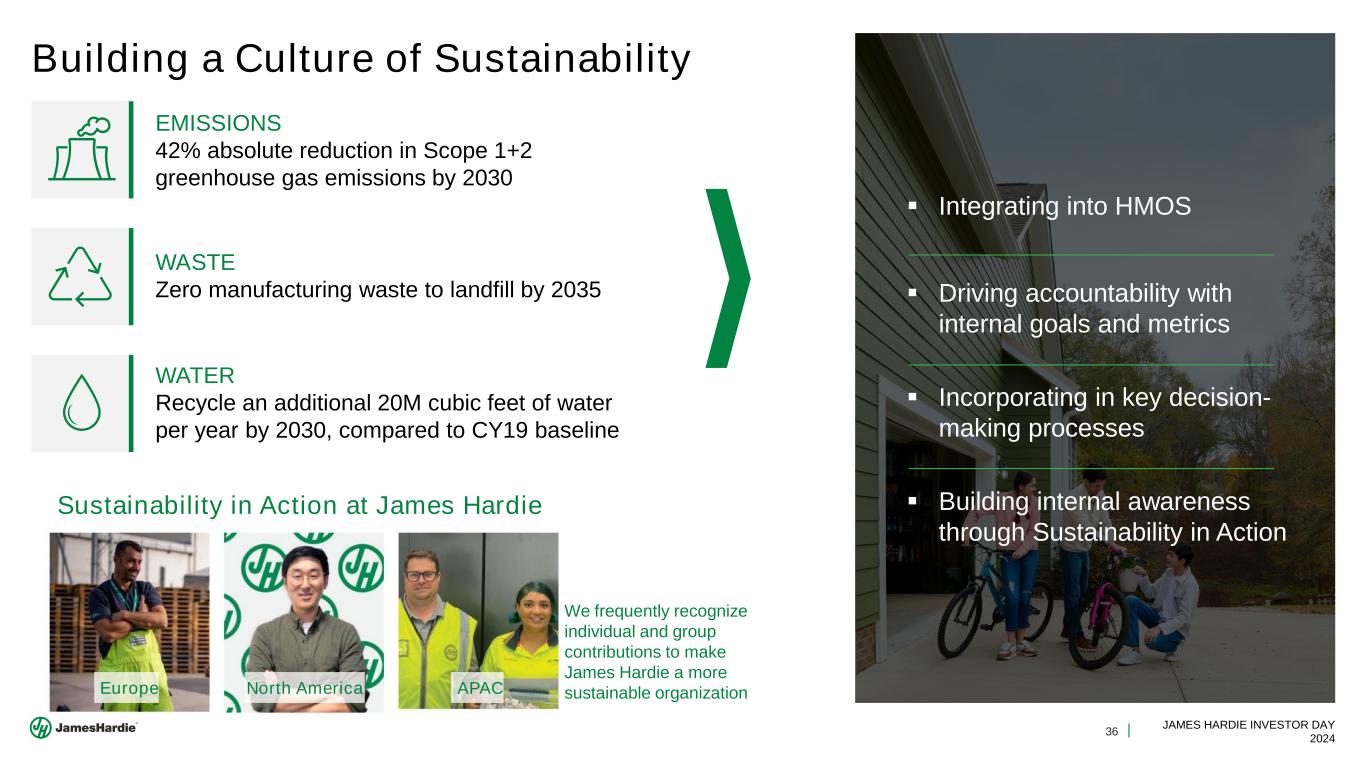
36 JAMES HARDIE INVESTOR DAY 2024 Building a Culture of Sustainability ▪ Integrating into HMOS ▪ Driving accountability with internal goals and metrics ▪ Incorporating in key decision- making processes ▪ Building internal awareness through Sustainability in Action EMISSIONS 42% absolute reduction in Scope 1+2 greenhouse gas emissions by 2030 WATER Recycle an additional 20M cubic feet of water per year by 2030, compared to CY19 baseline WASTE Zero manufacturing waste to landfill by 2035 Sustainability in Action at James Hardie We frequently recognize individual and group contributions to make James Hardie a more sustainable organizationEurope North America APAC
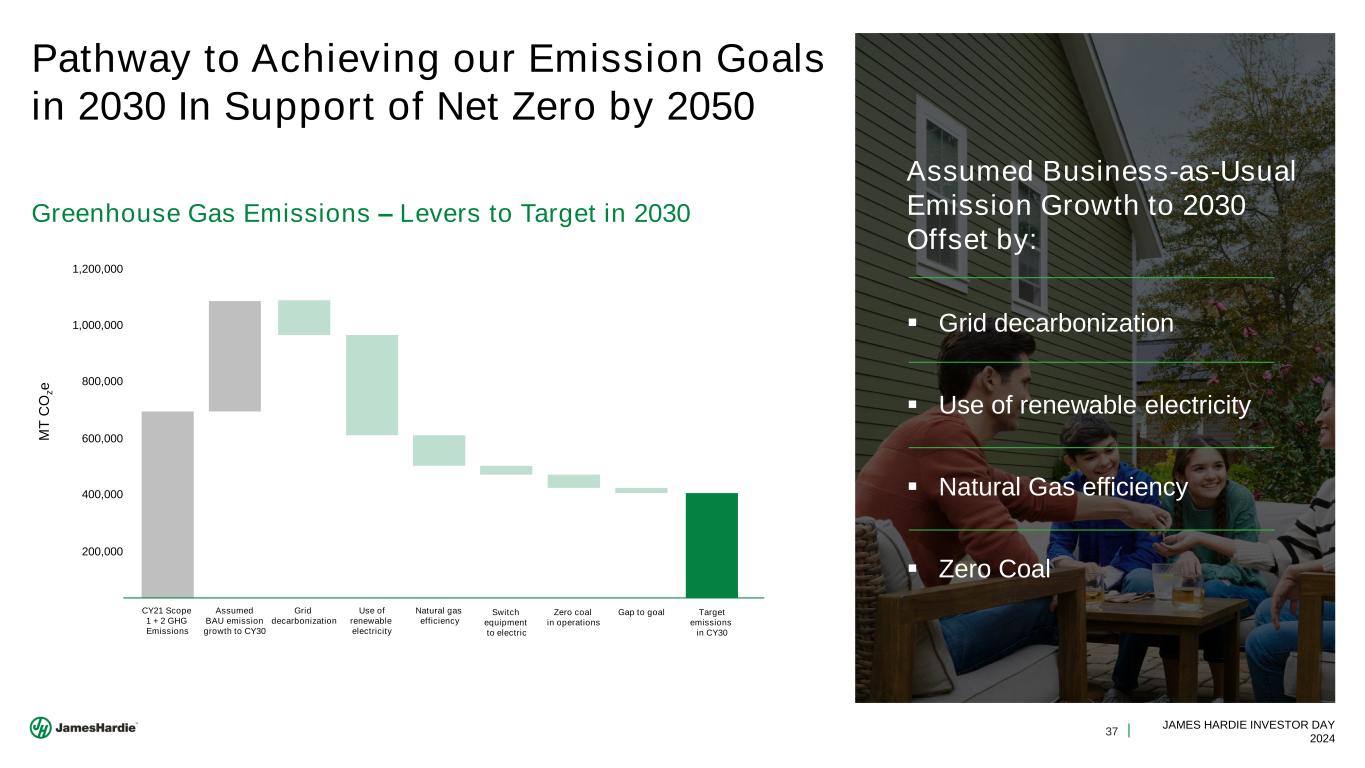
37 JAMES HARDIE INVESTOR DAY 2024 Assumed Business-as-Usual Emission Growth to 2030 Offset by: ▪ Grid decarbonization ▪ Use of renewable electricity ▪ Natural Gas efficiency ▪ Zero Coal Pathway to Achieving our Emission Goals in 2030 In Support of Net Zero by 2050 Greenhouse Gas Emissions – Levers to Target in 2030 1,200,000 800,000 600,000 400,000 200,000 CY21 Scope 1 + 2 GHG Emissions Assumed BAU emission growth to CY30 Grid decarbonization Use of renewable electricity Natural gas efficiency Switch equipment to electric Zero coal in operations Gap to goal Target emissions in CY30 M T C O z e 1,000,000

38 JAMES HARDIE INVESTOR DAY 2024 Cut cradle to gate carbon footprint in half by FY29+ Reducing Product Carbon Footprint Product manufacturing Potential savings from reaching our Scope 1+2 GHG emissions reduction goal Product manufacturing Potential savings from our Low Carbon Cement Technology Roadmap Current Carbon Footprint 2030 Ambition overall reduction 50% Hardie® Plank HZ10 Cradle-to-Gate Carbon Footprint G re e n h o u s e G a s E m is s io n s ( k g C O 2 e )/ m 2
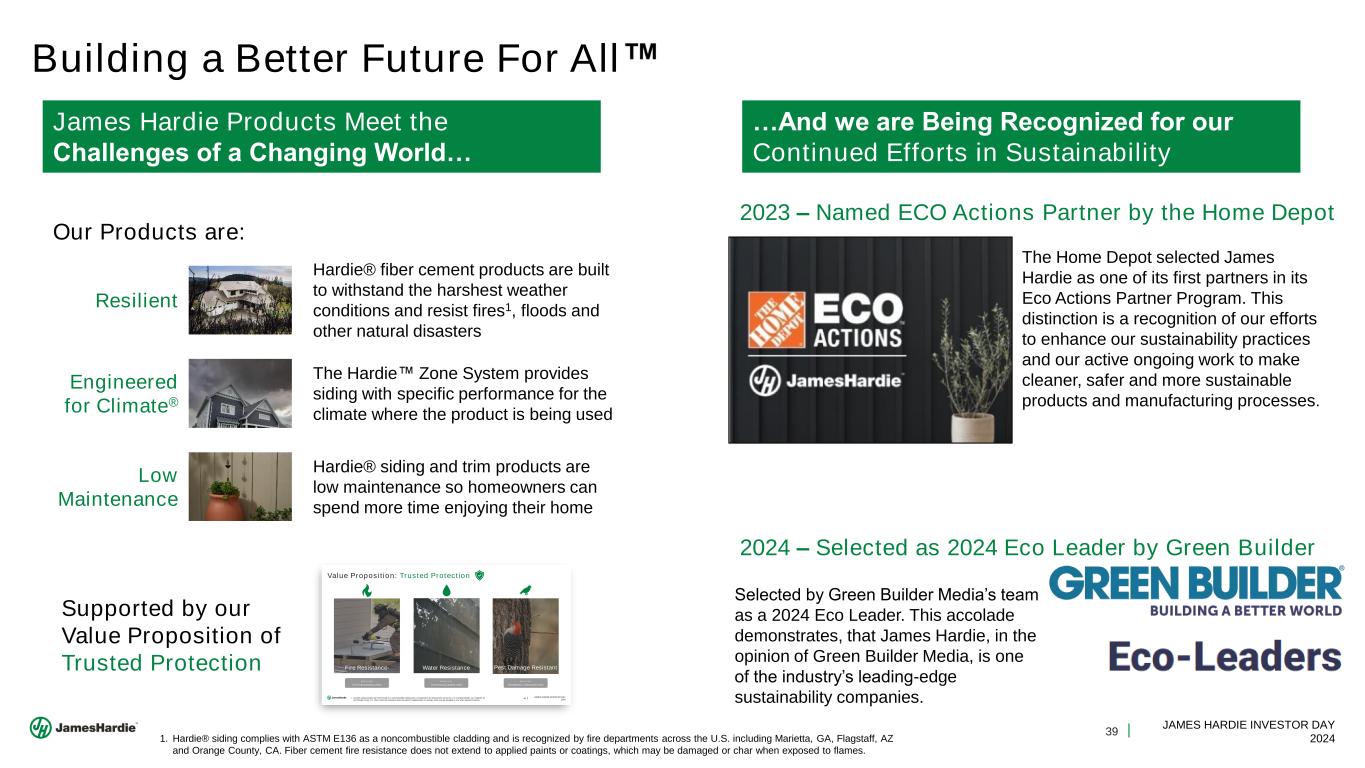
39 JAMES HARDIE INVESTOR DAY 2024 Building a Better Future For All 46 JAMES HARDIE INVESTOR DAY 2024 Value Proposition: Trusted Protection 1. Hardie® siding complies with ASTM E136 as a noncombustible cladding and is recognized by fire departments across the U.S. including Marietta, GA, Flagstaff, AZ and Orange County, CA. Fiber cement fire resistance does not extend to applied paints or coatings, which may be damaged or char when exposed to flames. Water ResistanceFire Resistance1 Pest Damage Resistant Watch the Fire Demonstration video Watch the Dimensional Stability video Watch the Woodpecker Testimonial video Supported by our Value Proposition of Trusted Protection James Hardie Products Meet the Challenges of a Changing World… Our Products are: Engineered for Climate® Resilient Low Maintenance Hardie® fiber cement products are built to withstand the harshest weather conditions and resist fires1, floods and other natural disasters The Hardie Zone System provides siding with specific performance for the climate where the product is being used Hardie® siding and trim products are low maintenance so homeowners can spend more time enjoying their home …And we are Being Recognized for our Continued Efforts in Sustainability The Home Depot selected James Hardie as one of its first partners in its Eco Actions Partner Program. This distinction is a recognition of our efforts to enhance our sustainability practices and our active ongoing work to make cleaner, safer and more sustainable products and manufacturing processes. 2023 – Named ECO Actions Partner by the Home Depot Selected by Green Builder Media’s team as a 2024 Eco Leader. This accolade demonstrates, that James Hardie, in the opinion of Green Builder Media, is one of the industry’s leading-edge sustainability companies. 2024 – Selected as 2024 Eco Leader by Green Builder 1. Hardie® siding complies with ASTM E136 as a noncombustible cladding and is recognized by fire departments across the U.S. including Marietta, GA, Flagstaff, AZ and Orange County, CA. Fiber cement fire resistance does not extend to applied paints or coatings, which may be damaged or char when exposed to flames.
40 JAMES HARDIE INVESTOR DAY 2024 JOE LIU CHIEF TECHNOLOGY OFFICER Innovation Strategic Priorities
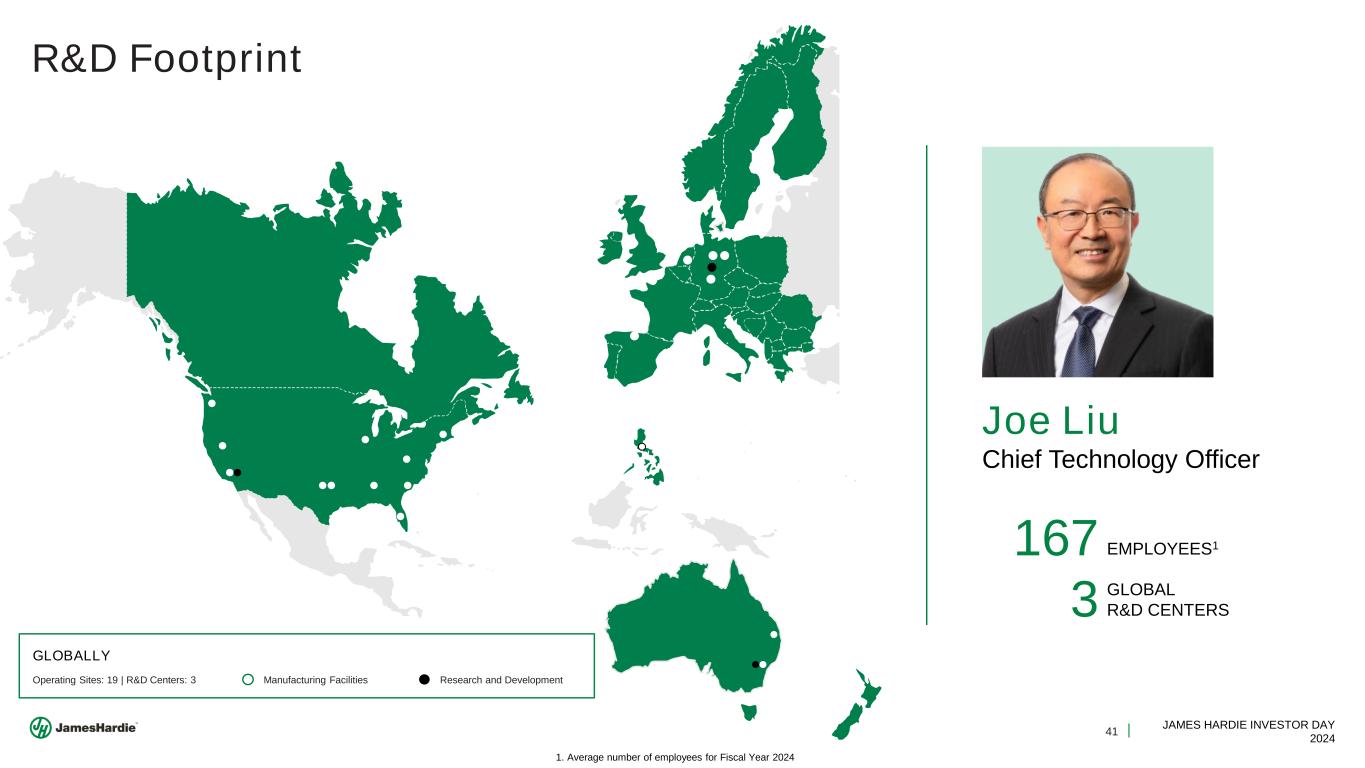
41 JAMES HARDIE INVESTOR DAY 2024 R&D Footprint Joe Liu Chief Technology Officer 3 GLOBAL R&D CENTERS 167 EMPLOYEES1 Operating Sites: 19 | R&D Centers: 3 GLOBALLY Manufacturing Facilities Research and Development 1. Average number of employees for Fiscal Year 2024
42 JAMES HARDIE INVESTOR DAY 2024 Global Innovation Strategic Priorities Building a Better Future for All TM by focusing on what we can control supported by our strategic foundations. Homeowner Focused, Customer and Contractor Driven Accelerate Material Conversion: Prioritized growth programs aligned to the regional focuses on material conversion and profitable share gain Strengthen Our Core: Robust pipeline of programs to support and enhance the core businesses, from value improvement to sustainable raw materials Develop New Platforms: Address mega-trends and increase design flexibility for homeowners, architects and builders in terms of look and use
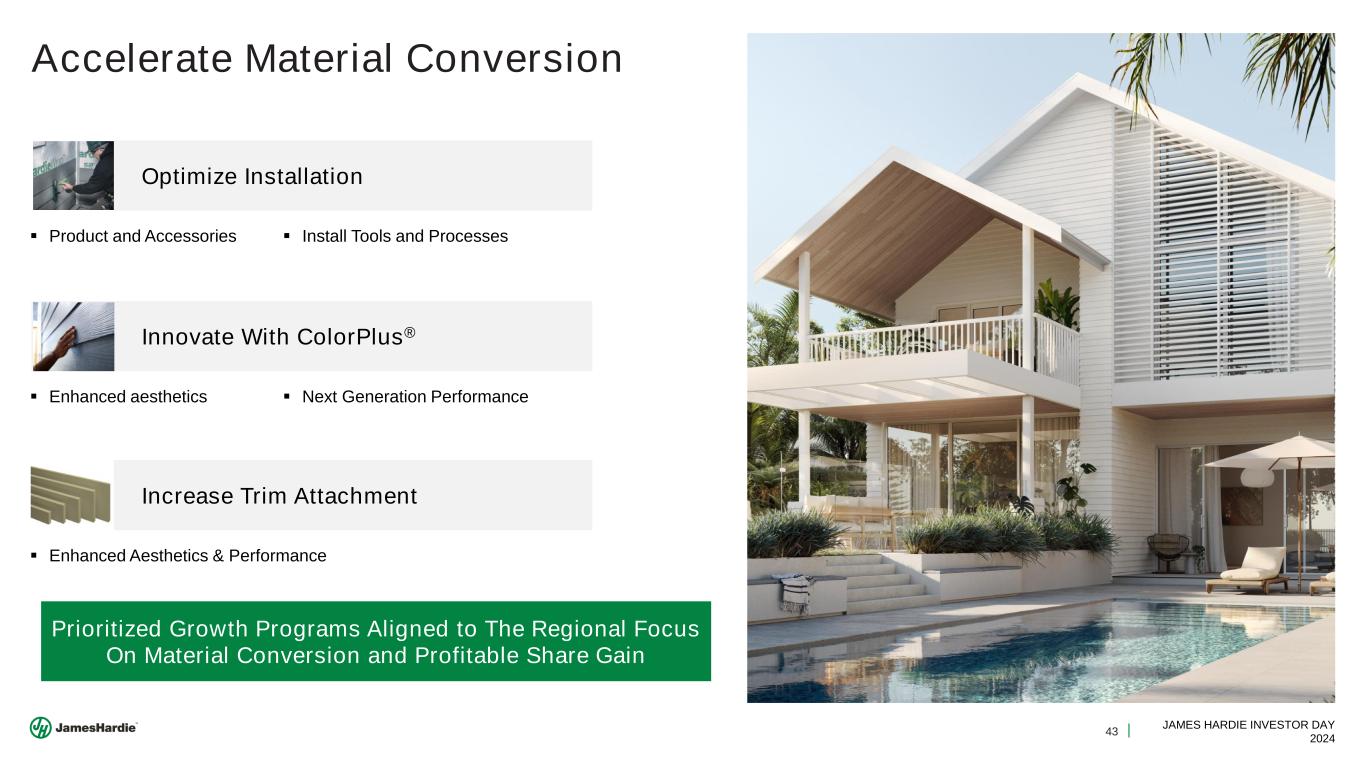
43 JAMES HARDIE INVESTOR DAY 2024 ▪ Enhanced aesthetics ▪ Next Generation Performance Innovate With ColorPlus® ▪ Enhanced Aesthetics & Performance Increase Trim Attachment ▪ Product and Accessories ▪ Install Tools and Processes Optimize Installation Accelerate Material Conversion Prioritized Growth Programs Aligned to The Regional Focus On Material Conversion and Profitable Share Gain

44 JAMES HARDIE INVESTOR DAY 2024 ▪ Sustainable Raw Materials Enable ESG ▪ Recycled Material Usage Strengthen Our Core ▪ Re-formulation ▪ Process Optimization Value Improvement Through HOS Low Carbon Cement Innovation ▪ Phased Roadmap Execution ▪ Leveraging Partnerships Robust Pipeline of Programs To Support and Enhance The Core Businesses
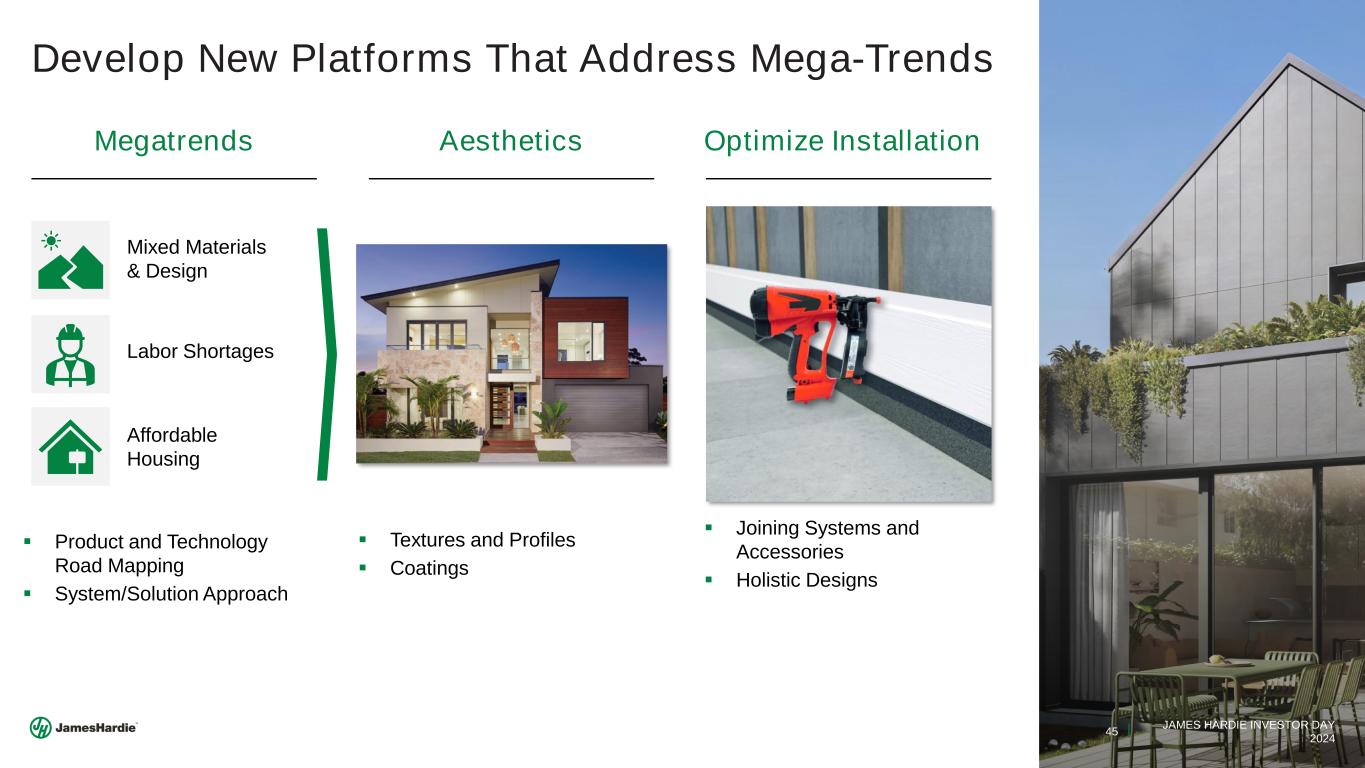
45 JAMES HARDIE INVESTOR DAY 2024 Develop New Platforms That Address Mega-Trends Megatrends Aesthetics Mixed Materials & Design Labor Shortages Affordable Housing Optimize Installation ▪ Textures and Profiles ▪ Coatings ▪ Joining Systems and Accessories ▪ Holistic Designs ▪ Product and Technology Road Mapping ▪ System/Solution Approach
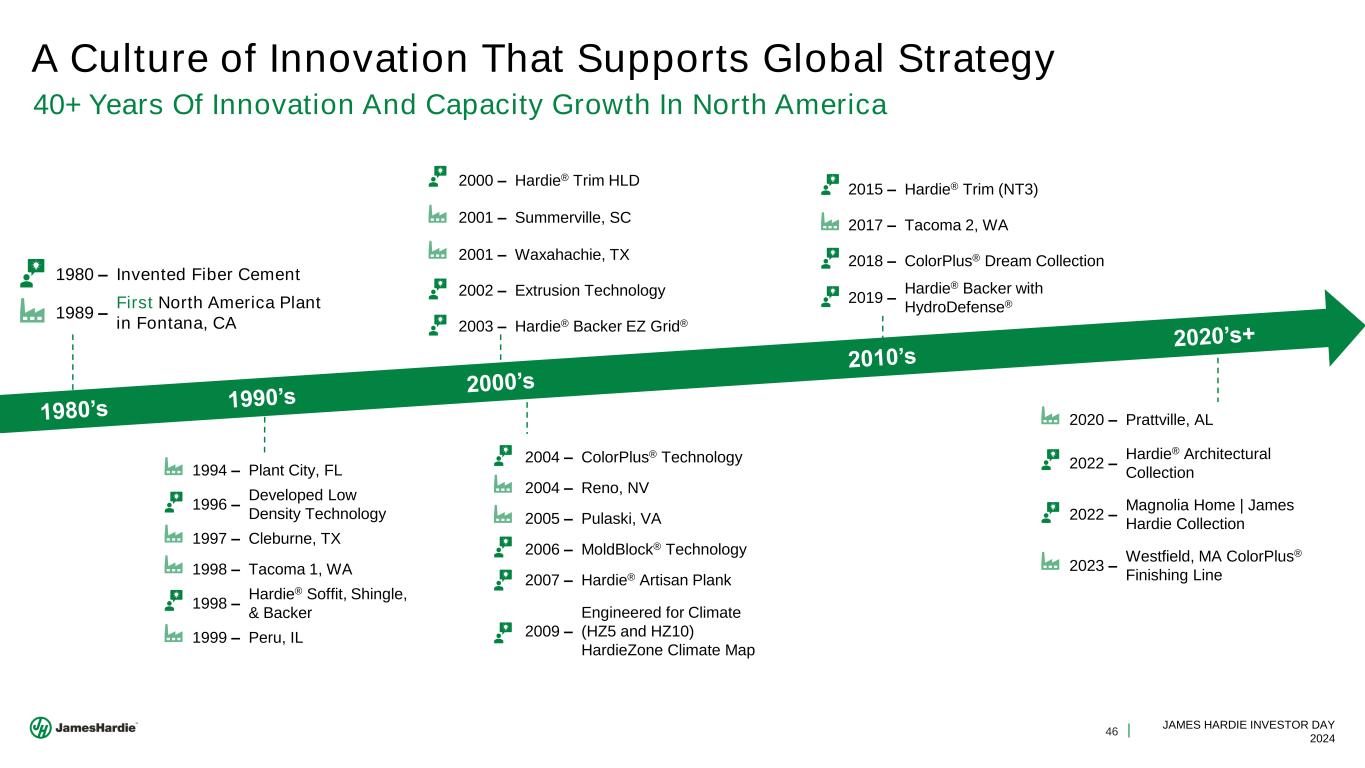
46 JAMES HARDIE INVESTOR DAY 2024 A Culture of Innovation That Supports Global Strategy 40+ Years Of Innovation And Capacity Growth In North America 1980 – Invented Fiber Cement 1989 – First North America Plant in Fontana, CA 1994 – Plant City, FL 1996 – Developed Low Density Technology 1997 – Cleburne, TX 1998 – Tacoma 1, WA 1998 – Hardie® Soffit, Shingle, & Backer 1999 – Peru, IL 2000 – Hardie® Trim HLD 2001 – Summerville, SC 2001 – Waxahachie, TX 2002 – Extrusion Technology 2003 – Hardie® Backer EZ Grid® 2004 – ColorPlus® Technology 2004 – Reno, NV 2005 – Pulaski, VA 2006 – MoldBlock® Technology 2007 – Hardie® Artisan Plank 2009 – Engineered for Climate (HZ5 and HZ10) HardieZone Climate Map 2015 – Hardie® Trim (NT3) 2017 – Tacoma 2, WA 2018 – ColorPlus® Dream Collection 2019 – Hardie® Backer with HydroDefense® 2020 – Prattville, AL 2022 – Hardie® Architectural Collection 2022 – Magnolia Home | James Hardie Collection 2023 – Westfield, MA ColorPlus® Finishing Line
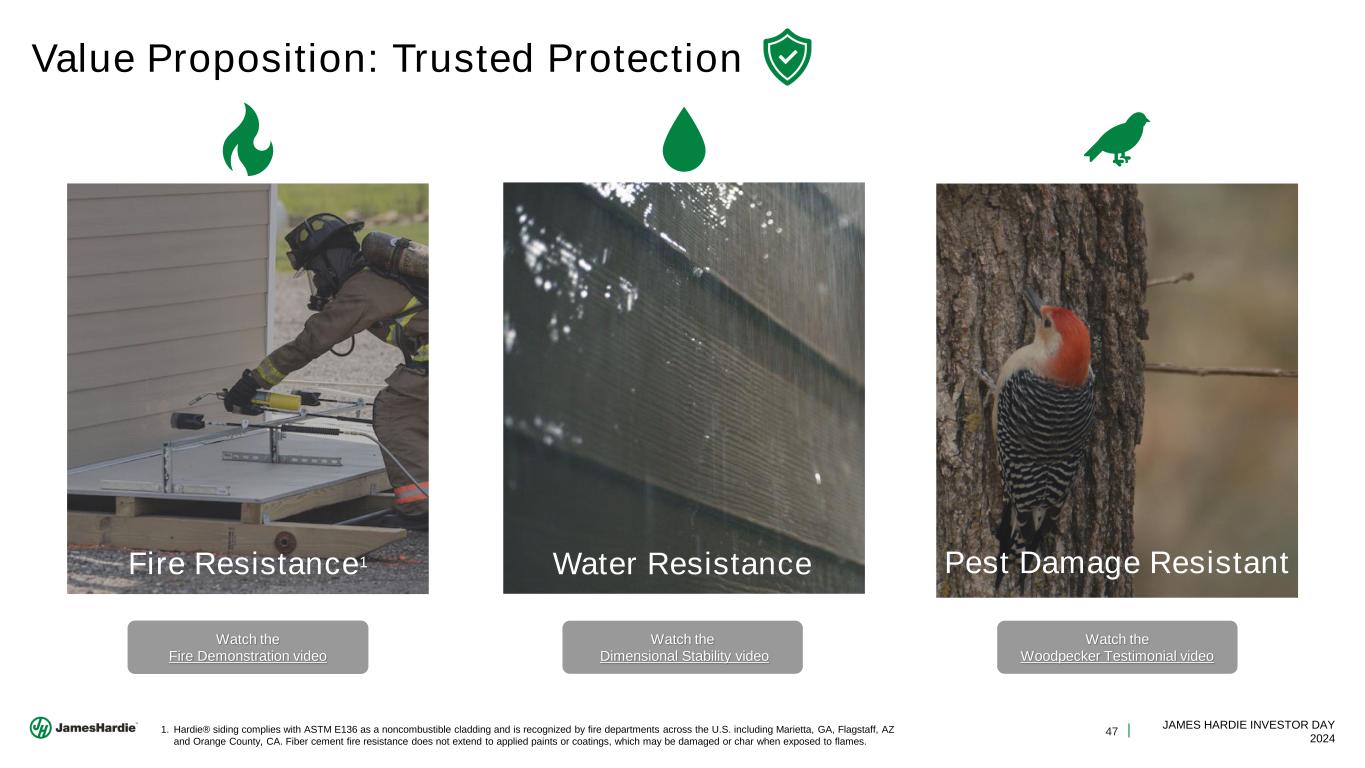
47 JAMES HARDIE INVESTOR DAY 2024 Value Proposition: Trusted Protection 1. Hardie® siding complies with ASTM E136 as a noncombustible cladding and is recognized by fire departments across the U.S. including Marietta, GA, Flagstaff, AZ and Orange County, CA. Fiber cement fire resistance does not extend to applied paints or coatings, which may be damaged or char when exposed to flames. Water ResistanceFire Resistance1 Pest Damage Resistant Watch the Fire Demonstration video Watch the Dimensional Stability video Watch the Woodpecker Testimonial video
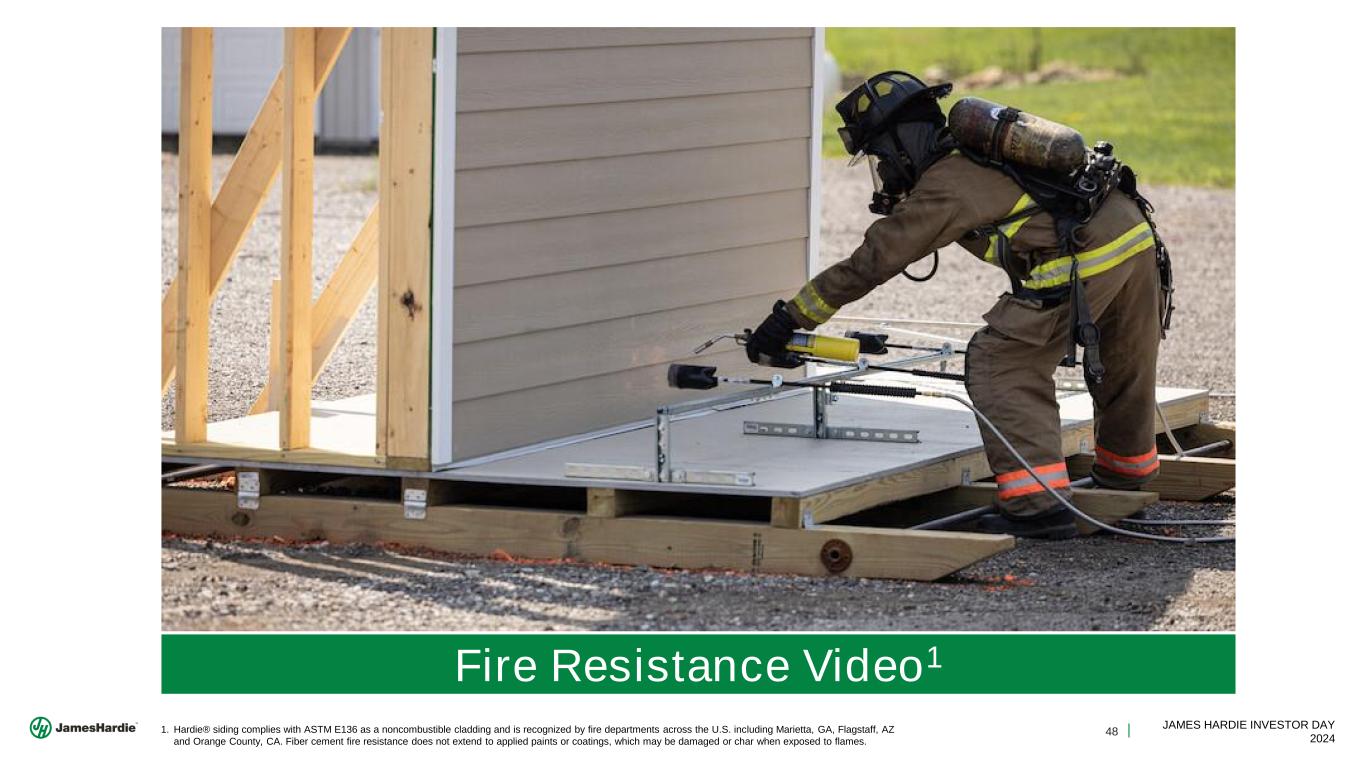
48 JAMES HARDIE INVESTOR DAY 2024 Fire Resistance Video1 1. Hardie® siding complies with ASTM E136 as a noncombustible cladding and is recognized by fire departments across the U.S. including Marietta, GA, Flagstaff, AZ and Orange County, CA. Fiber cement fire resistance does not extend to applied paints or coatings, which may be damaged or char when exposed to flames.
49 JAMES HARDIE INVESTOR DAY 2024 © 2023 Warner Bros. Discovery, Inc. or its subsidiaries and affiliates. All trademarks are the property of their respective owners. All rights reserved. North America Long-Term Aspirations AARON ERTER CHIEF EXECUTIVE OFFICER
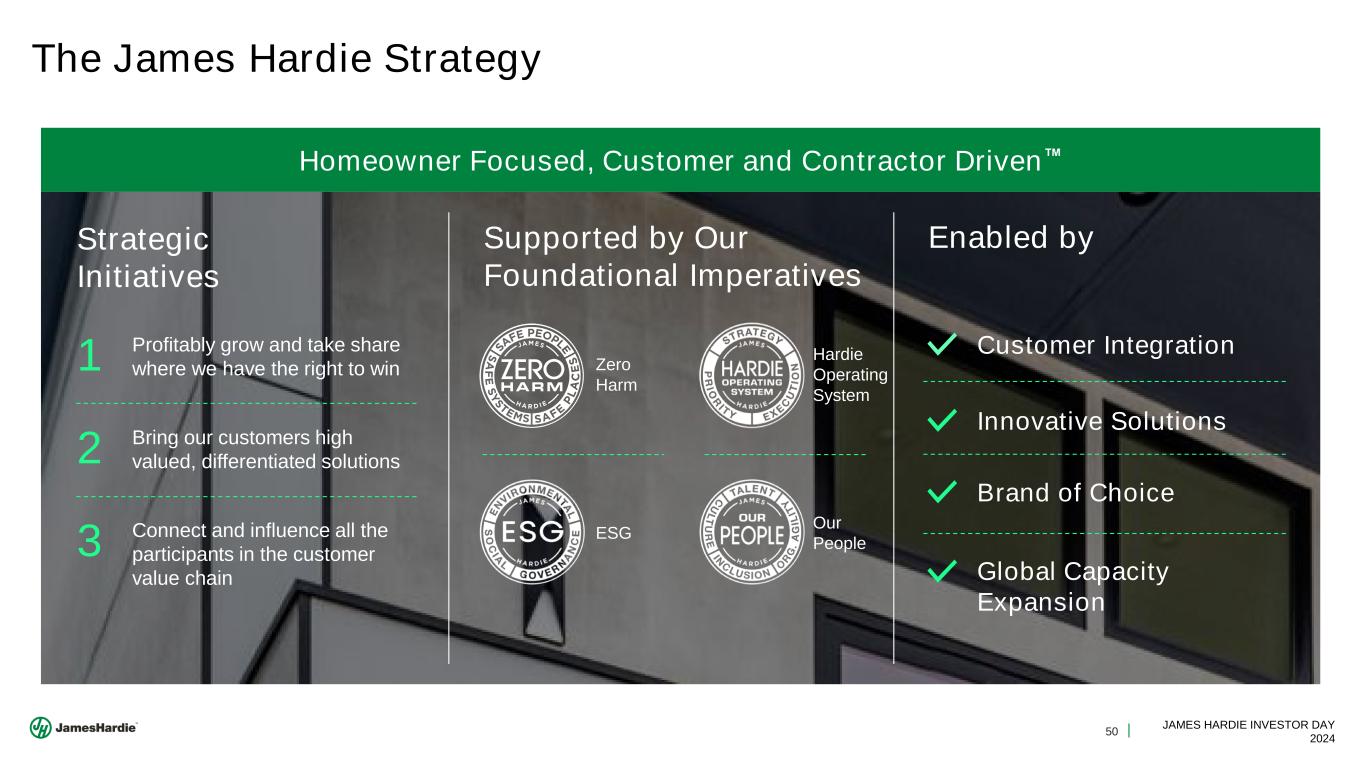
50 JAMES HARDIE INVESTOR DAY 2024 The James Hardie Strategy Homeowner Focused, Customer and Contractor Driven Strategic Initiatives 1 Profitably grow and take share where we have the right to win 2 Bring our customers high valued, differentiated solutions 3 Connect and influence all the participants in the customer value chain Supported by Our Foundational Imperatives Zero Harm Hardie Operating System ESG Our People Enabled by Customer Integration Innovative Solutions Brand of Choice Global Capacity Expansion
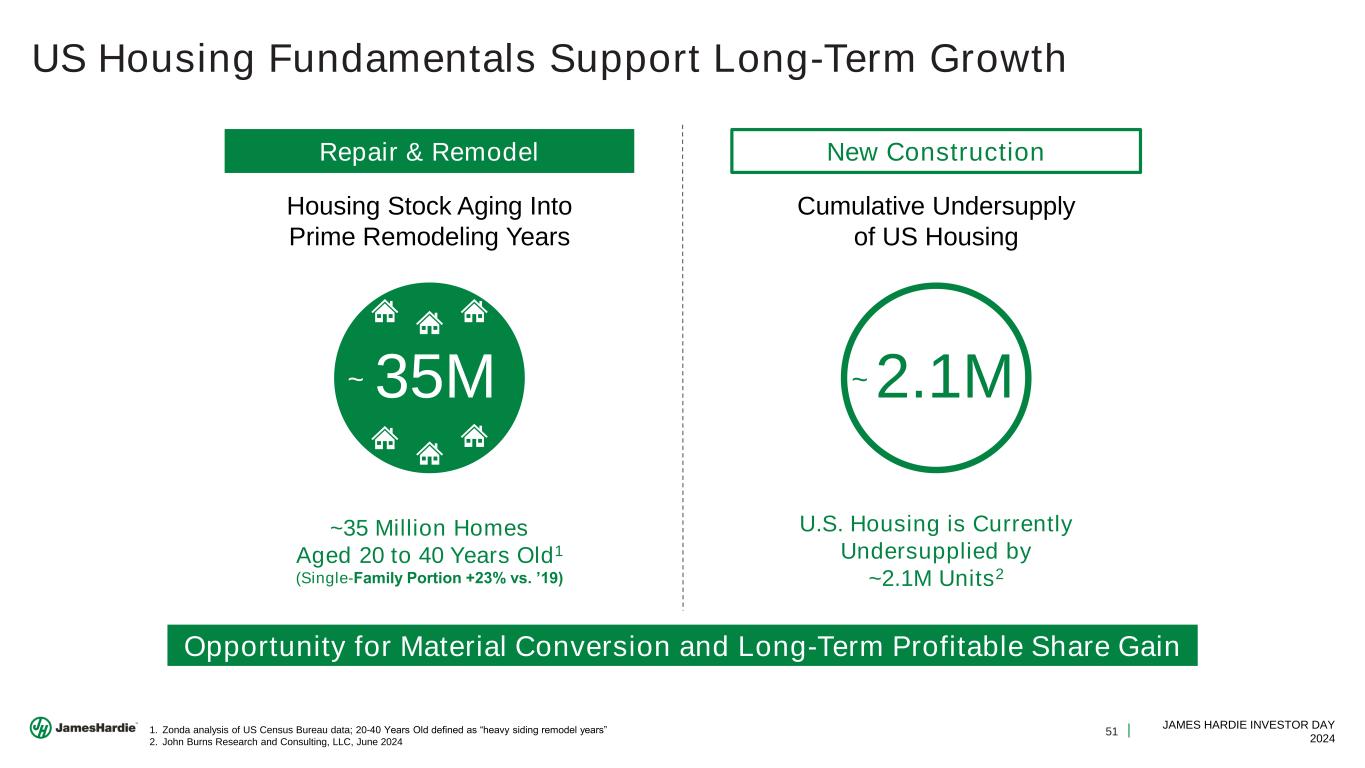
51 JAMES HARDIE INVESTOR DAY 2024 US Housing Fundamentals Support Long-Term Growth 1. Zonda analysis of US Census Bureau data; 20-40 Years Old defined as “heavy siding remodel years” 2. John Burns Research and Consulting, LLC, June 2024 Opportunity for Material Conversion and Long-Term Profitable Share Gain ~35 Million Homes Aged 20 to 40 Years Old1 (Single-Family Portion +23% vs. ’19) Housing Stock Aging Into Prime Remodeling Years 35M~ U.S. Housing is Currently Undersupplied by ~2.1M Units2 Cumulative Undersupply of US Housing 2.1M~ Repair & Remodel New Construction
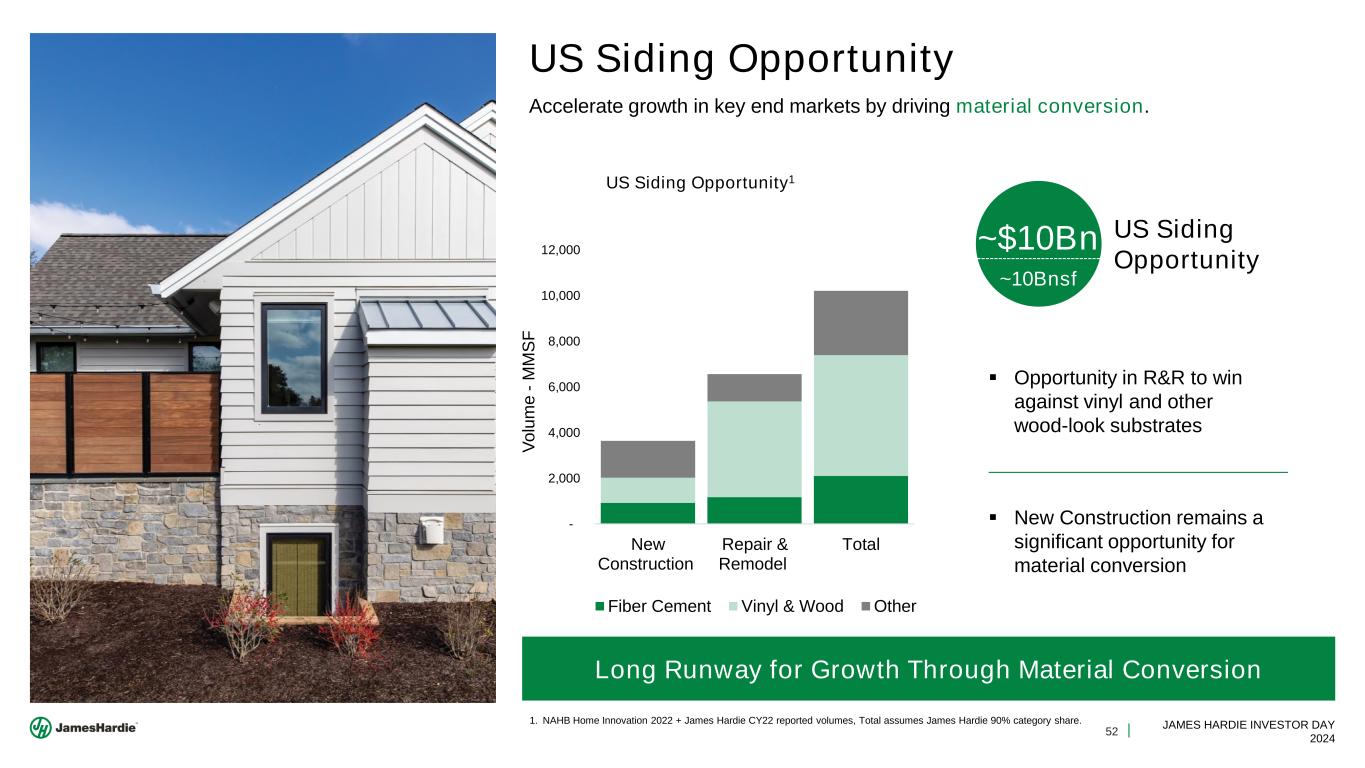
52 JAMES HARDIE INVESTOR DAY 2024 - 2,000 4,000 6,000 8,000 10,000 12,000 New Construction Repair & Remodel Total V o lu m e - M M S F US Siding Opportunity1 Fiber Cement Vinyl & Wood Other Long Runway for Growth Through Material Conversion US Siding Opportunity 1. NAHB Home Innovation 2022 + James Hardie CY22 reported volumes, Total assumes James Hardie 90% category share. ▪ Opportunity in R&R to win against vinyl and other wood-look substrates ▪ New Construction remains a significant opportunity for material conversion US Siding Opportunity ~$10Bn ~10Bnsf Accelerate growth in key end markets by driving material conversion.
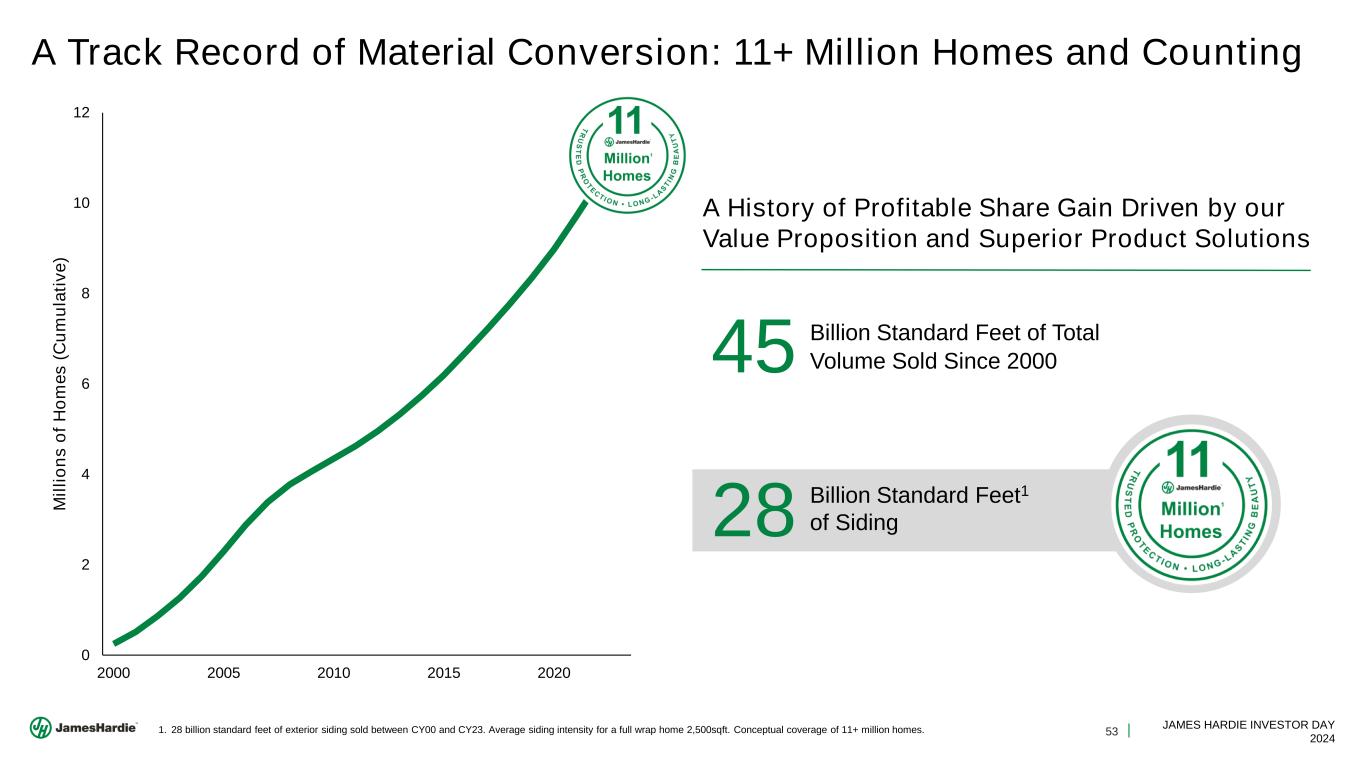
53 JAMES HARDIE INVESTOR DAY 2024 A Track Record of Material Conversion: 11+ Million Homes and Counting 0 2 4 6 8 10 12 2000 2005 2010 2015 2020 M il li o n s o f H o m e s ( C u m u la ti v e ) 1. 28 billion standard feet of exterior siding sold between CY00 and CY23. Average siding intensity for a full wrap home 2,500sqft. Conceptual coverage of 11+ million homes. A History of Profitable Share Gain Driven by our Value Proposition and Superior Product Solutions 45 Billion Standard Feet of Total Volume Sold Since 2000 28 Billion Standard Feet1 of Siding
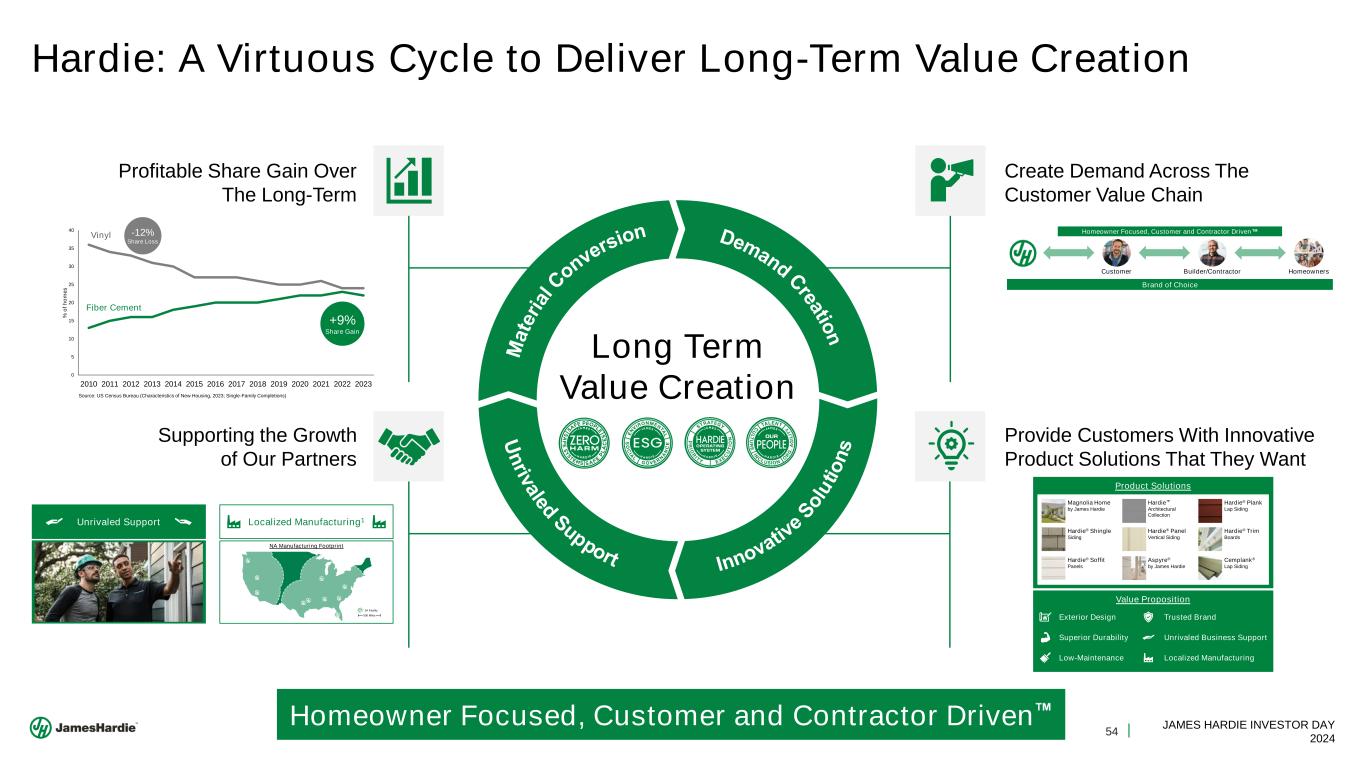
54 JAMES HARDIE INVESTOR DAY 2024 Hardie: A Virtuous Cycle to Deliver Long-Term Value Creation Demand C reatio n M a te ri al C onversion Long Term Value Creation Profitable Share Gain Over The Long-Term Supporting the Growth of Our Partners Create Demand Across The Customer Value Chain Provide Customers With Innovative Product Solutions That They Want Brand of Choice Customer Builder/Contractor Homeowners Homeowner Focused, Customer and Contractor Driven Texas Tough S p o n s o rs h ip s C a u s e M a rk e ti n g H o m e o w n e r M a rk e ti n g T ra d e M a rk e ti n g L o c a l M a rk e ti n g R et a il ▪ Customer Integration – CPFR ✓ Right Products, Right Place, Right Time ▪ Dream Builder ✓ Interactive, In-Person Events ▪ Contractor Alliance Program ✓ Lead sharing, Dedicated Support and Co-Branding Unrivaled Support Localized Manufacturing1 ▪ Close Proximity to Our Customers ✓ 67% of Product Deliveries Are Within 500 miles of our Plants ▪ Efficient Supply Chains ✓ 81% of Raw Materials Sourced Within 150 Miles of our Plants ▪ Investing in, and Supporting Our Communities ✓ Contributed $1.85bn In Economic Value in Communities Where we Operate NA Manufacturing Footprint 500 Miles JH Facility Homeowner Focused, Customer and Contractor Driven U n riv aled Support Innovativ e S o lu ti o n s Exterior Design Superior Durability Low-Maintenance Trusted Brand Unrivaled Business Support Localized Manufacturing Product Solutions Magnolia Home by James Hardie Hardie® Shingle Siding Hardie® Soffit Panels Hardie Architectural Collection Aspyre® by James Hardie Hardie® Trim Boards Cemplank® Lap Siding Hardie® Panel Vertical Siding Hardie® Plank Lap Siding Value Proposition Material Share of Primary Cladding Source: US Census Bureau (Characteristics of New Housing, 2023; Single-Family Completions) 0 5 10 15 20 25 30 35 40 2010 2011 2012 2013 2014 2015 2016 2017 2018 2019 2020 2021 2022 2023 % o f h o m e s +9% Share Gain Vinyl Fiber Cement -12% Share Loss
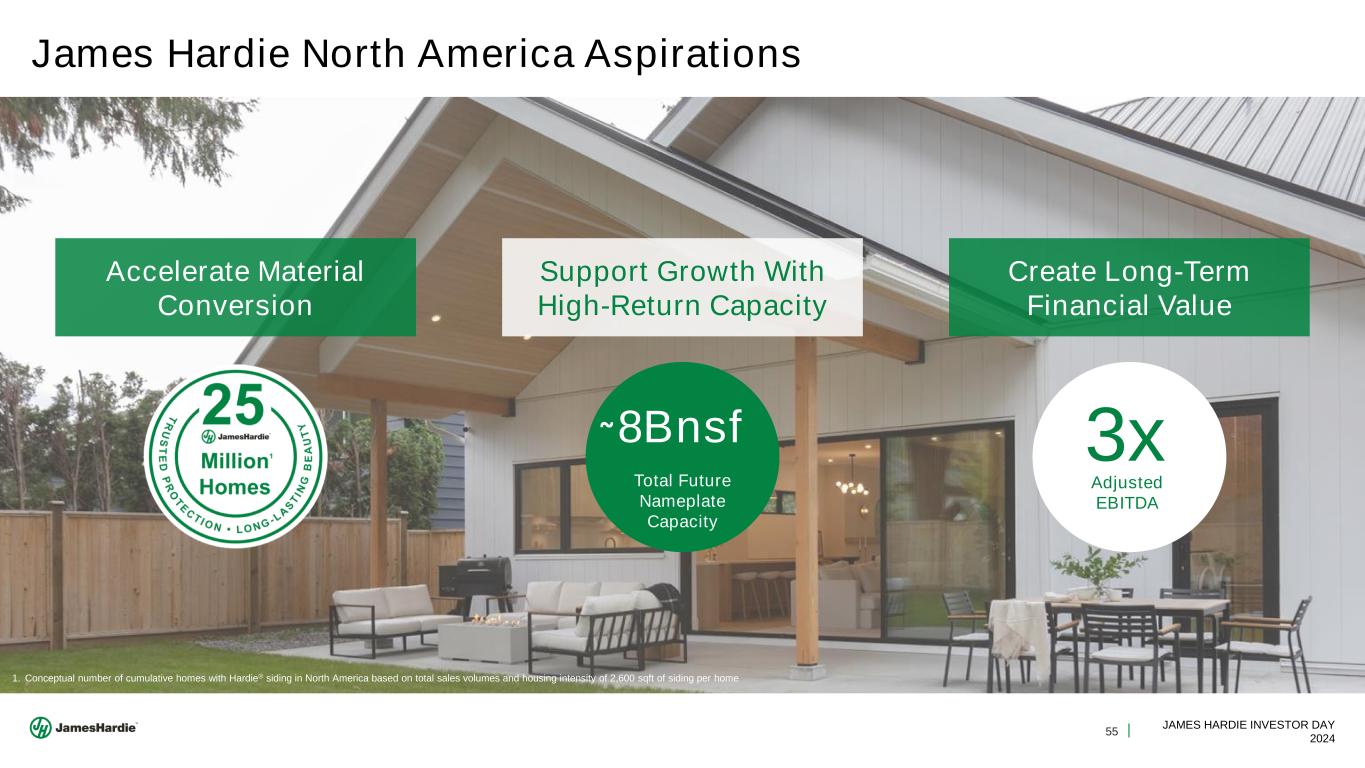
55 JAMES HARDIE INVESTOR DAY 2024 James Hardie North America Aspirations 1. Conceptual number of cumulative homes with Hardie® siding in North America based on total sales volumes and housing intensity of 2,600 sqft of siding per home Accelerate Material Conversion Support Growth With High-Return Capacity Create Long-Term Financial Value 1 8Bnsf Total Future Nameplate Capacity 3x Adjusted EBITDA ~
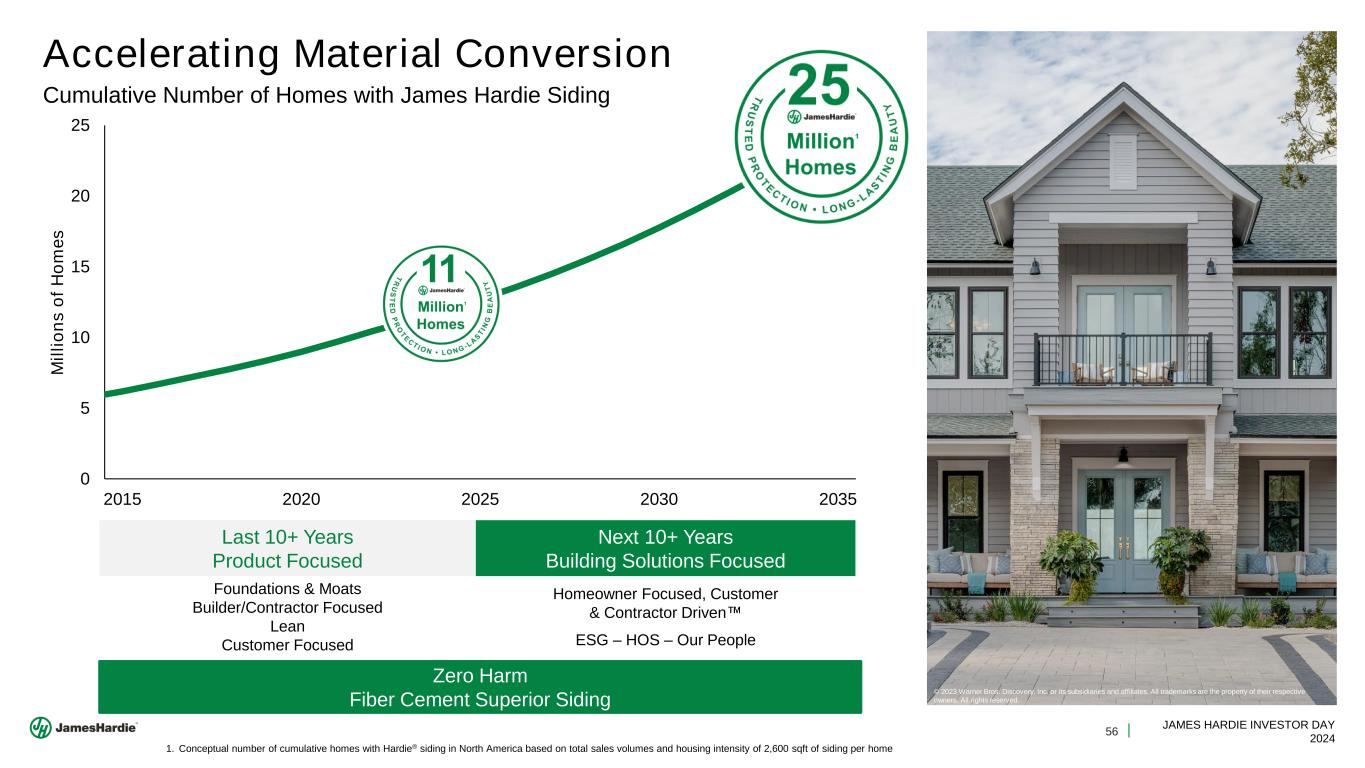
56 JAMES HARDIE INVESTOR DAY 2024 Foundations & Moats Builder/Contractor Focused Lean Customer Focused Homeowner Focused, Customer & Contractor Driven ESG – HOS – Our People Accelerating Material Conversion Last 10+ Years Product Focused Next 10+ Years Building Solutions Focused Zero Harm Fiber Cement Superior Siding Cumulative Number of Homes with James Hardie Siding 0 5 10 15 20 25 2015 2020 2025 2030 2035 M il li o n s o f H o m e s © 2023 Warner Bros. Discovery, Inc. or its subsidiaries and affiliates. All trademarks are the property of their respective owners. All rights reserved. 1. Conceptual number of cumulative homes with Hardie® siding in North America based on total sales volumes and housing intensity of 2,600 sqft of siding per home

57 JAMES HARDIE INVESTOR DAY 2024 Support Growth With High-Return Capacity Implies Approx. +10 Sheet Machines (inclusive of ~6 sheet machines already approved to proceed by the Board of Directors1) To Meet 25 Million Homes by 2035 Conceptual Investment ▪ Cost of One Sheet Machine: ~$250M ▪ Cost of Ten Sheet Machines: ~$2.5Bn2 ▪ Capacity Adds are Consistent With Achieving LTI Targets for Return on Capital Employed Driven by: ▪ Brown and Greenfield capacity additions • Scale creates capital & resource efficiency ▪ HOS improvements • Increased capacity through network wide gains in Overall Equipment Efficiency (RTY, Hours, Rate) 8Bnsf 1. See slide 31 for details on recently approved capacity additions. Management estimates the average nameplate capacity of a sheet machine to be ~300 mmsf. The calculated annual nameplate capacity is based on management’s historical experience with our production process and is calculated assuming continuous operation, 24 hours per day, seven days per week, producing 5/16” medium density product at a targeted operating speed. No accepted industry standard exists for the calculation of our fiber cement, manufacturing facility nameplate, design and utilization capacities. 2. In 2024 US$ Total Nameplate Capacity Needed ~
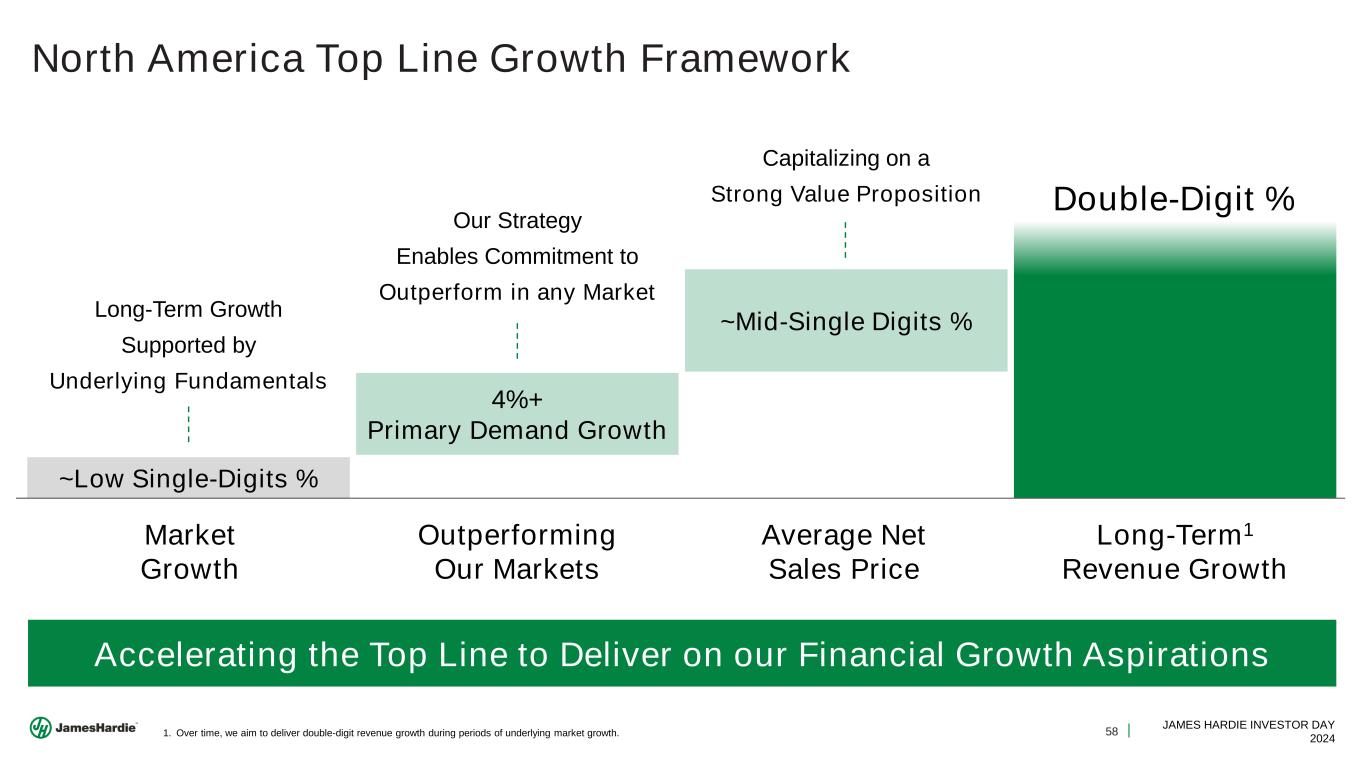
58 JAMES HARDIE INVESTOR DAY 2024 North America Top Line Growth Framework Market Growth Outperforming Our Markets Average Net Sales Price Long-Term1 Revenue Growth 1. Over time, we aim to deliver double-digit revenue growth during periods of underlying market growth. Long-Term Growth Supported by Underlying Fundamentals Our Strategy Enables Commitment to Outperform in any Market Capitalizing on a Strong Value Proposition ~Low Single-Digits % 4%+ Primary Demand Growth ~Mid-Single Digits % Accelerating the Top Line to Deliver on our Financial Growth Aspirations Double-Digit %

59 JAMES HARDIE INVESTOR DAY 2024 North America Margin Expansion Delivering Strong Margins in Our FY25 Outlook: ▪ Raw Material Pressure ▪ Scaling for Growth Expanding Margins over the Long-Term ▪ Unique Value Proposition ▪ Innovative Product Solutions ▪ Operating Leverage ▪ HOS Savings Managing the Risks to Profitability ▪ Inflation Beyond our Assumptions ▪ Market Volatility 29-31% ~35% 15% 20% 25% 30% 35% FY19 FY20 FY21 FY22 FY23 FY24 FY25 Guide Long-Term Aspiration North American Adjusted EBIT Margins
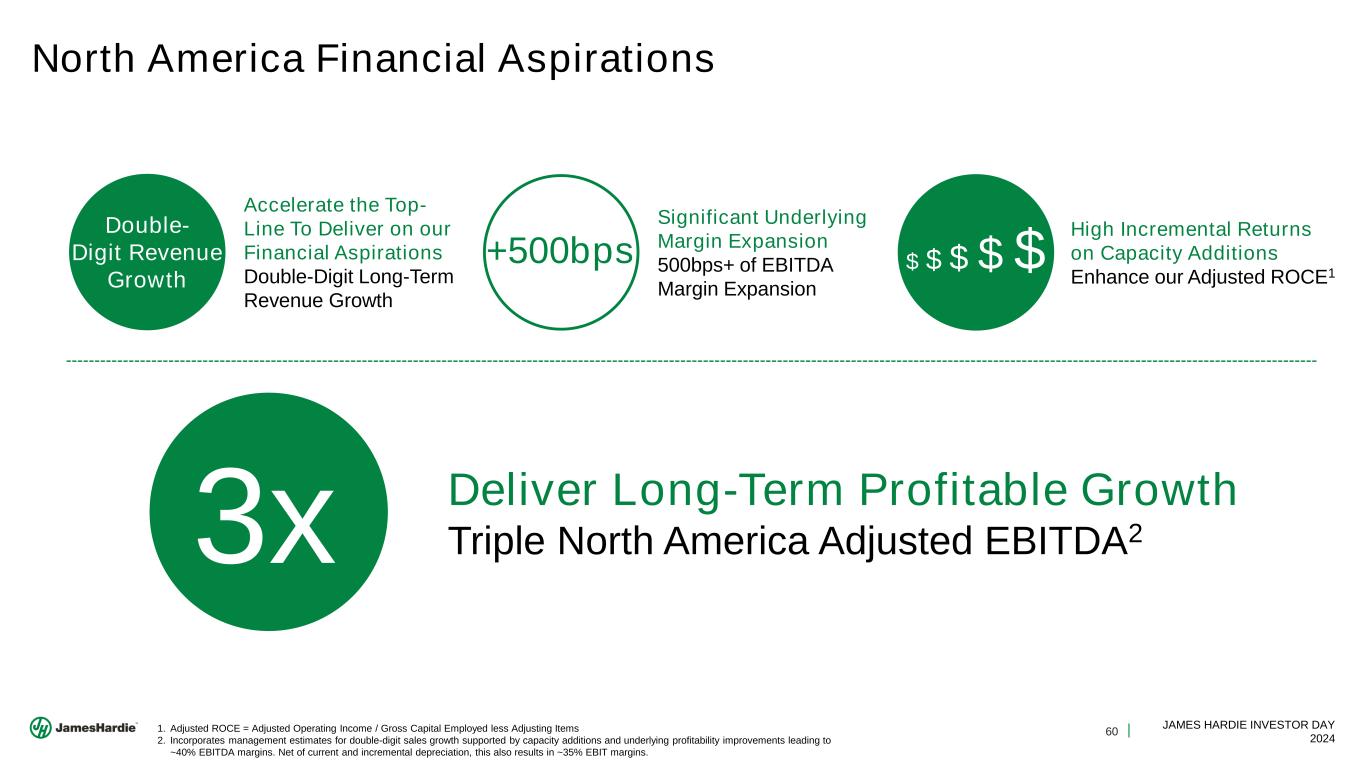
60 JAMES HARDIE INVESTOR DAY 2024 North America Financial Aspirations Significant Underlying Margin Expansion 500bps+ of EBITDA Margin Expansion 1. Adjusted ROCE = Adjusted Operating Income / Gross Capital Employed less Adjusting Items 2. Incorporates management estimates for double-digit sales growth supported by capacity additions and underlying profitability improvements leading to ~40% EBITDA margins. Net of current and incremental depreciation, this also results in ~35% EBIT margins. $ $ $ $ $+500bps Deliver Long-Term Profitable Growth Triple North America Adjusted EBITDA23x High Incremental Returns on Capacity Additions Enhance our Adjusted ROCE1 Accelerate the Top- Line To Deliver on our Financial Aspirations Double-Digit Long-Term Revenue Growth Double- Digit Revenue Growth
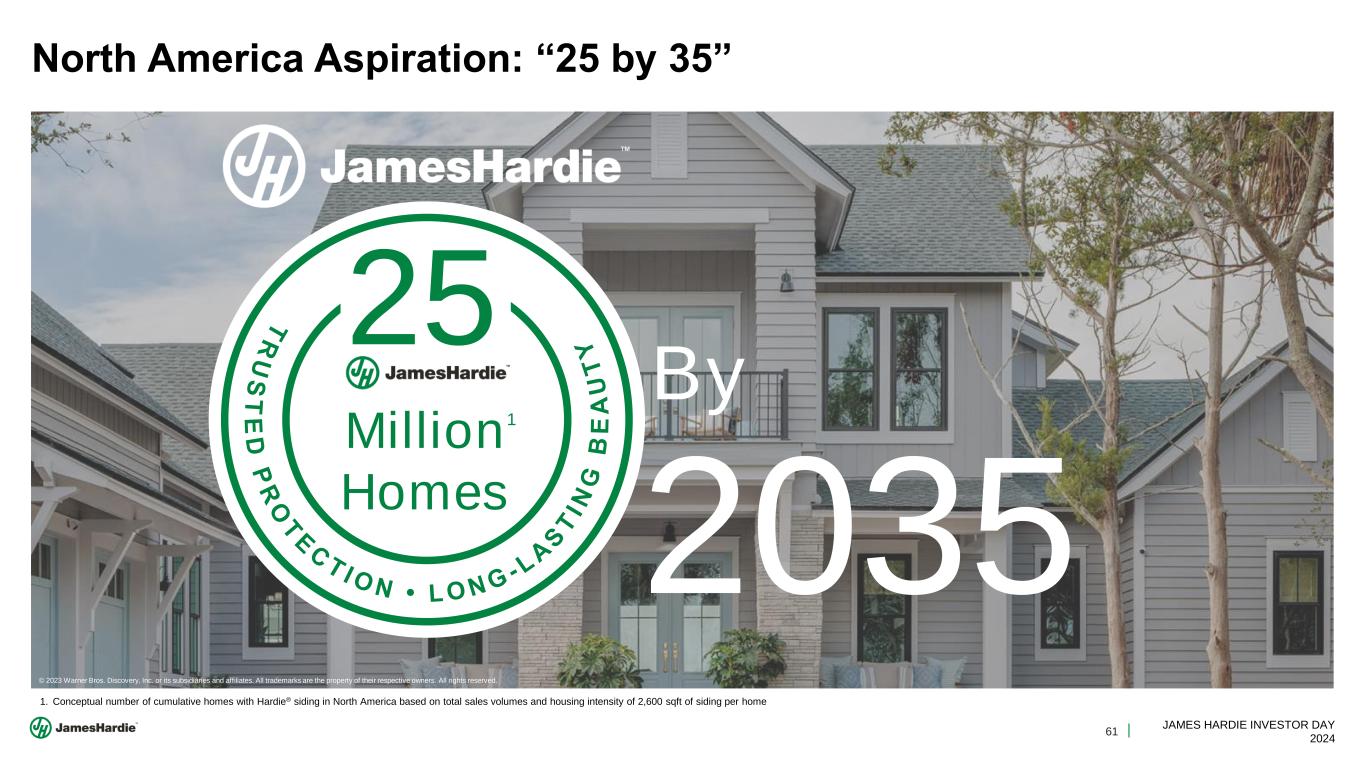
61 JAMES HARDIE INVESTOR DAY 2024 T R U S T E D P R O T E C T I O N • L O N G - L A S T I N G B E A U T Y North America Aspiration: “25 by 35” By 2035 1. Conceptual number of cumulative homes with Hardie® siding in North America based on total sales volumes and housing intensity of 2,600 sqft of siding per home 2 5 Million Homes 1 © 2023 Warner Bros. Discovery, Inc. or its subsidiaries and affiliates. All trademarks are the property of their respective owners. All rights reserved.
62 JAMES HARDIE INVESTOR DAY 2024 Q&A AARON ERTER CHIEF EXECUTIVE OFFICER
63 JAMES HARDIE INVESTOR DAY 2024 Thank You!
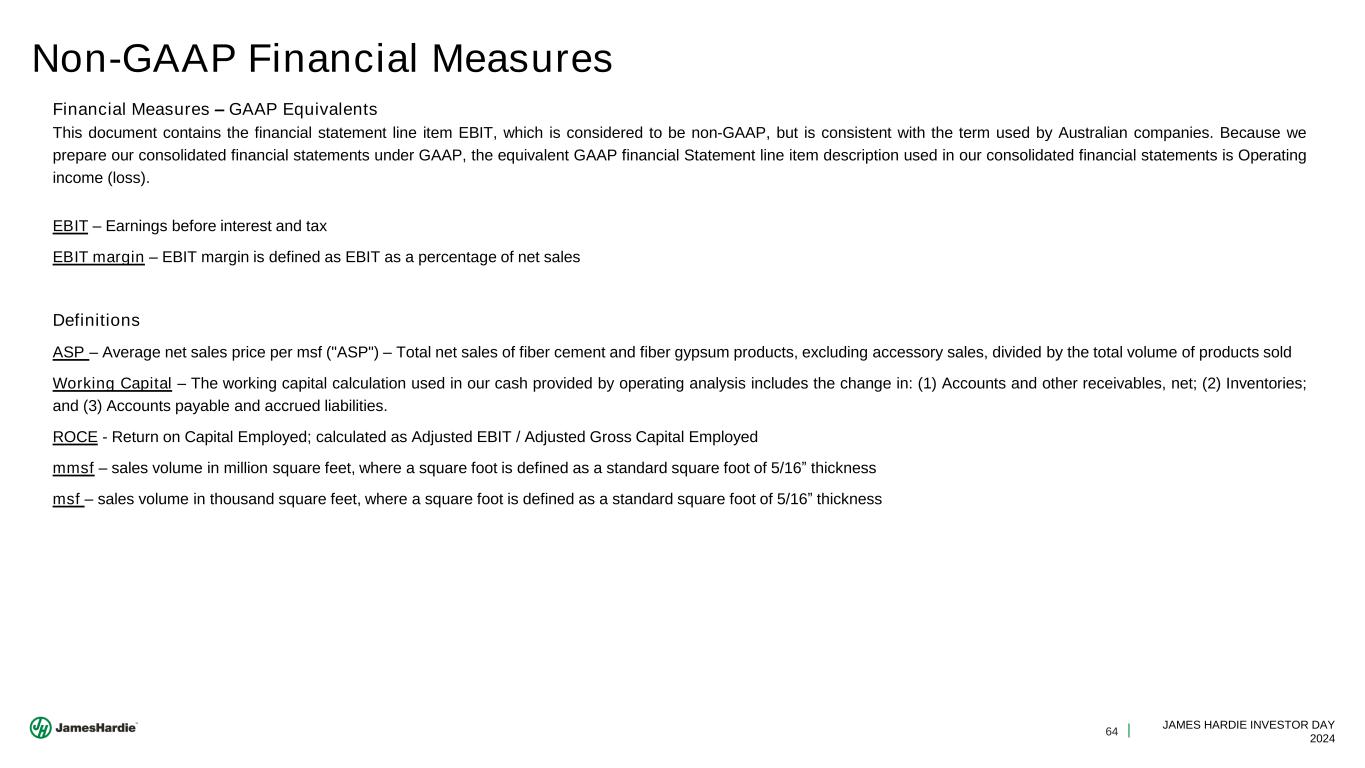
64 JAMES HARDIE INVESTOR DAY 2024 Non-GAAP Financial Measures Financial Measures – GAAP Equivalents This document contains the financial statement line item EBIT, which is considered to be non-GAAP, but is consistent with the term used by Australian companies. Because we prepare our consolidated financial statements under GAAP, the equivalent GAAP financial Statement line item description used in our consolidated financial statements is Operating income (loss). EBIT – Earnings before interest and tax EBIT margin – EBIT margin is defined as EBIT as a percentage of net sales Definitions ASP – Average net sales price per msf ("ASP") – Total net sales of fiber cement and fiber gypsum products, excluding accessory sales, divided by the total volume of products sold Working Capital – The working capital calculation used in our cash provided by operating analysis includes the change in: (1) Accounts and other receivables, net; (2) Inventories; and (3) Accounts payable and accrued liabilities. ROCE - Return on Capital Employed; calculated as Adjusted EBIT / Adjusted Gross Capital Employed mmsf – sales volume in million square feet, where a square foot is defined as a standard square foot of 5/16” thickness msf – sales volume in thousand square feet, where a square foot is defined as a standard square foot of 5/16” thickness
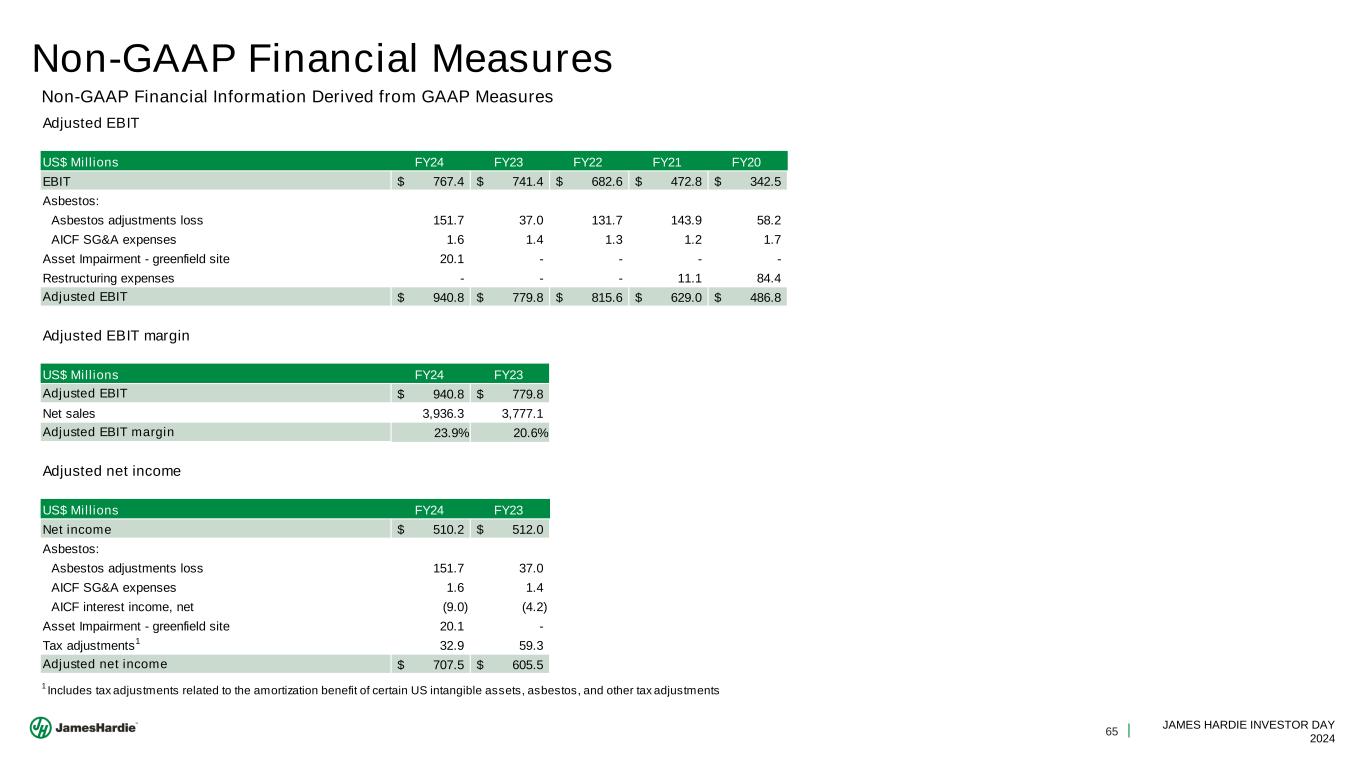
65 JAMES HARDIE INVESTOR DAY 2024 Non-GAAP Financial Measures Adjusted EBIT US$ Millions FY24 FY23 FY22 FY21 FY20 EBIT 767.4$ 741.4$ 682.6$ 472.8$ 342.5$ Asbestos: Asbestos adjustments loss 151.7 37.0 131.7 143.9 58.2 AICF SG&A expenses 1.6 1.4 1.3 1.2 1.7 Asset Impairment - greenfield site 20.1 - - - - Restructuring expenses - - - 11.1 84.4 Adjusted EBIT 940.8$ 779.8$ 815.6$ 629.0$ 486.8$ Adjusted EBIT margin US$ Millions FY24 FY23 Adjusted EBIT 940.8$ 779.8$ Net sales 3,936.3 3,777.1 Adjusted EBIT margin 23.9% 20.6% Adjusted net income US$ Millions FY24 FY23 Net income 510.2$ 512.0$ Asbestos: Asbestos adjustments loss 151.7 37.0 AICF SG&A expenses 1.6 1.4 AICF interest income, net (9.0) (4.2) Asset Impairment - greenfield site 20.1 - Tax adjustments1 32.9 59.3 Adjusted net income 707.5$ 605.5$ 1 Includes tax adjustments related to the amortization benefit of certain US intangible assets, asbestos, and other tax adjustments Non-GAAP Financial Information Derived from GAAP Measures
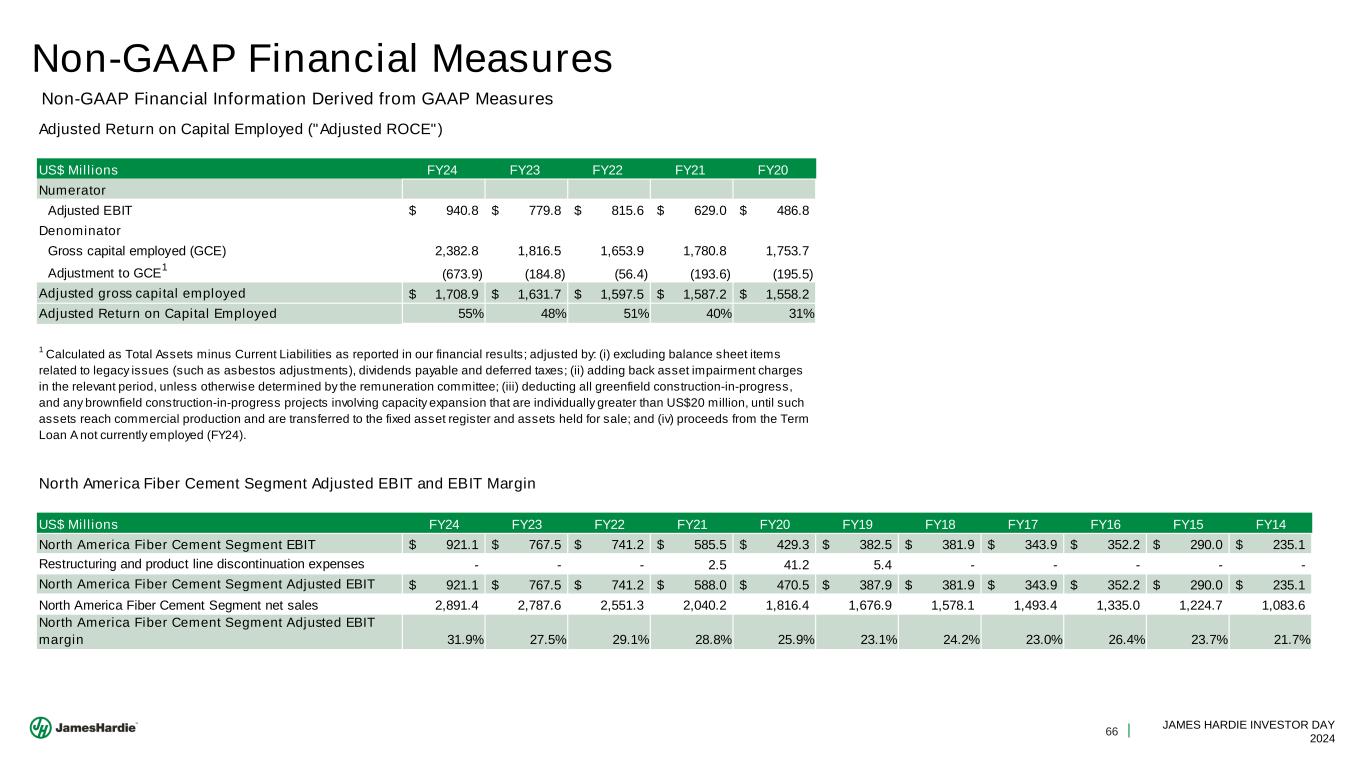
66 JAMES HARDIE INVESTOR DAY 2024 Non-GAAP Financial Measures Adjusted Return on Capital Employed ("Adjusted ROCE") US$ Millions FY24 FY23 FY22 FY21 FY20 Numerator Adjusted EBIT 940.8$ 779.8$ 815.6$ 629.0$ 486.8$ Denominator Gross capital employed (GCE) 2,382.8 1,816.5 1,653.9 1,780.8 1,753.7 Adjustment to GCE 1 (673.9) (184.8) (56.4) (193.6) (195.5) Adjusted gross capital employed 1,708.9$ 1,631.7$ 1,597.5$ 1,587.2$ 1,558.2$ Adjusted Return on Capital Employed 55% 48% 51% 40% 31% US$ Millions FY24 FY23 FY22 FY21 FY20 FY19 FY18 FY17 FY16 FY15 FY14 North America Fiber Cement Segment EBIT 921.1$ 767.5$ 741.2$ 585.5$ 429.3$ 382.5$ 381.9$ 343.9$ 352.2$ 290.0$ 235.1$ Restructuring and product line discontinuation expenses - - - 2.5 41.2 5.4 - - - - - North America Fiber Cement Segment Adjusted EBIT 921.1$ 767.5$ 741.2$ 588.0$ 470.5$ 387.9$ 381.9$ 343.9$ 352.2$ 290.0$ 235.1$ North America Fiber Cement Segment net sales 2,891.4 2,787.6 2,551.3 2,040.2 1,816.4 1,676.9 1,578.1 1,493.4 1,335.0 1,224.7 1,083.6 North America Fiber Cement Segment Adjusted EBIT margin 31.9% 27.5% 29.1% 28.8% 25.9% 23.1% 24.2% 23.0% 26.4% 23.7% 21.7% North America Fiber Cement Segment Adjusted EBIT and EBIT Margin 1 Calculated as Total Assets minus Current Liabilities as reported in our financial results; adjusted by: (i) excluding balance sheet items related to legacy issues (such as asbestos adjustments), dividends payable and deferred taxes; (ii) adding back asset impairment charges in the relevant period, unless otherwise determined by the remuneration committee; (iii) deducting all greenfield construction-in-progress, and any brownfield construction-in-progress projects involving capacity expansion that are individually greater than US$20 million, until such assets reach commercial production and are transferred to the fixed asset register and assets held for sale; and (iv) proceeds from the Term Loan A not currently employed (FY24). Non-GAAP Financial Information Derived from GAAP Measures