
1 Q4 FY25 EARNINGS PRESENTATION Fourth Quarter FY25 Earnings Presentation T U E S D AY, M AY 2 0 T H C H I C A G O | D U B L I N W E D N E S D AY, M AY 2 1 S T S Y D N E Y
2 Q4 FY25 EARNINGS PRESENTATION Cautionary Disclosure Regarding Forward-Looking Statements Statements in this communication, including statements regarding the proposed acquisition of The AZEK Company Inc. (“AZEK”) by James Hardie Industries plc (“JHX”), that are not historical facts are “forward-looking statements” within the meaning of Section 27A of the Securities Act of 1933, as amended, and Rule 175 promulgated thereunder, and Section 21E of the Securities Exchange Act of 1934, as amended, and Rule 3b-6 promulgated thereunder, which statements involve inherent risks and uncertainties and are made pursuant to the safe harbor provisions of the Private Securities Litigation Reform Act of 1995. Examples of forward-looking statements include statements about the anticipated benefits of the proposed transaction between JHX and AZEK (the “Transaction”), including estimated synergies, and the expected timing of completion of the Transaction; statements about the Company’s future performance; and statements regarding the Company’s plans, objectives or goals. Words such as “believe,” “anticipate,” “plan,” “expect,” “intend,” “target,” “estimate,” “project,” “predict,” “trend,” “forecast,” “guideline,” “aim,” “objective,” “will,” “should,” “could,” “likely,” “continue,” “may,” “objective,” “outlook” and similar expressions may identify forward-looking statements but are not the exclusive means of identifying such statements. Investors are cautioned not to place undue reliance on forward looking statements. Forward-looking statements of JHX and AZEK, respectively, are based on the current expectations, estimates and assumptions of JHX and AZEK, respectively, and, because forward-looking statements address future results, events and conditions, they, by their very nature, involve inherent risks and uncertainties, many of which are unforeseeable and beyond the control of JHX or AZEK. Such known and unknown risks, uncertainties and other factors may cause actual results, performance or other achievements to differ materially from the anticipated results, performance or achievements expressed, projected or implied by forward-looking statements. These factors include risks and uncertainties relating to the Transaction, including, but not limited to, the possibility that required regulatory approvals for the Transaction or approval of the Transaction by AZEK’s stockholders and other conditions to closing are not received or satisfied on a timely basis or at all; the possible occurrence of events that may give rise to a right of either or both of JHX and AZEK to terminate the merger agreement providing for the Transaction; possible negative effects of the announcement or the consummation of the Transaction on the market price of JHX’s and/or AZEK’s shares and/or on their respective businesses, financial conditions, results of operations and financial performance; uncertainties as to access to financing (including financing for the Transaction) on a timely basis and on reasonable terms; the impact of the additional indebtedness the Company would incur in connection with the Transaction; risks relating to the value of the JHX shares to be issued in the Transaction and the contemplated listing arrangements for JHX shares and depositary interests following the Transaction; risks relating to significant transaction costs and/or unknown liabilities; the possibility that the anticipated synergies and other benefits from the Transaction cannot be realized in full or at all or may take longer to realize than expected; risks associated with contracts containing consent and/or other provisions that may be triggered by the Transaction; risks associated with Transaction-related litigation; the possibility that costs or difficulties related to the integration of JHX’s and AZEK’s businesses will be greater than expected; the risk that the Transaction and its announcement could have an adverse effect on the parties’ relationships with its and their employees and other business partners, including suppliers and customers; the potential for the Transaction to divert the time and attention of management from ongoing business operations; the potential for contractual restrictions under the merger agreement providing for the Transaction to adversely affect the parties’ ability to pursue other business opportunities or strategic transactions; the risk of other Transaction related disruptions to the businesses, including business plans and operations, of JHX and AZEK; and the possibility that, as a result of the Transaction or otherwise, JHX could lose its foreign private issuer status and be required to bear the costs and expenses related to full compliance with rules and regulations that apply to U.S. domestic issuers. There can be no assurance that the Transaction will in fact be consummated in the manner described or at all. Additional important factors relating to JHX that could cause actual results to differ materially from those reflected in forward-looking statements include, but are not limited to, the risks and uncertainties described in Section 3 “Risk Factors” in JHX’s Annual Report on Form 20-F for the fiscal year ended March 31, 2025 (the “JHX 2025 Annual Report”); changes in general economic, political, governmental and business conditions globally and in the countries in which JHX does business; changes in interest rates; changes in inflation rates; changes in exchange rates; the level of construction generally; changes in cement demand and prices; changes in raw material and energy prices; and changes in business strategy. These factors are not necessarily all of the factors that could cause JHX’s, AZEK’s or the combined company’s actual results, performance or achievements to differ materially from those expressed in or implied by any of the forward-looking statements. Other factors, including unknown or unpredictable factors, could also harm JHX’s, AZEK’s or the combined company’s results. The foregoing discussion of risks and uncertainties is not exhaustive; other risks and uncertainties may cause actual results to differ materially from those referenced in any forward looking statements. All forward-looking statements attributable to JHX, AZEK or the combined company, or persons acting on JHX’s or AZEK’s behalf, are expressly qualified in their entirety by the cautionary statements set forth above. Forward looking statements in this communication speak only as of the date of this communication and are statements of then current expectations concerning future results, events and conditions. Neither JHX nor AZEK assumes any obligation to update any forward looking statements or information except as required by law. If JHX or AZEK updates one or more forward-looking statements, no inference should be drawn that JHX or AZEK will make additional updates with respect to those or other forward-looking statements. Further information regarding JHX, AZEK and factors that could affect the forward-looking statements contained herein can be found in JHX’s Annual Report on Form 20-F for the fiscal year ended March 31, 2025, and in its other documents filed or furnished with the U.S. Securities and Exchange Commission (“SEC”), and in AZEK’s Annual Report on Form 10-K for the fiscal year ended September 30, 2024, and in its other documents filed or furnished with the SEC. Investor Contact Joe Ahlersmeyer, CFA Vice President, Investor Relations [email protected] Important Information and Where to Find It In connection with the proposed transaction between JHX and AZEK, JHX has filed with the SEC a registration statement on Form F-4 (SEC File No. 333-286977). The registration statement includes a preliminary proxy statement/prospectus, which is a preliminary proxy statement of AZEK that also serves as a preliminary prospectus of JHX, and each party will file other documents regarding the proposed transaction with the SEC. The registration statement has not been declared effective by the SEC. Investors and security holders are urged to read the proxy statement/prospectus and other relevant documents filed with the SEC when they become available, because they contain or will contain important information. The definitive proxy statement/prospectus will be sent to AZEK’s stockholders. Investors and security holders may obtain free copies of the registration statement and the proxy statement/prospectus and other documents that are filed or will be filed with the SEC by JHX or AZEK through the SEC’s website at https://www.sec.gov. Copies of documents filed with the SEC by JHX will be available from JHX free of charge on JHX’s website at ir.jameshardie.com.au or upon request submitted to JHX by e mail addressed to [email protected]. Copies of documents filed with the SEC by AZEK will be available from AZEK free of charge on AZEK’s website at investors.azekco.com or upon request submitted to AZEK by mail addressed to The AZEK Company Inc., Attention: Corporate Secretary, 1330 W Fulton Street #350, Chicago, Illinois 60607. The information included on, or accessible through, JHX’s or AZEK’s website is not incorporated by reference into this communication. Participants in the Solicitation JHX and certain of its directors, executive officers and other employees, and AZEK and its directors and certain of AZEK’s executive officers and other employees, may be deemed to be participants in the solicitation of proxies in connection with the proposed transaction. The preliminary proxy statement/prospectus filed with the SEC as part of the registration statement includes a description of participants’ direct or indirect interests, by security holdings or otherwise. Information about JHX’s directors and executive officers is contained in “Section 1—Directors, Senior Management and Employees” in JHX’s Annual Report on Form 20-F for the fiscal year ended March 31, 2025, filed with the SEC on May 20, 2025 and in other documents subsequently filed or furnished by JHX with the SEC. Information about AZEK’s directors and executive officers is contained in “Nominees for Director,” “Proposal No. 1—Election of Directors,” “Corporate Governance,” “Executive Officers,” “Compensation Discussion and Analysis,” “2024 CEO Pay Ratio Disclosure,” “Pay-Versus-Performance,” “Security Ownership of Certain Beneficial Owners and Management and Related Stockholder Matters” and “Related Person Transactions” in AZEK’s definitive proxy statement in connection with its 2025 annual meeting of stockholders, filed with the SEC on January 13, 2025; in AZEK’s Current Report on Form 8 K (Amendment No. 1) filed with the SEC on January 24, 2025; in the Form 3 and Form 4 statements of beneficial ownership and statements of changes in beneficial ownership filed with the SEC by AZEK’s directors and executive officers; and in other documents subsequently filed or furnished by AZEK with the SEC. Additional information regarding ownership of AZEK’s securities by its directors and executive officers is included in such persons’ SEC filings on Forms 3 and 4. The documents referenced above in this paragraph may be obtained free of charge as described above under the heading “Important Information and Where to Find It.” Additional information regarding the interests of participants in the solicitation of proxies in connection with the proposed transaction will be included in the proxy statement/prospectus and other relevant materials filed with the SEC when they become available. No Offer or Solicitation This communication is not intended to and shall not constitute an offer to sell or the solicitation of an offer to buy any securities, nor shall there be any sale of securities in any jurisdiction in which such offer, solicitation or sale would be unlawful prior to registration or qualification under the securities laws of any such jurisdiction. No offer of securities shall be made except by means of a prospectus meeting the requirements of Section 10 of the Securities Act of 1933, as amended. Non-GAAP Financial Measures This Earnings Presentation includes financial measures that are not considered a measure of financial performance under generally accepted accounting principles in the United States (GAAP). These financial measures are designed to provide investors with an alternative method for assessing our performance from on-going operations, capital efficiency and profit generation. Management uses these financial measures for the same purposes. These financial measures are or may be non- GAAP financial measures as defined in the rules of the U.S. Securities and Exchange Commission and may exclude or include amounts that are included or excluded, as applicable, in the calculation of the most directly comparable financial measures calculated in accordance with GAAP. These non-GAAP financial measures should not be considered to be more meaningful than the equivalent GAAP measure. Management has included such measures to provide investors with an alternative method for assessing its operating results in a manner that is focused on the performance of its ongoing operations and excludes the impact of certain legacy items, such as asbestos adjustments. Additionally, management uses such non-GAAP financial measures for the same purposes. However, these non-GAAP financial measures are not prepared in accordance with GAAP, may not be reported by all of the Company’s competitors and may not be directly comparable to similarly titled measures of the Company’s competitors due to potential differences in the exact method of calculation. For additional information regarding the non- GAAP financial measures presented in this Earnings Presentation, including a reconciliation of each non-GAAP financial measure to the equivalent GAAP measure, see slides titled “Non-GAAP Financial Measures” included in this Earnings Presentation. In addition, this Earnings Presentation includes financial measures and descriptions that are considered to not be in accordance with GAAP, but which are consistent with financial measures reported by Australian companies, such as EBIT and EBIT margin. Since the Company prepares its Consolidated Financial Statements in accordance with GAAP, the Company provides investors with definitions and a cross-reference from the non-GAAP financial measure used in this Earnings Presentation to the equivalent GAAP financial measure used in the Company’s Consolidated Financial Statements. See slides titled “Non-GAAP Financial Measures” included in this Earnings Presentation. All comparisons made are vs. the comparable period in the prior fiscal year and amounts presented are in US dollars, unless otherwise noted.
3 Q4 FY25 EARNINGS PRESENTATION Agenda Aaron Erter CHIEF EXECUTIVE OFFICER Rachel Wilson CHIEF FINANCIAL OFFICER 1 FY25 Review and FY26 Outlook 2 Progress Against Key North America Strategies 3 Core Business Overview and Long-Term Outlook 4 Creating A Leading Building Products Growth Platform 5 Q4 FY25 Financial Results & FY26 Guidance 6 Q&A
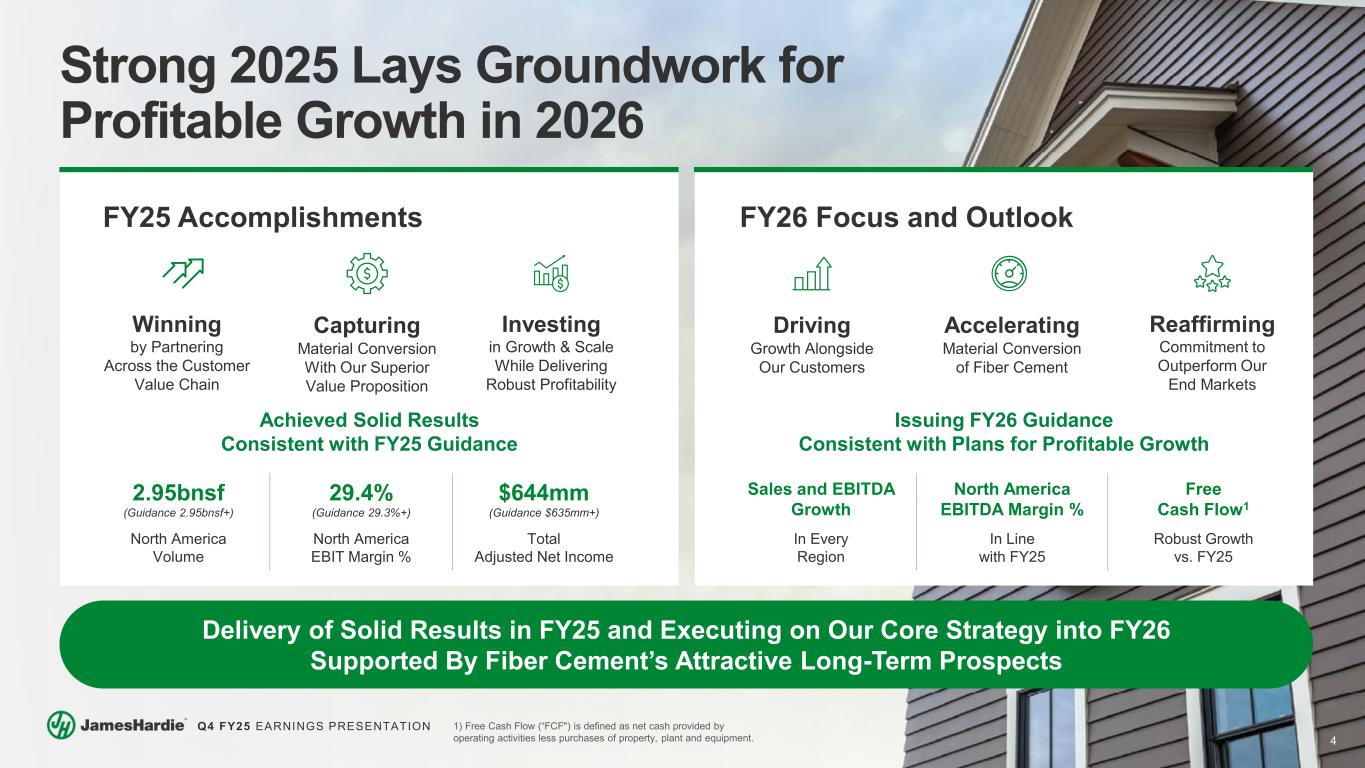
4 Q4 FY25 EARNINGS PRESENTATION Strong 2025 Lays Groundwork for Profitable Growth in 2026 Delivery of Solid Results in FY25 and Executing on Our Core Strategy into FY26 Supported By Fiber Cement’s Attractive Long-Term Prospects 1) Free Cash Flow (“FCF") is defined as net cash provided by operating activities less purchases of property, plant and equipment. FY25 Accomplishments Achieved Solid Results Consistent with FY25 Guidance FY26 Focus and Outlook Issuing FY26 Guidance Consistent with Plans for Profitable Growth 2.95bnsf (Guidance 2.95bnsf+) 29.4% (Guidance 29.3%+) $644mm (Guidance $635mm+) North America Volume North America EBIT Margin % Total Adjusted Net Income Capturing Material Conversion With Our Superior Value Proposition Winning by Partnering Across the Customer Value Chain Investing in Growth & Scale While Delivering Robust Profitability Sales and EBITDA Growth North America EBITDA Margin % Free Cash Flow1 In Every Region In Line with FY25 Robust Growth vs. FY25 Driving Growth Alongside Our Customers Accelerating Material Conversion of Fiber Cement Reaffirming Commitment to Outperform Our End Markets
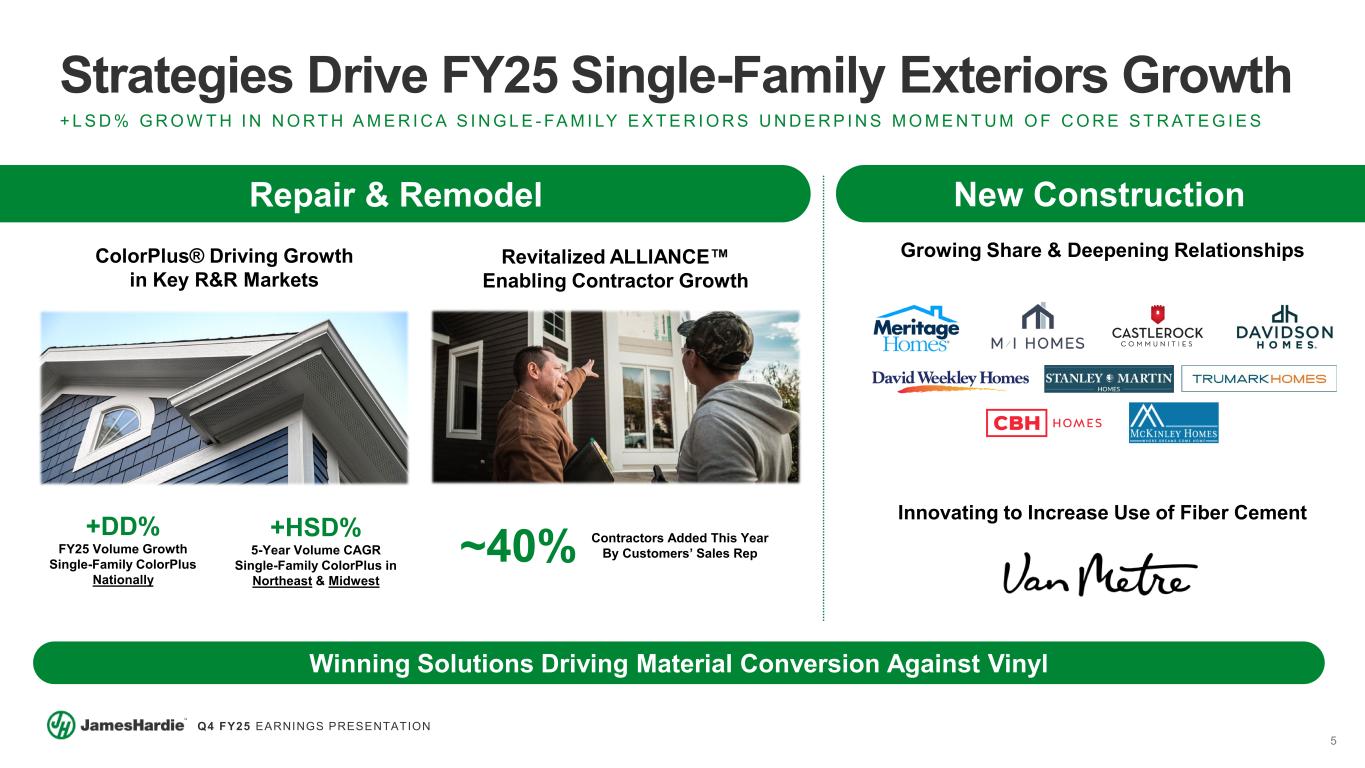
5 Q4 FY25 EARNINGS PRESENTATION Strategies Drive FY25 Single-Family Exteriors Growth + L S D % G R O W T H I N N O RT H A M E R I C A S I N G L E - FA M I LY E X T E R I O R S U N D E R P I N S M O M E N T U M O F C O R E S T R AT E G I E S ColorPlus® Driving Growth in Key R&R Markets Growing Share & Deepening Relationships Winning Solutions Driving Material Conversion Against Vinyl +DD% FY25 Volume Growth Single-Family ColorPlus Nationally +HSD% 5-Year Volume CAGR Single-Family ColorPlus in Northeast & Midwest New ConstructionRepair & Remodel Revitalized ALLIANCE Enabling Contractor Growth Contractors Added This Year By Customers’ Sales Rep~40% Innovating to Increase Use of Fiber Cement
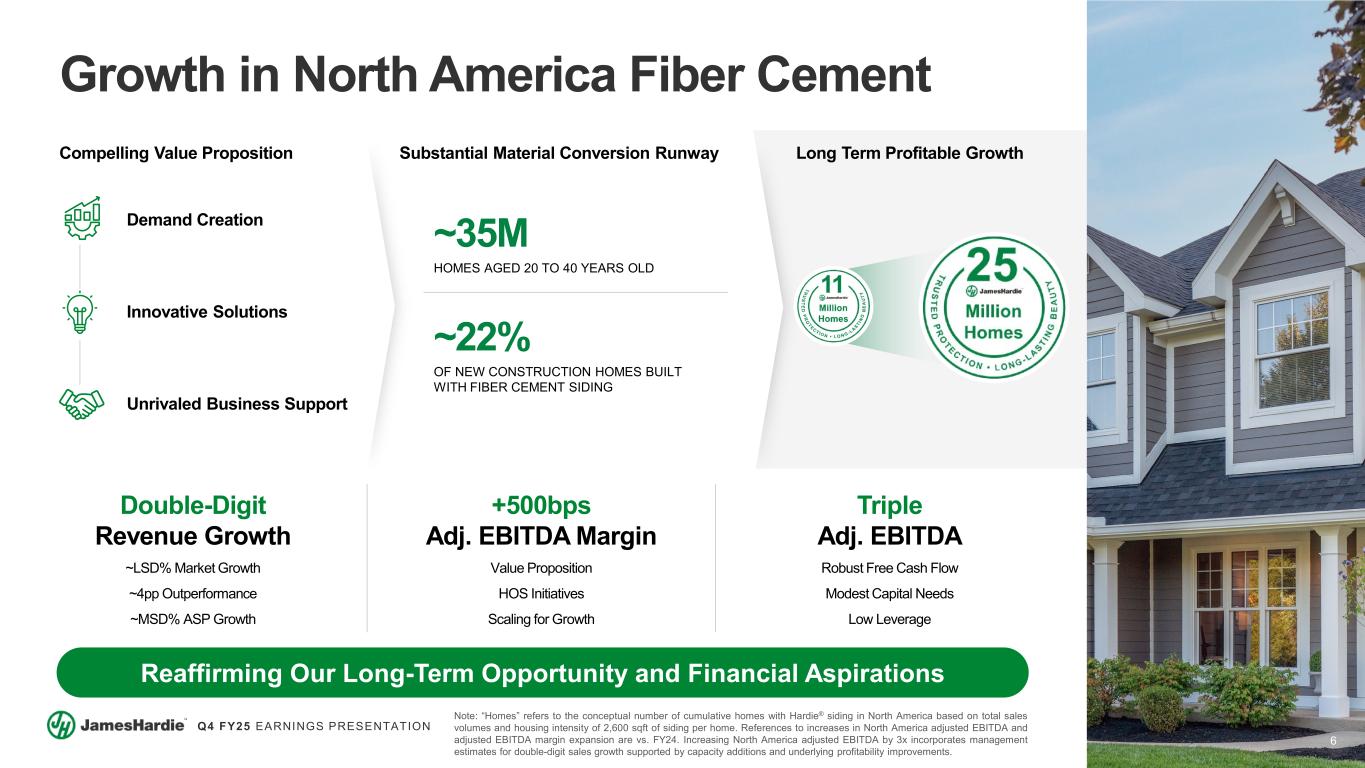
6 Q4 FY25 EARNINGS PRESENTATION Reaffirming Our Long-Term Opportunity and Financial Aspirations Growth in North America Fiber Cement Note: “Homes” refers to the conceptual number of cumulative homes with Hardie® siding in North America based on total sales volumes and housing intensity of 2,600 sqft of siding per home. References to increases in North America adjusted EBITDA and adjusted EBITDA margin expansion are vs. FY24. Increasing North America adjusted EBITDA by 3x incorporates management estimates for double-digit sales growth supported by capacity additions and underlying profitability improvements. Demand Creation Compelling Value Proposition Long Term Profitable Growth Substantial Material Conversion Runway ~35M HOMES AGED 20 TO 40 YEARS OLD ~22% OF NEW CONSTRUCTION HOMES BUILT WITH FIBER CEMENT SIDING Double-Digit Revenue Growth ~LSD% Market Growth ~4pp Outperformance ~MSD% ASP Growth +500bps Adj. EBITDA Margin Value Proposition HOS Initiatives Scaling for Growth Triple Adj. EBITDA Robust Free Cash Flow Modest Capital Needs Low Leverage Innovative Solutions Unrivaled Business Support
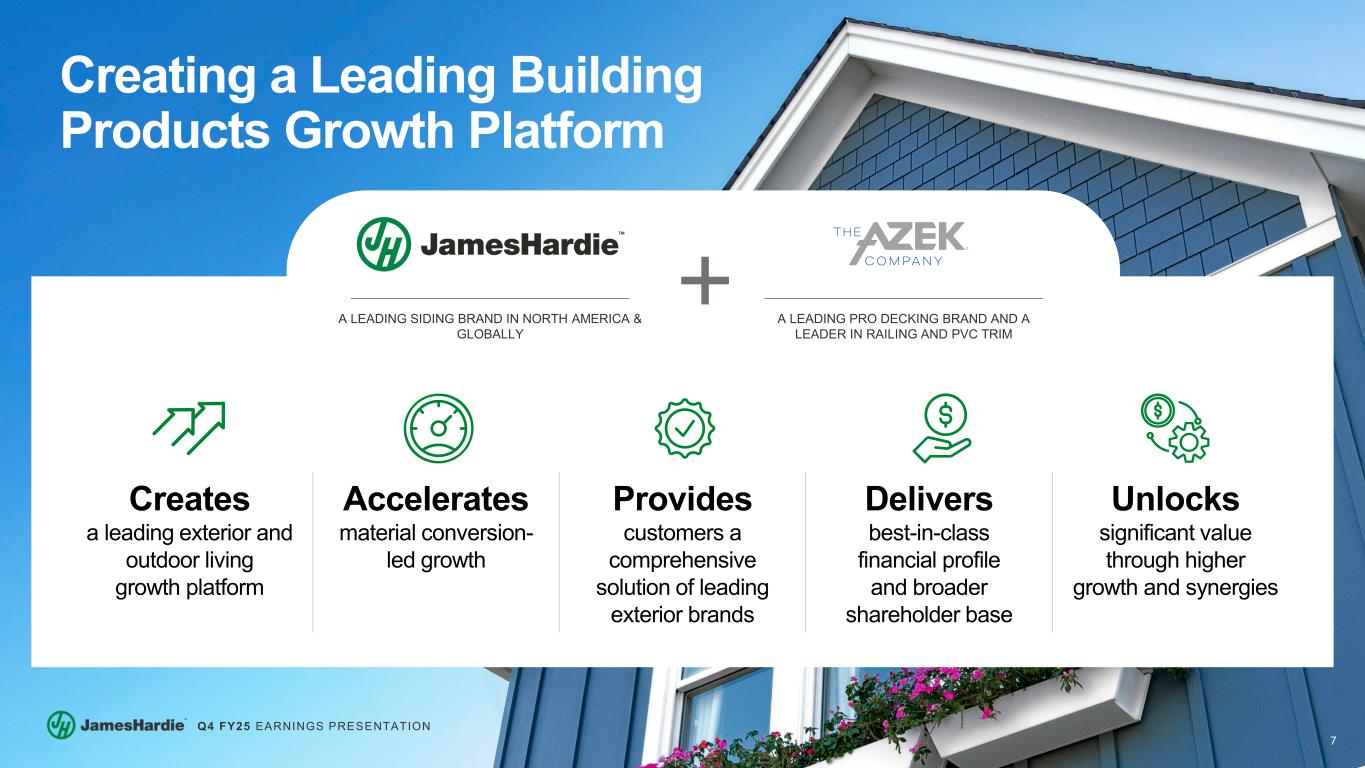
7 Q4 FY25 EARNINGS PRESENTATION Creating a Leading Building Products Growth Platform Creates a leading exterior and outdoor living growth platform Accelerates material conversion- led growth Provides customers a comprehensive solution of leading exterior brands Delivers best-in-class financial profile and broader shareholder base Unlocks significant value through higher growth and synergies A LEADING SIDING BRAND IN NORTH AMERICA & GLOBALLY A LEADING PRO DECKING BRAND AND A LEADER IN RAILING AND PVC TRIM
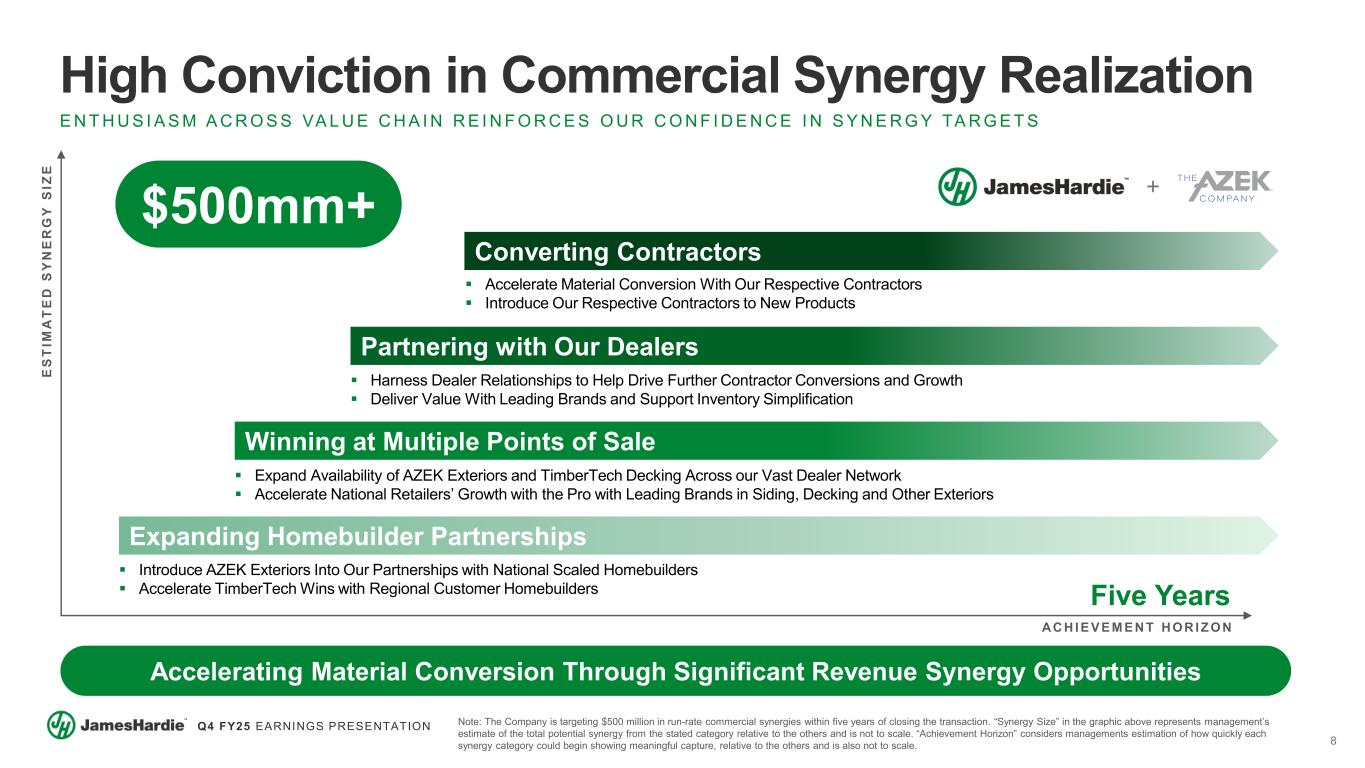
8 Q4 FY25 EARNINGS PRESENTATION Introduce AZEK Exteriors Into Our Partnerships with National Scaled Homebuilders Accelerate TimberTech Wins with Regional Customer Homebuilders High Conviction in Commercial Synergy Realization E N T H U S I A S M A C R O S S VA L U E C H A I N R E I N F O R C E S O U R C O N F I D E N C E I N S Y N E R G Y TA R G E T S Accelerating Material Conversion Through Significant Revenue Synergy Opportunities E S T IM A T E D S Y N E R G Y S IZ E AC H I E V E M E N T H O R I Z O N Expand Availability of AZEK Exteriors and TimberTech Decking Across our Vast Dealer Network Accelerate National Retailers’ Growth with the Pro with Leading Brands in Siding, Decking and Other Exteriors Harness Dealer Relationships to Help Drive Further Contractor Conversions and Growth Deliver Value With Leading Brands and Support Inventory Simplification Accelerate Material Conversion With Our Respective Contractors Introduce Our Respective Contractors to New Products Five Years Converting Contractors Partnering with Our Dealers Winning at Multiple Points of Sale Expanding Homebuilder Partnerships Note: The Company is targeting $500 million in run-rate commercial synergies within five years of closing the transaction. “Synergy Size” in the graphic above represents management’s estimate of the total potential synergy from the stated category relative to the others and is not to scale. “Achievement Horizon” considers managements estimation of how quickly each synergy category could begin showing meaningful capture, relative to the others and is also not to scale. $500mm+
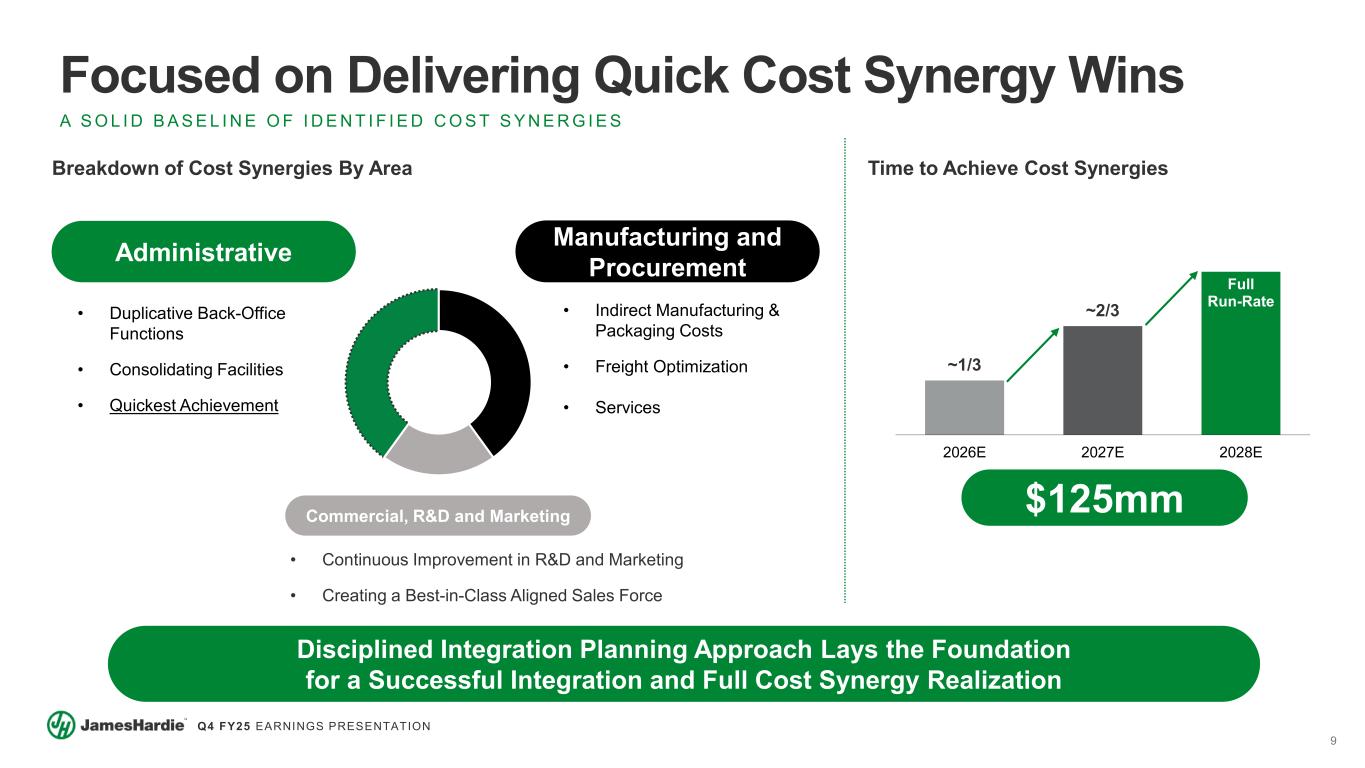
9 Q4 FY25 EARNINGS PRESENTATION Focused on Delivering Quick Cost Synergy Wins A S O L I D B A S E L I N E O F I D E N T I F I E D C O S T S Y N E R G I E S Disciplined Integration Planning Approach Lays the Foundation for a Successful Integration and Full Cost Synergy Realization Administrative Manufacturing and Procurement Commercial, R&D and Marketing • Duplicative Back-Office Functions • Consolidating Facilities • Quickest Achievement • Indirect Manufacturing & Packaging Costs • Freight Optimization • Services • Continuous Improvement in R&D and Marketing • Creating a Best-in-Class Aligned Sales Force ~1/3 ~2/3 Full Run-Rate 2026E 2027E 2028E $125mm Breakdown of Cost Synergies By Area Time to Achieve Cost Synergies
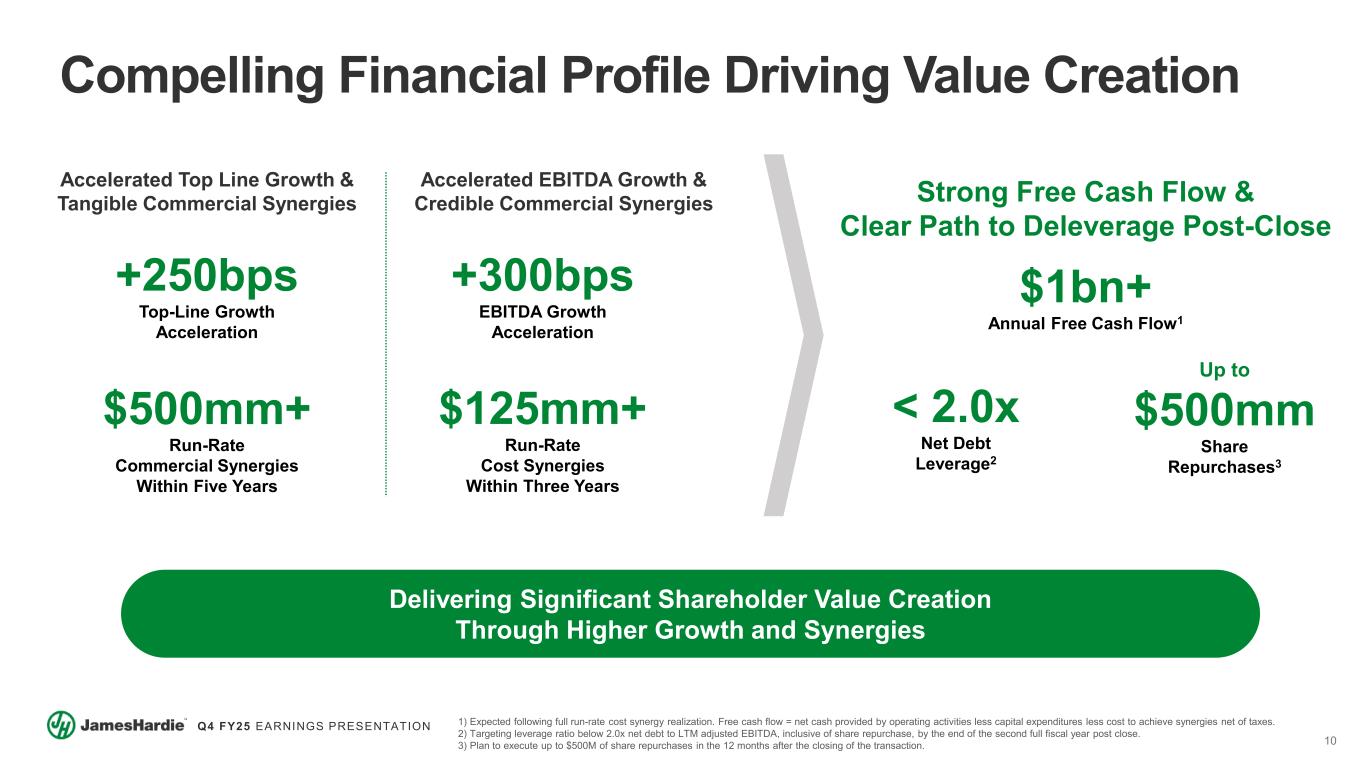
10 Q4 FY25 EARNINGS PRESENTATION Compelling Financial Profile Driving Value Creation Strong Free Cash Flow & Clear Path to Deleverage Post-Close Delivering Significant Shareholder Value Creation Through Higher Growth and Synergies 1) Expected following full run-rate cost synergy realization. Free cash flow = net cash provided by operating activities less capital expenditures less cost to achieve synergies net of taxes. 2) Targeting leverage ratio below 2.0x net debt to LTM adjusted EBITDA, inclusive of share repurchase, by the end of the second full fiscal year post close. 3) Plan to execute up to $500M of share repurchases in the 12 months after the closing of the transaction. Accelerated EBITDA Growth & Credible Commercial Synergies Accelerated Top Line Growth & Tangible Commercial Synergies +250bps Top-Line Growth Acceleration $500mm+ Run-Rate Commercial Synergies Within Five Years $125mm+ Run-Rate Cost Synergies Within Three Years $1bn+ Annual Free Cash Flow1 Up to $500mm Share Repurchases3 < 2.0x Net Debt Leverage2 +300bps EBITDA Growth Acceleration
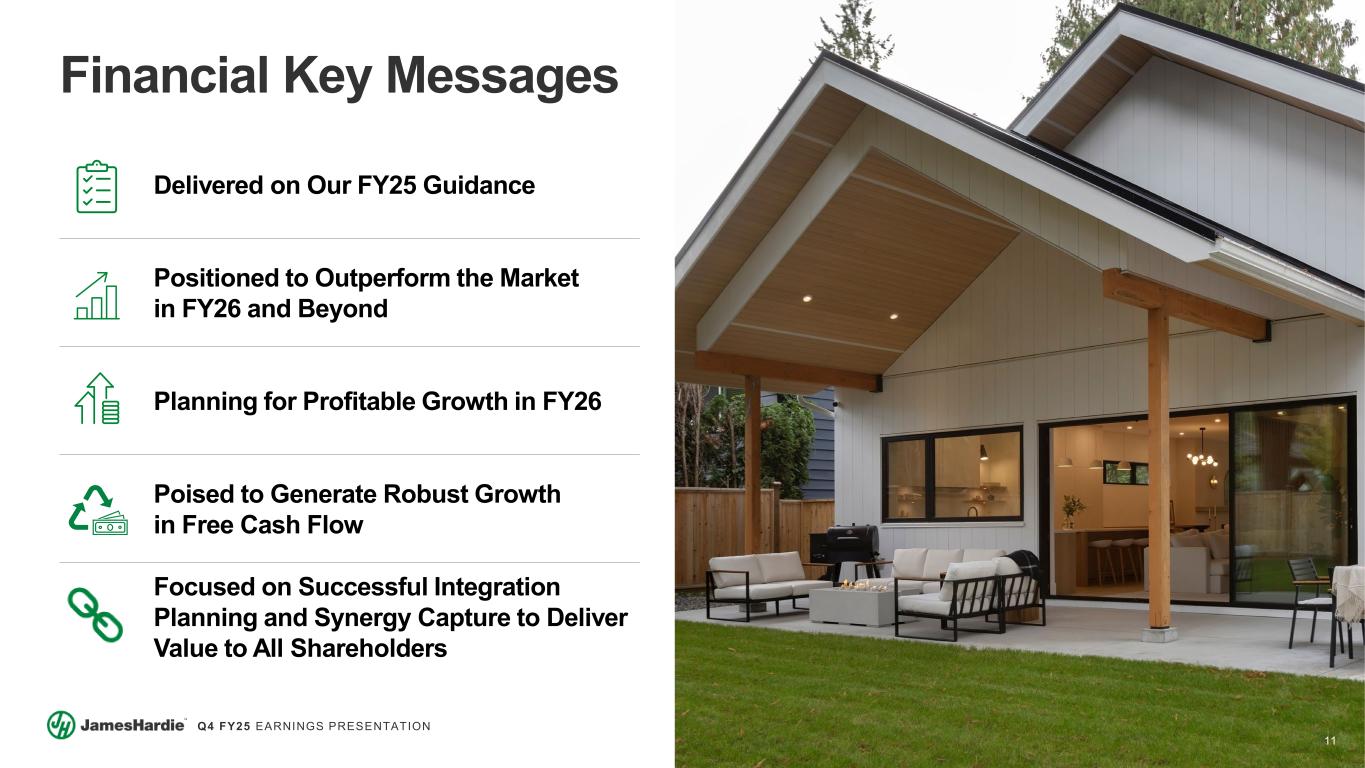
11 Q4 FY25 EARNINGS PRESENTATION Delivered on Our FY25 Guidance Positioned to Outperform the Market in FY26 and Beyond Planning for Profitable Growth in FY26 Poised to Generate Robust Growth in Free Cash Flow Focused on Successful Integration Planning and Synergy Capture to Deliver Value to All Shareholders Financial Key Messages
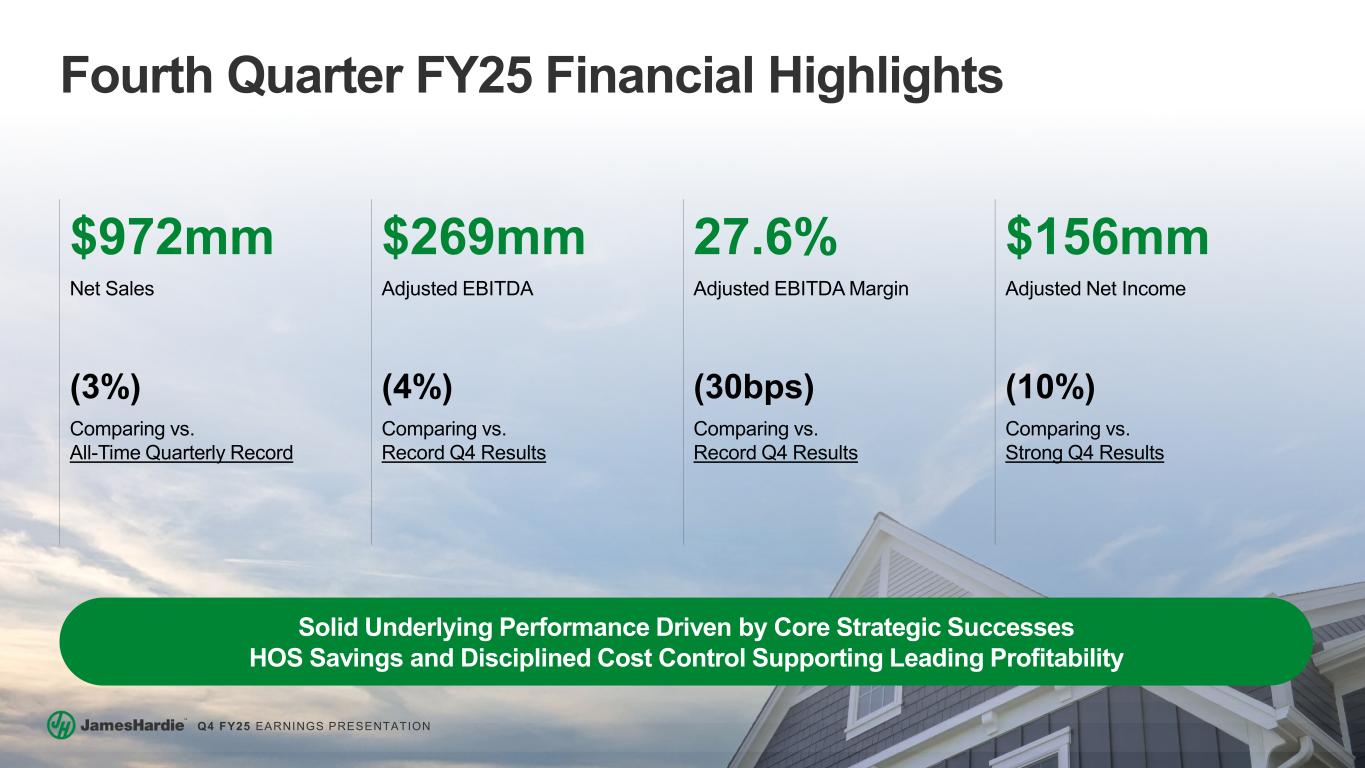
12 Q4 FY25 EARNINGS PRESENTATION Fourth Quarter FY25 Financial Highlights $972mm $269mm 27.6% $156mm Net Sales Adjusted EBITDA Adjusted EBITDA Margin Adjusted Net Income (3%) (4%) (30bps) (10%) Comparing vs. All-Time Quarterly Record Comparing vs. Record Q4 Results Comparing vs. Record Q4 Results Comparing vs. Strong Q4 Results Solid Underlying Performance Driven by Core Strategic Successes HOS Savings and Disciplined Cost Control Supporting Leading Profitability
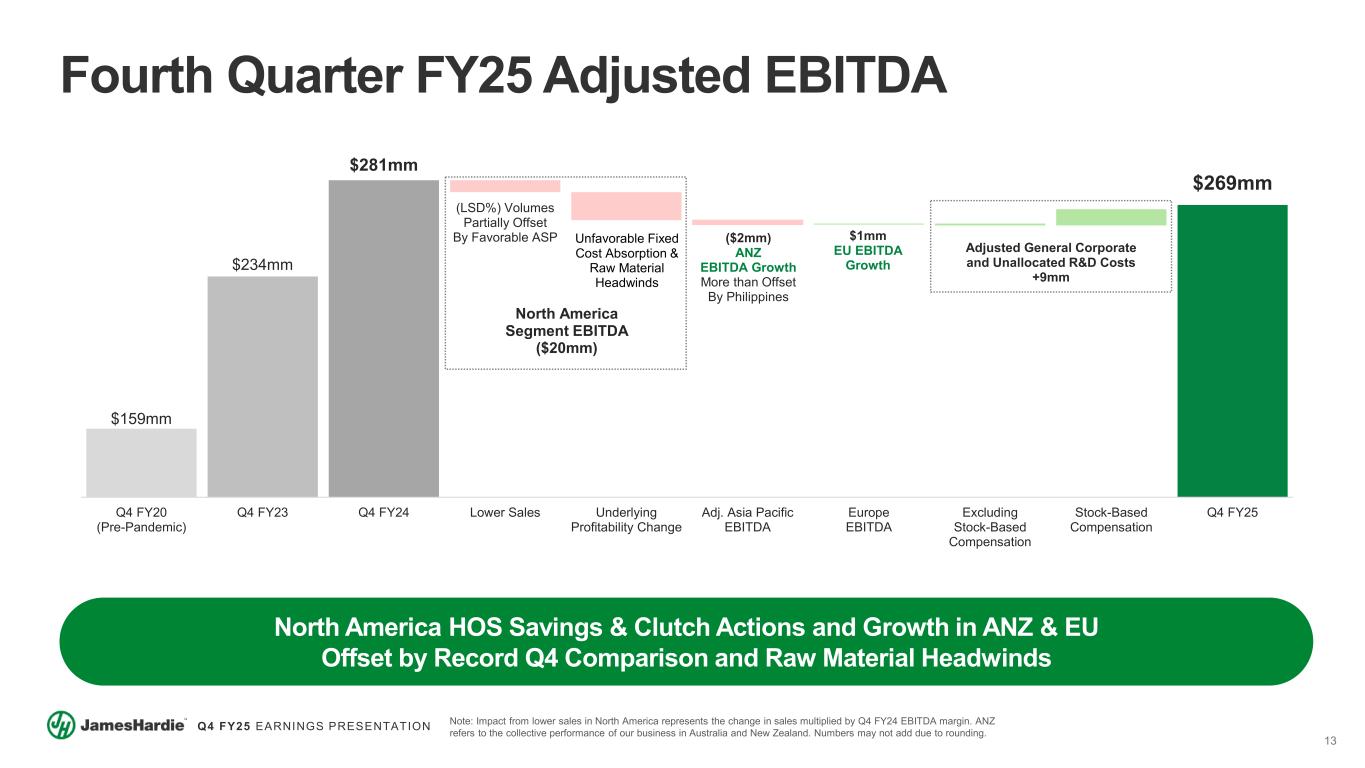
13 Q4 FY25 EARNINGS PRESENTATION Fourth Quarter FY25 Adjusted EBITDA Note: Impact from lower sales in North America represents the change in sales multiplied by Q4 FY24 EBITDA margin. ANZ refers to the collective performance of our business in Australia and New Zealand. Numbers may not add due to rounding. North America HOS Savings & Clutch Actions and Growth in ANZ & EU Offset by Record Q4 Comparison and Raw Material Headwinds $159mm $234mm $281mm North America Segment EBITDA ($20mm) $269mm (LSD%) Volumes Partially Offset By Favorable ASP Unfavorable Fixed Cost Absorption & Raw Material Headwinds ($2mm) ANZ EBITDA Growth More than Offset By Philippines $1mm EU EBITDA Growth Adjusted General Corporate and Unallocated R&D Costs +9mm Q4 FY20 (Pre-Pandemic) Q4 FY23 Q4 FY24 Lower Sales Underlying Profitability Change Adj. Asia Pacific EBITDA Europe EBITDA Excluding Stock-Based Compensation Stock-Based Compensation Q4 FY25
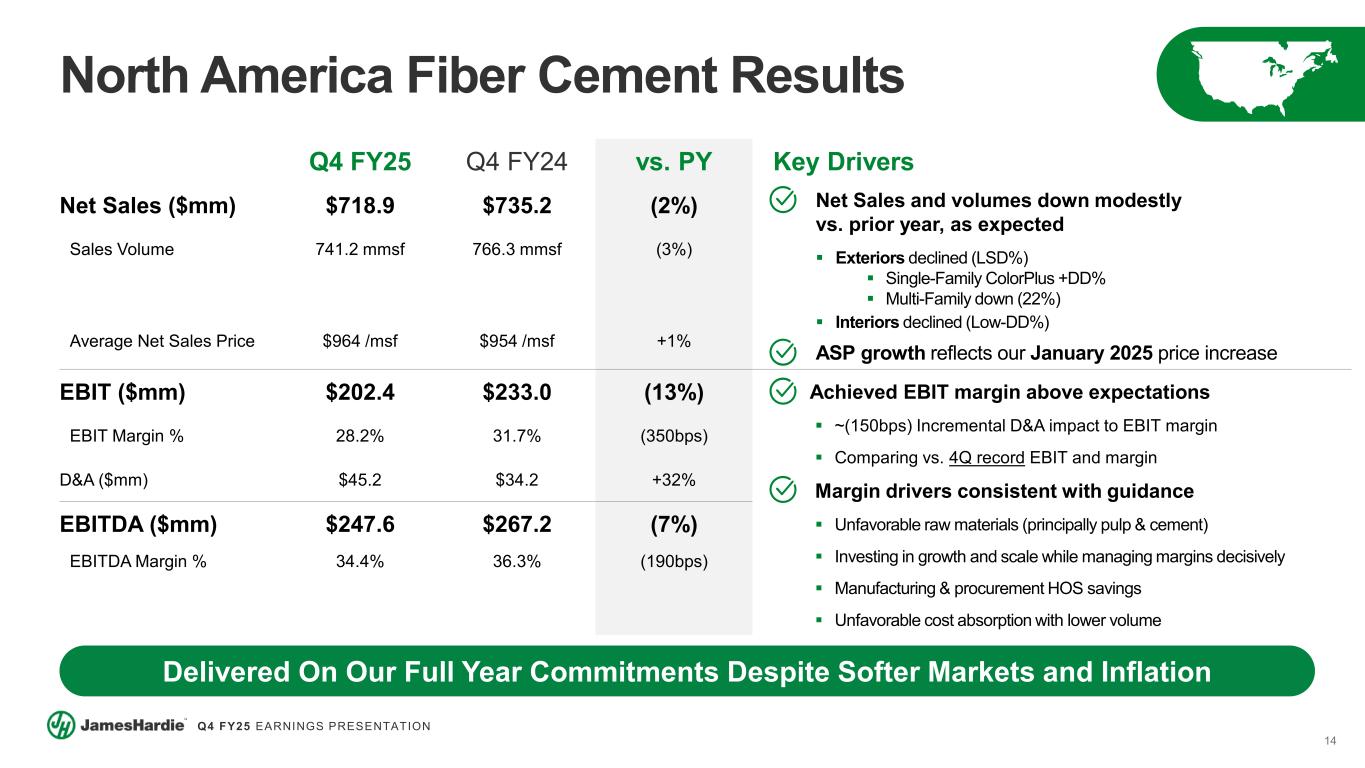
14 Q4 FY25 EARNINGS PRESENTATION North America Fiber Cement Results Q4 FY25 Q4 FY24 vs. PY Key Drivers Net Sales ($mm) $718.9 $735.2 (2%) Net Sales and volumes down modestly vs. prior year, as expected Exteriors declined (LSD%) Single-Family ColorPlus +DD% Multi-Family down (22%) Interiors declined (Low-DD%) ASP growth reflects our January 2025 price increase Sales Volume 741.2 mmsf 766.3 mmsf (3%) Average Net Sales Price $964 /msf $954 /msf +1% EBIT ($mm) $202.4 $233.0 (13%) Achieved EBIT margin above expectations ~(150bps) Incremental D&A impact to EBIT margin Comparing vs. 4Q record EBIT and margin Margin drivers consistent with guidance Unfavorable raw materials (principally pulp & cement) Investing in growth and scale while managing margins decisively Manufacturing & procurement HOS savings Unfavorable cost absorption with lower volume EBIT Margin % 28.2% 31.7% (350bps) D&A ($mm) $45.2 $34.2 +32% EBITDA ($mm) $247.6 $267.2 (7%) EBITDA Margin % 34.4% 36.3% (190bps) Delivered On Our Full Year Commitments Despite Softer Markets and Inflation
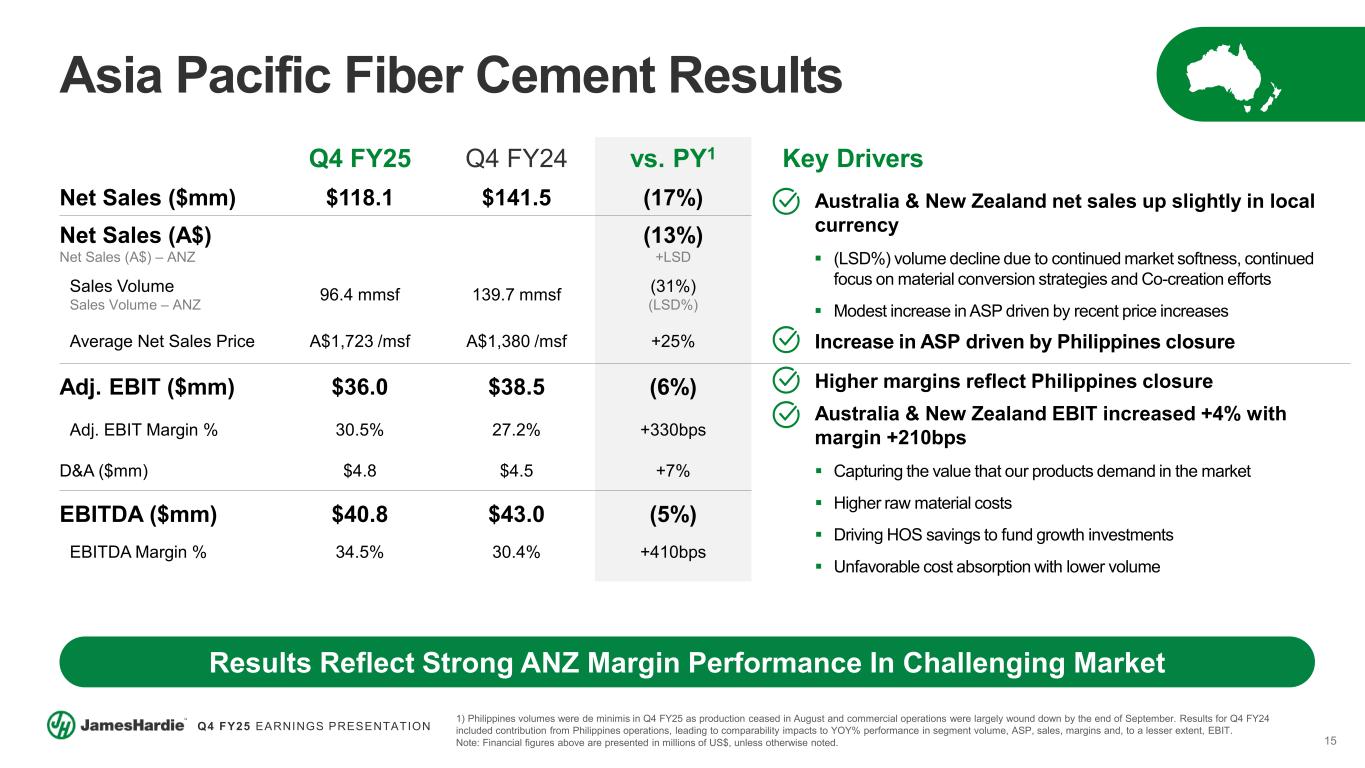
15 Q4 FY25 EARNINGS PRESENTATION Asia Pacific Fiber Cement Results Note: Financial figures above are presented in millions of US$, unless otherwise noted. 1) Philippines volumes were de minimis in Q4 FY25 as production ceased in August and commercial operations were largely wound down by the end of September. Results for Q4 FY24 included contribution from Philippines operations, leading to comparability impacts to YOY% performance in segment volume, ASP, sales, margins and, to a lesser extent, EBIT. Q4 FY25 Q4 FY24 vs. PY1 Key Drivers Net Sales ($mm) $118.1 $141.5 (17%) Australia & New Zealand net sales up slightly in local currency (LSD%) volume decline due to continued market softness, continued focus on material conversion strategies and Co-creation efforts Modest increase in ASP driven by recent price increases Increase in ASP driven by Philippines closure Net Sales (A$) Net Sales (A$) – ANZ (13%) +LSD Sales Volume Sales Volume – ANZ 96.4 mmsf 139.7 mmsf (31%) (LSD%) Average Net Sales Price A$1,723 /msf A$1,380 /msf +25% Adj. EBIT ($mm) $36.0 $38.5 (6%) Higher margins reflect Philippines closure Australia & New Zealand EBIT increased +4% with margin +210bps Capturing the value that our products demand in the market Higher raw material costs Driving HOS savings to fund growth investments Unfavorable cost absorption with lower volume Adj. EBIT Margin % 30.5% 27.2% +330bps D&A ($mm) $4.8 $4.5 +7% EBITDA ($mm) $40.8 $43.0 (5%) EBITDA Margin % 34.5% 30.4% +410bps Results Reflect Strong ANZ Margin Performance In Challenging Market
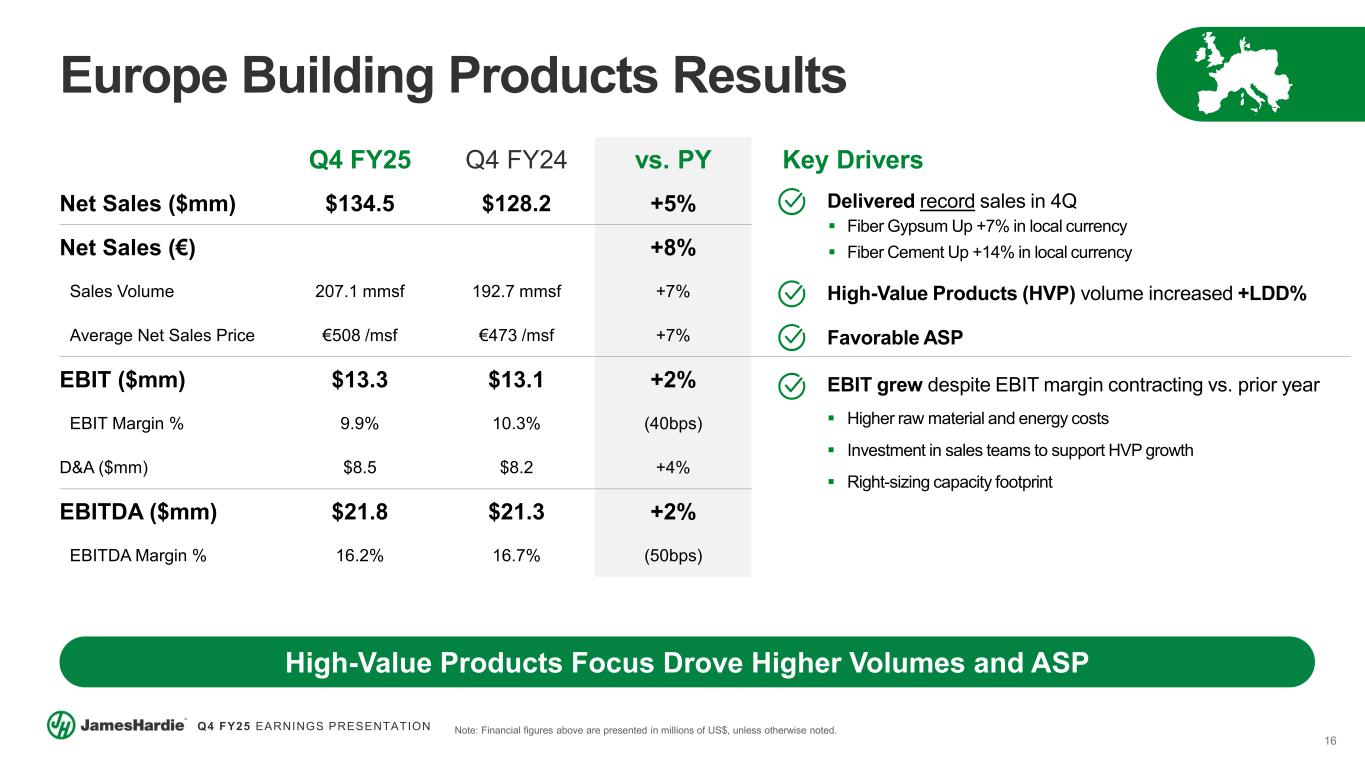
16 Q4 FY25 EARNINGS PRESENTATION Europe Building Products Results Note: Financial figures above are presented in millions of US$, unless otherwise noted. Q4 FY25 Q4 FY24 vs. PY Key Drivers Net Sales ($mm) $134.5 $128.2 +5% Delivered record sales in 4Q Fiber Gypsum Up +7% in local currency Fiber Cement Up +14% in local currency High-Value Products (HVP) volume increased +LDD% Favorable ASP Net Sales (€) +8% Sales Volume 207.1 mmsf 192.7 mmsf +7% Average Net Sales Price €508 /msf €473 /msf +7% EBIT ($mm) $13.3 $13.1 +2% EBIT grew despite EBIT margin contracting vs. prior year Higher raw material and energy costs Investment in sales teams to support HVP growth Right-sizing capacity footprint EBIT Margin % 9.9% 10.3% (40bps) D&A ($mm) $8.5 $8.2 +4% EBITDA ($mm) $21.8 $21.3 +2% EBITDA Margin % 16.2% 16.7% (50bps) High-Value Products Focus Drove Higher Volumes and ASP
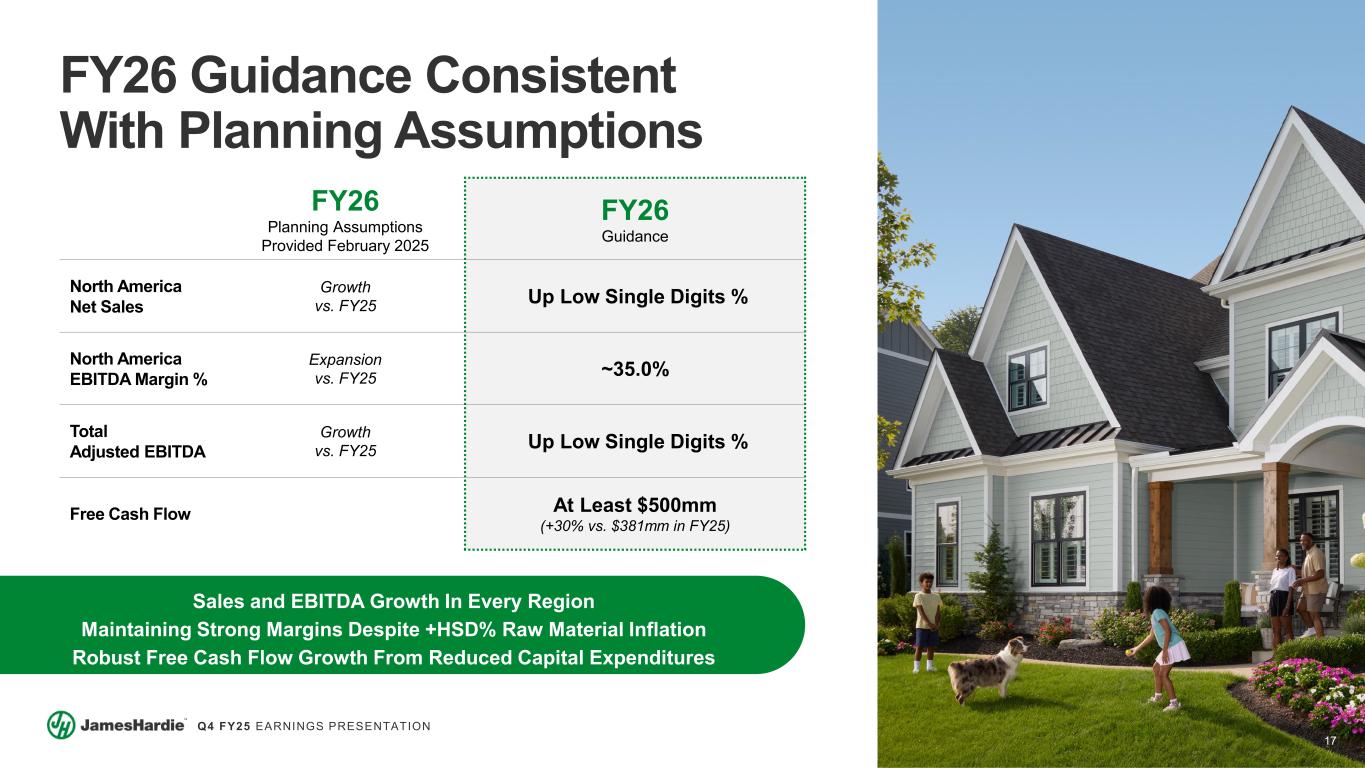
17 Q4 FY25 EARNINGS PRESENTATION FY26 Guidance Consistent With Planning Assumptions FY26 Planning Assumptions Provided February 2025 FY26 Guidance North America Net Sales Growth vs. FY25 Up Low Single Digits % North America EBITDA Margin % Expansion vs. FY25 ~35.0% Total Adjusted EBITDA Growth vs. FY25 Up Low Single Digits % Free Cash Flow At Least $500mm (+30% vs. $381mm in FY25) Sales and EBITDA Growth In Every Region Maintaining Strong Margins Despite +HSD% Raw Material Inflation Robust Free Cash Flow Growth From Reduced Capital Expenditures
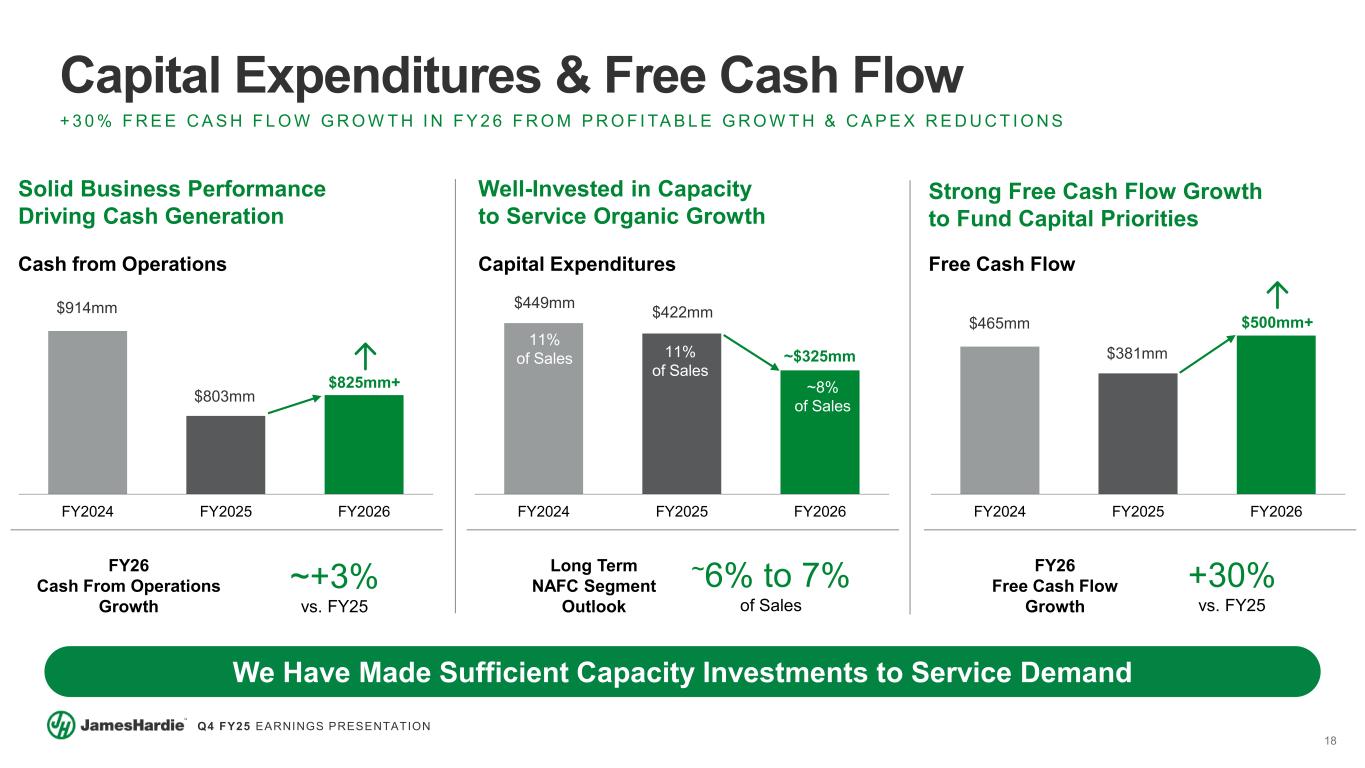
18 Q4 FY25 EARNINGS PRESENTATION Capital Expenditures & Free Cash Flow Well-Invested in Capacity to Service Organic Growth We Have Made Sufficient Capacity Investments to Service Demand Strong Free Cash Flow Growth to Fund Capital Priorities Free Cash Flow FY2024 FY2025 FY2026 $465mm $381mm $500mm+ + 3 0 % F R E E C A S H F L O W G R O W T H I N F Y 2 6 F R O M P R O F I TA B L E G R O W T H & C A P E X R E D U C T I O N S Cash from Operations FY2024 FY2025 FY2026 $914mm $803mm $825mm+ Capital Expenditures FY2024 FY2025 FY2026 11% of Sales ~8% of Sales Long Term NAFC Segment Outlook ~6% to 7% of Sales $449mm $422mm ~$325mm Solid Business Performance Driving Cash Generation FY26 Free Cash Flow Growth +30% vs. FY25 FY26 Cash From Operations Growth ~+3% vs. FY25 11% of Sales
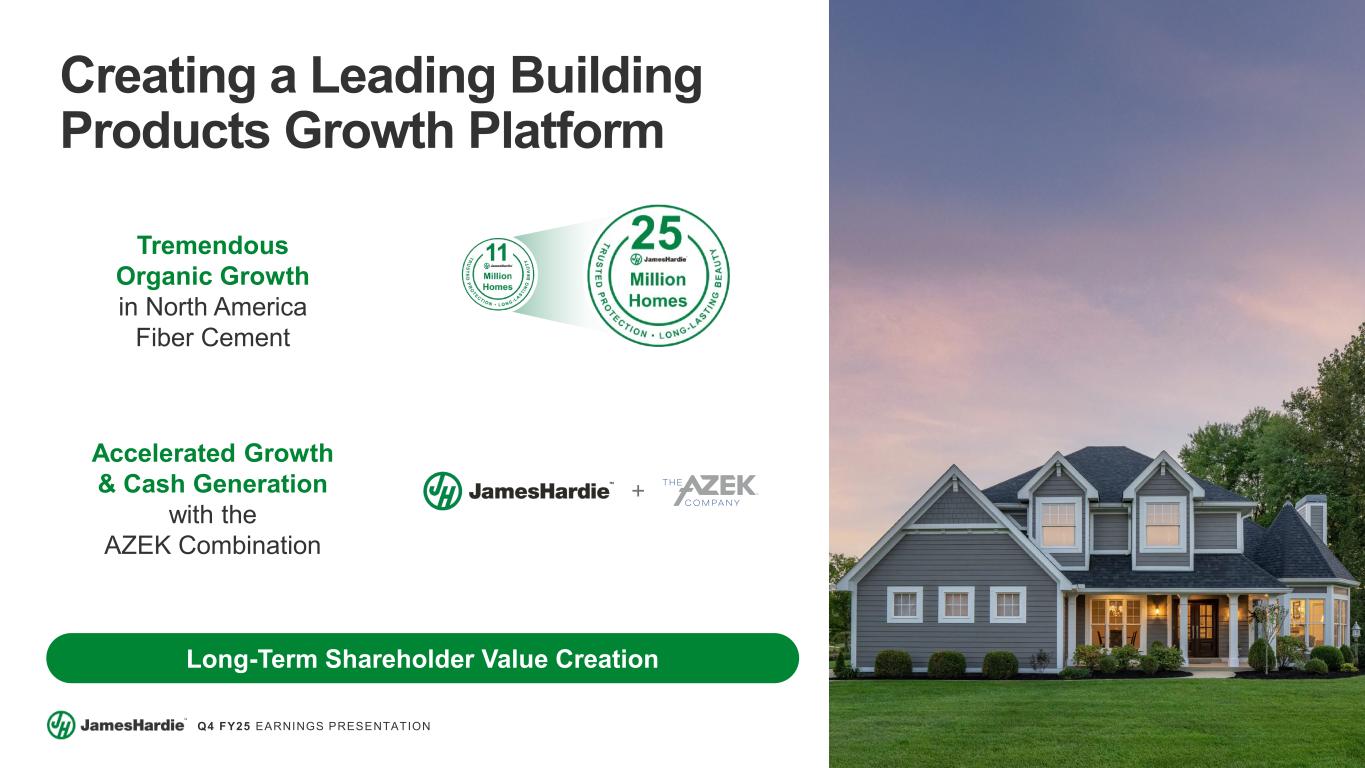
19 Q4 FY25 EARNINGS PRESENTATION Creating a Leading Building Products Growth Platform Long-Term Shareholder Value Creation Tremendous Organic Growth in North America Fiber Cement Accelerated Growth & Cash Generation with the AZEK Combination
20 Q4 FY25 EARNINGS PRESENTATION Q&A Aaron Erter CHIEF EXECUTIVE OFFICER Rachel Wilson CHIEF FINANCIAL OFFICER
21 Q4 FY25 EARNINGS PRESENTATION Non-GAAP Financial Measures This Earnings Presentation forms part of a package of information about the company’s results. It should be read in conjunction with the other parts of this package, including the 20-F and Earnings Release Financial Measures – GAAP Equivalents This document contains the financial statement line item EBIT, which is considered to be non-GAAP, but is consistent with the term used by Australian companies. Because we prepare our consolidated financial statements under GAAP, the equivalent GAAP financial Statement line item description used in our consolidated financial statements is Operating income (loss). EBIT – Earnings (loss) before interest and tax EBIT margin – EBIT margin is defined as EBIT as a percentage of net sales Definitions ASP – Average net sales price per msf ("ASP") – Total net sales of fiber cement and fiber gypsum products, excluding accessory sales, divided by the total volume of products sold Free Cash Flow – Free Cash Flow (“FCF"), unless otherwise noted, is defined as net cash provided by operating activities less purchases of property, plant and equipment Working Capital – The working capital calculation used in our cash provided by operating analysis includes the change in: (1) Accounts and other receivables, net; (2) Inventories; and (3) Accounts payable and accrued liabilities. ROCE - Return on Capital Employed; calculated as Adjusted EBIT / Adjusted Gross Capital Employed AICF – Asbestos Injuries Compensation Fund Ltd bnsf – sales volume in billion standard feet, where a standard foot is defined as a square foot of 5/16” thickness mmsf – sales volume in million standard feet, where a standard foot is defined as a square foot of 5/16” thickness msf – sales volume in thousand standard feet, where a standard foot is defined as a square foot of 5/16” thickness LSD – Low Single-Digits MSD – Mid-Single Digits HSD – High Single-Digits DD – Double-Digits LDD – Low Double-Digits D&A – Depreciation & Amortization expense
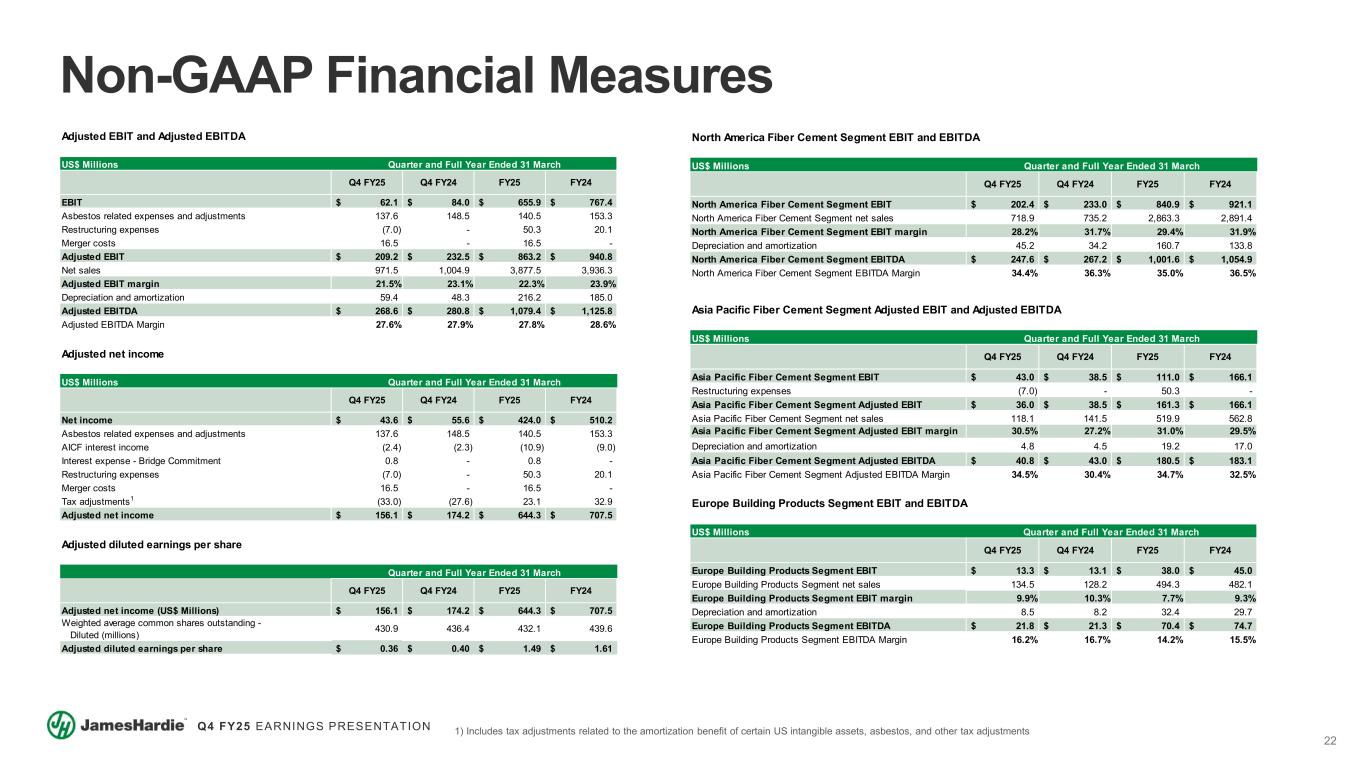
22 Q4 FY25 EARNINGS PRESENTATION US$ Millions Q4 FY25 Q4 FY24 FY25 FY24 Europe Building Products Segment EBIT 13.3$ 13.1$ 38.0$ 45.0$ Europe Building Products Segment net sales 134.5 128.2 494.3 482.1 Europe Building Products Segment EBIT margin 9.9% 10.3% 7.7% 9.3% Depreciation and amortization 8.5 8.2 32.4 29.7 Europe Building Products Segment EBITDA 21.8$ 21.3$ 70.4$ 74.7$ Europe Building Products Segment EBITDA Margin 16.2% 16.7% 14.2% 15.5% Quarter and Full Year Ended 31 March Europe Building Products Segment EBIT and EBITDA US$ Millions Q4 FY25 Q4 FY24 FY25 FY24 Asia Pacific Fiber Cement Segment EBIT 43.0$ 38.5$ 111.0$ 166.1$ Restructuring expenses (7.0) - 50.3 - Asia Pacific Fiber Cement Segment Adjusted EBIT 36.0$ 38.5$ 161.3$ 166.1$ Asia Pacific Fiber Cement Segment net sales 118.1 141.5 519.9 562.8 Asia Pacific Fiber Cement Segment Adjusted EBIT margin 30.5% 27.2% 31.0% 29.5% Depreciation and amortization 4.8 4.5 19.2 17.0 Asia Pacific Fiber Cement Segment Adjusted EBITDA 40.8$ 43.0$ 180.5$ 183.1$ Asia Pacific Fiber Cement Segment Adjusted EBITDA Margin 34.5% 30.4% 34.7% 32.5% Asia Pacific Fiber Cement Segment Adjusted EBIT and Adjusted EBITDA Quarter and Full Year Ended 31 March US$ Millions Q4 FY25 Q4 FY24 FY25 FY24 North America Fiber Cement Segment EBIT 202.4$ 233.0$ 840.9$ 921.1$ North America Fiber Cement Segment net sales 718.9 735.2 2,863.3 2,891.4 North America Fiber Cement Segment EBIT margin 28.2% 31.7% 29.4% 31.9% Depreciation and amortization 45.2 34.2 160.7 133.8 North America Fiber Cement Segment EBITDA 247.6$ 267.2$ 1,001.6$ 1,054.9$ North America Fiber Cement Segment EBITDA Margin 34.4% 36.3% 35.0% 36.5% North America Fiber Cement Segment EBIT and EBITDA Quarter and Full Year Ended 31 March Adjusted diluted earnings per share Q4 FY25 Q4 FY24 FY25 FY24 Adjusted net income (US$ Millions) 156.1$ 174.2$ 644.3$ 707.5$ Weighted average common shares outstanding - Diluted (millions) 430.9 436.4 432.1 439.6 Adjusted diluted earnings per share 0.36$ 0.40$ 1.49$ 1.61$ Quarter and Full Year Ended 31 March Adjusted net income US$ Millions Q4 FY25 Q4 FY24 FY25 FY24 Net income 43.6$ 55.6$ 424.0$ 510.2$ Asbestos related expenses and adjustments 137.6 148.5 140.5 153.3 AICF interest income (2.4) (2.3) (10.9) (9.0) Interest expense - Bridge Commitment 0.8 - 0.8 - Restructuring expenses (7.0) - 50.3 20.1 Merger costs 16.5 - 16.5 - Tax adjustments1 (33.0) (27.6) 23.1 32.9 Adjusted net income 156.1$ 174.2$ 644.3$ 707.5$ Quarter and Full Year Ended 31 March Adjusted EBIT and Adjusted EBITDA US$ Millions Q4 FY25 Q4 FY24 FY25 FY24 EBIT 62.1$ 84.0$ 655.9$ 767.4$ Asbestos related expenses and adjustments 137.6 148.5 140.5 153.3 Restructuring expenses (7.0) - 50.3 20.1 Merger costs 16.5 - 16.5 - Adjusted EBIT 209.2$ 232.5$ 863.2$ 940.8$ Net sales 971.5 1,004.9 3,877.5 3,936.3 Adjusted EBIT margin 21.5% 23.1% 22.3% 23.9% Depreciation and amortization 59.4 48.3 216.2 185.0 Adjusted EBITDA 268.6$ 280.8$ 1,079.4$ 1,125.8$ Adjusted EBITDA Margin 27.6% 27.9% 27.8% 28.6% Quarter and Full Year Ended 31 March Non-GAAP Financial Measures 1) Includes tax adjustments related to the amortization benefit of certain US intangible assets, asbestos, and other tax adjustments
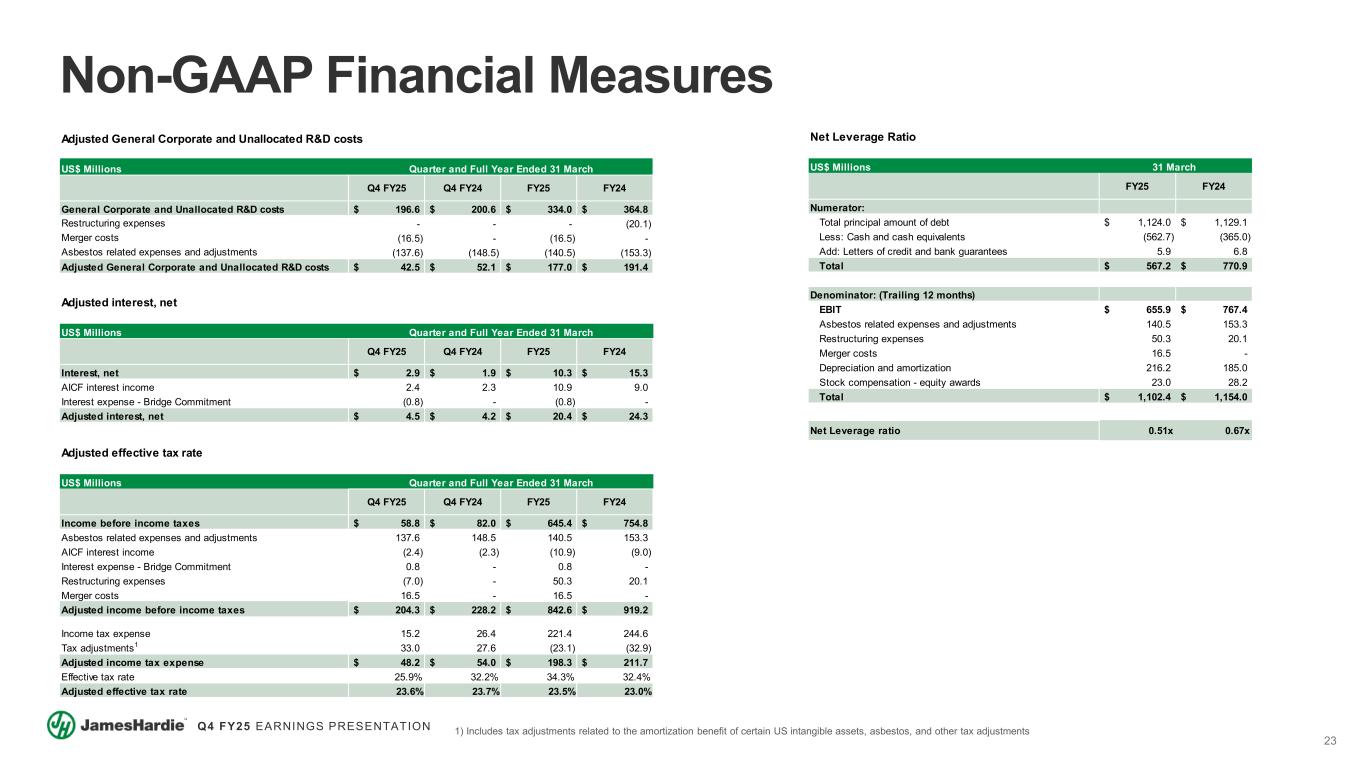
23 Q4 FY25 EARNINGS PRESENTATION Net Leverage Ratio US$ Millions FY25 FY24 Numerator: Total principal amount of debt 1,124.0$ 1,129.1$ Less: Cash and cash equivalents (562.7) (365.0) Add: Letters of credit and bank guarantees 5.9 6.8 Total 567.2$ 770.9$ Denominator: (Trailing 12 months) EBIT 655.9$ 767.4$ Asbestos related expenses and adjustments 140.5 153.3 Restructuring expenses 50.3 20.1 Merger costs 16.5 - Depreciation and amortization 216.2 185.0 Stock compensation - equity awards 23.0 28.2 Total 1,102.4$ 1,154.0$ Net Leverage ratio 0.51x 0.67x 31 March Adjusted effective tax rate US$ Millions Q4 FY25 Q4 FY24 FY25 FY24 Income before income taxes 58.8$ 82.0$ 645.4$ 754.8$ Asbestos related expenses and adjustments 137.6 148.5 140.5 153.3 AICF interest income (2.4) (2.3) (10.9) (9.0) Interest expense - Bridge Commitment 0.8 - 0.8 - Restructuring expenses (7.0) - 50.3 20.1 Merger costs 16.5 - 16.5 - Adjusted income before income taxes 204.3$ 228.2$ 842.6$ 919.2$ Income tax expense 15.2 26.4 221.4 244.6 Tax adjustments1 33.0 27.6 (23.1) (32.9) Adjusted income tax expense 48.2$ 54.0$ 198.3$ 211.7$ Effective tax rate 25.9% 32.2% 34.3% 32.4% Adjusted effective tax rate 23.6% 23.7% 23.5% 23.0% Quarter and Full Year Ended 31 March US$ Millions Q4 FY25 Q4 FY24 FY25 FY24 Interest, net 2.9$ 1.9$ 10.3$ 15.3$ AICF interest income 2.4 2.3 10.9 9.0 Interest expense - Bridge Commitment (0.8) - (0.8) - Adjusted interest, net 4.5$ 4.2$ 20.4$ 24.3$ Adjusted interest, net Quarter and Full Year Ended 31 March Adjusted General Corporate and Unallocated R&D US$ Millions Q4 FY25 Q4 FY24 FY25 FY24 General Corporate and Unallocated R&D costs 196.6$ 200.6$ 334.0$ 364.8$ Restructuring expenses - - - (20.1) Merger costs (16.5) - (16.5) - Asbestos related expenses and adjustments (137.6) (148.5) (140.5) (153.3) Adjusted General Corporate and Unallocated R&D costs 42.5$ 52.1$ 177.0$ 191.4$ Quarter and Full Year Ended 31 March Non-GAAP Financial Measures 1) Includes tax adjustments related to the amortization benefit of certain US intangible assets, asbestos, and other tax adjustments $ illi s r l r r t ll t t . . . . tr t ri - - - ( . ) r r t ( . ) - ( . ) - t r l t j t t ( . ) ( . ) ( . ) ( . ) j t r l r r t ll t t . . . . arter a ll ear e 31 arc j t r l r r t ll t costs
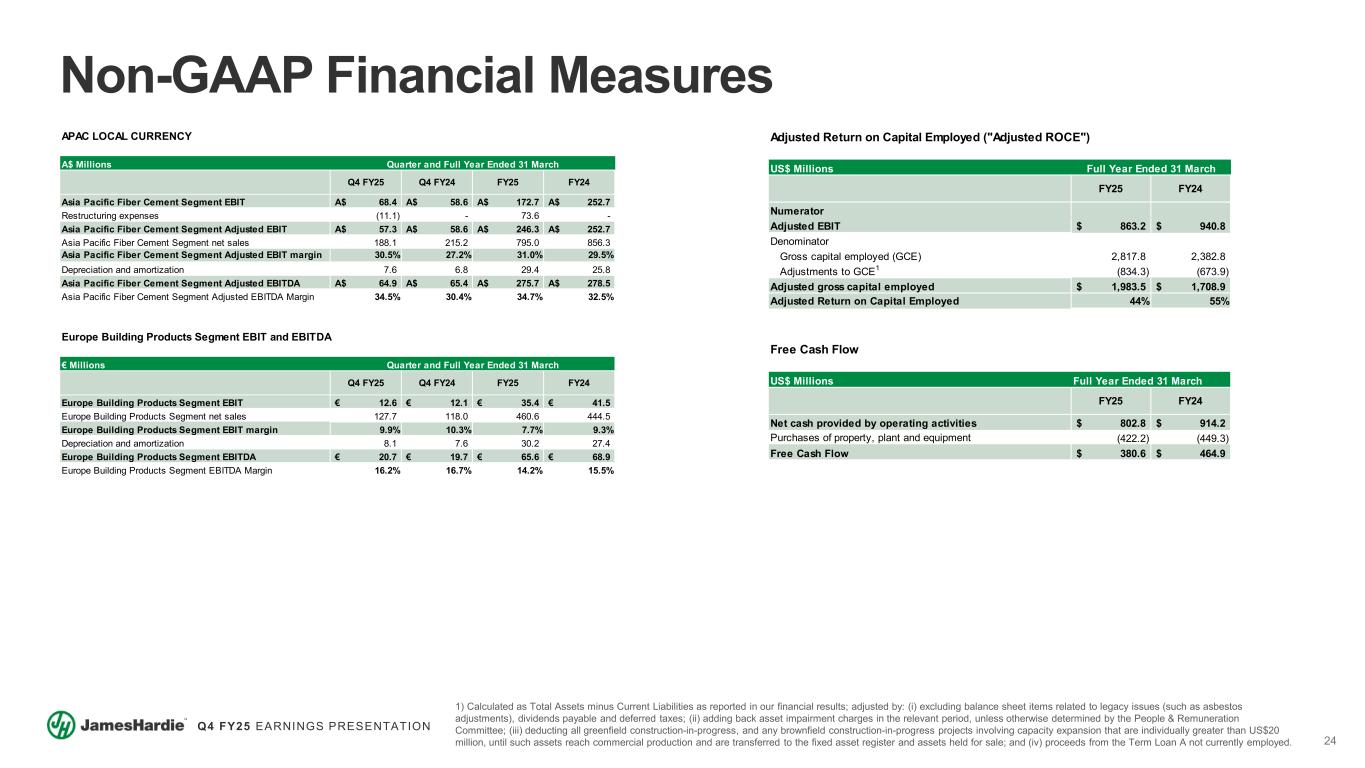
24 Q4 FY25 EARNINGS PRESENTATION Adjusted Return on Capital Employed ("Adjusted ROCE") US$ Millions FY25 FY24 Numerator Adjusted EBIT 863.2$ 940.8$ Denominator Gross capital employed (GCE) 2,817.8 2,382.8 Adjustments to GCE1 (834.3) (673.9) Adjusted gross capital employed 1,983.5$ 1,708.9$ Adjusted Return on Capital Employed 44% 55% Full Year Ended 31 March APAC LOCAL CURRENCY A$ Millions Q4 FY25 Q4 FY24 FY25 FY24 Asia Pacific Fiber Cement Segment EBIT 68.4A$ 58.6A$ 172.7A$ 252.7A$ Restructuring expenses (11.1) - 73.6 - Asia Pacific Fiber Cement Segment Adjusted EBIT 57.3A$ 58.6A$ 246.3A$ 252.7A$ Asia Pacific Fiber Cement Segment net sales 188.1 215.2 795.0 856.3 Asia Pacific Fiber Cement Segment Adjusted EBIT margin 30.5% 27.2% 31.0% 29.5% Depreciation and amortization 7.6 6.8 29.4 25.8 Asia Pacific Fiber Cement Segment Adjusted EBITDA 64.9A$ 65.4A$ 275.7A$ 278.5A$ Asia Pacific Fiber Cement Segment Adjusted EBITDA Margin 34.5% 30.4% 34.7% 32.5% € Millions Q4 FY25 Q4 FY24 FY25 FY24 Europe Building Products Segment EBIT 12.6€ 12.1€ 35.4€ 41.5€ Europe Building Products Segment net sales 127.7 118.0 460.6 444.5 Europe Building Products Segment EBIT margin 9.9% 10.3% 7.7% 9.3% Depreciation and amortization 8.1 7.6 30.2 27.4 Europe Building Products Segment EBITDA 20.7€ 19.7€ 65.6€ 68.9€ Europe Building Products Segment EBITDA Margin 16.2% 16.7% 14.2% 15.5% Quarter and Full Year Ended 31 March Europe Building Products Segment EBIT and EBITDA Quarter and Full Year Ended 31 March Non-GAAP Financial Measures 1) Calculated as Total Assets minus Current Liabilities as reported in our financial results; adjusted by: (i) excluding balance sheet items related to legacy issues (such as asbestos adjustments), dividends payable and deferred taxes; (ii) adding back asset impairment charges in the relevant period, unless otherwise determined by the People & Remuneration Committee; (iii) deducting all greenfield construction-in-progress, and any brownfield construction-in-progress projects involving capacity expansion that are individually greater than US$20 million, until such assets reach commercial production and are transferred to the fixed asset register and assets held for sale; and (iv) proceeds from the Term Loan A not currently employed. Free Cash Flow US$ Millions Full Year Ended 31 March FY25 FY24 Net cash provided by operating activities 802.8$ 914.2$ Purchases of property, plant and equipment (422.2) (449.3) Free Cash Flow 380.6$ 464.9$