
1 Q1 FY26 EARNINGS PRESENTATION First Quarter FY26 Earnings Presentation Tuesday, August 19th

2 Q1 FY26 EARNINGS PRESENTATION Cautionary Note and Use of Non-GAAP Measures This Earnings Presentation contains forward looking statements within the meaning of the Private Securities Litigation Reform Act of 1995. James Hardie Industries plc (the “Company”) may from time to time make forward-looking statements in its periodic reports filed with or furnished to the Securities and Exchange Commission on Forms 20-F and 6-K, in its annual reports to shareholders, in media releases and other written materials and in oral statements made by the Company’s officers, directors or employees to analysts, institutional investors, representatives of the media and others. Words such as “believe,” “anticipate,” “plan,” “expect,” “intend,” “target,” “estimate,” “project,” “predict,” “forecast,” “guideline,” “aim,” “will,” “should,” “likely,” “continue,” “may,” “objective,” “outlook” and similar expressions are intended to identify forward-looking statements but are not the exclusive means of identifying such statements. These forward-looking statements are based upon management's current expectations, estimates, assumptions, beliefs and general good faith evaluation of information available at the time the forward-looking statements were made concerning future events and conditions. Readers are cautioned not to place undue reliance on any forward-looking statements or rely upon them as a guarantee of future performance or results or as an accurate indication of the times at or by which any such performance or results will be achieved. Forward-looking statements are necessarily subject to risks, uncertainties and other factors, many of which are unforeseeable and beyond the Company’s control. Many factors could cause actual results, performance or achievements to be materially different from those expressed or implied in this Earnings Presentation, including, among others, the risks and uncertainties set forth in Section 3 “Risk Factors” in James Hardie’s Annual Report on Form 20-F for the year ended March 31, 2025, which include, but are not necessarily limited to risks such as changes in general economic, political, governmental and business conditions globally and in the countries in which the Company does business; changes in interest rates; changes in inflation rates; changes in exchange rates; the level of construction generally; changes in cement demand and prices; changes in raw material and energy prices; changes in business strategy; the AZEK acquisition and various other factors. Should one or more of these risks or uncertainties materialize, or should underlying assumptions prove incorrect, actual results may vary materially from those described herein. James Hardie assumes no obligation to update or correct the information contained in this Earnings Presentation except as required by law. This Earnings Presentation includes financial measures that are not considered a measure of financial performance under generally accepted accounting principles in the United States (GAAP). These financial measures are designed to provide investors with an alternative method for assessing our performance from on-going operations, capital efficiency and profit generation. Management uses these financial measures for the same purposes. These financial measures are or may be non-GAAP financial measures as defined in the rules of the U.S. Securities and Exchange Commission and may exclude or include amounts that are included or excluded, as applicable, in the calculation of the most directly comparable financial measures calculated in accordance with GAAP. These non-GAAP financial measures should not be considered to be more meaningful than the equivalent GAAP measure. Management has included such measures to provide investors with an alternative method for assessing its operating results in a manner that is focused on the performance of its ongoing operations and excludes the impact of certain legacy items, such as asbestos adjustments, or significant non-recurring items, such as asset impairments, restructuring expenses, acquisition and pre-close financing related costs, as well as adjustments to tax expense. Additionally, management uses such non-GAAP financial measures for the same purposes. However, these non-GAAP financial measures are not prepared in accordance with GAAP, may not be reported by all of the Company’s competitors and may not be directly comparable to similarly titled measures of the Company’s competitors due to potential differences in the exact method of calculation. For additional information regarding the non-GAAP financial measures presented in this Earnings Presentation, including a reconciliation of each non-GAAP financial measure to the equivalent GAAP measure, see slides titled “Non-GAAP Financial Measures” included in this Earnings Presentation. This Earnings Presentation forms part of a package of information about the Company’s results. It should be read in conjunction with the other parts of this package, including the Management’s Analysis of Results, Condensed Consolidated Financial Statements and Earnings Release All comparisons made are vs. the comparable period in the prior fiscal year and amounts presented are in US dollars, unless otherwise noted. Investor Contact Joe Ahlersmeyer, CFA Vice President, Investor Relations [email protected]
3 Q1 FY26 EARNINGS PRESENTATION Agenda Aaron Erter CHIEF EXECUTIVE OFFICER Rachel Wilson CHIEF FINANCIAL OFFICER 1 Key Messages & Q1 Business Performance 2 James Hardie Strategic Update 3 AZEK Integration & Synergy Progress 4 Financial Results & Guidance 5 Q&A 6 Modeling Considerations
4 Q1 FY26 EARNINGS PRESENTATION Key Messages Working Safely Through Zero Harm and Generating Savings through the Hardie Operating System (HOS) Winning Share in Fiber Cement Through Focused Strategies Q1 Results Directionally as Anticipated, Adjusting Outlook for Softer Markets AZEK Integration & Synergy Capture Well Underway Post Closing Positioning to Grow the Combined Business At Scale
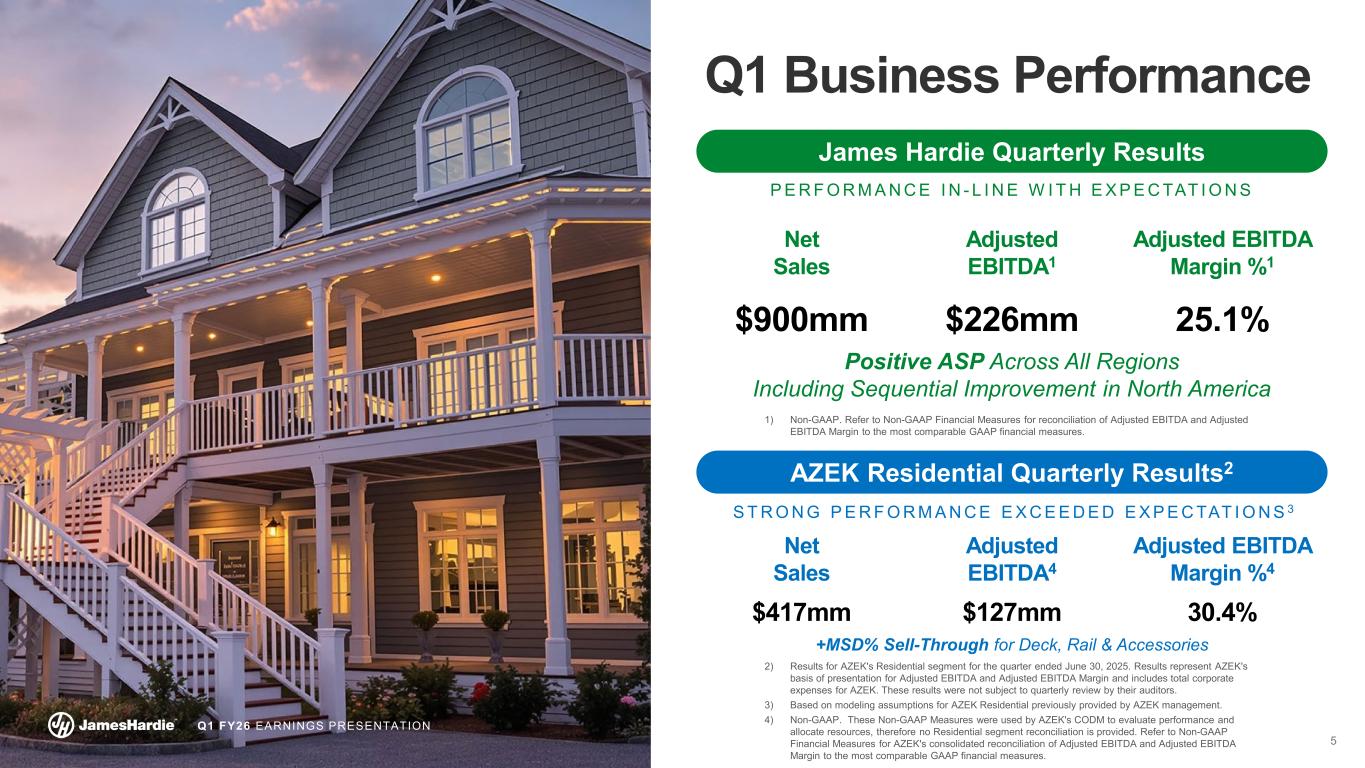
5 Q1 FY26 EARNINGS PRESENTATION Net Sales Adjusted EBITDA4 Adjusted EBITDA Margin %4 $417mm $127mm 30.4% Q1 Business Performance AZEK Residential Quarterly Results2 +MSD% Sell-Through for Deck, Rail & Accessories1) x 2) Results for AZEK's Residential segment for the quarter ended June 30, 2025. Results represent AZEK's basis of presentation for Adjusted EBITDA and Adjusted EBITDA Margin and includes total corporate expenses for AZEK. These results were not subject to quarterly review by their auditors. 3) Based on modeling assumptions for AZEK Residential previously provided by AZEK management. 4) Non-GAAP. These Non-GAAP Measures were used by AZEK's CODM to evaluate performance and allocate resources, therefore no Residential segment reconciliation is provided. Refer to Non-GAAP Financial Measures for AZEK's consolidated reconciliation of Adjusted EBITDA and Adjusted EBITDA Margin to the most comparable GAAP financial measures. James Hardie Quarterly Results Positive ASP Across All Regions Including Sequential Improvement in North America Net Sales Adjusted EBITDA1 Adjusted EBITDA Margin %1 $900mm $226mm 25.1% P E R F O R M A N C E I N - L I N E W I T H E X P E C TAT I O N S S T R O N G P E R F O R M A N C E E X C E E D E D E X P E C TAT I O N S 3 1) Non-GAAP. Refer to Non-GAAP Financial Measures for reconciliation of Adjusted EBITDA and Adjusted EBITDA Margin to the most comparable GAAP financial measures.
6 Q1 FY26 EARNINGS PRESENTATION James Hardie Strategic Update H O M E O W N E R F O C U S E D , C U S T O M E R A N D C O N T R A C T O R D R I V E N 1 Focusing Across the Customer Value Chain to Drive Material Conversion in R&R 2 Offering Valued Solutions to Partner for Growth With Large Single-Family Homebuilders 3 Earning Recognition for Our Leadership Through Innovation 4 Generating Savings Through Our Global HOS Programs and Initiatives 5 Executing on Our Right-to-Win in Australia & New Zealand and Europe
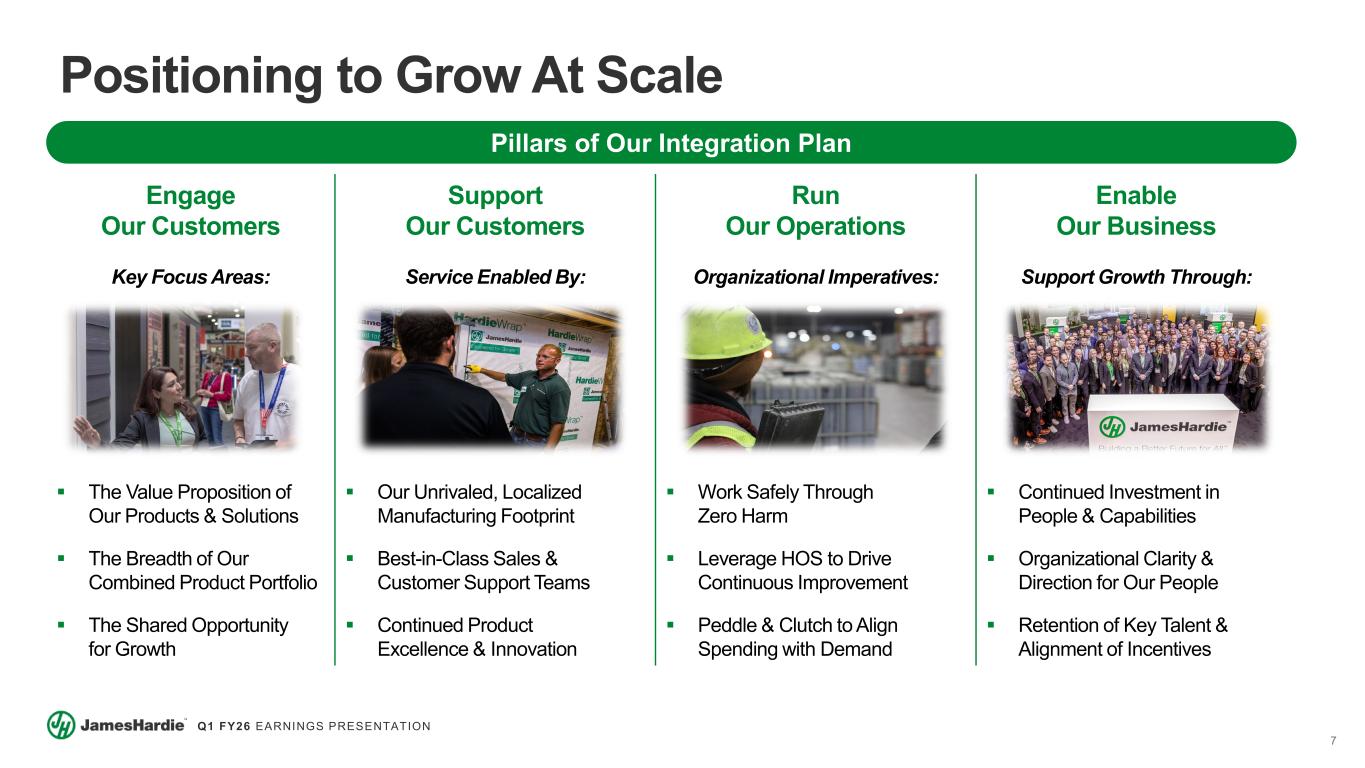
7 Q1 FY26 EARNINGS PRESENTATION Positioning to Grow At Scale Pillars of Our Integration Plan Engage Our Customers Key Focus Areas: The Value Proposition of Our Products & Solutions The Breadth of Our Combined Product Portfolio The Shared Opportunity for Growth Support Our Customers Service Enabled By: Our Unrivaled, Localized Manufacturing Footprint Best-in-Class Sales & Customer Support Teams Continued Product Excellence & Innovation Run Our Operations Organizational Imperatives: Work Safely Through Zero Harm Leverage HOS to Drive Continuous Improvement Peddle & Clutch to Align Spending with Demand Enable Our Business Support Growth Through: Continued Investment in People & Capabilities Organizational Clarity & Direction for Our People Retention of Key Talent & Alignment of Incentives
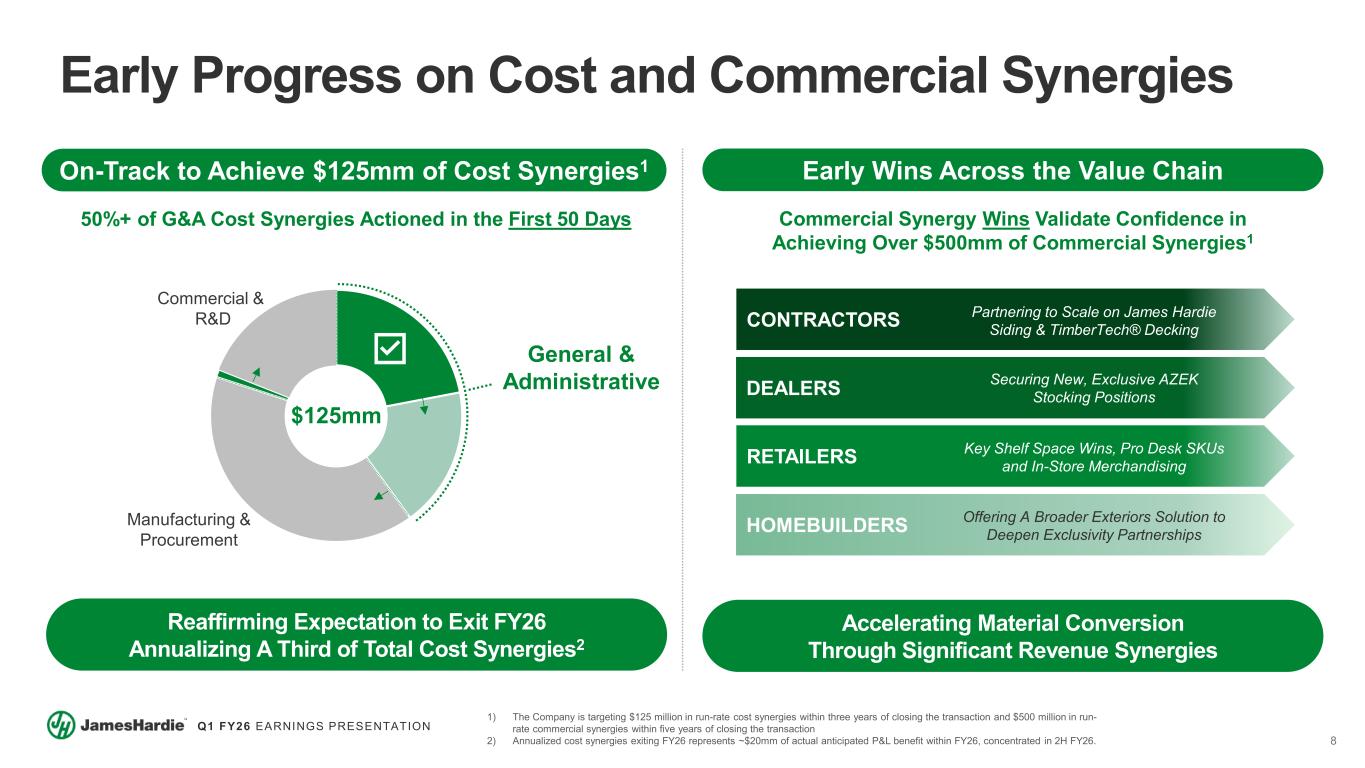
8 Q1 FY26 EARNINGS PRESENTATION Early Progress on Cost and Commercial Synergies On-Track to Achieve $125mm of Cost Synergies1 Early Wins Across the Value Chain Reaffirming Expectation to Exit FY26 Annualizing A Third of Total Cost Synergies2 Accelerating Material Conversion Through Significant Revenue Synergies 50%+ of G&A Cost Synergies Actioned in the First 50 Days 1) The Company is targeting $125 million in run-rate cost synergies within three years of closing the transaction and $500 million in run- rate commercial synergies within five years of closing the transaction 2) Annualized cost synergies exiting FY26 represents ~$20mm of actual anticipated P&L benefit within FY26, concentrated in 2H FY26. Commercial Synergy Wins Validate Confidence in Achieving Over $500mm of Commercial Synergies1 CONTRACTORS DEALERS RETAILERS HOMEBUILDERS Partnering to Scale on James Hardie Siding & TimberTech® Decking Securing New, Exclusive AZEK Stocking Positions Key Shelf Space Wins, Pro Desk SKUs and In-Store Merchandising Offering A Broader Exteriors Solution to Deepen Exclusivity Partnerships Manufacturing & Procurement Commercial & R&D General & Administrative $125mm
9 Q1 FY26 EARNINGS PRESENTATION Successfully Closed Acquisition of The AZEK® Company First Quarter Results Directionally In Line with Expectations Adjusting North America Outlook for Market Demand and Organic Sales Issuing New FY26 Guidance Reflecting Contribution from AZEK Focused on Successful Integration, Rapidly Actioning Cost Synergies Financial Key Messages
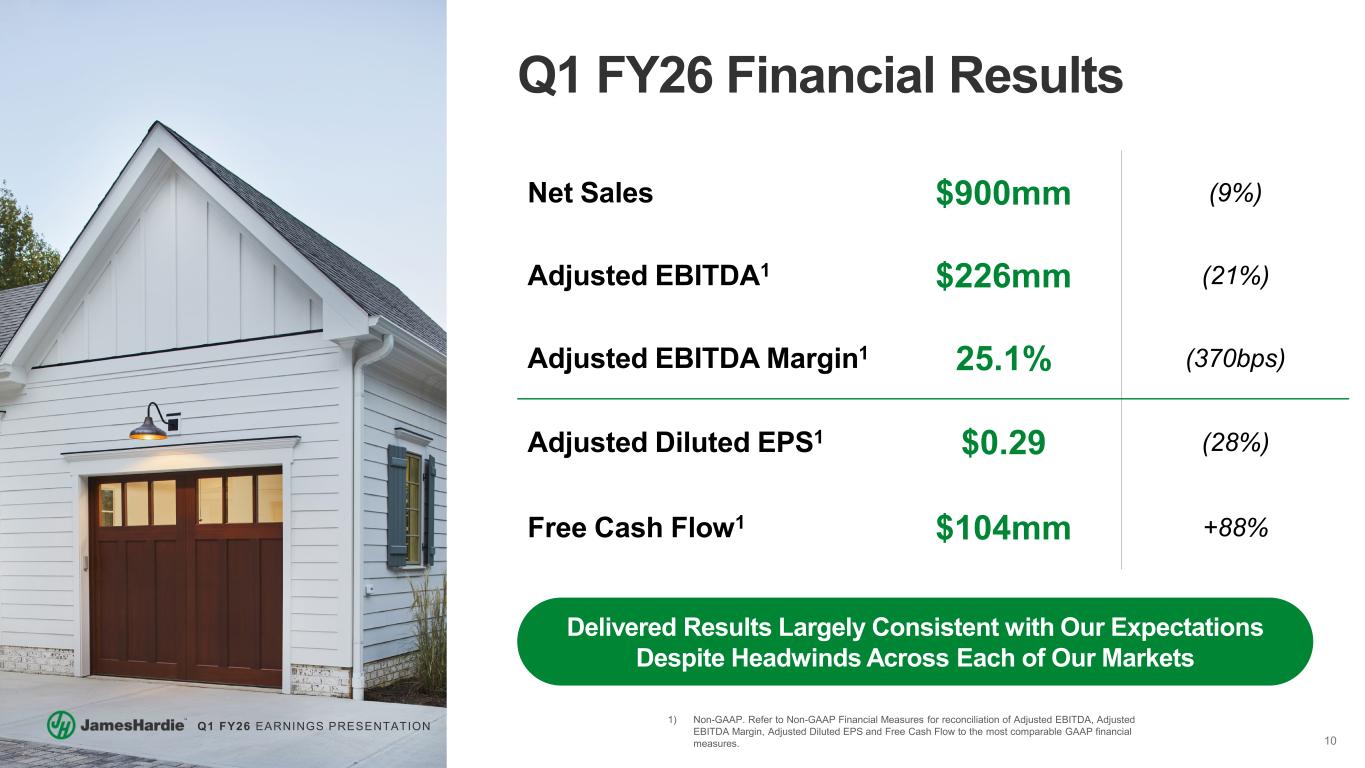
10 Q1 FY26 EARNINGS PRESENTATION Q1 FY26 Financial Results Delivered Results Largely Consistent with Our Expectations Despite Headwinds Across Each of Our Markets Net Sales $900mm (9%) Adjusted EBITDA1 $226mm (21%) Adjusted EBITDA Margin1 25.1% (370bps) Adjusted Diluted EPS1 $0.29 (28%) Free Cash Flow1 $104mm +88% 1) Non-GAAP. Refer to Non-GAAP Financial Measures for reconciliation of Adjusted EBITDA, Adjusted EBITDA Margin, Adjusted Diluted EPS and Free Cash Flow to the most comparable GAAP financial measures.
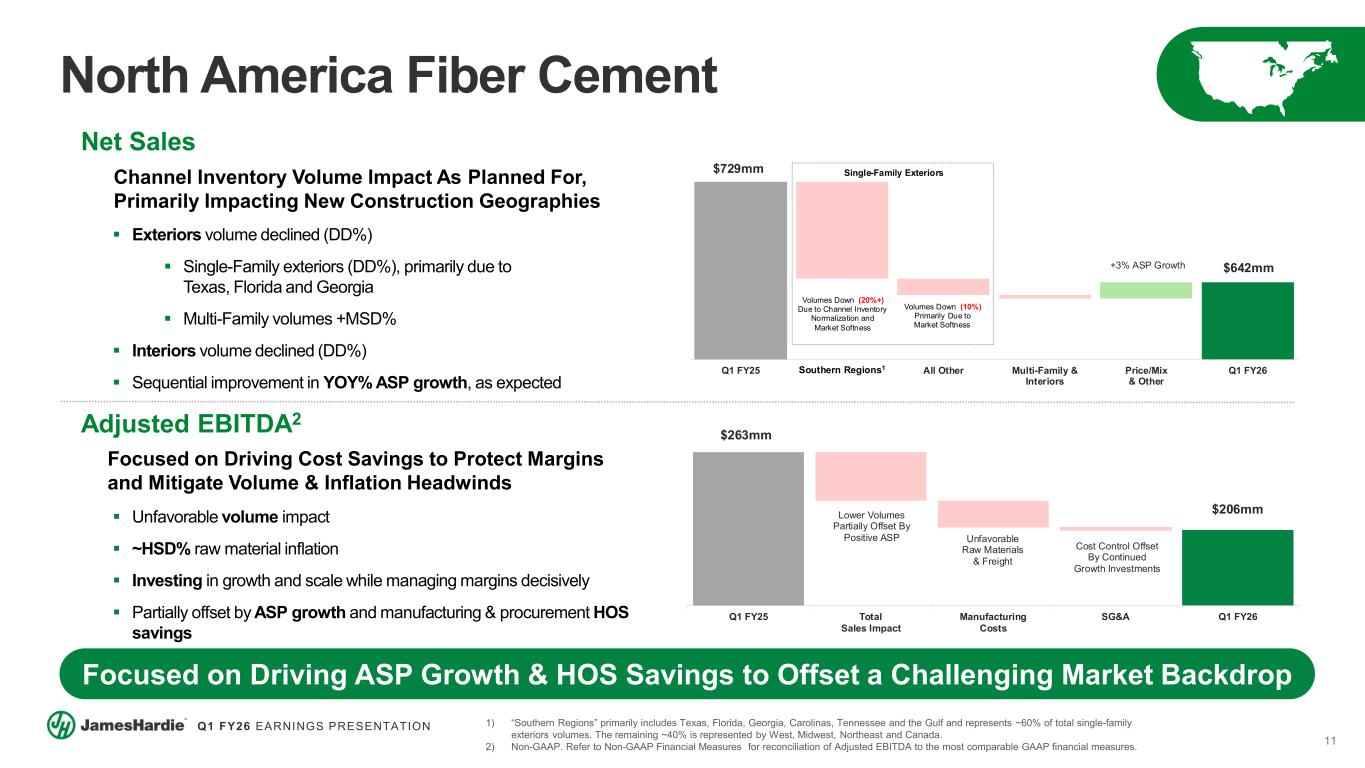
11 Q1 FY26 EARNINGS PRESENTATION $263mm $206mmLower Volumes Partially Offset By Positive ASP Unfavorable Raw Materials & Freight Cost Control Offset By Continued Growth Investments Q1 FY25 Total Sales Impact Manufacturing Costs SG&A Q1 FY26 Net Sales Channel Inventory Volume Impact As Planned For, Primarily Impacting New Construction Geographies Exteriors volume declined (DD%) Single-Family exteriors (DD%), primarily due to Texas, Florida and Georgia Multi-Family volumes +MSD% Interiors volume declined (DD%) Sequential improvement in YOY% ASP growth, as expected $729mm $642mm+3% ASP Growth Q1 FY25 Southern Regions All Other Multi-Family & Interiors Price/Mix & Other Q1 FY26 Volumes Down (20%+) Due to Channel Inventory Normalization and Market Softness Volumes Down (10%) Primarily Due to Market Softness Single-Family Exteriors t er e i s1 North America Fiber Cement Focused on Driving ASP Growth & HOS Savings to Offset a Challenging Market Backdrop Adjusted EBITDA2 Focused on Driving Cost Savings to Protect Margins and Mitigate Volume & Inflation Headwinds Unfavorable volume impact ~HSD% raw material inflation Investing in growth and scale while managing margins decisively Partially offset by ASP growth and manufacturing & procurement HOS savings 1) “Southern Regions” primarily includes Texas, Florida, Georgia, Carolinas, Tennessee and the Gulf and represents ~60% of total single-family exteriors volumes. The remaining ~40% is represented by West, Midwest, Northeast and Canada. 2) Non-GAAP. Refer to Non-GAAP Financial Measures for reconciliation of Adjusted EBITDA to the most comparable GAAP financial measures.
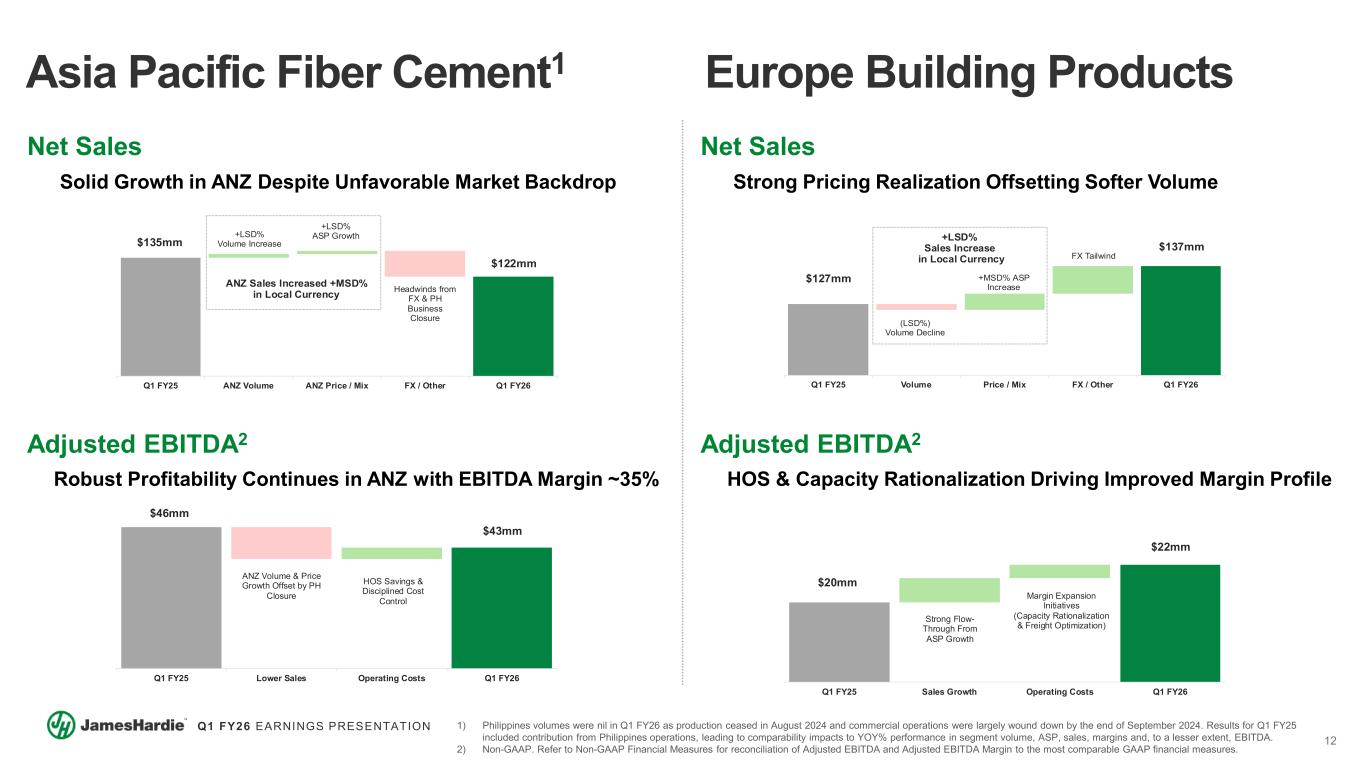
12 Q1 FY26 EARNINGS PRESENTATION $135mm ANZ Sales Increased +MSD% in Local Currency $122mm +LSD% Volume Increase +LSD% ASP Growth Headwinds from FX & PH Business Closure Q1 FY25 ANZ Volume ANZ Price / Mix FX / Other Q1 FY26 $127mm +LSD% Sales Increase in Local Currency $137mm (LSD%) Volume Decline +MSD% ASP Increase FX Tailwind Q1 FY25 Volume Price / Mix FX / Other Q1 FY26 $20mm $22mm Strong Flow- Through From ASP Growth Margin Expansion Initiatives (Capacity Rationalization & Freight Optimization) Q1 FY25 Sales Growth Operating Costs Q1 FY26 $46mm $43mm ANZ Volume & Price Growth Offset by PH Closure HOS Savings & Disciplined Cost Control Q1 FY25 Lower Sales Operating Costs Q1 FY26 Asia Pacific Fiber Cement1 Europe Building Products Net Sales Solid Growth in ANZ Despite Unfavorable Market Backdrop Adjusted EBITDA2 Robust Profitability Continues in ANZ with EBITDA Margin ~35% Net Sales Strong Pricing Realization Offsetting Softer Volume Adjusted EBITDA2 HOS & Capacity Rationalization Driving Improved Margin Profile 1) Philippines volumes were nil in Q1 FY26 as production ceased in August 2024 and commercial operations were largely wound down by the end of September 2024. Results for Q1 FY25 included contribution from Philippines operations, leading to comparability impacts to YOY% performance in segment volume, ASP, sales, margins and, to a lesser extent, EBITDA. 2) Non-GAAP. Refer to Non-GAAP Financial Measures for reconciliation of Adjusted EBITDA and Adjusted EBITDA Margin to the most comparable GAAP financial measures.
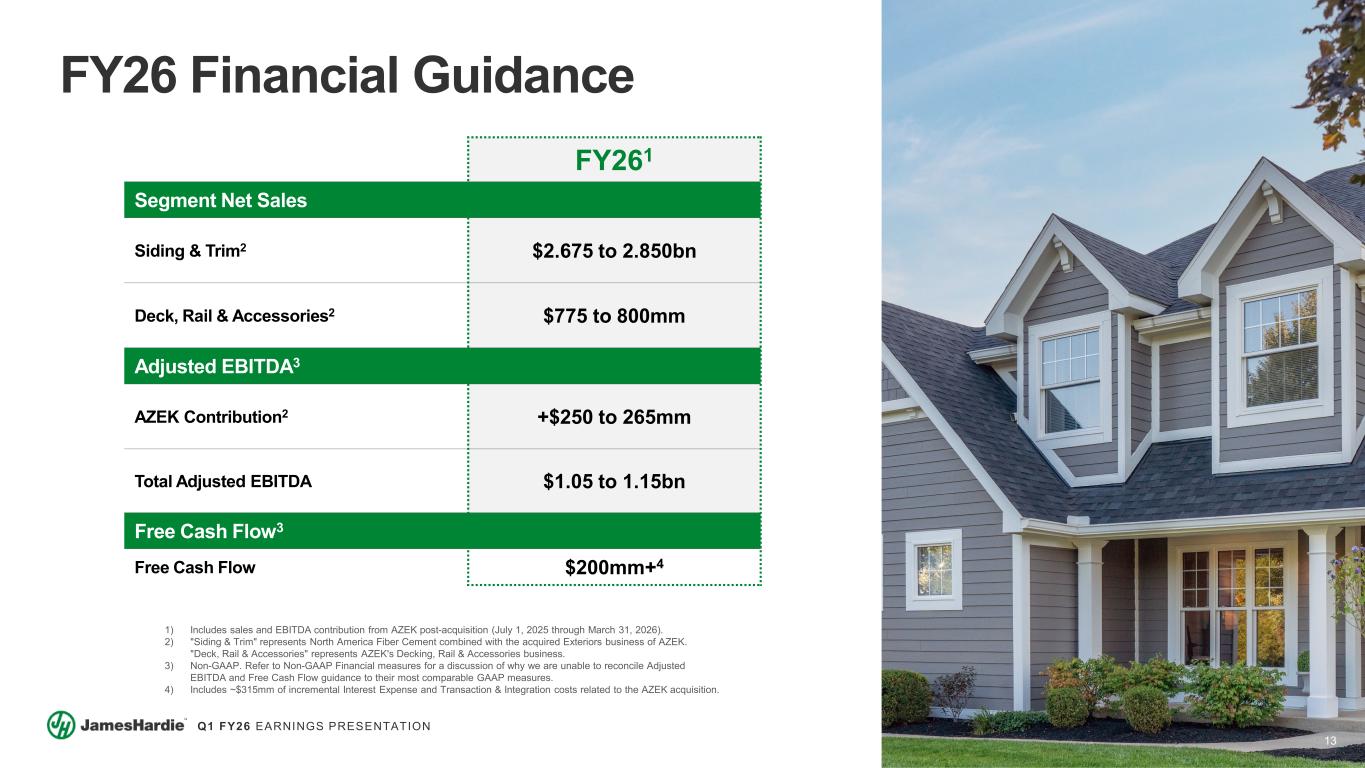
13 Q1 FY26 EARNINGS PRESENTATION FY26 Financial Guidance FY261 Segment Net Sales Siding & Trim2 $2.675 to 2.850bn Deck, Rail & Accessories2 $775 to 800mm Adjusted EBITDA3 AZEK Contribution2 +$250 to 265mm Total Adjusted EBITDA $1.05 to 1.15bn Free Cash Flow3 Free Cash Flow $200mm+4 1) Includes sales and EBITDA contribution from AZEK post-acquisition (July 1, 2025 through March 31, 2026). 2) "Siding & Trim" represents North America Fiber Cement combined with the acquired Exteriors business of AZEK. "Deck, Rail & Accessories" represents AZEK's Decking, Rail & Accessories business. 3) Non-GAAP. Refer to Non-GAAP Financial measures for a discussion of why we are unable to reconcile Adjusted EBITDA and Free Cash Flow guidance to their most comparable GAAP measures. 4) Includes ~$315mm of incremental Interest Expense and Transaction & Integration costs related to the AZEK acquisition.
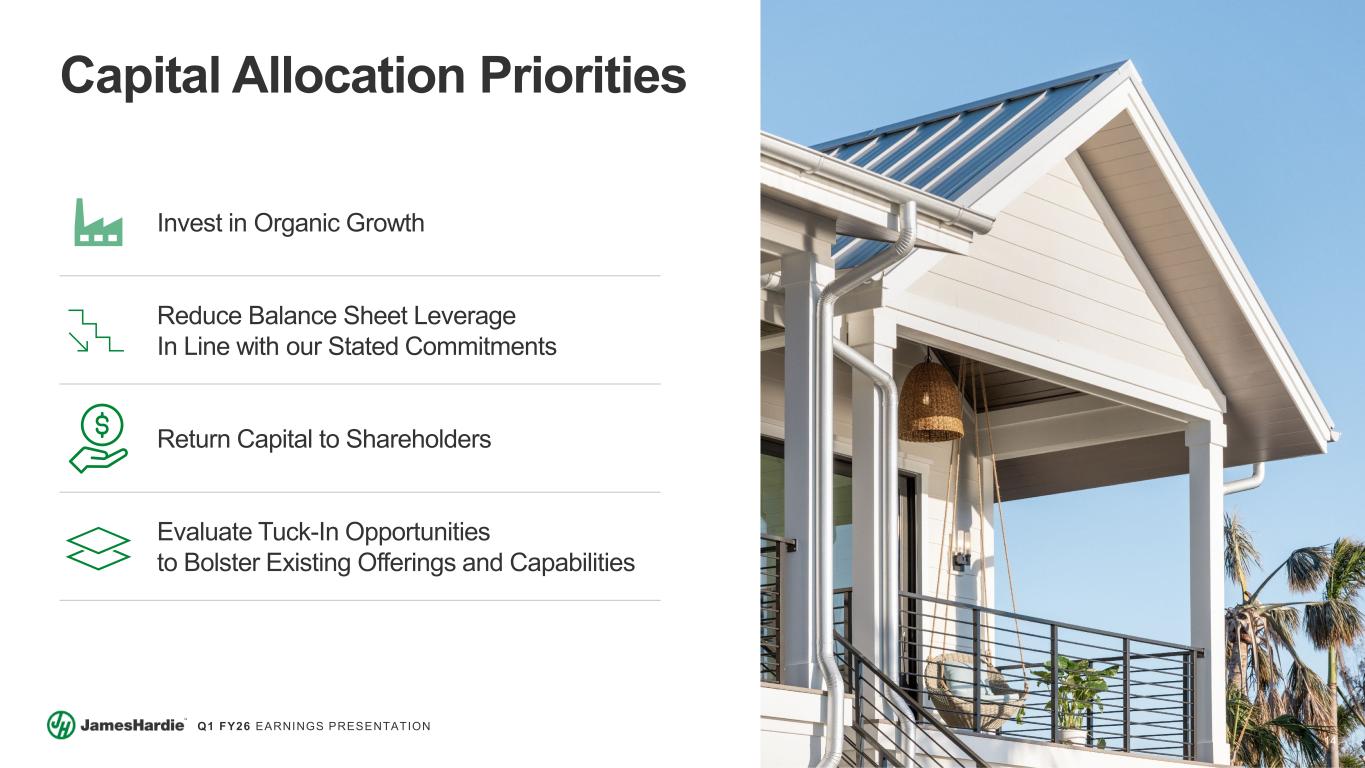
14 Q1 FY26 EARNINGS PRESENTATION Invest in Organic Growth Reduce Balance Sheet Leverage In Line with our Stated Commitments Return Capital to Shareholders Evaluate Tuck-In Opportunities to Bolster Existing Offerings and Capabilities Capital Allocation Priorities

15 Q1 FY26 EARNINGS PRESENTATION A Leader in Exterior Home & Outdoor Living Solutions A Product Portfolio Consisting of Best-in-Class Brands Across Attractive Categories A Winning Strategy to Drive Profitable Growth in R&R and New Construction The Right Team to Enable Our Growth, Innovation and Continuous Improvement Plans Globally A Robust Financial Profile and Synergy Opportunity Driving Shareholder Value Creation

16 Q1 FY26 EARNINGS PRESENTATION Q&A Aaron Erter CHIEF EXECUTIVE OFFICER Rachel Wilson CHIEF FINANCIAL OFFICER
17 Q1 FY26 EARNINGS PRESENTATION MODELING CONSIDERATIONS DRAFT LIVE 17
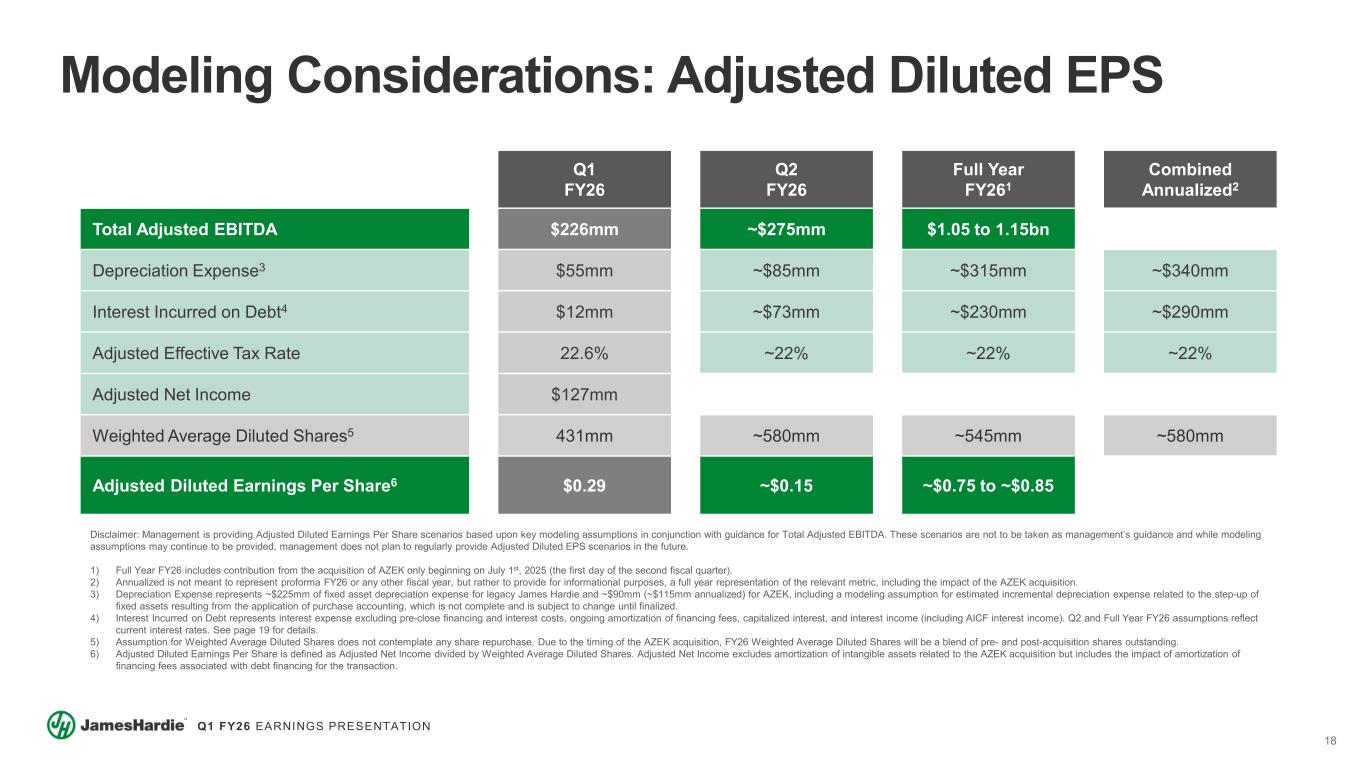
18 Q1 FY26 EARNINGS PRESENTATION Modeling Considerations: Adjusted Diluted EPS Q1 FY26 Q2 FY26 Full Year FY261 Combined Annualized2 Total Adjusted EBITDA $226mm ~$275mm $1.05 to 1.15bn Depreciation Expense3 $55mm ~$85mm ~$315mm ~$340mm Interest Incurred on Debt4 $12mm ~$73mm ~$230mm ~$290mm Adjusted Effective Tax Rate 22.6% ~22% ~22% ~22% Adjusted Net Income $127mm Weighted Average Diluted Shares5 431mm ~580mm ~545mm ~580mm Adjusted Diluted Earnings Per Share6 $0.29 ~$0.15 ~$0.75 to ~$0.85 Disclaimer: Management is providing Adjusted Diluted Earnings Per Share scenarios based upon key modeling assumptions in conjunction with guidance for Total Adjusted EBITDA. These scenarios are not to be taken as management’s guidance and while modeling assumptions may continue to be provided, management does not plan to regularly provide Adjusted Diluted EPS scenarios in the future. 1) Full Year FY26 includes contribution from the acquisition of AZEK only beginning on July 1st, 2025 (the first day of the second fiscal quarter). 2) Annualized is not meant to represent proforma FY26 or any other fiscal year, but rather to provide for informational purposes, a full year representation of the relevant metric, including the impact of the AZEK acquisition. 3) Depreciation Expense represents ~$225mm of fixed asset depreciation expense for legacy James Hardie and ~$90mm (~$115mm annualized) for AZEK, including a modeling assumption for estimated incremental depreciation expense related to the step-up of fixed assets resulting from the application of purchase accounting, which is not complete and is subject to change until finalized. 4) Interest Incurred on Debt represents interest expense excluding pre-close financing and interest costs, ongoing amortization of financing fees, capitalized interest, and interest income (including AICF interest income). Q2 and Full Year FY26 assumptions reflect current interest rates. See page 19 for details. 5) Assumption for Weighted Average Diluted Shares does not contemplate any share repurchase. Due to the timing of the AZEK acquisition, FY26 Weighted Average Diluted Shares will be a blend of pre- and post-acquisition shares outstanding. 6) Adjusted Diluted Earnings Per Share is defined as Adjusted Net Income divided by Weighted Average Diluted Shares. Adjusted Net Income excludes amortization of intangible assets related to the AZEK acquisition but includes the impact of amortization of financing fees associated with debt financing for the transaction.
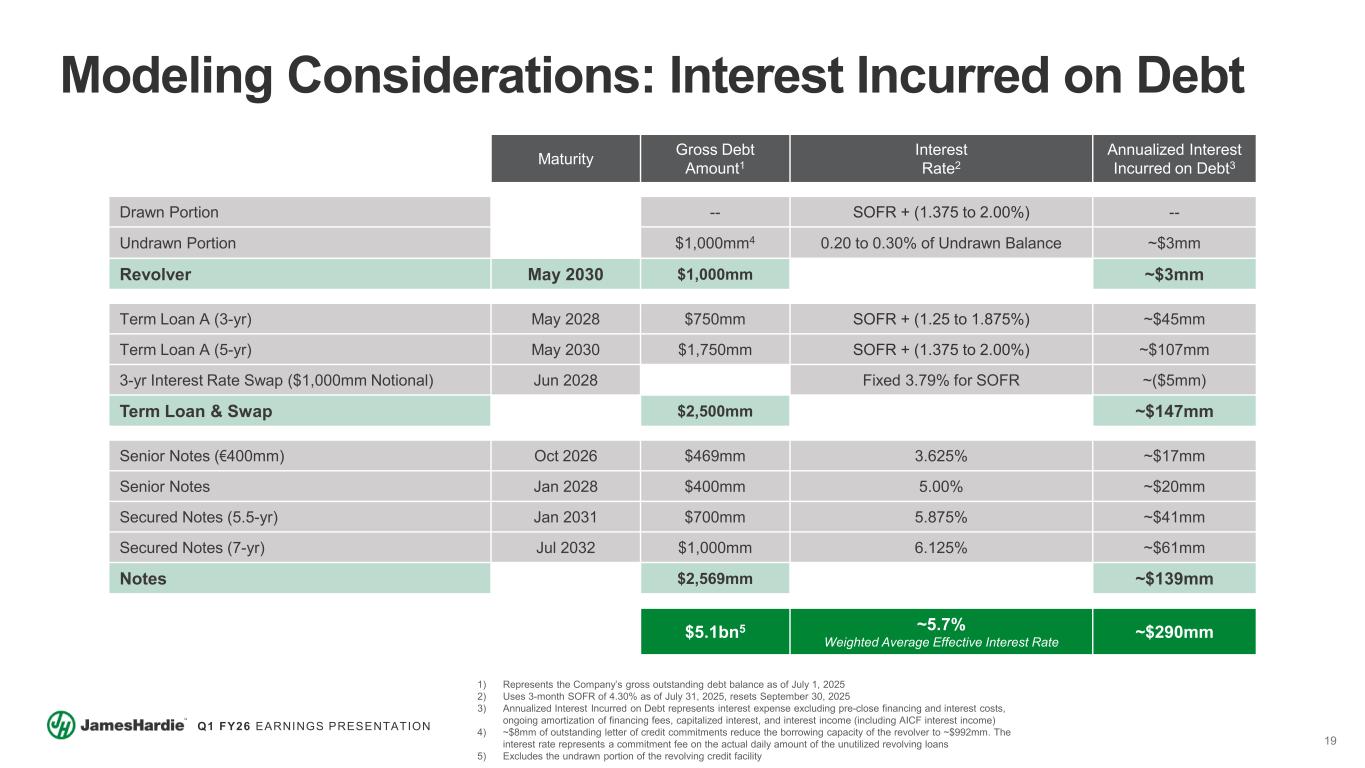
19 Q1 FY26 EARNINGS PRESENTATION Modeling Considerations: Interest Incurred on Debt Maturity Gross Debt Amount1 Interest Rate2 Annualized Interest Incurred on Debt3 Drawn Portion -- SOFR + (1.375 to 2.00%) -- Undrawn Portion $1,000mm4 0.20 to 0.30% of Undrawn Balance ~$3mm Revolver May 2030 $1,000mm ~$3mm Term Loan A (3-yr) May 2028 $750mm SOFR + (1.25 to 1.875%) ~$45mm Term Loan A (5-yr) May 2030 $1,750mm SOFR + (1.375 to 2.00%) ~$107mm 3-yr Interest Rate Swap ($1,000mm Notional) Jun 2028 Fixed 3.79% for SOFR ~($5mm) Term Loan & Swap $2,500mm ~$147mm Senior Notes (€400mm) Oct 2026 $469mm 3.625% ~$17mm Senior Notes Jan 2028 $400mm 5.00% ~$20mm Secured Notes (5.5-yr) Jan 2031 $700mm 5.875% ~$41mm Secured Notes (7-yr) Jul 2032 $1,000mm 6.125% ~$61mm Notes $2,569mm ~$139mm $5.1bn5 ~5.7% Weighted Average Effective Interest Rate ~$290mm 1) Represents the Company’s gross outstanding debt balance as of July 1, 2025 2) Uses 3-month SOFR of 4.30% as of July 31, 2025, resets September 30, 2025 3) Annualized Interest Incurred on Debt represents interest expense excluding pre-close financing and interest costs, ongoing amortization of financing fees, capitalized interest, and interest income (including AICF interest income) 4) ~$8mm of outstanding letter of credit commitments reduce the borrowing capacity of the revolver to ~$992mm. The interest rate represents a commitment fee on the actual daily amount of the unutilized revolving loans 5) Excludes the undrawn portion of the revolving credit facility
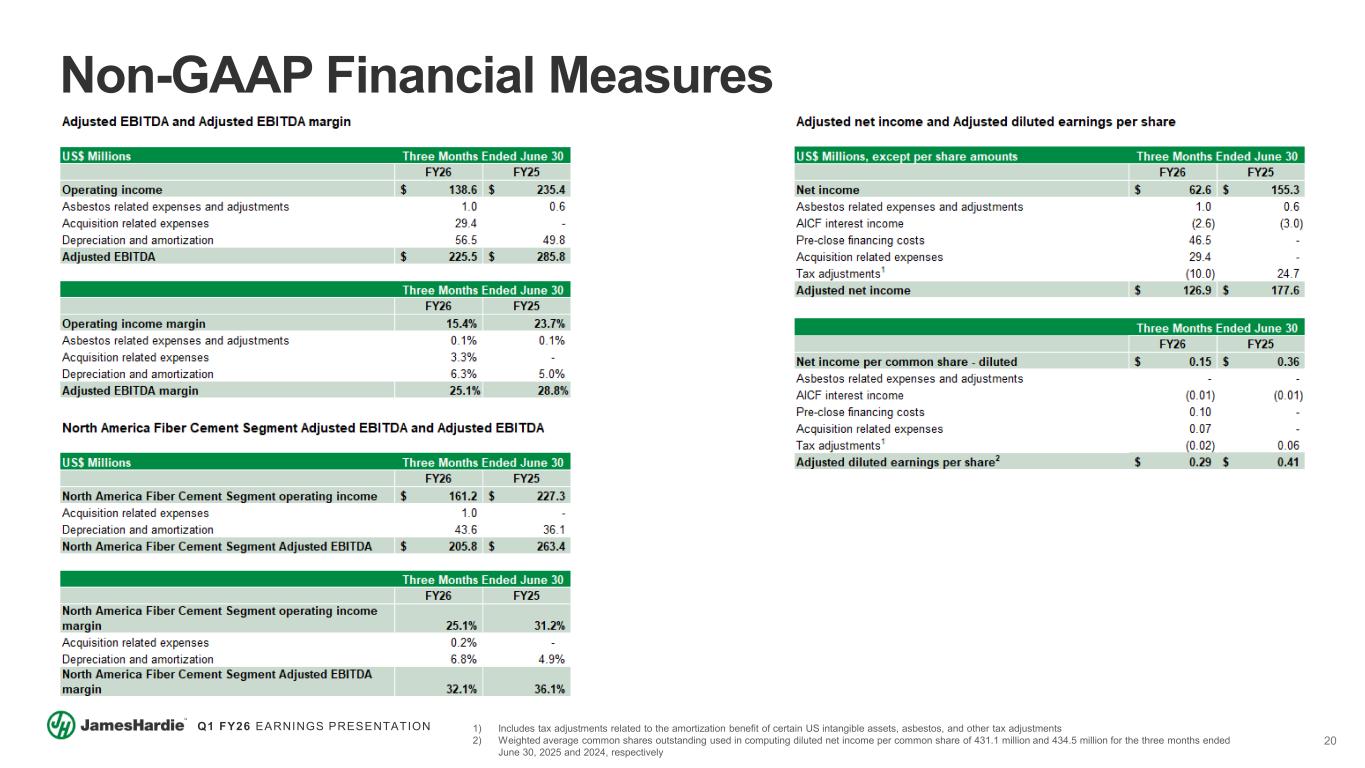
20 Q1 FY26 EARNINGS PRESENTATION Non-GAAP Financial Measures 1) Includes tax adjustments related to the amortization benefit of certain US intangible assets, asbestos, and other tax adjustments 2) Weighted average common shares outstanding used in computing diluted net income per common share of 431.1 million and 434.5 million for the three months ended June 30, 2025 and 2024, respectively
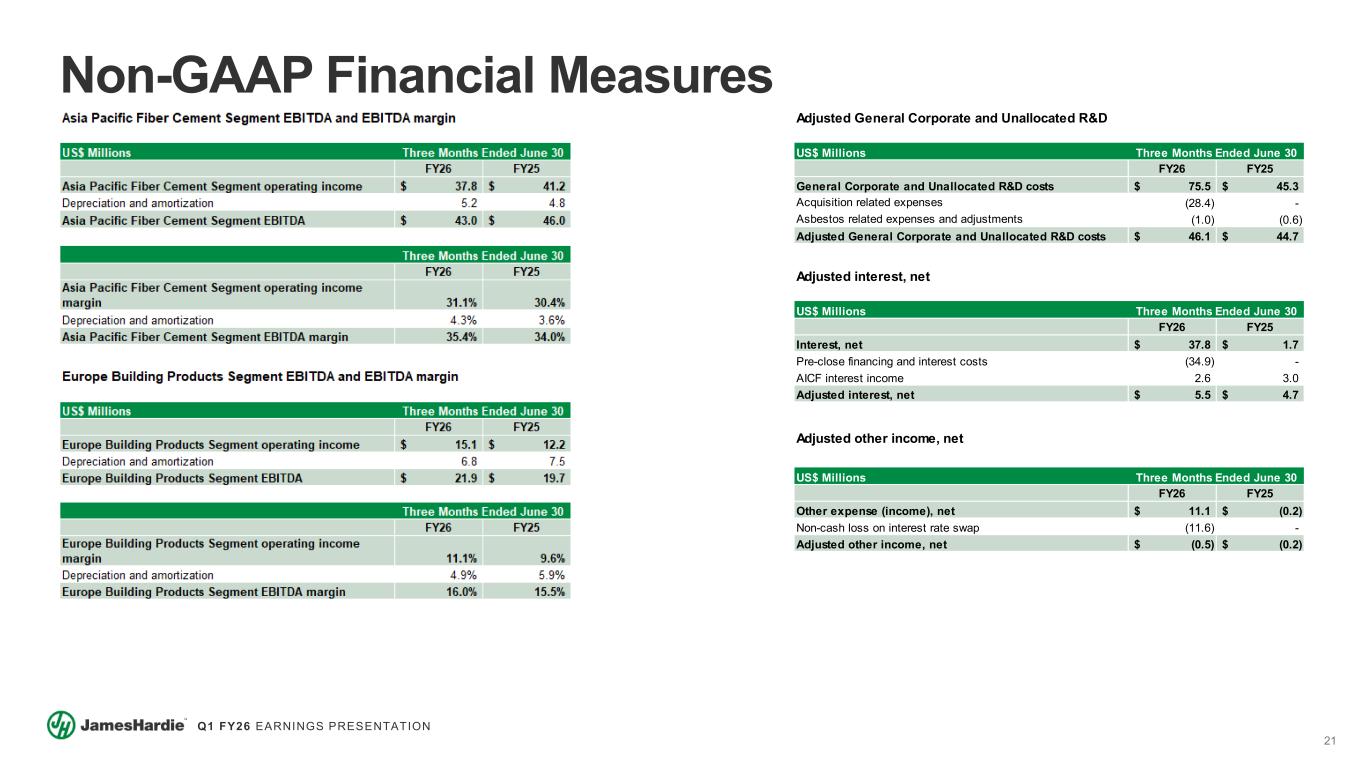
21 Q1 FY26 EARNINGS PRESENTATION Non-GAAP Financial Measures US$ Millions FY26 FY25 General Corporate and Unallocated R&D costs 75.5$ 45.3$ Acquisition related expenses (28.4) - Asbestos related expenses and adjustments (1.0) (0.6) Adjusted General Corporate and Unallocated R&D costs 46.1$ 44.7$ Three Months Ended June 30 Adjusted General Corporate and Unallocated R&D US$ Millions FY26 FY25 Interest, net 37.8$ 1.7$ Pre-close financing and interest costs (34.9) - AICF interest income 2.6 3.0 Adjusted interest, net 5.5$ 4.7$ Adjusted interest, net Three Months Ended June 30 US$ Millions FY26 FY25 Other expense (income), net 11.1$ (0.2)$ Non-cash loss on interest rate swap (11.6) - Adjusted other income, net (0.5)$ (0.2)$ Adjusted other income, net Three Months Ended June 30
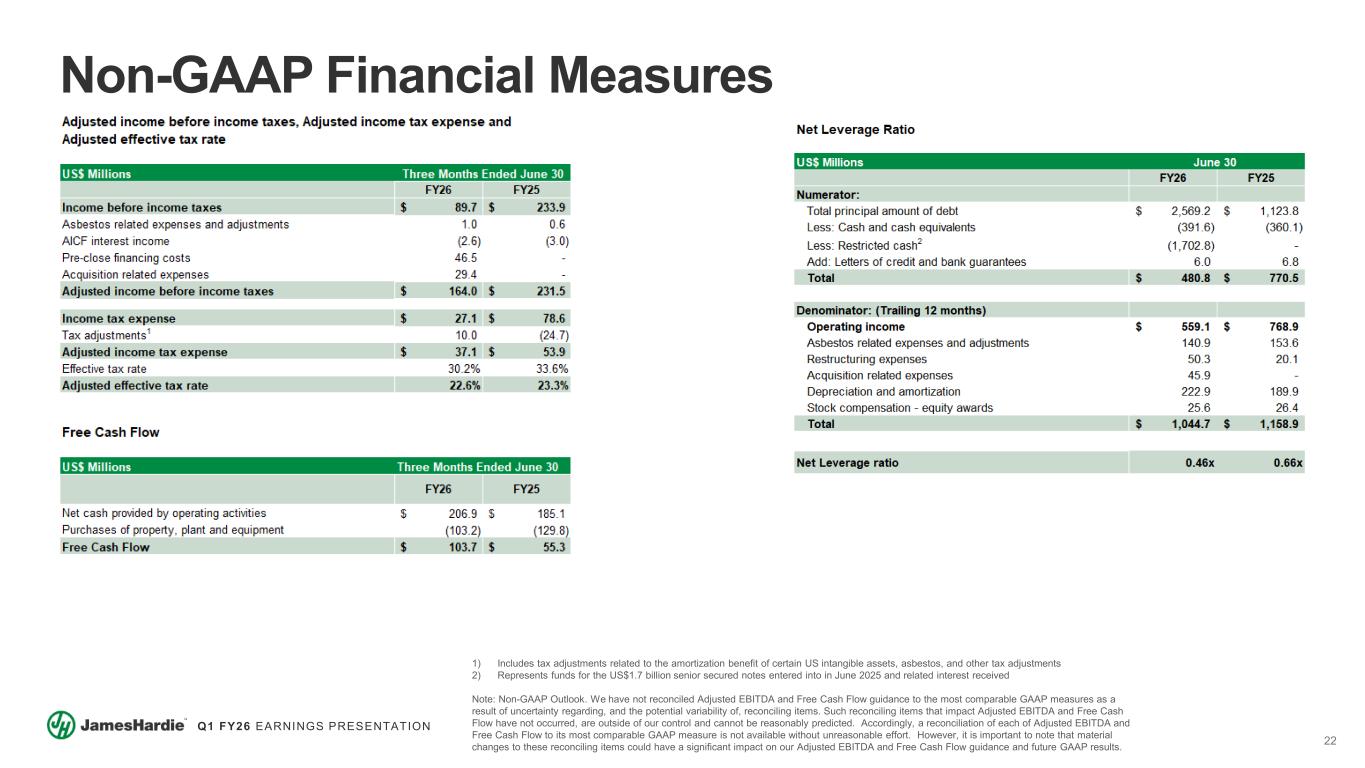
22 Q1 FY26 EARNINGS PRESENTATION Non-GAAP Financial Measures 1) Includes tax adjustments related to the amortization benefit of certain US intangible assets, asbestos, and other tax adjustments 2) Represents funds for the US$1.7 billion senior secured notes entered into in June 2025 and related interest received Note: Non-GAAP Outlook. We have not reconciled Adjusted EBITDA and Free Cash Flow guidance to the most comparable GAAP measures as a result of uncertainty regarding, and the potential variability of, reconciling items. Such reconciling items that impact Adjusted EBITDA and Free Cash Flow have not occurred, are outside of our control and cannot be reasonably predicted. Accordingly, a reconciliation of each of Adjusted EBITDA and Free Cash Flow to its most comparable GAAP measure is not available without unreasonable effort. However, it is important to note that material changes to these reconciling items could have a significant impact on our Adjusted EBITDA and Free Cash Flow guidance and future GAAP results.
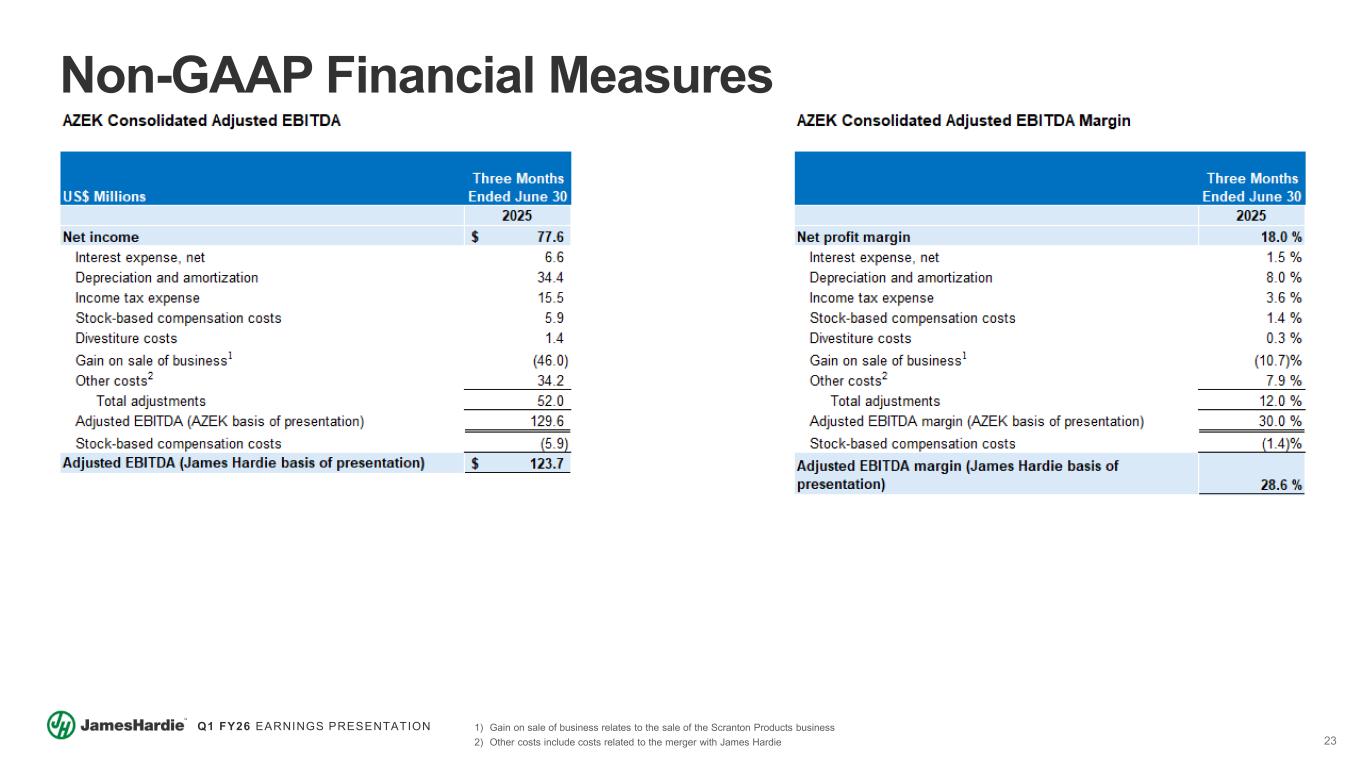
23 Q1 FY26 EARNINGS PRESENTATION Non-GAAP Financial Measures 1) Gain on sale of business relates to the sale of the Scranton Products business 2) Other costs include costs related to the merger with James Hardie
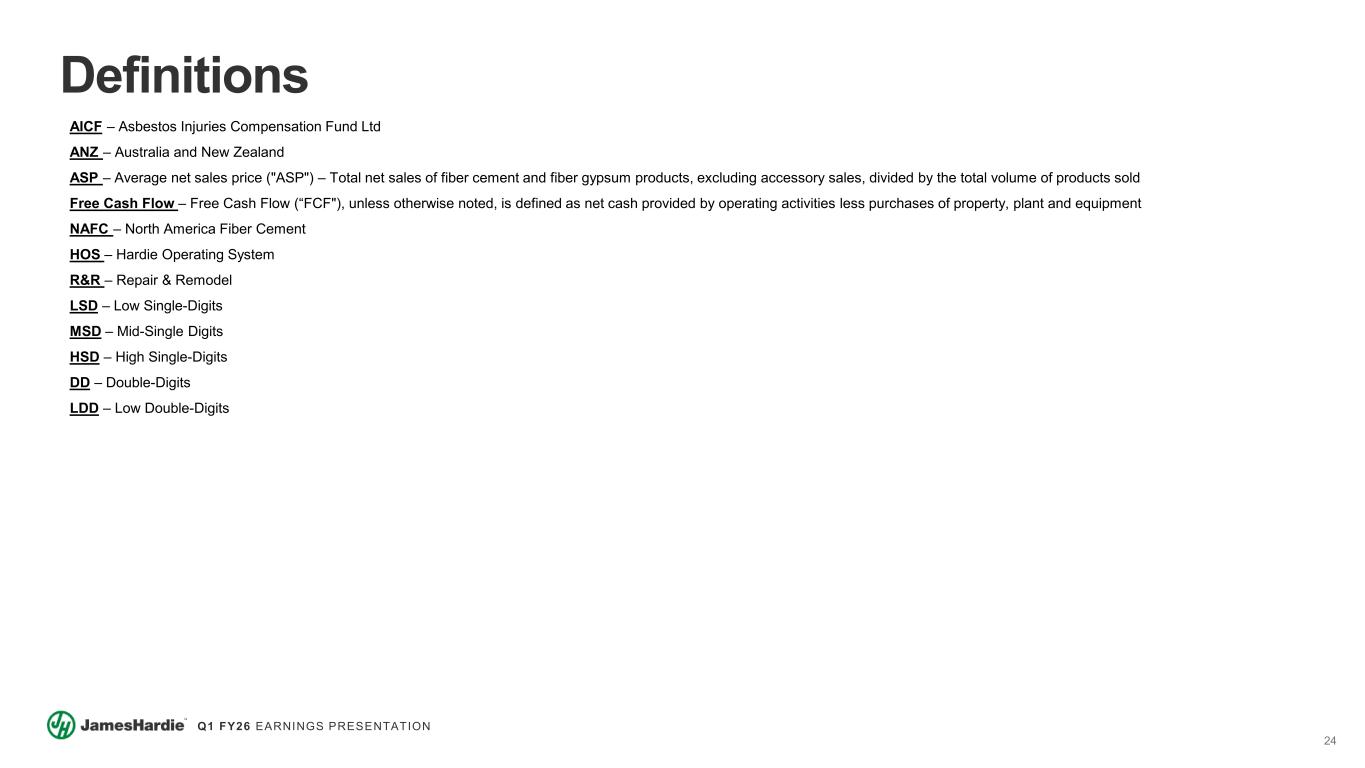
24 Q1 FY26 EARNINGS PRESENTATION Definitions AICF – Asbestos Injuries Compensation Fund Ltd ANZ – Australia and New Zealand ASP – Average net sales price ("ASP") – Total net sales of fiber cement and fiber gypsum products, excluding accessory sales, divided by the total volume of products sold Free Cash Flow – Free Cash Flow (“FCF"), unless otherwise noted, is defined as net cash provided by operating activities less purchases of property, plant and equipment NAFC – North America Fiber Cement HOS – Hardie Operating System R&R – Repair & Remodel LSD – Low Single-Digits MSD – Mid-Single Digits HSD – High Single-Digits DD – Double-Digits LDD – Low Double-Digits