2 October, 2025 SYDNEY and CHICAGO, October 2, 2025 – James Hardie Industries plc (ASX/NYSE: JHX) (James Hardie) refers to the attached material regarding its compensation structure and alignment which will be made available on its website. This communication has been authorized by the Board of Directors of James Hardie Industries plc.

Supplementary Presentation: Compensation Structure & Alignment October 1, 2025 © 2023 Warner Bros. Discovery, Inc. or its subsidiaries and affiliates. All trademarks are the property of their respective owners. All rights reserved.
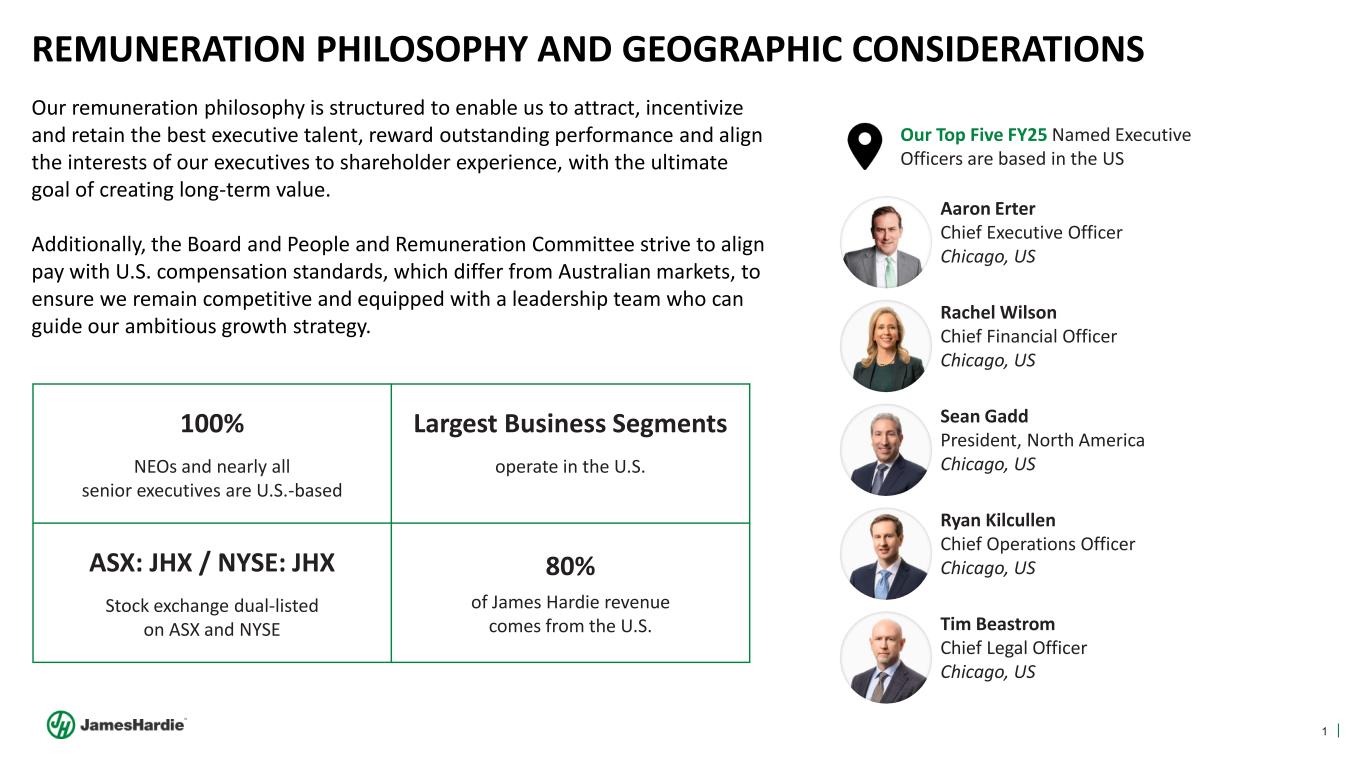
1 REMUNERATION PHILOSOPHY AND GEOGRAPHIC CONSIDERATIONS Our Top Five FY25 Named Executive Officers are based in the US 100% NEOs and nearly all senior executives are U.S.-based Largest Business Segments operate in the U.S. ASX: JHX / NYSE: JHX Stock exchange dual-listed on ASX and NYSE 80% of James Hardie revenue comes from the U.S. Aaron Erter Chief Executive Officer Chicago, US Rachel Wilson Chief Financial Officer Chicago, US Sean Gadd President, North America Chicago, US Tim Beastrom Chief Legal Officer Chicago, US Ryan Kilcullen Chief Operations Officer Chicago, US Our remuneration philosophy is structured to enable us to attract, incentivize and retain the best executive talent, reward outstanding performance and align the interests of our executives to shareholder experience, with the ultimate goal of creating long-term value. Additionally, the Board and People and Remuneration Committee strive to align pay with U.S. compensation standards, which differ from Australian markets, to ensure we remain competitive and equipped with a leadership team who can guide our ambitious growth strategy.
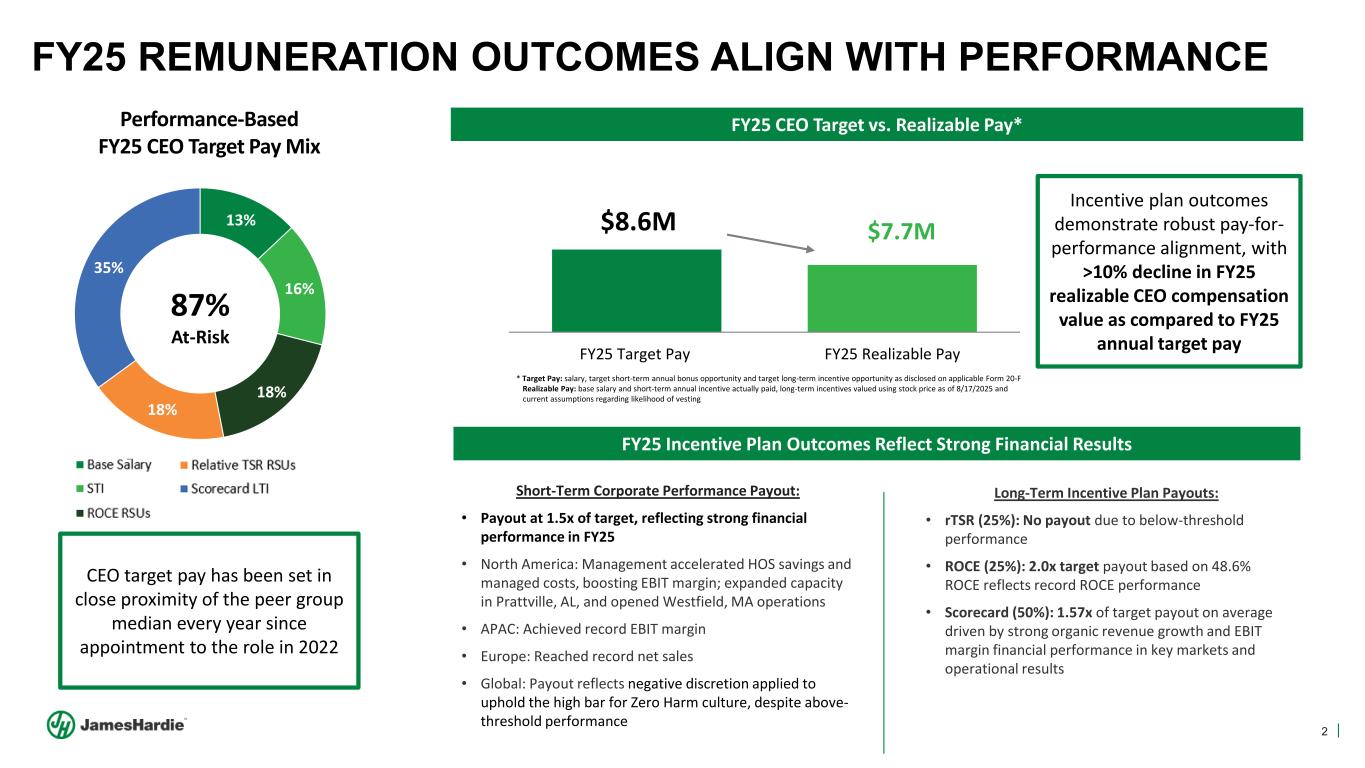
2 13% 16% 18% 18% 35% FY25 REMUNERATION OUTCOMES ALIGN WITH PERFORMANCE Performance-Based FY25 CEO Target Pay Mix 87% At-Risk Short-Term Corporate Performance Payout: • Payout at 1.5x of target, reflecting strong financial performance in FY25 • North America: Management accelerated HOS savings and managed costs, boosting EBIT margin; expanded capacity in Prattville, AL, and opened Westfield, MA operations • APAC: Achieved record EBIT margin • Europe: Reached record net sales • Global: Payout reflects negative discretion applied to uphold the high bar for Zero Harm culture, despite above- threshold performance Long-Term Incentive Plan Payouts: • rTSR (25%): No payout due to below-threshold performance • ROCE (25%): 2.0x target payout based on 48.6% ROCE reflects record ROCE performance • Scorecard (50%): 1.57x of target payout on average driven by strong organic revenue growth and EBIT margin financial performance in key markets and operational results FY25 Target Pay FY25 Realizable Pay FY25 CEO Target vs. Realizable Pay* * Target Pay: salary, target short-term annual bonus opportunity and target long-term incentive opportunity as disclosed on applicable Form 20-F Realizable Pay: base salary and short-term annual incentive actually paid, long-term incentives valued using stock price as of 8/17/2025 and current assumptions regarding likelihood of vesting Incentive plan outcomes demonstrate robust pay-for- performance alignment, with >10% decline in FY25 realizable CEO compensation value as compared to FY25 annual target pay $8.6M $7.7M FY25 Incentive Plan Outcomes Reflect Strong Financial Results CEO target pay has been set in close proximity of the peer group median every year since appointment to the role in 2022
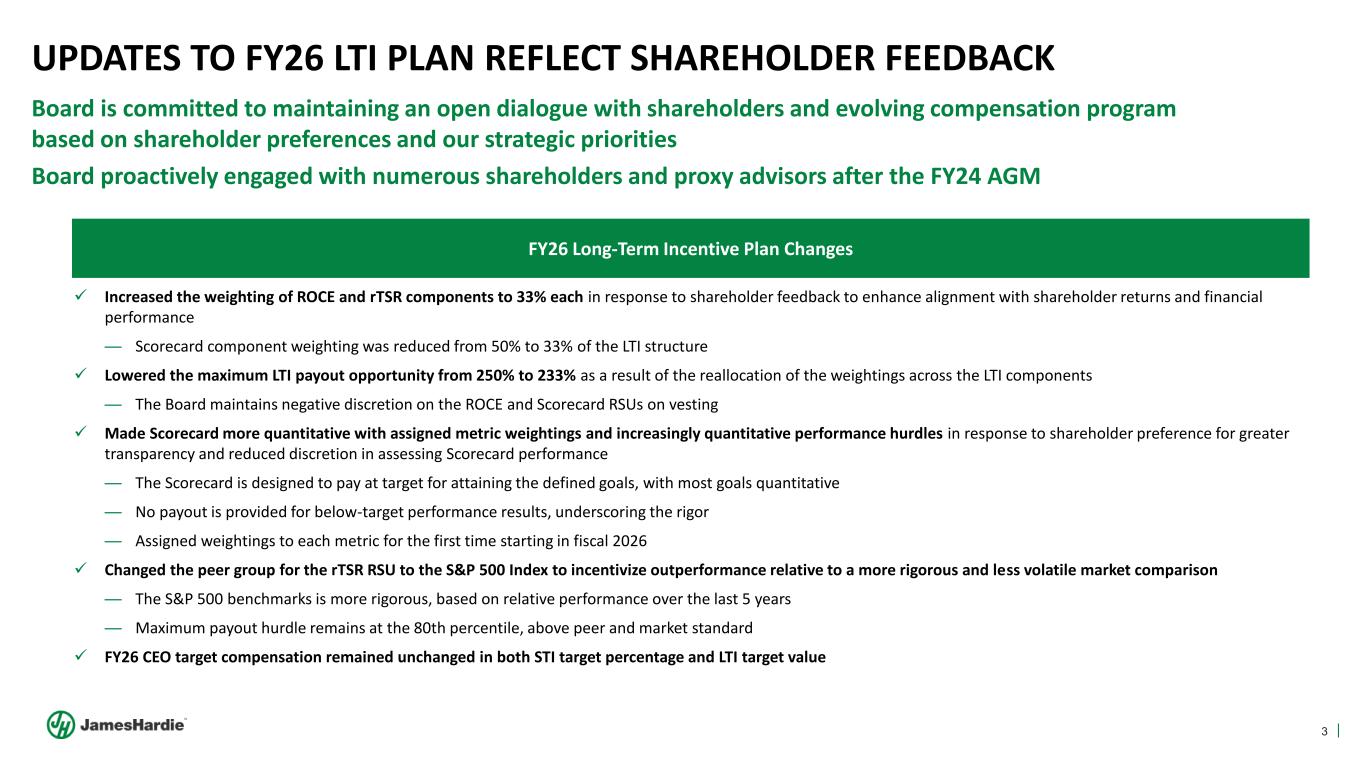
3 UPDATES TO FY26 LTI PLAN REFLECT SHAREHOLDER FEEDBACK ✓ Increased the weighting of ROCE and rTSR components to 33% each in response to shareholder feedback to enhance alignment with shareholder returns and financial performance — Scorecard component weighting was reduced from 50% to 33% of the LTI structure ✓ Lowered the maximum LTI payout opportunity from 250% to 233% as a result of the reallocation of the weightings across the LTI components — The Board maintains negative discretion on the ROCE and Scorecard RSUs on vesting ✓ Made Scorecard more quantitative with assigned metric weightings and increasingly quantitative performance hurdles in response to shareholder preference for greater transparency and reduced discretion in assessing Scorecard performance — The Scorecard is designed to pay at target for attaining the defined goals, with most goals quantitative — No payout is provided for below-target performance results, underscoring the rigor — Assigned weightings to each metric for the first time starting in fiscal 2026 ✓ Changed the peer group for the rTSR RSU to the S&P 500 Index to incentivize outperformance relative to a more rigorous and less volatile market comparison — The S&P 500 benchmarks is more rigorous, based on relative performance over the last 5 years — Maximum payout hurdle remains at the 80th percentile, above peer and market standard ✓ FY26 CEO target compensation remained unchanged in both STI target percentage and LTI target value Board is committed to maintaining an open dialogue with shareholders and evolving compensation program based on shareholder preferences and our strategic priorities Board proactively engaged with numerous shareholders and proxy advisors after the FY24 AGM FY26 Long-Term Incentive Plan Changes
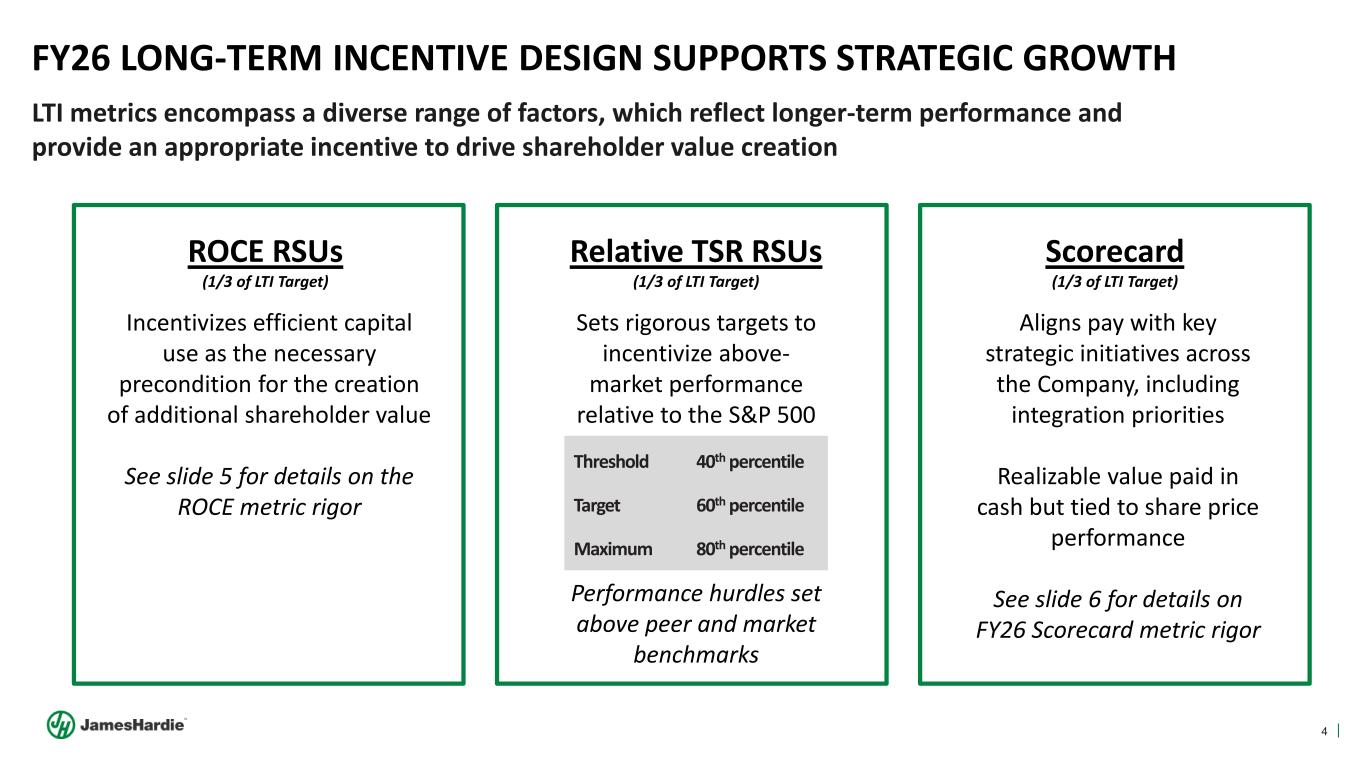
4 FY26 LONG-TERM INCENTIVE DESIGN SUPPORTS STRATEGIC GROWTH Threshold 40th percentile Target 60th percentile Maximum 80th percentile ROCE RSUs (1/3 of LTI Target) Relative TSR RSUs (1/3 of LTI Target) Scorecard (1/3 of LTI Target) Incentivizes efficient capital use as the necessary precondition for the creation of additional shareholder value See slide 5 for details on the ROCE metric rigor Aligns pay with key strategic initiatives across the Company, including integration priorities Realizable value paid in cash but tied to share price performance See slide 6 for details on FY26 Scorecard metric rigor Sets rigorous targets to incentivize above- market performance relative to the S&P 500 Performance hurdles set above peer and market benchmarks LTI metrics encompass a diverse range of factors, which reflect longer-term performance and provide an appropriate incentive to drive shareholder value creation
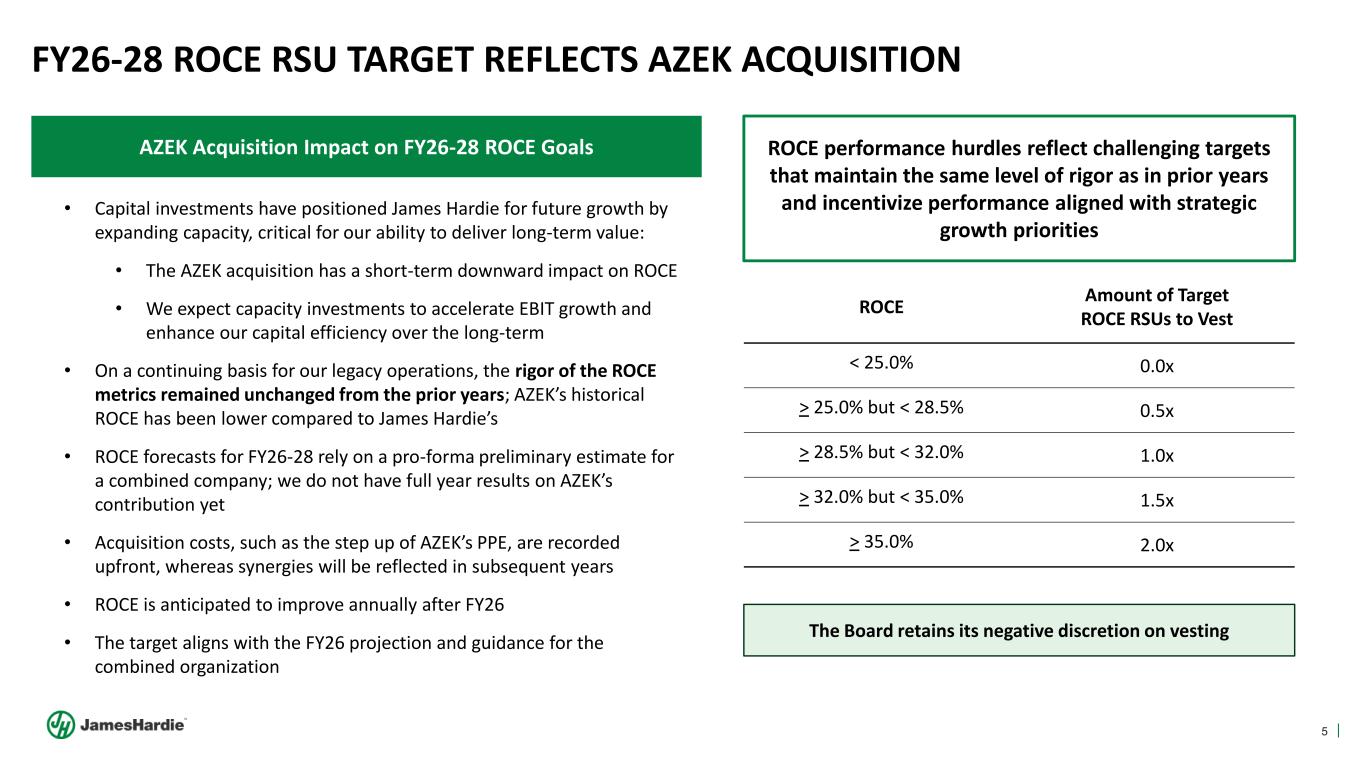
5 FY26-28 ROCE RSU TARGET REFLECTS AZEK ACQUISITION • Capital investments have positioned James Hardie for future growth by expanding capacity, critical for our ability to deliver long-term value: • The AZEK acquisition has a short-term downward impact on ROCE • We expect capacity investments to accelerate EBIT growth and enhance our capital efficiency over the long-term • On a continuing basis for our legacy operations, the rigor of the ROCE metrics remained unchanged from the prior years; AZEK’s historical ROCE has been lower compared to James Hardie’s • ROCE forecasts for FY26-28 rely on a pro-forma preliminary estimate for a combined company; we do not have full year results on AZEK’s contribution yet • Acquisition costs, such as the step up of AZEK’s PPE, are recorded upfront, whereas synergies will be reflected in subsequent years • ROCE is anticipated to improve annually after FY26 • The target aligns with the FY26 projection and guidance for the combined organization AZEK Acquisition Impact on FY26-28 ROCE Goals The Board retains its negative discretion on vesting ROCE Amount of Target ROCE RSUs to Vest < 25.0% 0.0x > 25.0% but < 28.5% 0.5x > 28.5% but < 32.0% 1.0x > 32.0% but < 35.0% 1.5x > 35.0% 2.0x ROCE performance hurdles reflect challenging targets that maintain the same level of rigor as in prior years and incentivize performance aligned with strategic growth priorities
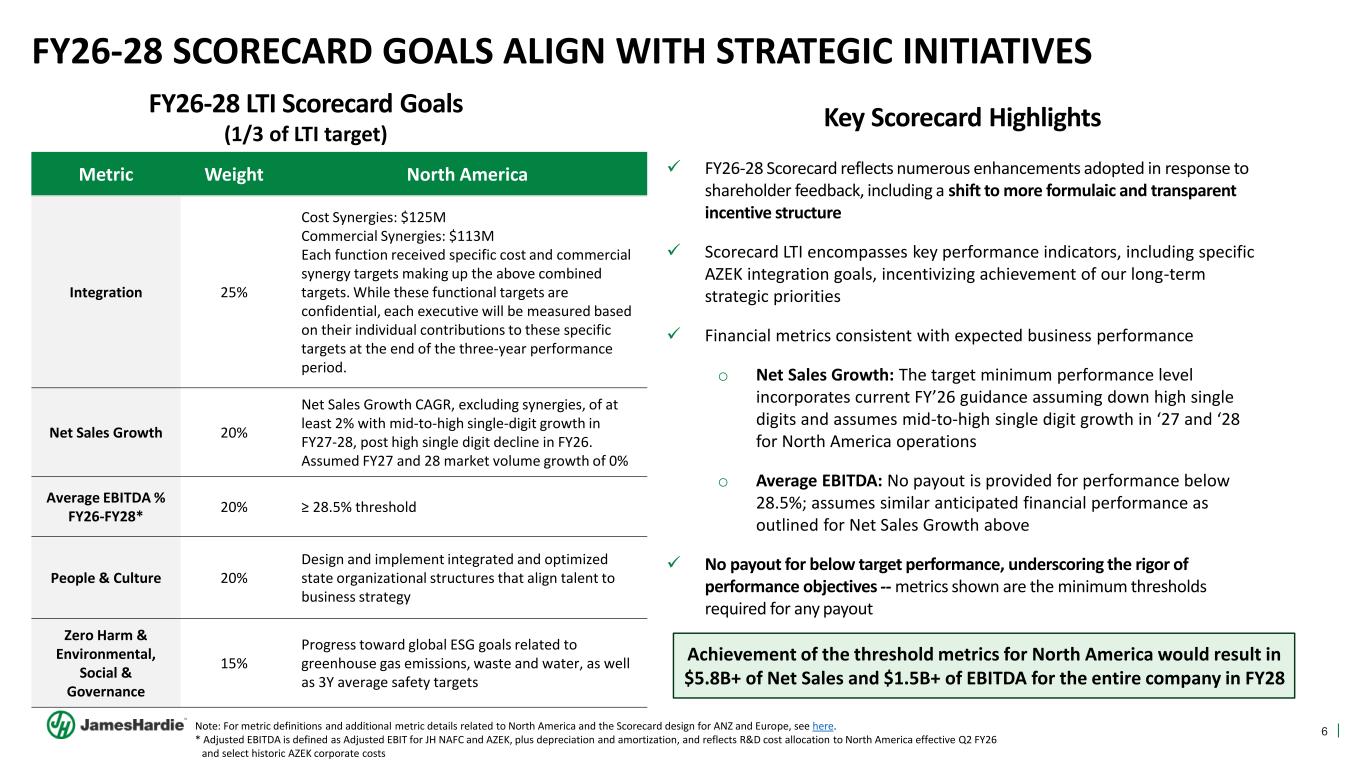
6 FY26-28 SCORECARD GOALS ALIGN WITH STRATEGIC INITIATIVES Metric Weight North America Integration 25% Cost Synergies: $125M Commercial Synergies: $113M Each function received specific cost and commercial synergy targets making up the above combined targets. While these functional targets are confidential, each executive will be measured based on their individual contributions to these specific targets at the end of the three-year performance period. Net Sales Growth 20% Net Sales Growth CAGR, excluding synergies, of at least 2% with mid-to-high single-digit growth in FY27-28, post high single digit decline in FY26. Assumed FY27 and 28 market volume growth of 0% Average EBITDA % FY26-FY28* 20% ≥ 28.5% threshold People & Culture 20% Design and implement integrated and optimized state organizational structures that align talent to business strategy Zero Harm & Environmental, Social & Governance 15% Progress toward global ESG goals related to greenhouse gas emissions, waste and water, as well as 3Y average safety targets FY26-28 LTI Scorecard Goals (1/3 of LTI target) Note: For metric definitions and additional metric details related to North America and the Scorecard design for ANZ and Europe, see here. * Adjusted EBITDA is defined as Adjusted EBIT for JH NAFC and AZEK, plus depreciation and amortization, and reflects R&D cost allocation to North America effective Q2 FY26 and select historic AZEK corporate costs Key Scorecard Highlights ✓ FY26-28 Scorecard reflects numerous enhancements adopted in response to shareholder feedback, including a shift to more formulaic and transparent incentive structure ✓ Scorecard LTI encompasses key performance indicators, including specific AZEK integration goals, incentivizing achievement of our long-term strategic priorities ✓ Financial metrics consistent with expected business performance o Net Sales Growth: The target minimum performance level incorporates current FY’26 guidance assuming down high single digits and assumes mid-to-high single digit growth in ‘27 and ‘28 for North America operations o Average EBITDA: No payout is provided for performance below 28.5%; assumes similar anticipated financial performance as outlined for Net Sales Growth above ✓ No payout for below target performance, underscoring the rigor of performance objectives -- metrics shown are the minimum thresholds required for any payout Achievement of the threshold metrics for North America would result in $5.8B+ of Net Sales and $1.5B+ of EBITDA for the entire company in FY28