Exhibit 99.4
James Hardie
Q2 FY12 MANAGEMENT PRESENTATION
17 November 2011
James Hardie
DISCLAIMER
This Management Presentation contains forward-looking statements. James Hardie may from time to time make forward-looking statements in its periodic reports filed with or furnished to the SEC, on Forms 20-F and 6-K, in its annual reports to shareholders, in offering circulars, invitation memoranda and prospectuses, in media releases and other written materials and in oral statements made by the company’s officers, directors or employees to analysts, institutional investors, existing and potential lenders, representatives of the media and others. Statements that are not historical facts are forward-looking statements and such forward-looking statements are statements made pursuant to the Safe Harbor Provisions of the Private Securities Litigation Reform Act of 1995. Examples of forward-looking statements include:
• statements about the company’s future performance;
• projections of the company’s results of operations or financial condition;
• statements regarding the company’s plans, objectives or goals, including those relating to strategies, initiatives, competition, acquisitions, dispositions and/or our products;
• expectations concerning the costs associated with the suspension or closure of operations at any of the company’s plants and future plans with respect to any such plants;
• expectations that the company’s credit facilities will be extended or renewed;
• expectations concerning dividend payments and share buy-backs;
• statements concerning the company’s corporate and tax domiciles and potential changes to them, including potential tax charges; • statements regarding tax liabilities and related audits, reviews and proceedings;
• statements as to the possible consequences of proceedings brought against the company and certain of its former directors and officers by the Australian Securities and Investments Commission (ASIC);
• expectations about the timing and amount of contributions to the Asbestos Injuries Compensation Fund (AICF), a special purpose fund for the compensation of proven Australian asbestos-related personal injury and death claims;
• expectations concerning indemnification obligations;
• statements about product or environmental liabilities; and
• statements about economic conditions, such as economic or housing recovery, the levels of new home construction, unemployment levels, changes or stability in housing values, the availability of mortgages and other financing, mortgage and other interest rates, housing affordability and supply, the levels of foreclosures and home resales, currency exchange rates and consumer confidence.
Words such as “believe,” “anticipate,” “plan,” “expect,” “intend,” “target,” “estimate,” “project,” “predict,” “forecast,” “guideline,” “aim,” “will,” “should,” “likely,” “continue” and similar expressions are intended to identify forward-looking statements but are not the exclusive means of identifying such statements. Readers are cautioned not to place undue reliance on these forward-looking statements and all such forward-looking statements are qualified in their entirety by reference to the following cautionary statements.
Forward-looking statements are based on the company’s current expectations, estimates and assumptions and because forward-looking statements address future results, events and conditions, they, by their very nature, involve inherent risks and uncertainties, many of which are unforeseeable and beyond the company’s control. Such known and unknown risks, uncertainties and other factors may cause actual results, performance or other achievements to differ materially from the anticipated results, performance or achievements expressed, projected or implied by these forward-looking statements. These factors, some of which are discussed under “Risk Factors” in Section 3 of the Form 20-F filed with the US Securities and Exchange Commission on 29 June 2011, as amended by the Form 20-F/A filed on 14 July 2011, include, but are not limited to: all matters relating to or arising out of the prior manufacture of products that contained asbestos by current and former James Hardie subsidiaries; required contributions to the AICF, any shortfall in the AICF and the effect of currency exchange rate movements on the amount recorded in the company’s financial statements as an asbestos liability; governmental loan facility to the AICF; compliance with and changes in tax laws and treatments; competition and product pricing in the markets in which the company operates; the consequences of product failures or defects; exposure to environmental, asbestos or other legal proceedings; general economic and market conditions; the supply and cost of raw materials; possible increases in competition and the potential that competitors could copy the company’s products; reliance on a small number of customers; a customer’s inability to pay; compliance with and changes in environmental and health and safety laws; risks of conducting business internationally; compliance with and changes in laws and regulations; the effect of the transfer of the company’s corporate domicile from The Netherlands to Ireland to become an Irish SE including employee relations, changes in corporate governance and potential tax benefits; currency exchange risks; dependence on customer preference and the concentration of the company’s customer base on large format retail customers, distributors and dealers; dependence on residential and commercial construction markets; the effect of adverse changes in climate or weather patterns; possible inability to renew credit facilities on terms favorable to the company, or at all; acquisition or sale of businesses and business segments; changes in the company’s key management personnel; inherent limitations on internal controls; use of accounting estimates; and all other risks identified in the company’s reports filed with Australian, Irish and US securities agencies and exchanges (as appropriate). The company cautions you that the foregoing list of factors is not exhaustive and that other risks and uncertainties may cause actual results to differ materially from those in forward-looking statements. Forward-looking statements speak only as of the date they are made and are statements of the company’s current expectations concerning future results, events and conditions.
2
James Hardie
AGENDA
• Overview and Operating Review – Louis Gries, CEO
• Financial Review – Russell Chenu, CFO
Questions and Answers
In this Management Presentation, James Hardie may present financial measures, sales volume terms, financial ratios, and Non-US GAAP financial measures included in the Definitions section of this document starting on page 48. The company presents financial measures that it believes are customarily used by its Australian investors. Specifically, these financial measures, which are equivalent to or derived from certain US GAAP measures as explained in the definitions, include “EBIT”, “EBIT margin”, “Operating profit” and “Net operating profit”. The company may also present other terms for measuring its sales volumes (“million square feet” or “mmsf” and “thousand square feet” or “msf”); financial ratios (“Gearing ratio”, “Net interest expense cover”, “Net interest paid cover”, “Net debt payback”, “Net debt (cash)”); and Non-US GAAP financial measures (“EBIT excluding asbestos and ASIC expenses”, “EBIT margin excluding asbestos and ASIC expenses”, “Net operating profit excluding asbestos, ASIC expenses and tax adjustments”, “Diluted earnings per share excluding asbestos, ASIC expenses, and tax adjustments”, “Operating profit before income taxes excluding asbestos”, “Effective tax rate excluding asbestos and tax adjustments”, “EBITDA” and “General corporate costs excluding ASIC expenses and domicile change related costs”). Unless otherwise stated, results and comparisons are of the 2nd quarter and 1st half of the current fiscal year versus the 2nd quarter and 1st half of the prior fiscal year.
3

James Hardie
OPERATING REVIEW
Louis Gries, CEO
James Hardie
GROUP OVERVIEW 1
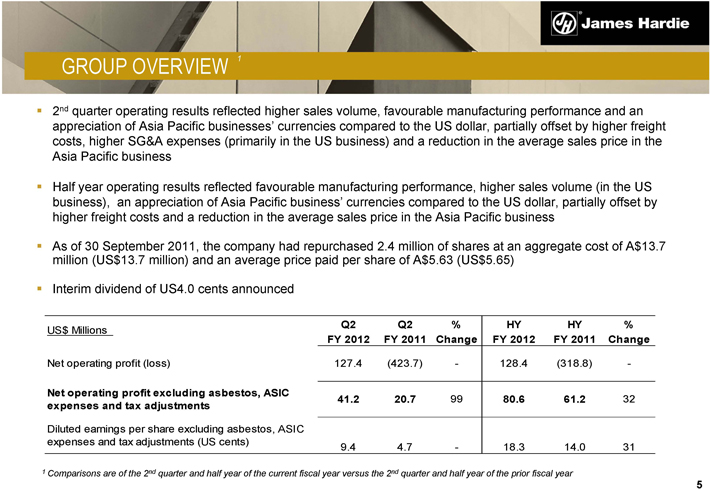
• 2nd quarter operating results reflected higher sales volume, favourable manufacturing performance and an appreciation of Asia Pacific businesses’ currencies compared to the US dollar, partially offset by higher freight costs, higher SG&A expenses (primarily in the US business) and a reduction in the average sales price in the Asia Pacific business
• Half year operating results reflected favourable manufacturing performance, higher sales volume (in the US business), an appreciation of Asia Pacific business’ currencies compared to the US dollar, partially offset by higher freight costs and a reduction in the average sales price in the Asia Pacific business
• As of 30 September 2011, the company had repurchased 2.4 million of shares at an aggregate cost of A$13.7 million (US$13.7 million) and an average price paid per share of A$5.63 (US$5.65)
• Interim dividend of US4.0 cents announced
US$ Millions Q2 Q2% HY HY%
FY 2012 FY 2011 Change FY 2012 FY 2011 Change
Net operating profit (loss) 127.4(423.7) - 128.4(318.8) -
Net operating profit excluding asbestos, ASIC 41.2 20.7 99 80.6 61.2 32
expenses and tax adjustments
Diluted earnings per share excluding asbestos, ASIC
expenses and tax adjustments (US cents) 9.4 4.7 - 18.3 14.0 31
1 Comparisons are of the 2nd quarter and half year of the current fiscal year versus the 2nd quarter and half year of the prior fiscal year
5
James Hardie
USA AND EUROPE FIBRE CEMENT
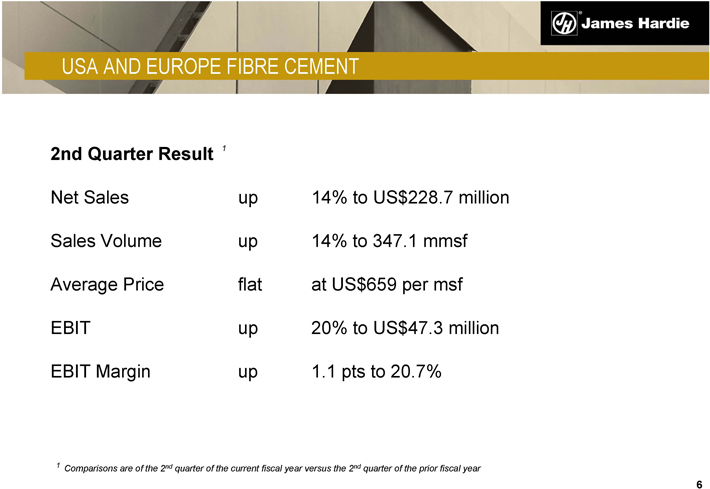
2nd Quarter Result 1
Net Sales up 14% to US$228.7 million
Sales Volume up 14% to 347.1 mmsf
Average Price flat at US$659 per msf
EBIT up 20% to US$47.3 million
EBIT Margin up 1.1 pts to 20.7%
1 Comparisons are of the 2nd quarter of the current fiscal year versus the 2nd quarter of the prior fiscal year
6
James Hardie
USA AND EUROPE FIBRE CEMENT
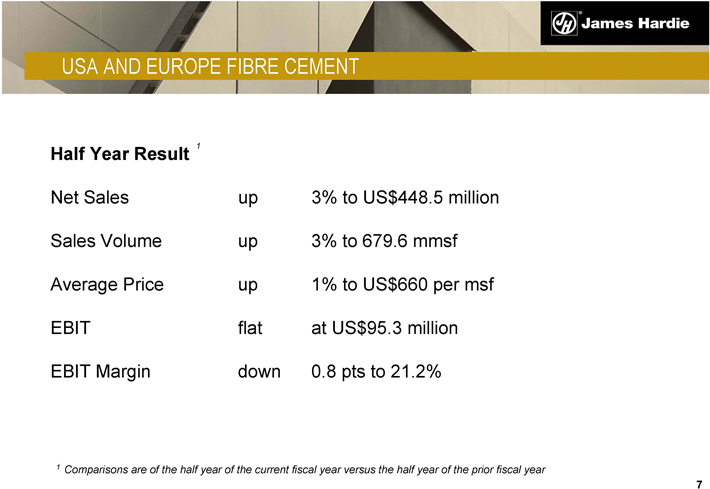
Half Year Result 1
Net Sales up 3% to US$448.5 million
Sales Volume up 3% to 679.6 mmsf
Average Price up 1% to US$660 per msf
EBIT flat at US$95.3 million
EBIT Margin down 0.8 pts to 21.2%
1 Comparisons are of the half year of the current fiscal year versus the half year of the prior fiscal year
7
James Hardie
USA AND EUROPE FIBRE CEMENT
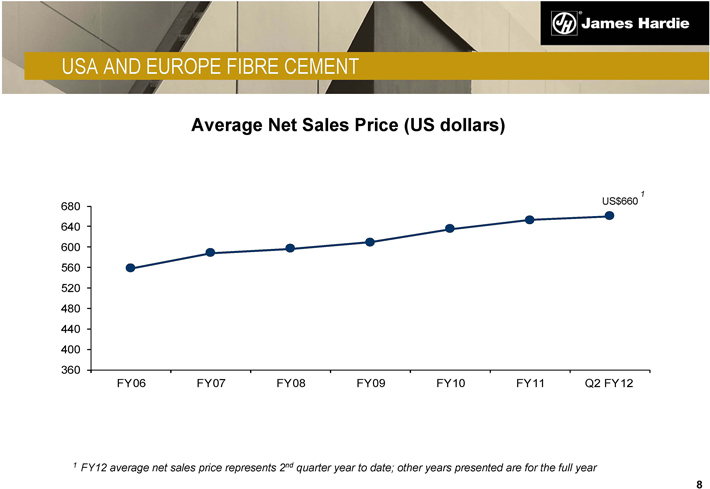
Average Net Sales Price (US dollars)
680 640 600 560 520 480 440 400 360
1
US$660
FY06 FY07 FY08 FY09 FY10 FY11 Q2 FY12
1 FY12 average net sales price represents 2nd quarter year to date; other years presented are for the full year
8
JH ® James Hardie
USA AND EUROPE FIBRE CEMENT
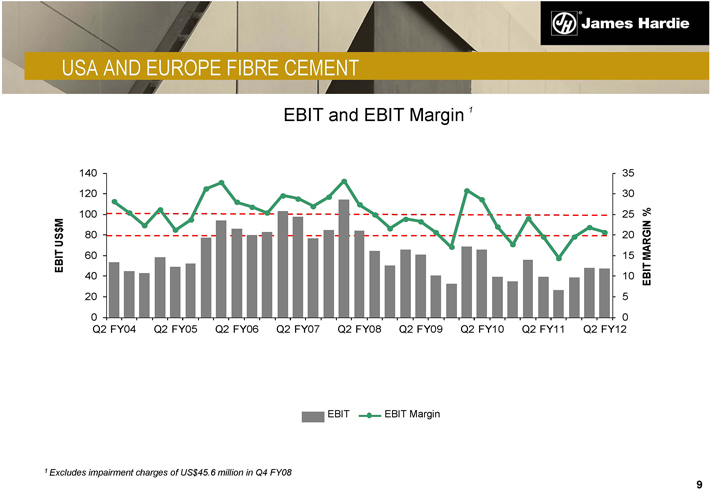
EBIT and EBIT Margin 1
EBIT US$M
140 120 100 80 60 40 20 0
Q2 FY04 Q2 FY05 Q2 FY06 Q2 FY07 Q2 FY08 Q2 FY09 Q2 FY10 Q2 FY11 Q2 FY12
35 30 25 20 15 10 5 0
EBIT MARGIN %
EBIT EBIT Margin
1 Excludes impairment charges of US$45.6 million in Q4 FY08
9
JH ® James Hardie
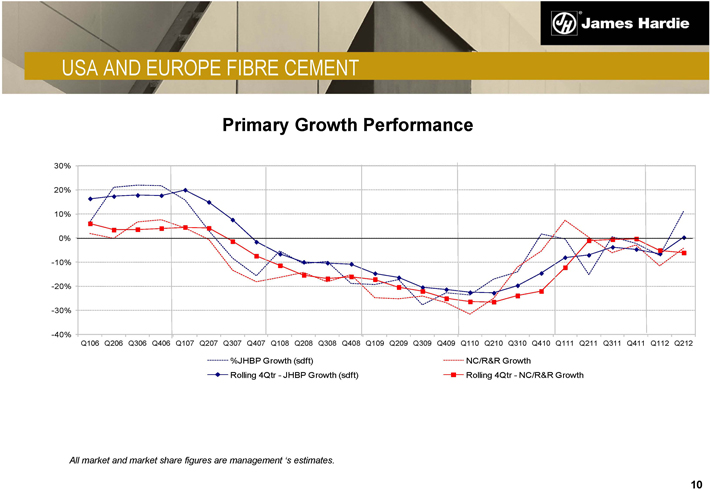
USA AND EUROPE FIBRE CEMENT
Primary Growth Performance
30% 20% 10% 0% -10% -20% -30% -40%
Q106 Q206 Q306 Q406 Q107 Q207 Q307 Q407 Q108 Q208 Q308 Q408 Q109 Q209 Q309 Q409 Q110 Q210 Q310 Q410 Q111 Q211 Q311 Q411 Q112 Q212
%JHBP Growth (sdft)
Rolling 4Qtr - JHBP Growth (sdft)
NC/R&R Growth
Rolling 4Qtr - NC/R&R Growth
All market and market share figures are management ‘s estimates.
10

JH ® James Hardie
ASIA PACIFIC FIBRE CEMENT
2nd Quarter Result 1
Net Sales up 18% to US$102.9 million
Sales Volume up 6% to 106.1 mmsf
Average Price down 4% to A$923 per msf
EBIT up 42% to US$25.5 million
EBIT Margin up 4.2 pts to 24.8%
1 Comparisons are of the 2nd quarter of the current fiscal year versus the 2nd quarter of the prior fiscal year
11

JH ® James Hardie
ASIA PACIFIC FIBRE CEMENT
Half Year Result 1
Net Sales up 14% to US$196.7 million
Sales Volume down 1% to 203.8 mmsf
Average Price down 2% to A$914 per msf
EBIT up 17% to US$46.6 million
EBIT Margin up 0.5 pts to 23.7%
1 Comparisons are of the half year of the current fiscal year versus the half year of the prior fiscal year
12
JH ® James Hardie
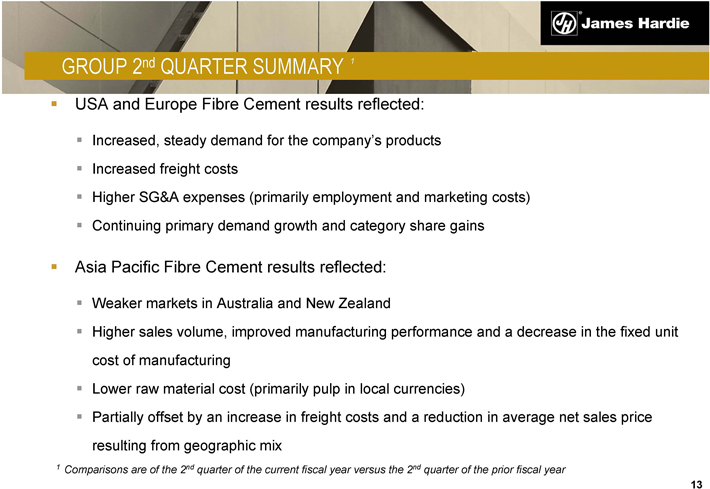
GROUP 2nd QUARTER SUMMARY 1
USA and Europe Fibre Cement results reflected:
Increased, steady demand for the company’s products
Increased freight costs
Higher SG&A expenses (primarily employment and marketing costs)
Continuing primary demand growth and category share gains
Asia Pacific Fibre Cement results reflected:
Weaker markets in Australia and New Zealand
Higher sales volume, improved manufacturing performance and a decrease in the fixed unit
cost of manufacturing
Lower raw material cost (primarily pulp in local currencies)
Partially offset by an increase in freight costs and a reduction in average net sales price
resulting from geographic mix
1 Comparisons are of the 2nd quarter of the current fiscal year versus the 2nd quarter of the prior fiscal year
13
JH ® James Hardie
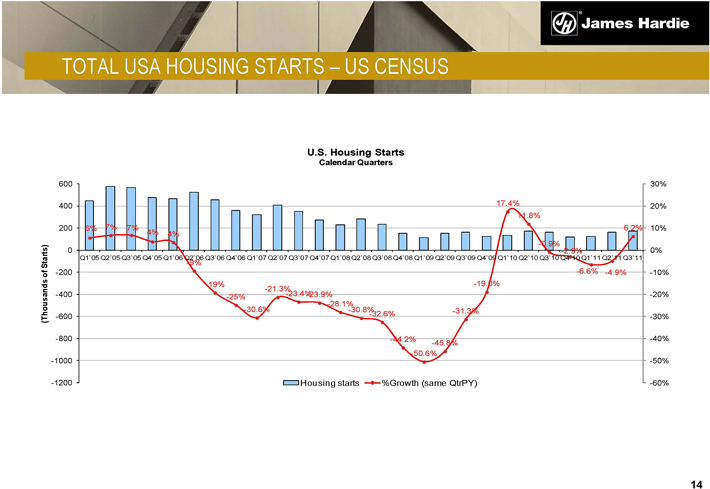
TOTAL USA HOUSING STARTS – US CENSUS
U.S. Housing Starts Calendar Quarters
(Thousands of Starts)
600 400 200 0 -200 -400 -600 -800 -1000 -1200 17.4% 11.8% 6% 7% 7% 6.2% 4% 4% -0.9% -2.9%
Q1`05 Q2`05 Q3`05 Q4`05 Q1`06 Q2`06 Q3`06 Q4`06 Q1`07 Q2`07 Q3`07 Q4`07 Q1`08 Q2`08 Q3`08 Q4`08 Q1`09 Q2`09 Q3`09 Q4`09 Q1`10 Q2`10 Q3`10 Q4`10 Q1`11 Q2`11 Q3`11
-9% -6.6% -4.9% -19% -19.0% -21.3% -25% -23.4% -23.9% -28.1% -30.6% -30.8% -31.3% -32.6%
-44.2% -45.8% -50.6% 30% 20% 10% 0% -10% -20% -30% -40% -50% -60%
Housing starts %Growth (same QtrPY)
14
JH ® James Hardie
GROUP OUTLOOK
United States
Although industry activity and demand have stabilised, there remains no evidence of a sustainable recovery
Pulp prices have softened but remain relatively high
Freight costs have increased, although seasonal downturn in rates now apparent
Company initiatives, such as the increased penetration of repair and remodel and non-metro markets and our house pack strategies, remain on track to improve upon the gains in fibre cement category share and the exterior cladding market achieved this year
Asia Pacific
Australia: despite a recent cut in official interest rates, industry data indicates that the housing market appears likely to remain weak in the second half of FY12
New Zealand: activity in the housing construction industry remains subdued
Philippines: the business continues to perform well in a stable environment
15
JH ® James Hardie
GROUP OUTLOOK
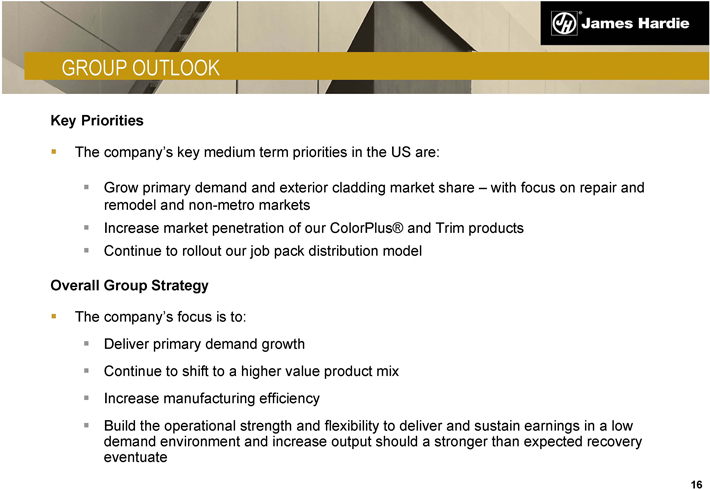
Key Priorities
The company’s key medium term priorities in the US are:
Grow primary demand and exterior cladding market share – with focus on repair and remodel and non-metro markets
Increase market penetration of our ColorPlus® and Trim products
Continue to rollout our job pack distribution model
Overall Group Strategy
The company’s focus is to:
Deliver primary demand growth
Continue to shift to a higher value product mix
Increase manufacturing efficiency
Build the operational strength and flexibility to deliver and sustain earnings in a low demand environment and increase output should a stronger than expected recovery eventuate
16
James Hardie
FINANCIAL REVIEW
Russell Chenu, CFO

James Hardie
OVERVIEW
Operations
Earnings this quarter reflect increased sales volume, category and market share gains in the US business and the appreciation of Asia Pacific business’ currencies, partially offset by higher SG&A expenses (primarily in the US business)
US sales volume in the prior corresponding quarter was negatively impacted by the expiry of the federal government tax incentive in April 2010
Strong net operating cash flow has enabled a further reduction in net debt from US$40.4 million at 31 March 2011 to US$36.7 million at 30 September 2011
Interim dividend of US4.0 cents per security announced
As of 30 September 2011, the company had repurchased 2.4 million shares at an aggregate cost of A$13.7 million (US$13.7 million) and an average price paid per security of A$5.63 (US$5.65)
18
James Hardie
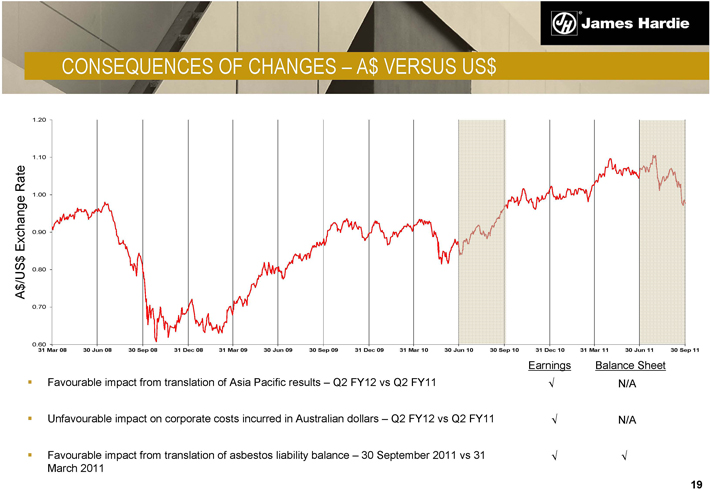
CONSEQUENCES OF CHANGES – A$ VERSUS US$
A$/US$ Exchange Rate
1.20
1.10
1.00
0.90
0.80
0.70
0.60
31 Mar 08 30 Jun 08 30 Sep 08 31 Dec 08 31 Mar 09 30 Jun 09 30 Sep 09 31 Dec 09 31 Mar 10 30 Jun 10 30 Sep 10 31 Dec 10 31 Mar 11 30 Jun 11 30 Sep 11
Earnings Balance Sheet
Favourable impact from translation of Asia Pacific results – Q2 FY12 vs Q2 FY11 N/A
Unfavourable impact on corporate costs incurred in Australian dollars – Q2 FY12 vs Q2 FY11 N/A
Favourable impact from translation of asbestos liability balance – 30 September 2011 vs 31
March 2011
19
James Hardie
RESULTS – Q2
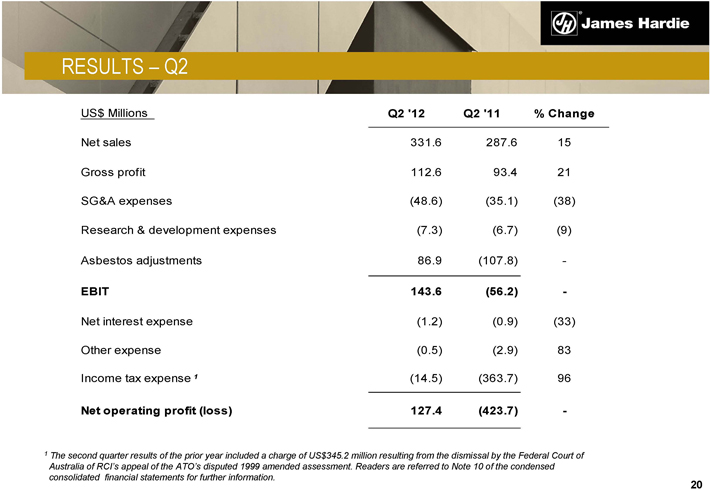
US$ Millions Q2 ‘12 Q2 ‘11 % Change
Net sales 331.6 287.6 15
Gross profit 112.6 93.4 21
SG&A expenses (48.6) (35.1) (38)
Research & development expenses (7.3) (6.7) (9)
Asbestos adjustments 86.9 (107.8) -
EBIT 143.6 (56.2) -
Net interest expense (1.2) (0.9) (33)
Other expense (0.5) (2.9) 83
Income tax expense 1 (14.5) (363.7) 96
Net operating profit (loss) 127.4 (423.7) -
1 The second quarter results of the prior year included a charge of US$345.2 million resulting from the dismissal by the Federal Court of Australia of RCI’s appeal of the ATO’s disputed 1999 amended assessment. Readers are referred to Note 10 of the condensed consolidated financial statements for further information.
20
James Hardie
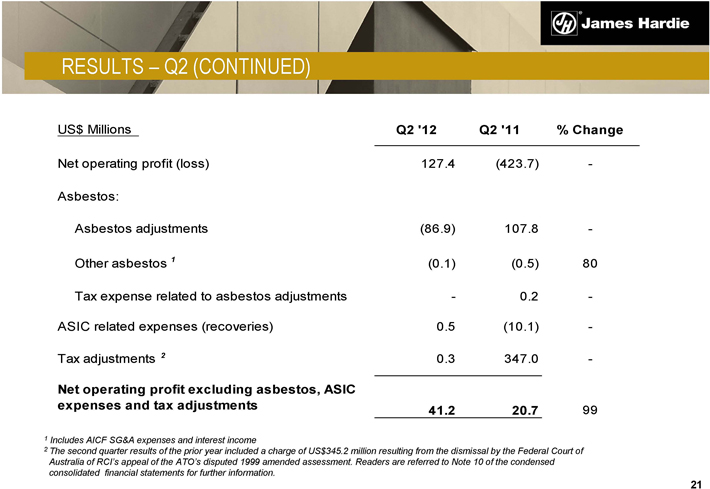
RESULTS – Q2 (CONTINUED)
US$ Millions Q2 ‘12 Q2 ‘11 % Change
Net operating profit (loss) 127.4 (423.7) -
Asbestos:
Asbestos adjustments (86.9) 107.8 -
Other asbestos 1(0.1) (0.5) 80
Tax expense related to asbestos adjustments - 0.2 -
ASIC related expenses (recoveries) 0.5 (10.1) -
Tax adjustments 2 0.3 347.0 -
Net operating profit excluding asbestos, ASIC
expenses and tax adjustments 41.2 20.7 99
1 Includes AICF SG&A expenses and interest income
2 The second quarter results of the prior year included a charge of US$345.2 million resulting from the dismissal by the Federal Court of Australia of RCI’s appeal of the ATO’s disputed 1999 amended assessment. Readers are referred to Note 10 of the condensed consolidated financial statements for further information.
21
James Hardie
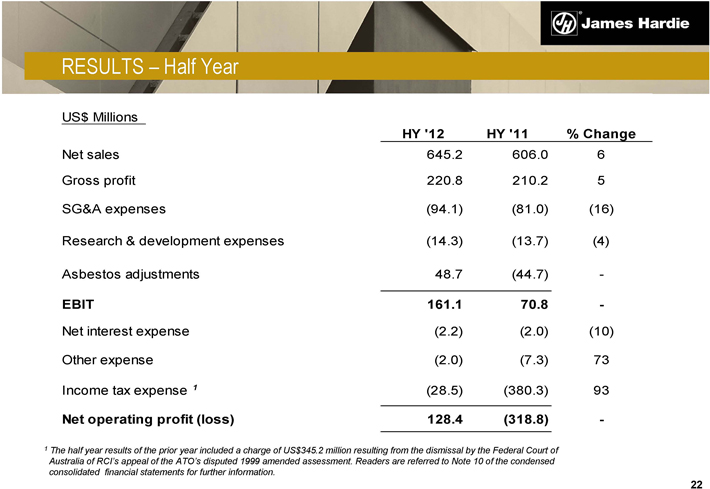
RESULTS – Half Year
US$ Millions
HY ‘12 HY ‘11 % Change
Net sales 645.2 606.0 6
Gross profit 220.8 210.2 5
SG&A expenses (94.1) (81.0) (16)
Research & development expenses (14.3) (13.7) (4)
Asbestos adjustments 48.7 (44.7) -
EBIT 161.1 70.8 -
Net interest expense (2.2) (2.0) (10)
Other expense (2.0) (7.3) 73
Income tax expense 1 (28.5) (380.3) 93
Net operating profit (loss) 128.4 (318.8) -
1 The half year results of the prior year included a charge of US$345.2 million resulting from the dismissal by the Federal Court of Australia of RCI’s appeal of the ATO’s disputed 1999 amended assessment. Readers are referred to Note 10 of the condensed consolidated financial statements for further information.
22

James Hardie
RESULTS – Half Year (CONTINUED)
US$ Millions
HY ‘12 HY ‘11 % Change
Net operating profit (loss) 128.4 (318.8) -
Asbestos:
Asbestos adjustments (48.7) 44.7 -
Other asbestos 1 - (0.7) -
Tax expense related to asbestos adjustments - 0.6 -
ASIC related expenses (recoveries) 0.7 (9.5) -
Tax adjustments 2 0.2 344.9 -
Net operating profit excluding asbestos, ASIC
expenses and tax adjustments 80.6 61.2 32
1 Includes AICF SG&A expenses and interest income
2 The half year results of the prior year included a charge of US$345.2 million resulting from the dismissal by the Federal Court of Australia of RCI’s appeal of the ATO’s disputed 1999 amended assessment. Readers are referred to Note 10 of the condensed consolidated financial statements for further information.
23
James Hardie
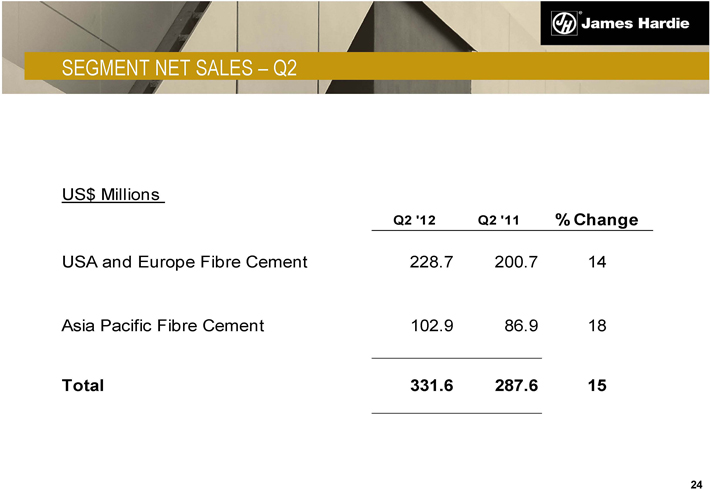
SEGMENT NET SALES – Q2
US$ Millions
Q2 ‘12 Q2 ‘11 % Change
USA and Europe Fibre Cement 228.7 200.7 14
Asia Pacific Fibre Cement 102.9 86.9 18
Total 331.6 287.6 15
24
James Hardie
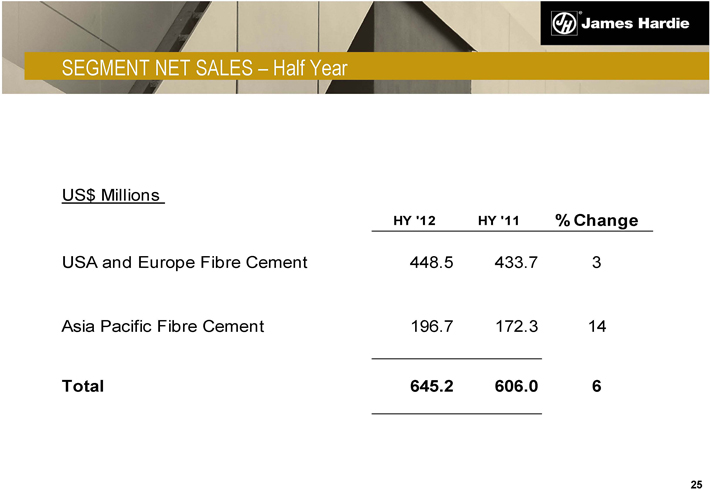
SEGMENT NET SALES – Half Year
US$ Millions
HY ‘12 HY ‘11 % Change
USA and Europe Fibre Cement 448.5 433.7 3
Asia Pacific Fibre Cement 196.7 172.3 14
Total 645.2 606.0 6
25
James Hardie
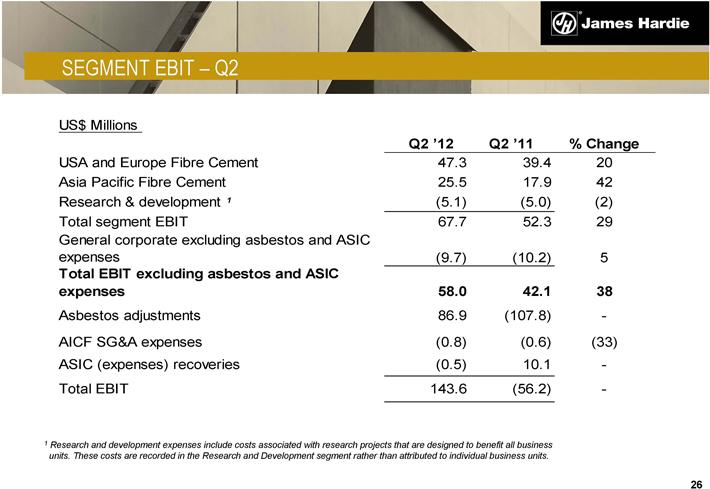
SEGMENT EBIT – Q2
US$ Millions
Q2 ’12 Q2 ’11 % Change
USA and Europe Fibre Cement 47.3 39.4 20
Asia Pacific Fibre Cement 25.5 17.9 42
Research & development 1 (5.1) (5.0) (2)
Total segment EBIT 67.7 52.3 29
General corporate excluding asbestos and ASIC
expenses (9.7) (10.2) 5
Total EBIT excluding asbestos and ASIC
expenses 58.0 42.1 38
Asbestos adjustments 86.9 (107.8) -
AICF SG&A expenses (0.8) (0.6) (33)
ASIC (expenses) recoveries (0.5) 10.1 -
Total EBIT 143.6 (56.2) -
1 Research and development expenses include costs associated with research projects that are designed to benefit all business units. These costs are recorded in the Research and Development segment rather than attributed to individual business units.
26
James Hardie
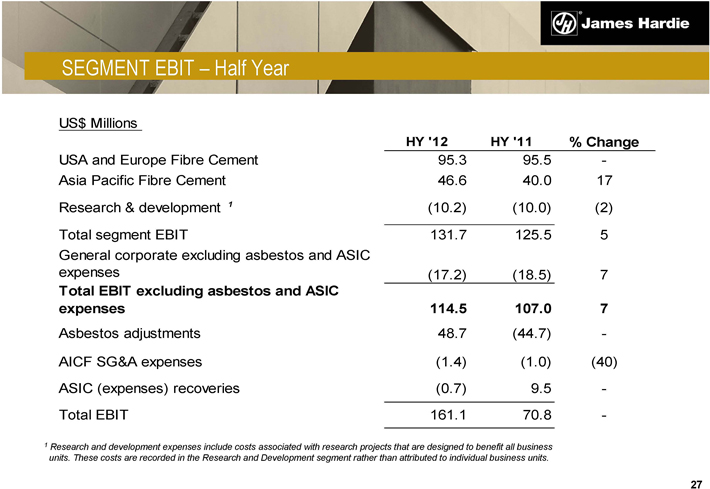
SEGMENT EBIT – Half Year
US$ Millions
HY ‘12 HY ‘11 % Change
USA and Europe Fibre Cement 95.3 95.5 -
Asia Pacific Fibre Cement 46.6 40.0 17
Research & development 1 (10.2) (10.0) (2)
Total segment EBIT 131.7 125.5 5
General corporate excluding asbestos and ASIC
expenses (17.2) (18.5) 7
Total EBIT excluding asbestos and ASIC
expenses 114.5 107.0 7
Asbestos adjustments 48.7 (44.7) -
AICF SG&A expenses (1.4) (1.0) (40)
ASIC (expenses) recoveries (0.7) 9.5 -
Total EBIT 161.1 70.8 -
1 Research and development expenses include costs associated with research projects that are designed to benefit all business units. These costs are recorded in the Research and Development segment rather than attributed to individual business units.
27
James Hardie
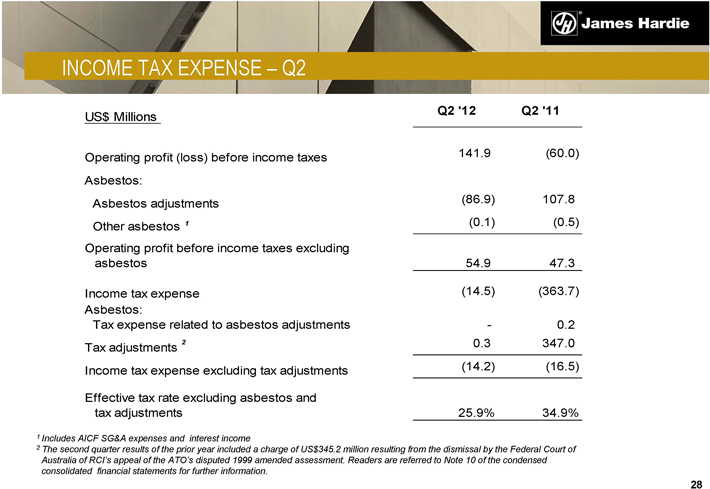
INCOME TAX EXPENSE – Q2
US$ Millions Q2 ‘12 Q2 ‘11
Operating profit (loss) before income taxes 141.9 (60.0)
Asbestos:
Asbestos adjustments (86.9) 107.8
Other asbestos 1 (0.1) (0.5)
Operating profit before income taxes excluding
asbestos 54.9 47.3
Income tax expense (14.5) (363.7)
Asbestos:
Tax expense related to asbestos adjustments - 0.2
Tax adjustments 2 0.3 347.0
Income tax expense excluding tax adjustments (14.2) (16.5)
Effective tax rate excluding asbestos and
tax adjustments 25.9% 34.9%
1 Includes AICF SG&A expenses and interest income
2 The second quarter results of the prior year included a charge of US$345.2 million resulting from the dismissal by the Federal Court of Australia of RCI’s appeal of the ATO’s disputed 1999 amended assessment. Readers are referred to Note 10 of the condensed consolidated financial statements for further information.
28
James Hardie
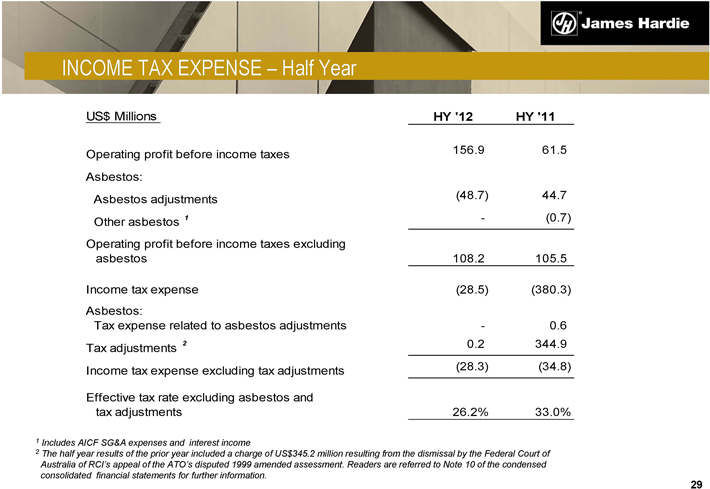
INCOME TAX EXPENSE – Half Year
US$ Millions HY ‘12 HY ‘11
Operating profit before income taxes 156.9 61.5
Asbestos:
Asbestos adjustments (48.7) 44.7
Other asbestos 1 - (0.7)
Operating profit before income taxes excluding
asbestos 108.2 105.5
Income tax expense (28.5) (380.3)
Asbestos:
Tax expense related to asbestos adjustments - 0.6
Tax adjustments 2 0.2 344.9
Income tax expense excluding tax adjustments (28.3) (34.8)
Effective tax rate excluding asbestos and
tax adjustments 26.2% 33.0%
1 Includes AICF SG&A expenses and interest income
2 The half year results of the prior year included a charge of US$345.2 million resulting from the dismissal by the Federal Court of Australia of RCI’s appeal of the ATO’s disputed 1999 amended assessment. Readers are referred to Note 10 of the condensed consolidated financial statements for further information.
29
James Hardie
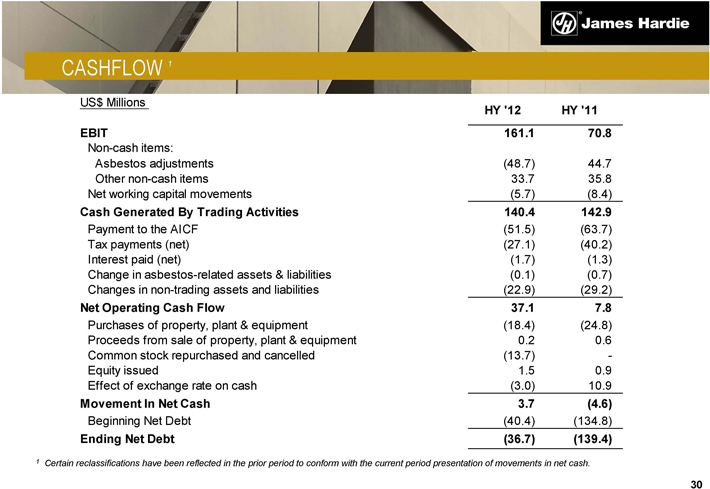
CASHFLOW 1
US$ Millions HY ‘12 HY ‘11
EBIT 161.1 70.8
Non-cash items:
Asbestos adjustments (48.7) 44.7
Other non-cash items 33.7 35.8
Net working capital movements (5.7) (8.4)
Cash Generated By Trading Activities 140.4 142.9
Payment to the AICF (51.5) (63.7)
Tax payments (net) (27.1) (40.2)
Interest paid (net) (1.7) (1.3)
Change in asbestos-related assets & liabilities (0.1) (0.7)
Changes in non-trading assets and liabilities (22.9) (29.2)
Net Operating Cash Flow 37.1 7.8
Purchases of property, plant & equipment (18.4) (24.8)
Proceeds from sale of property, plant & equipment 0.2 0.6
Common stock repurchased and cancelled (13.7) -
Equity issued 1.5 0.9
Effect of exchange rate on cash (3.0) 10.9
Movement In Net Cash 3.7 (4.6)
Beginning Net Debt (40.4) (134.8)
Ending Net Debt (36.7) (139.4)
1 Certain reclassifications have been reflected in the prior period to conform with the current period presentation of movements in net cash.
30
James Hardie
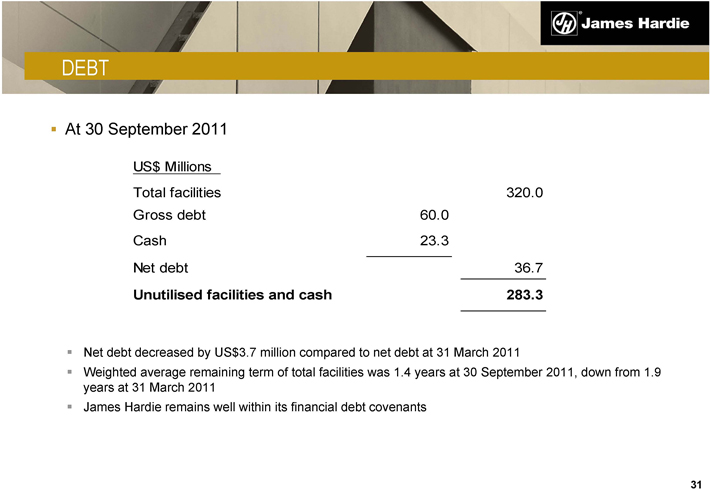
DEBT
At 30 September 2011
US$ Millions
Total facilities 320.0
Gross debt 60.0
Cash 23.3
Net debt 36.7
Unutilised facilities and cash 283.3
Net debt decreased by US$3.7 million compared to net debt at 31 March 2011
Weighted average remaining term of total facilities was 1.4 years at 30 September 2011, down from 1.9 years at 31 March 2011
James Hardie remains well within its financial debt covenants
31
James Hardie
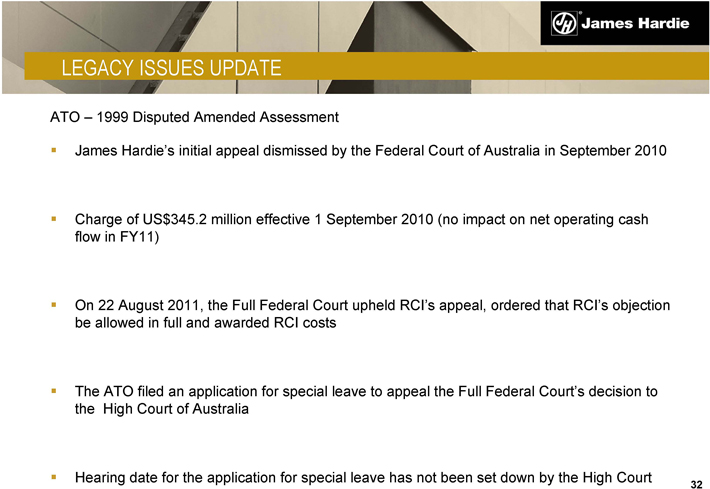
LEGACY ISSUES UPDATE
ATO – 1999 Disputed Amended Assessment
James Hardie’s initial appeal dismissed by the Federal Court of Australia in September 2010
Charge of US$345.2 million effective 1 September 2010 (no impact on net operating cash flow in FY11)
On 22 August 2011, the Full Federal Court upheld RCI’s appeal, ordered that RCI’s objection be allowed in full and awarded RCI costs
The ATO filed an application for special leave to appeal the Full Federal Court’s decision to the High Court of Australia
Hearing date for the application for special leave has not been set down by the High Court
32
James Hardie
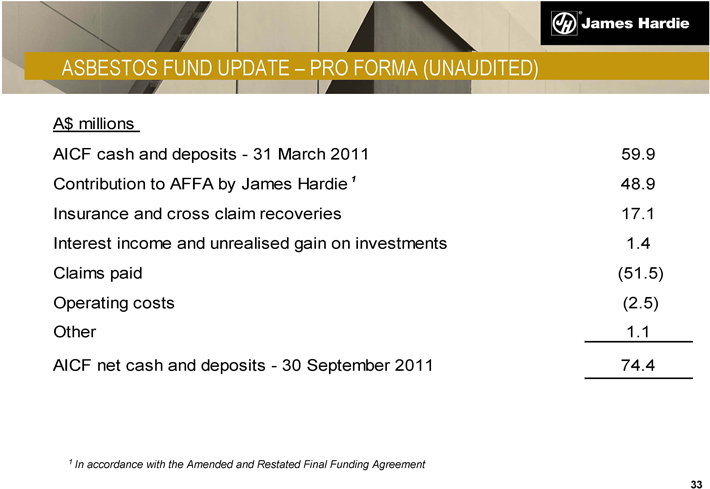
ASBESTOS FUND UPDATE – PRO FORMA (UNAUDITED)
A$ millions
AICF cash and deposits - 31 March 2011 59.9
Contribution to AFFA by James Hardie 1 48.9
Insurance and cross claim recoveries 17.1
Interest income and unrealised gain on investments 1.4
Claims paid (51.5)
Operating costs (2.5)
Other 1.1
AICF net cash and deposits - 30 September 2011 74.4
1 In accordance with the Amended and Restated Final Funding Agreement
33
James Hardie
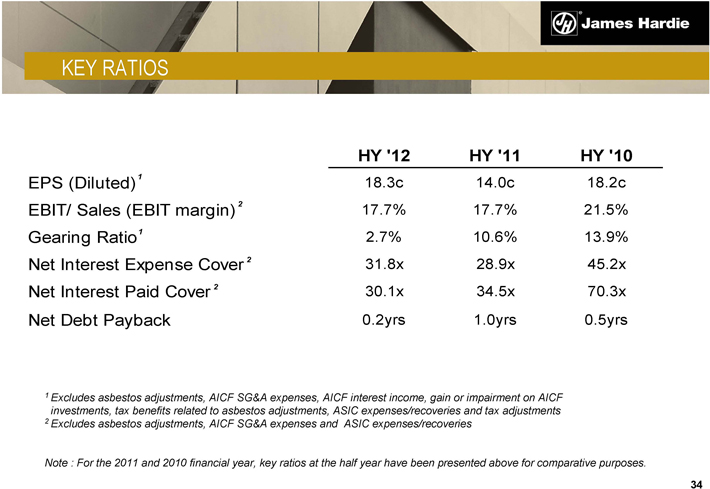
KEY RATIOS
HY ‘12 HY ‘11 HY ‘10
EPS (Diluted) 1 18.3c 14.0c 18.2c
EBIT/ Sales (EBIT margin) 2 17.7% 17.7% 21.5%
Gearing Ratio 1 2.7% 10.6% 13.9%
Net Interest Expense Cover 2 31.8x 28.9x 45.2x
Net Interest Paid Cover 2 30.1x 34.5x 70.3x
Net Debt Payback 0.2yrs 1.0yrs 0.5yrs
1 Excludes asbestos adjustments, AICF SG&A expenses, AICF interest income, gain or impairment on AICF investments, tax benefits related to asbestos adjustments, ASIC expenses/recoveries and tax adjustments
2 Excludes asbestos adjustments, AICF SG&A expenses and ASIC expenses/recoveries
Note : For the 2011 and 2010 financial year, key ratios at the half year have been presented above for comparative purposes.
34
James Hardie
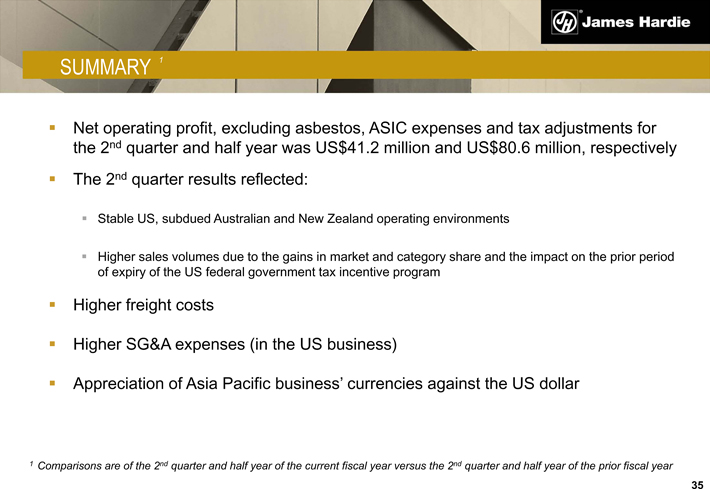
SUMMARY 1
Net operating profit, excluding asbestos, ASIC expenses and tax adjustments for the 2nd quarter and half year was US$41.2 million and US$80.6 million, respectively
The 2nd quarter results reflected:
Stable US, subdued Australian and New Zealand operating environments
Higher sales volumes due to the gains in market and category share and the impact on the prior period of expiry of the US federal government tax incentive program
Higher freight costs
Higher SG&A expenses (in the US business)
Appreciation of Asia Pacific business’ currencies against the US dollar
1 Comparisons are of the 2nd quarter and half year of the current fiscal year versus the 2nd quarter and half year of the prior fiscal year
35
James Hardie
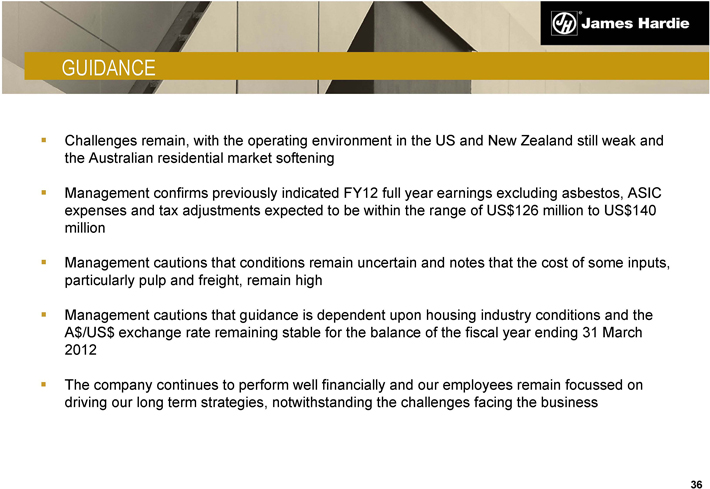
GUIDANCE
Challenges remain, with the operating environment in the US and New Zealand still weak and the Australian residential market softening
Management confirms previously indicated FY12 full year earnings excluding asbestos, ASIC expenses and tax adjustments expected to be within the range of US$126 million to US$140 million
Management cautions that conditions remain uncertain and notes that the cost of some inputs, particularly pulp and freight, remain high
Management cautions that guidance is dependent upon housing industry conditions and the A$/US$ exchange rate remaining stable for the balance of the fiscal year ending 31 March 2012
The company continues to perform well financially and our employees remain focussed on driving our long term strategies, notwithstanding the challenges facing the business
36
James Hardie
QUESTIONS
James Hardie
APPENDIX
James Hardie
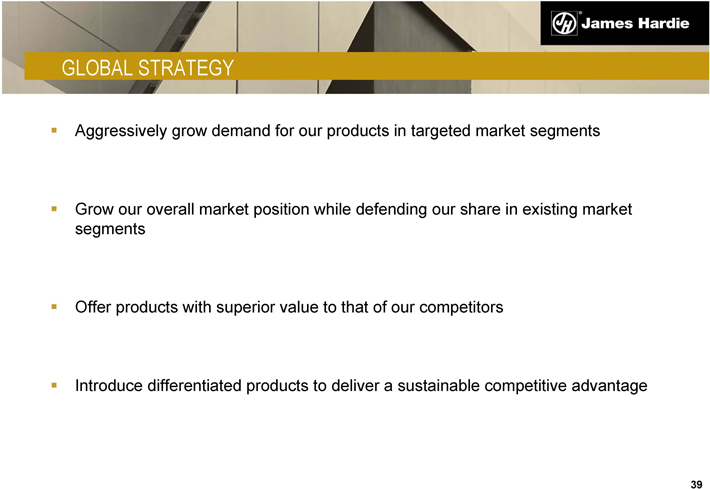
GLOBAL STRATEGY
Aggressively grow demand for our products in targeted market segments
Grow our overall market position while defending our share in existing market segments
Offer products with superior value to that of our competitors
Introduce differentiated products to deliver a sustainable competitive advantage
39
James Hardie
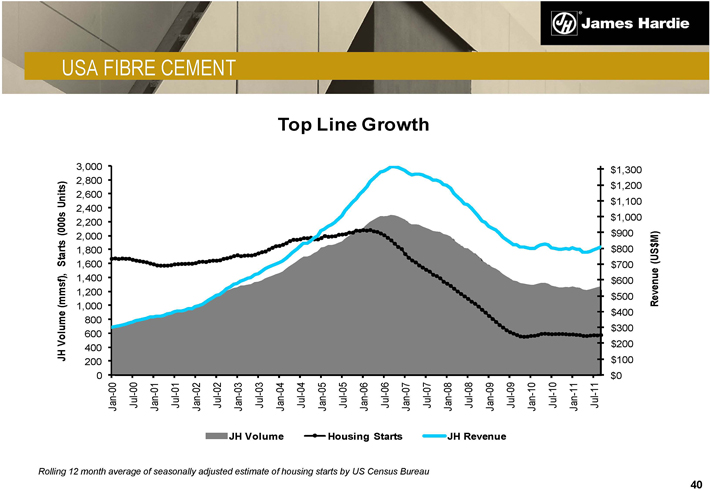
USA FIBRE CEMENT
Top Line Growth
JH Volume (mmsf), Starts (000s Units)
3,000 2,800 2,600 2,400 2,200 2,000 1,800 1,600 1,400 1,200 1,000 800 600 400 200 0
Jan-00 Jul-00 Jan-01 Jul-01 Jan-02 Jul-02 Jan-03 Jul-03 Jan-04 Jul-04 Jan-05 Jul-05 Jan-06 Jul-06 Jan-07 Jul-07 Jan-08 Jul-08 Jan-09 Jul-09 Jan-10 Jul-10 Jan-11 Jul-11
$1,300 $1,200 $1,100 $1,000 $900 $800 $700 $600 $500 $400 $300 $200 $100 $0
Revenue (US$M)
JH Volume Housing Starts JH Revenue
Rolling 12 month average of seasonally adjusted estimate of housing starts by US Census Bureau
40
James Hardie
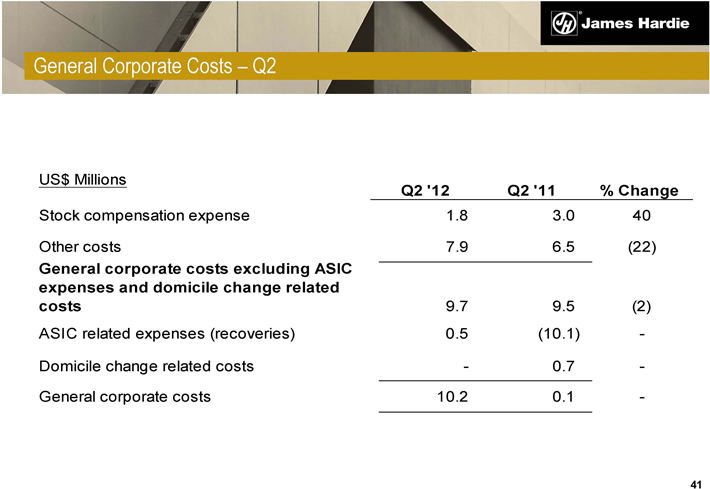
General Corporate Costs – Q2
US$ Millions
Q2 ‘12 Q2 ‘11% Change
Stock compensation expense 1.8 3.0 40
Other costs 7.9 6.5 (22)
General corporate costs excluding ASIC
expenses and domicile change related
costs 9.7 9.5 (2)
ASIC related expenses (recoveries) 0.5 (10.1) -
Domicile change related costs - 0.7 -
General corporate costs 10.2 0.1 -
41
James Hardie
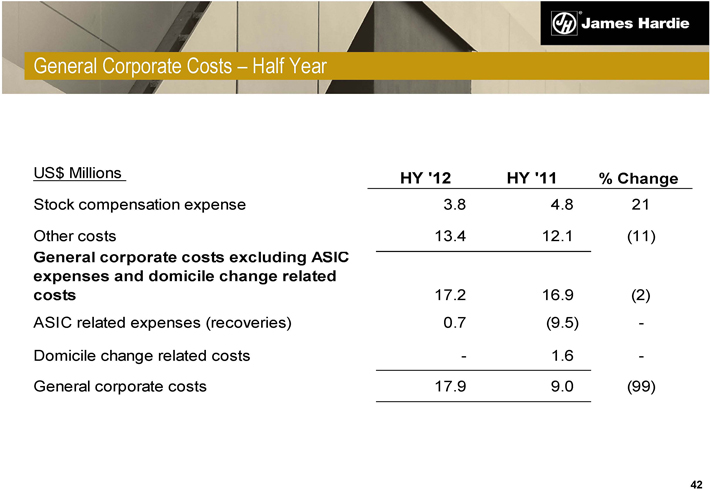
General Corporate Costs – Half Year
US$ Millions HY ‘12 HY ‘11% Change
Stock compensation expense 3.8 4.8 21
Other costs 13.4 12.1 (11)
General corporate costs excluding ASIC
expenses and domicile change related
costs 17.2 16.9 (2)
ASIC related expenses (recoveries) 0.7 (9.5) -
Domicile change related costs - 1.6 -
General corporate costs 17.9 9.0 (99)
42
James Hardie
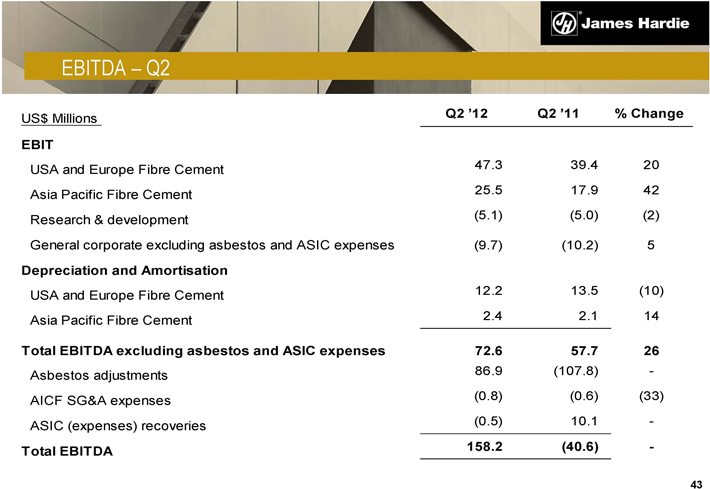
EBITDA – Q2
US$ Millions Q2 12 Q2 ‘11% Change
EBIT
USA and Europe Fibre Cement 47.3 39.4 20
Asia Pacific Fibre Cement 25.5 17.9 42
Research & development (5.1) (5.0) (2)
General corporate excluding asbestos and ASIC expenses (9.7) (10.2) 5
Depreciation and Amortisation
USA and Europe Fibre Cement 12.2 13.5 (10)
Asia Pacific Fibre Cement 2.4 2.1 14
Total EBITDA excluding asbestos and ASIC expenses 72.6 57.7 26
Asbestos adjustments 86.9 (107.8) -
AICF SG&A expenses (0.8) (0.6) (33)
ASIC (expenses) recoveries (0.5) 10.1 -
Total EBITDA 158.2 (40.6) -
43
James Hardie
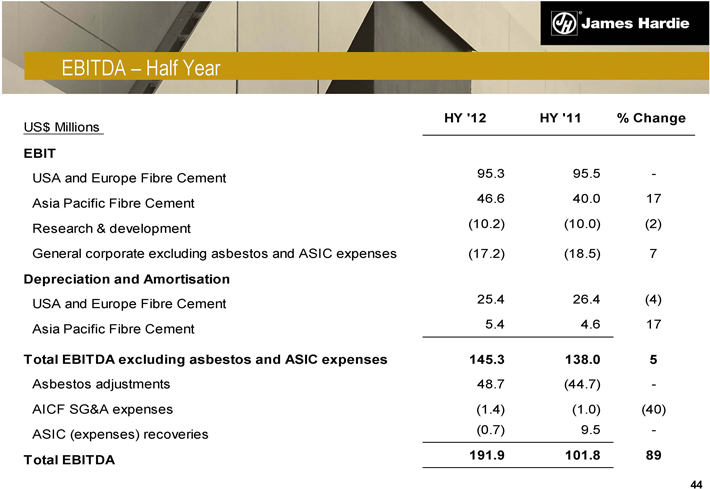
EBITDA – Half Year
HY ‘12 HY ‘11% Change
US$ Millions
EBIT
USA and Europe Fibre Cement 95.3 95.5 -
Asia Pacific Fibre Cement 46.6 40.0 17
Research & development (10.2) (10.0) (2)
General corporate excluding asbestos and ASIC expenses (17.2) (18.5) 7
Depreciation and Amortisation
USA and Europe Fibre Cement 25.4 26.4 (4)
Asia Pacific Fibre Cement 5.4 4.6 17
Total EBITDA excluding asbestos and ASIC expenses 145.3 138.0 5
Asbestos adjustments 48.7 (44.7) -
AICF SG&A expenses (1.4) (1.0) (40)
ASIC (expenses) recoveries (0.7) 9.5 -
Total EBITDA 191.9 101.8 89
44
James Hardie
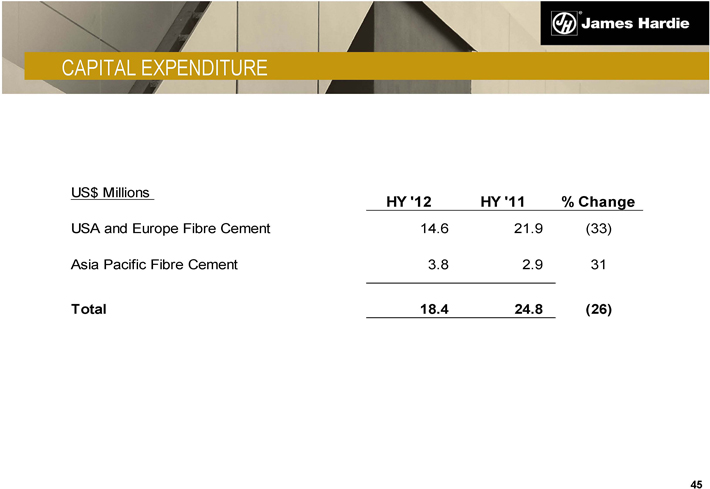
CAPITAL EXPENDITURE
US$ Millions HY ‘12 HY ‘11% Change
USA and Europe Fibre Cement 14.6 21.9 (33)
Asia Pacific Fibre Cement 3.8 2.9 31
Total 18.4 24.8 (26)
45
James Hardie
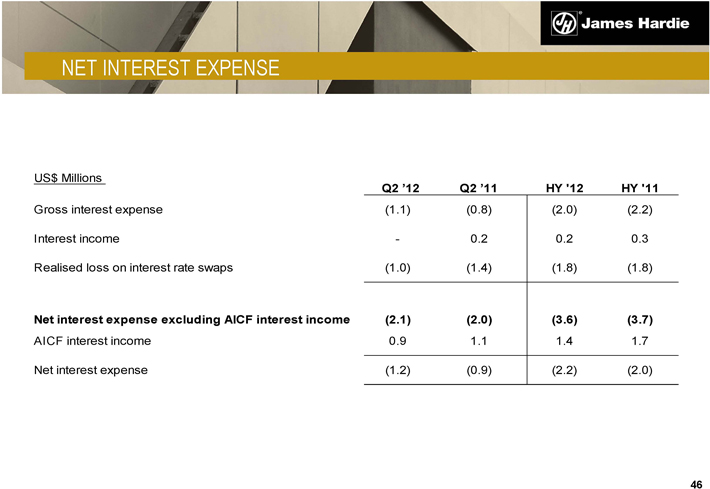
NET INTEREST EXPENSE
US$ Millions
Q2 ‘12 Q2 ‘11 HY ‘12 HY ‘11
Gross interest expense (1.1) (0.8) (2.0) (2.2)
Interest income - 0.2 0.2 0.3
Realised loss on interest rate swaps (1.0) (1.4) (1.8) (1.8)
Net interest expense excluding AICF interest income (2.1) (2.0) (3.6) (3.7)
AICF interest income 0.9 1.1 1.4 1.7
Net interest expense (1.2) (0.9) (2.2) (2.0)
46
James Hardie
LEGACY ISSUES UPDATE
ASIC Proceedings
NSW Court of Appeal judgement handed down on 17 December 2010
Company’s appeal dismissed
Non-executive directors’ appeals upheld
On 13 May 2011, ASIC and one former executive granted special leave to appeal to the High Court of Australia
Appeals were heard by the High Court over three days commencing 25 October 2011
Judgement has been reserved
47
James Hardie
ENDNOTES
This Management Presentation forms part of a package of information about the company’s results. It should be read in conjunction with the other parts of this package, including the Management’s Analysis of Results, Media Release and Condensed Consolidated Financial Statements.
Definitions
Non-financial Terms
ABS – Australian Bureau of Statistics.
AFFA – Amended and Restated Final Funding Agreement.
AICF – Asbestos Injuries Compensation Fund Ltd.
ASIC – Australian Securities and Investments Commission.
ATO – Australian Taxation Office.
NBSK – Northern Bleached Soft Kraft; the company’s benchmark grade of pulp.
Financial Measures – US GAAP equivalents
EBIT and EBIT Margin - EBIT, as used in this document, is equivalent to the US GAAP measure of operating income. EBIT margin is defined as EBIT as a percentage of net sales.
Operating profit - is equivalent to the US GAAP measure of income.
Net operating profit - is equivalent to the US GAAP measure of net income.
48
James Hardie
ENDNOTES (CONTINUED)
Sales Volumes
mmsf – million square feet, where a square foot is defined as a standard square foot of 5/16” thickness.
msf – thousand square feet, where a square foot is defined as a standard square foot of 5/16” thickness.
Financial Ratios
Gearing Ratio – Net debt (cash) divided by net debt (cash) plus shareholders’ equity.
Net interest expense cover – EBIT divided by net interest expense (excluding loan establishment fees).
Net interest paid cover – EBIT divided by cash paid during the period for interest, net of amounts capitalised.
Net debt payback – Net debt (cash) divided by cash flow from operations.
Net debt (cash) – Short-term and long-term debt less cash and cash equivalents.
Return on Capital employed – EBIT divided by gross capital employed.
49
James Hardie
NON-US GAAP FINANCIAL MEASURES
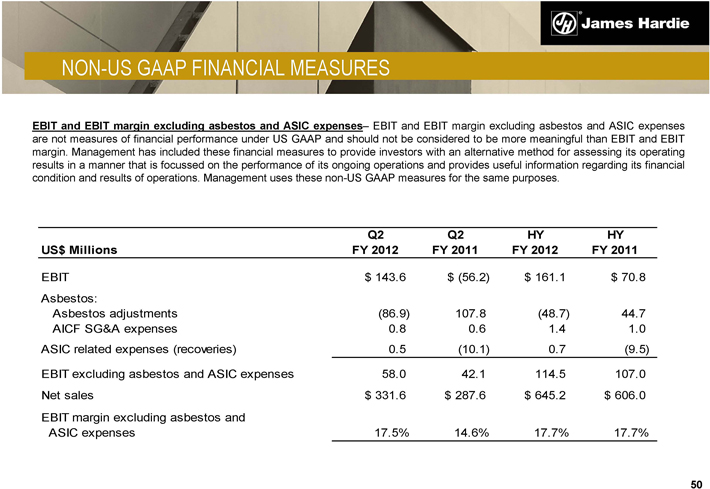
EBIT and EBIT margin excluding asbestos and ASIC expenses– EBIT and EBIT margin excluding asbestos and ASIC expenses are not measures of financial performance under US GAAP and should not be considered to be more meaningful than EBIT and EBIT margin. Management has included these financial measures to provide investors with an alternative method for assessing its operating results in a manner that is focussed on the performance of its ongoing operations and provides useful information regarding its financial condition and results of operations. Management uses these non-US GAAP measures for the same purposes.
Q2 Q2 HY HY
US$ Millions FY 2012 FY 2011 FY 2012 FY 2011
EBIT $ 143.6 $ (56.2) $ 161.1 $ 70.8
Asbestos:
Asbestos adjustments (86.9) 107.8 (48.7) 44.7
AICF SG&A expenses 0.8 0.6 1.4 1.0
ASIC related expenses (recoveries) 0.5 (10.1) 0.7 (9.5)
EBIT excluding asbestos and ASIC expenses 58.0 42.1 114.5 107.0
Net sales $ 331.6 $ 287.6 $ 645.2 $ 606.0
EBIT margin excluding asbestos and ASIC expenses 17.5% 14.6% 17.7% 17.7%
50
James Hardie
NON-US GAAP FINANCIAL MEASURES (CONTINUED)
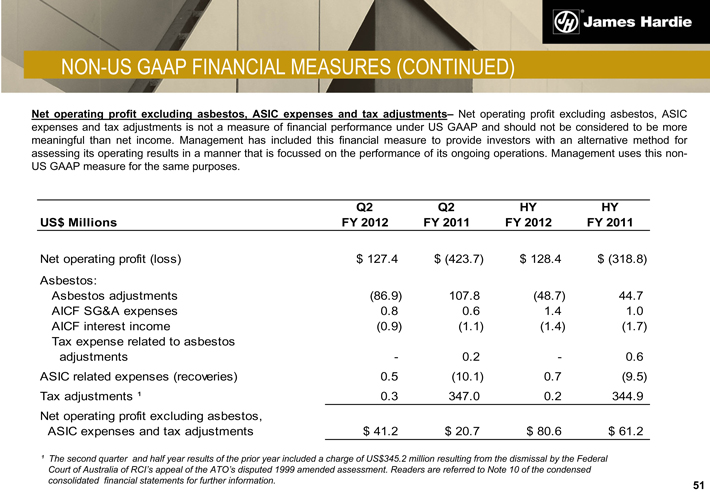
Net operating profit excluding asbestos, ASIC expenses and tax adjustments– Net operating profit excluding asbestos, ASIC expenses and tax adjustments is not a measure of financial performance under US GAAP and should not be considered to be more meaningful than net income. Management has included this financial measure to provide investors with an alternative method for assessing its operating results in a manner that is focussed on the performance of its ongoing operations. Management uses this non-US GAAP measure for the same purposes.
Q2 Q2 HY HY
US$ Millions FY 2012 FY 2011 FY 2012 FY 2011
Net operating profit (loss) $ 127.4 $ (423.7) $ 128.4 $ (318.8)
Asbestos:
Asbestos adjustments (86.9) 107.8 (48.7) 44.7
AICF SG&A expenses 0.8 0.6 1.4 1.0
AICF interest income (0.9) (1.1) (1.4) (1.7)
Tax expense related to asbestos adjustments - 0.2 - 0.6
ASIC related expenses (recoveries) 0.5 (10.1) 0.7 (9.5)
Tax adjustments 1 0.3 347.0 0.2 344.9
Net operating profit excluding asbestos,
ASIC expenses and tax adjustments $ 41.2 $ 20.7 $ 80.6 $ 61.2
1 The second quarter and half year results of the prior year included a charge of US$345.2 million resulting from the dismissal by the Federal Court of Australia of RCI’s appeal of the ATO’s disputed 1999 amended assessment. Readers are referred to Note 10 of the condensed consolidated financial statements for further information.
51
James Hardie
NON-US GAAP FINANCIAL MEASURES (CONTINUED)
Non-US GAAP Financial Measures (continued)
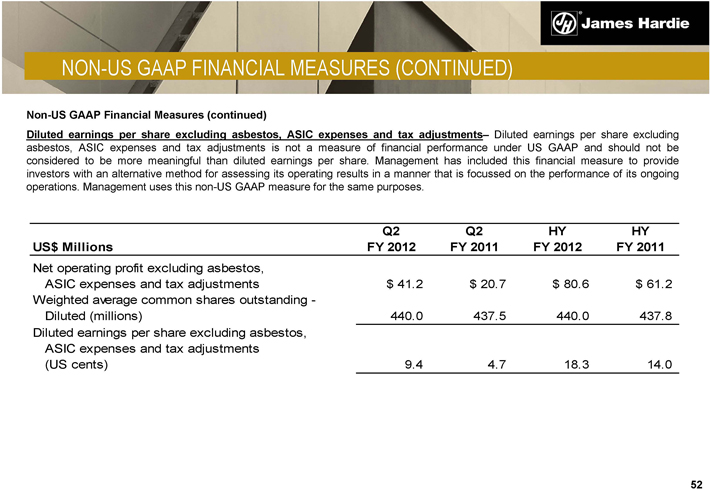
Diluted earnings per share excluding asbestos, ASIC expenses and tax adjustments– Diluted earnings per share excluding asbestos, ASIC expenses and tax adjustments is not a measure of financial performance under US GAAP and should not be considered to be more meaningful than diluted earnings per share. Management has included this financial measure to provide investors with an alternative method for assessing its operating results in a manner that is focussed on the performance of its ongoing operations. Management uses this non-US GAAP measure for the same purposes.
Q2 Q2 HY HY
US$ Millions FY 2012 FY 2011 FY 2012 FY 2011
Net operating profit excluding asbestos, ASIC expenses and tax adjustments $ 41.2 $ 20.7 $ 80.6 $ 61.2
Weighted average common shares outstanding - Diluted (millions) 440.0 437.5 440.0 437.8
Diluted earnings per share excluding asbestos, ASIC expenses and tax adjustments (US cents) 9.4 4.7 18.3 14.0
52
James Hardie
NON-US GAAP FINANCIAL MEASURES (CONTINUED)
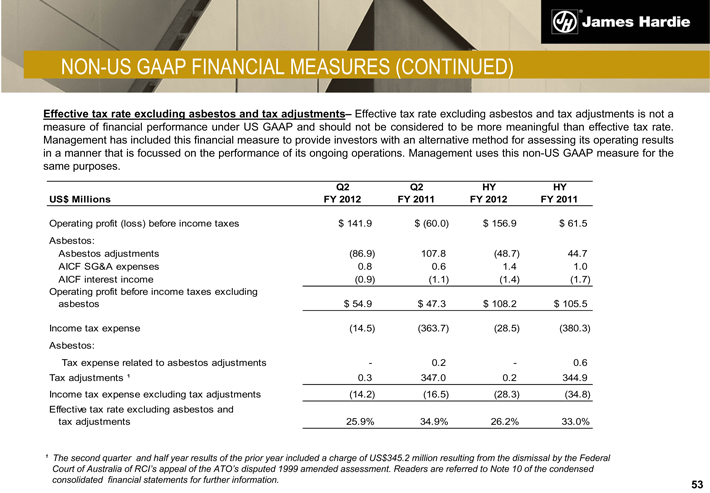
Effective tax rate excluding asbestos and tax adjustments– Effective tax rate excluding asbestos and tax adjustments is not a measure of financial performance under US GAAP and should not be considered to be more meaningful than effective tax rate. Management has included this financial measure to provide investors with an alternative method for assessing its operating results in a manner that is focussed on the performance of its ongoing operations. Management uses this non-US GAAP measure for the same purposes.
Q2 Q2 HY HY
US$ Millions FY 2012 FY 2011 FY 2012 FY 2011
Operating profit (loss) before income taxes $ 141.9 $ (60.0) $ 156.9 $ 61.5
Asbestos:
Asbestos adjustments (86.9) 107.8 (48.7) 44.7
AICF SG&A expenses 0.8 0.6 1.4 1.0
AICF interest income (0.9) (1.1) (1.4) (1.7)
Operating profit before income taxes excluding asbestos $ 54.9 $ 47.3 $ 108.2 $ 105.5
Income tax expense (14.5) (363.7) (28.5) (380.3)
Asbestos:
Tax expense related to asbestos adjustments - 0.2 - 0.6
Tax adjustments 1 0.3 347.0 0.2 344.9
Income tax expense excluding tax adjustments (14.2) (16.5) (28.3) (34.8)
Effective tax rate excluding asbestos and tax adjustments 25.9% 34.9% 26.2% 33.0%
1 The second quarter and half year results of the prior year included a charge of US$345.2 million resulting from the dismissal by the Federal
Court of Australia of RCI’s appeal of the ATO’s disputed 1999 amended assessment. Readers are referred to Note 10 of the condensed consolidated financial statements for further information.
53
James Hardie
NON-US GAAP FINANCIAL MEASURES (CONTINUED)
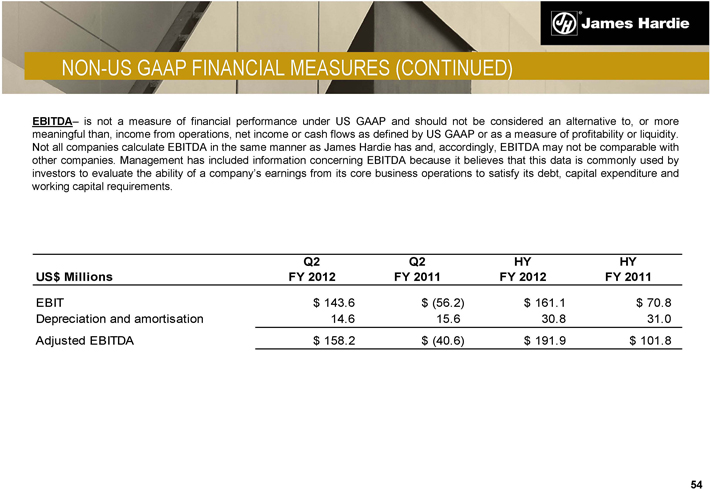
EBITDA– is not a measure of financial performance under US GAAP and should not be considered an alternative to, or more meaningful than, income from operations, net income or cash flows as defined by US GAAP or as a measure of profitability or liquidity. Not all companies calculate EBITDA in the same manner as James Hardie has and, accordingly, EBITDA may not be comparable with other companies. Management has included information concerning EBITDA because it believes that this data is commonly used by investors to evaluate the ability of a company’s earnings from its core business operations to satisfy its debt, capital expenditure and working capital requirements.
Q2 Q2 HY HY
US$ Millions FY 2012 FY 2011 FY 2012 FY 2011
EBIT $ 143.6 $ (56.2) $ 161.1 $ 70.8
Depreciation and amortisation 14.6 15.6 30.8 31.0
Adjusted EBITDA $ 158.2 $ (40.6) $ 191.9 $ 101.8
54
James Hardie
NON-US GAAP FINANCIAL MEASURES (CONTINUED)
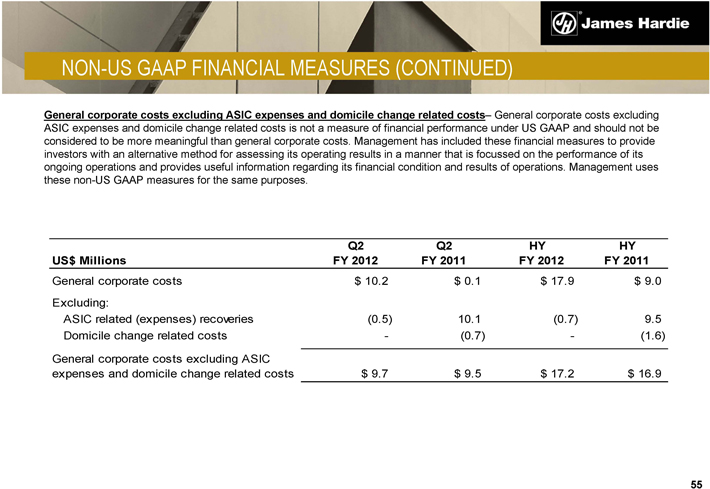
General corporate costs excluding ASIC expenses and domicile change related costs– General corporate costs excluding ASIC expenses and domicile change related costs is not a measure of financial performance under US GAAP and should not be considered to be more meaningful than general corporate costs. Management has included these financial measures to provide investors with an alternative method for assessing its operating results in a manner that is focussed on the performance of its ongoing operations and provides useful information regarding its financial condition and results of operations. Management uses these non-US GAAP measures for the same purposes.
Q2 Q2 HY HY
US$ Millions FY 2012 FY 2011 FY 2012 FY 2011
General corporate costs $ 10.2 $ 0.1 $ 17.9 $ 9.0
Excluding:
ASIC related (expenses) recoveries (0.5) 10.1 (0.7) 9.5
Domicile change related costs - (0.7) - (1.6)
General corporate costs excluding ASIC expenses and domicile change related costs $ 9.7 $ 9.5 $ 17.2 $ 16.9
55
James Hardie
Q2 FY12 MANAGEMENT PRESENTATION
17 November 2011