 INVESTOR
PRESENTATION Exhibit 99.4
October 2012 |
| INVESTOR
PRESENTATION Exhibit 99.4
October 2012 |
 DISCLAIMER
2
This Management Presentation contains forward-looking statements. James Hardie may from
time to time make forward-looking statements in its periodic reports filed with or furnished to the SEC, on Forms 20-F and 6-K, in its
annual reports to shareholders, in offering circulars, invitation memoranda and prospectuses,
in media releases and other written materials and in oral statements made by the company’s officers, directors or employees to analysts,
institutional investors, existing and potential lenders, representatives of the media and
others. Statements that are not historical facts are forward-looking statements and such forward-looking statements are statements made
pursuant to the Safe Harbor Provisions of the Private Securities Litigation Reform Act of 1995.
Examples of forward-looking statements include: statements about the company’s future performance; projections of the company’s results of operations or financial condition; statements regarding the company’s plans, objectives or goals, including those relating to
strategies, initiatives, competition, acquisitions, dispositions and/or our products;
expectations concerning the costs associated with the suspension or closure of operations at
any of the company’s plants and future plans with respect to any such plants;
expectations that the company’s credit facilities will be extended or renewed; expectations concerning dividend payments and share buy-backs; statements concerning the company’s corporate and tax domiciles and potential changes to
them, including potential tax charges;
statements regarding tax liabilities and related audits, reviews and proceedings; statements as to the possible consequences of proceedings brought against the company and
certain of its former directors and officers by the Australian Securities and Investments Commission (ASIC);
expectations about the timing and amount of contributions to the Asbestos Injuries Compensation
Fund (AICF), a special purpose fund for the compensation of proven Australian asbestos-related personal injury and death
claims;
expectations concerning indemnification obligations; statements regarding the company’s ability to manage legal and regulatory matters
(including but not limited to product liability, environmental, intellectual property and competition law matters) and to resolve any such
pending legal and regulatory matters within current estimates and in anticipation of certain
third-party recoveries; and
statements about economic conditions, such as economic or housing recovery, the levels of new
home construction and home renovations, unemployment levels, changes in consumer income, changes or stability in
housing values, the availability of mortgages and other financing, mortgage and other interest
rates, housing affordability and supply, the levels of foreclosures and home resales, currency exchange rates, and builder and
consumer
confidence.
Words such as “believe,” “anticipate,” “plan,”
“expect,” “intend,” “target,” “estimate,” “project,” “predict,” “forecast,” “guideline,” “aim,” “will,” “should,” “likely,”
“continue” and similar expressions are intended to identify forward-
looking statements but are not the exclusive means of identifying such statements. Readers are
cautioned not to place undue reliance on these forward-looking statements and all such forward-looking statements are qualified in
their entirety by reference to the following cautionary statements.
Forward-looking statements are based on the company’s current expectations, estimates
and assumptions and because forward-looking statements address future results, events and conditions, they, by their very nature, involve
inherent risks and uncertainties, many of which are unforeseeable and beyond the company’s
control. Such known and unknown risks, uncertainties and other factors may cause actual results, performance or other achievements to
differ materially from the anticipated results, performance or achievements expressed,
projected or implied by these forward-looking statements. These factors, some of which are discussed under “Risks Factors”
in Section 3 of the Form 20-F filed with the Securities and Exchange Commission on 2 July
2012, include, but are not limited to: all matters relating to or arising out of the prior manufacture of products that contained asbestos by
current and former James Hardie subsidiaries; required contributions to AICF, any shortfall in
AICF and the effect of currency exchange rate movements on the amount recorded in the company’s financial statements as an asbestos
liability; governmental loan facility to AICF; compliance with and changes in tax laws and
treatments; competition and product pricing in the markets in which the company operates; the consequences of product failures or defects;
exposure to environmental, asbestos, putative consumer class action or other legal proceedings;
general economic and market conditions; the supply and cost of raw materials; possible increases in competition and the potential that
competitors could copy the company’s products; reliance on a small number of customers; a
customer’s inability to pay; compliance with and changes in environmental and health and safety laws; risks of conducting business
internationally; compliance with and changes in laws and regulations; the effect of the
transfer of the company’s corporate domicile from The Netherlands to Ireland to become an Irish SE including employee relations, changes in
corporate governance and potential tax benefits; currency exchange risks; dependence on
customer preference and the concentration of the company’s customer base on large format retail customers, distributors and dealers;
dependence on residential and commercial construction markets; the effect of adverse changes in
climate or weather patterns; possible inability to renew credit facilities on terms favourable to the company, or at all; acquisition or
sale of businesses and business segments; changes in the company’s key management
personnel; inherent limitations on internal controls; use of accounting estimates; and all other risks identified in the company’s reports filed with
Australian, Irish and US securities agencies and exchanges (as appropriate). The company
cautions you that the foregoing list of factors is not exhaustive and that other risks and uncertainties may cause actual results to differ
materially from those in forward-looking statements. Forward-looking statements speak
only as of the date they are made and are statements of the company’s current expectations concerning future results, events and conditions.
|
 AGENDA
3
In this
Management
Presentation,
James
Hardie
may
present
financial
measures,
sales
volume
terms,
financial
ratios,
and
Non-US
GAAP
financial
measures
included
in
the
Definitions
section
of
this
document
starting
on
page
36.
The
company
presents
financial
measures
that
it
believes
are
customarily
used
by
its
Australian investors. Specifically, these financial measures, which are equivalent
to or derived from certain US GAAP measures as explained in the definitions, include
“EBIT”, “EBIT margin”, “Operating profit”
and “Net operating profit”. The company may also present other terms for
measuring its sales volumes (“million square feet” or
“mmsf” and “thousand square feet”
or “msf”); financial ratios (“Gearing ratio”, “Net
interest expense cover”, “Net interest paid cover”, “Net debt payback”, “Net debt
(cash)”); and Non-US GAAP financial measures (“EBIT excluding
asbestos and ASIC expenses”, “EBIT margin excluding asbestos and ASIC expenses”, “Net
operating profit excluding asbestos, ASIC expenses and tax adjustments”,
“Diluted earnings per share excluding asbestos, ASIC expenses, and tax adjustments”,
“Operating
profit
before
income
taxes
excluding
asbestos”,
“Effective
tax
rate
excluding
asbestos
and
tax
adjustments”,
“EBITDA”
and
“General
corporate
costs
excluding
ASIC
expenses
and
intercompany
foreign
exchange
gain”).
Unless
otherwise
stated,
results
and
comparisons
are
of
the
1st
quarter
of
the
current
fiscal
year versus the 1st quarter of the prior fiscal year.
Business overview
USA and Europe Fibre Cement
Asia Pacific Fibre Cement
Group Outlook
Summary
Appendix |
 Annual net sales
US$1.2b Total assets US$1.7b
Net cash US$265.4m
Operations in North America, Asia Pacific
and Europe
2,600 employees
Market cap US$3.9b
S&P/ASX 100 company
NYSE ADR listing
Note:
Net
sales,
total
assets
and
net
cash
are
at
31
March
2012.
Total
assets
exclude
asbestos
compensation.
JAMES HARDIE: A GROWTH FOCUSED COMPANY
4 |
 GROUP
OVERVIEW 1
Comparisons are of the full year of the current fiscal year versus the full year of
the prior fiscal year The net operating result excluding asbestos, ASIC
expenses, asset impairments and tax adjustments for the full year increased
20% to US$140.4 million 1
US$ Millions
%
FY 2012
FY 2011
Change
Net operating profit (loss)
604.3
116.7
20
Net operating profit excluding asbestos, asset impairments, ASIC
expenses and tax adjustments
140.4
116.7
20
Diluted earnings per share excluding asbestos, asset impairments,
ASIC expenses and tax adjustments (US cents)
32.1
26.7
20
5 |
 USA
Fibre Cement Products Siding
Soffit
Fascia
Trim
Backerboard
Asia Pacific Fibre Cement Products
Residential siding
Commercial exteriors
Flooring
Ceiling and internal walls
JAMES HARDIE –
A WORLD LEADER IN FIBRE CEMENT
6 |
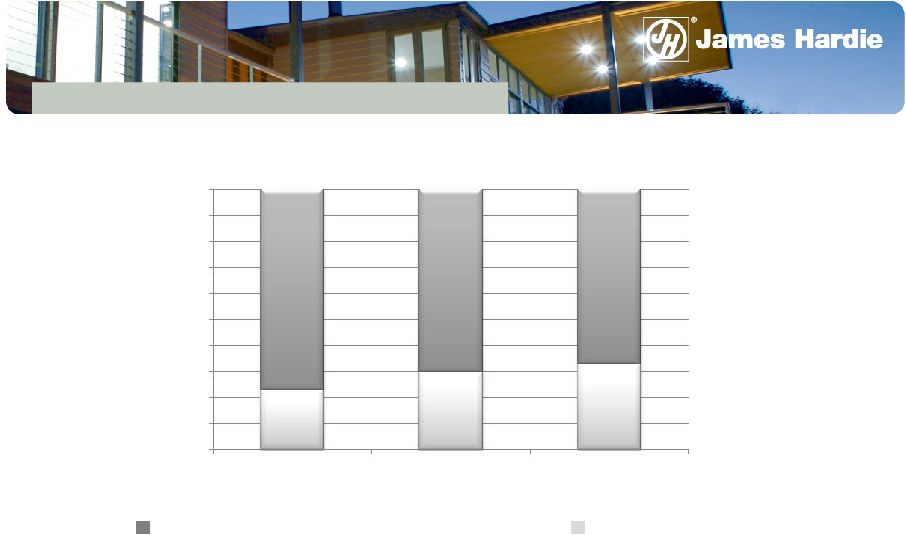 GLOBAL
-
BUSINESS
PORTFOLIO
77%
67%
33%
23%
70%
30%
* EBIT –
Excludes Research and Development EBIT and Asbestos-related items
USA and Europe Fibre Cement
Asia-Pacific Fibre Cement
Volume
Sales
EBIT*
7 |
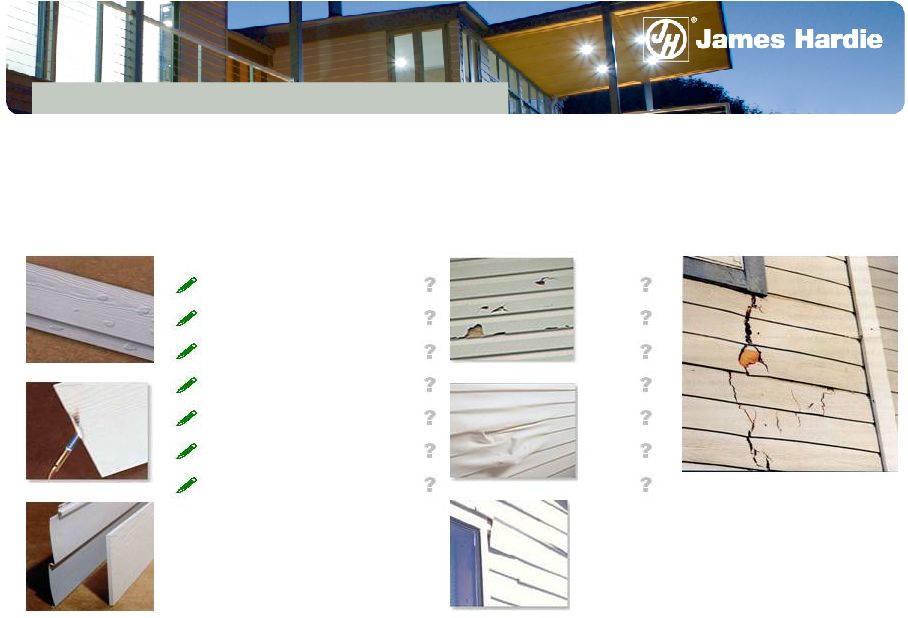 Fibre cement
is more durable than wood and engineered wood, and looks and performs better than
vinyl, and cheaper and quicker to build with than brick Fire resistant
Hail resistant
Resists warping
Resists buckling
Colour lasts longer
Dimensional stability
Can be repainted
Engineered wood
FIBRE
CEMENT
–
SUPERIOR
PRODUCT
PERFORMANCE
8
Vinyl
Fibre cement |
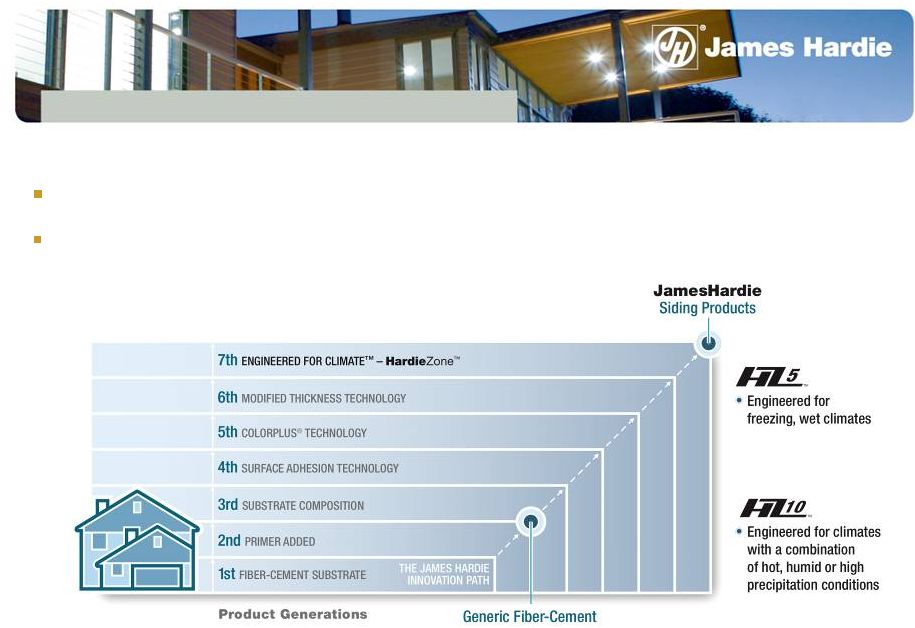 9
7
Generation versus 2 Generation generic fibre cement
The HardieZone™
System represents a logical extension of Hardie technology
PRODUCT
LEADERSHIP
EXAMPLE
–
HARDIEZONE™
SYSTEM
th
nd |
 THE
USA
BUSINESS
–
LARGEST
FIBRE
CEMENT
PRODUCER
IN
NORTH
AMERICA
Flat Sheet
Plants
Capacity
(mmsf)
Plants operating
Cleburne, Texas
500
Peru, Illinois
560
Plant City, Florida
300
Pulaski, Virginia
600
Reno, Nevada
300
Tacoma, Washington
200
Waxahachie, Texas
360
Plants suspended
Blandon, Pennsylvania
200
Fontana, California
180
Summerville, South
Carolina
190
Flat Sheet Total
3,390
Plant locations
1
Production was suspended at the
Blandon plant in October 2007; at the
Summerville plant in November 2008;
and at the Fontana plant in December
2008
•
Tacoma, WA
Plant City, FL
Waxahachie, TX
Cleburne, TX
Peru,
IL
Blandon, PA
Summerville, SC
Pulaski, VA
•
Reno, NV
•
Fontana, CA
JH Plant Design Capacity
10
1
1
1 |
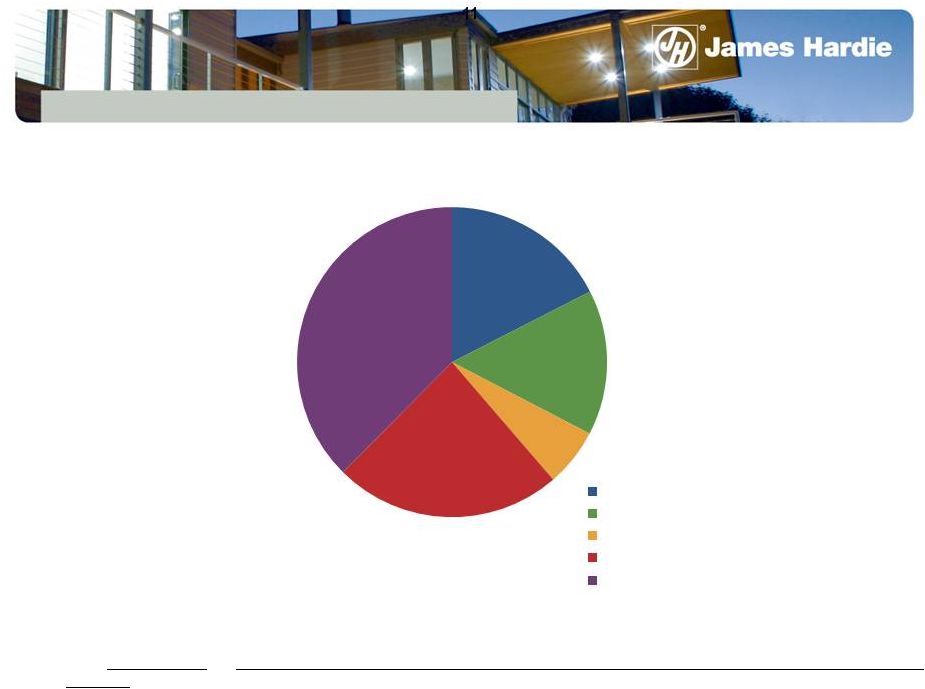 11
US EXTERIOR CLADDING MARKET
Note:
1) Market share figures reflect siding only; exclude fascia, soffits & trim;
data reflects Repair & Remodel and New Construction markets, combined. 2)
Siding volumes
exclude
waste
factors,
a
change
from
previously
reported
numbers.
Sources:
NAHB Builder
Practices
and Consumer
Practices
Report
–
2008
Siding
and
Exterior
Wall
Finish,
adjusted
to
reflect
JH’s
estimate
for
FC
and
wood
categories.
Large growth opportunity
11
17%
15%
6%
24%
38%
Wood
Fibre Cement
Stucco
Bricks, Stone and Other
Vinyl |
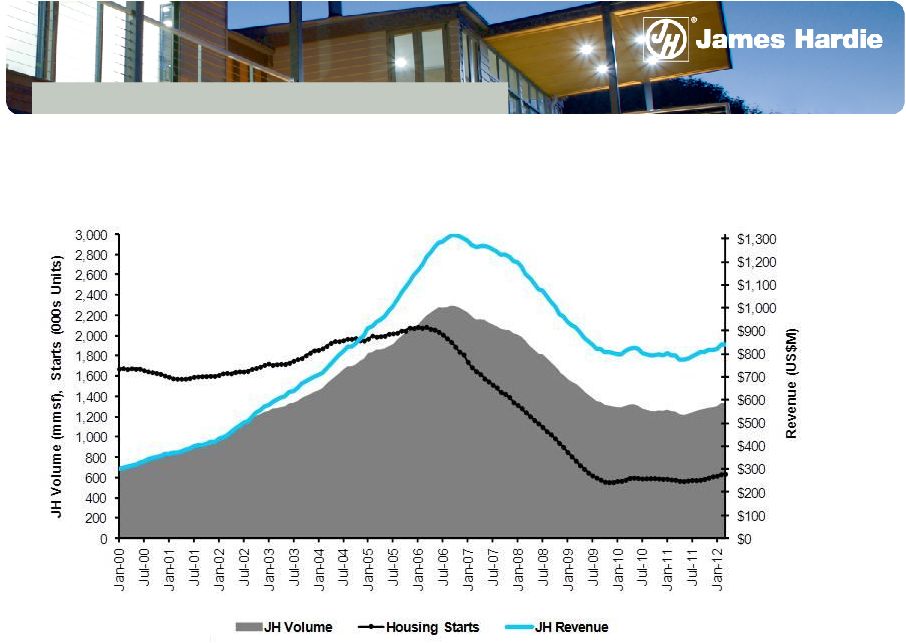 Rolling 12 month average of seasonally adjusted estimate of housing starts by US
Census Bureau USA FIBRE CEMENT
12
Top Line Growth |
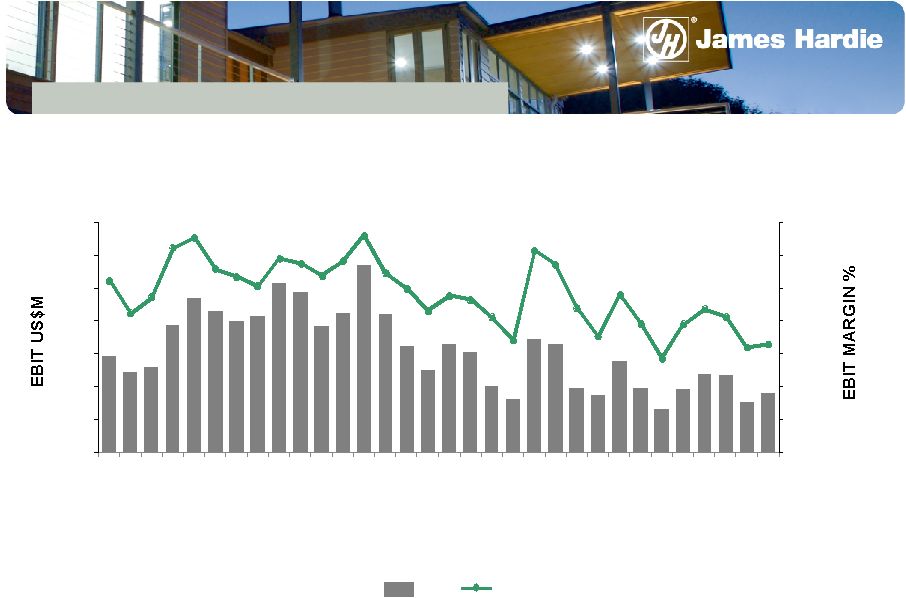 USA AND
EUROPE FIBRE CEMENT 1
Excludes impairment charges of US$45.6 million in Q4 FY08 and US$14.3 million in Q4
FY12 EBIT and EBIT Margin
EBIT
EBIT Margin
0
5
10
15
20
25
30
35
0
20
40
60
80
100
120
140
FY05
FY06
FY07
FY08
FY09
FY10
FY11
FY12
1
13 |
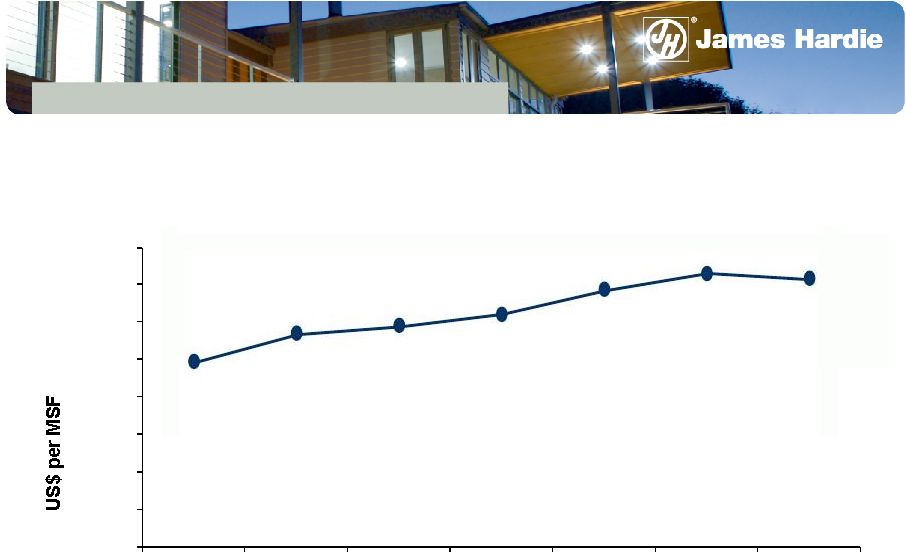 USA
AND EUROPE FIBRE CEMENT 14
Average Net Sales Price (US dollars)
360
400
440
480
520
560
600
640
680
FY06
FY07
FY08
FY09
FY10
FY11
FY12
US$647 |
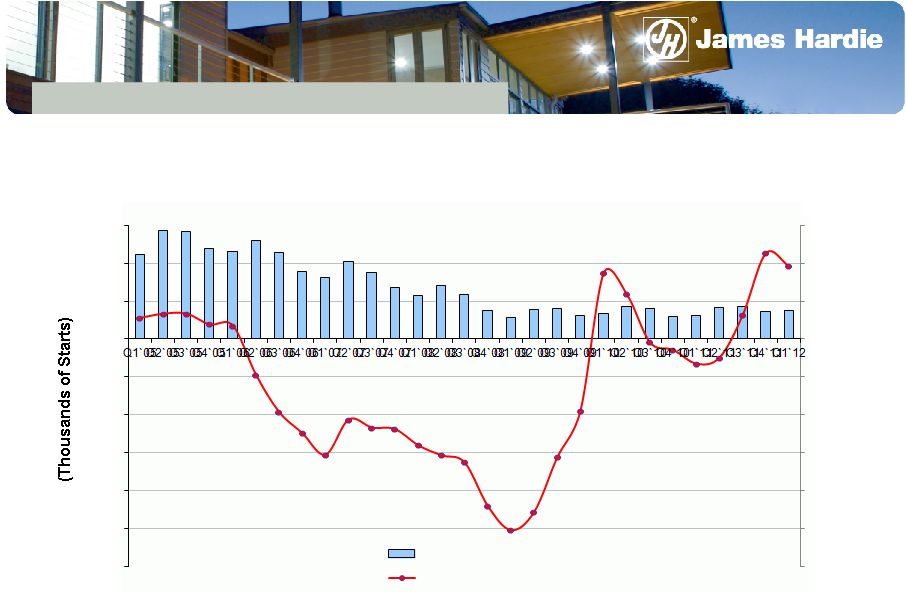 TOTAL
USA
HOUSING
STARTS
–
US
CENSUS
15
Source:
US
Census
Bureau
-
New
Privately-Owned
Housing
Units
Started
-60%
-50%
-40%
-30%
-20%
-10%
0%
10%
20%
30%
-1200
-1000
-800
-600
-400
-200
200
400
600
U.S. Housing Starts
Calendar Quarters
Housing starts
%Growth (same QtrPY)
0 |
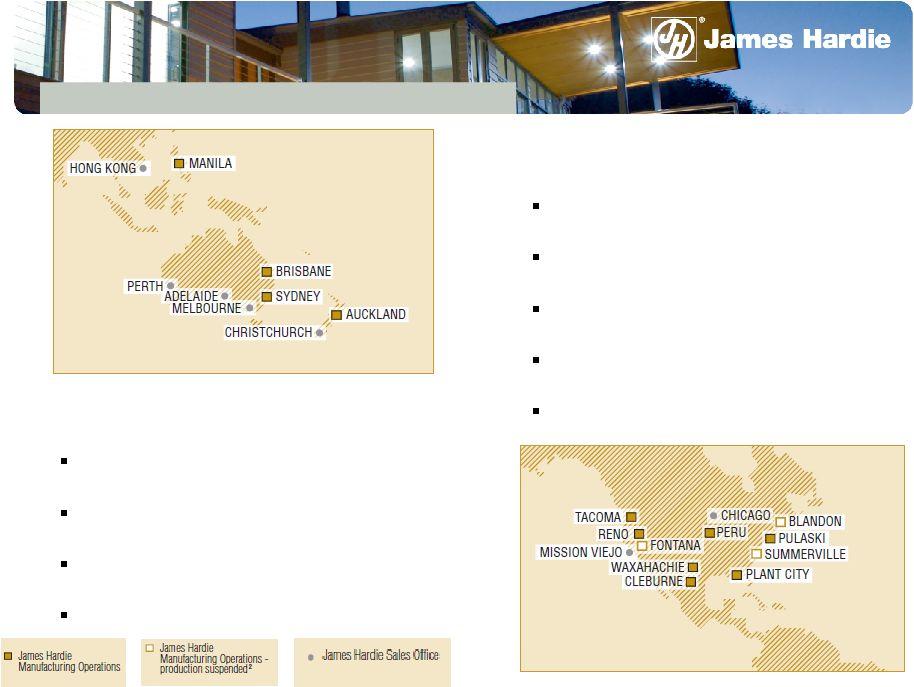
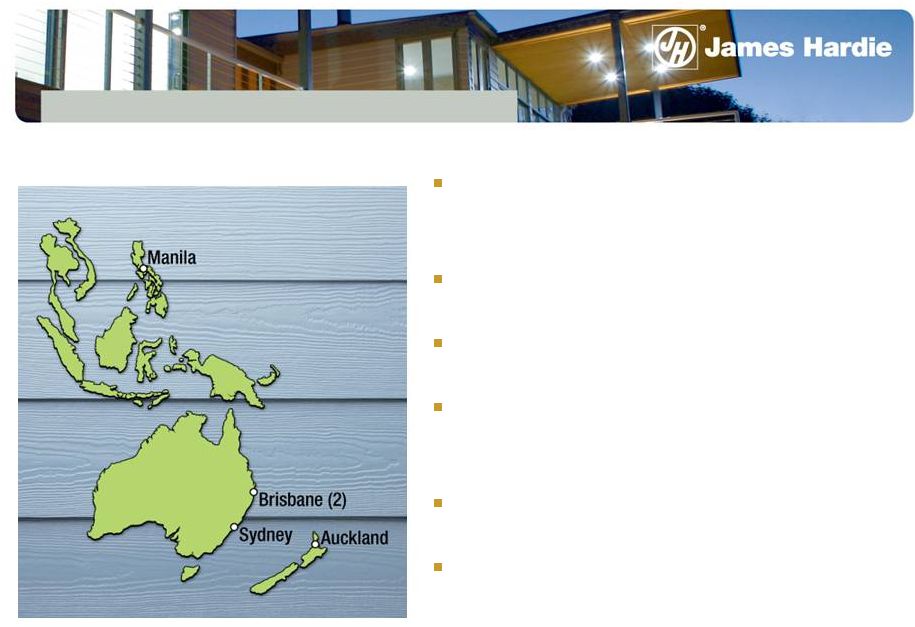 16
Five manufacturing plants in
Asia Pacific
Net sales US$376m
EBIT US$80m
Higher value differentiated
products
Lower delivered cost
Growth model
ASIA PACIFIC FIBRE CEMENT
Asia
Pacific
manufacturing
facilities.
Net
Sales
and
EBIT
as
at
31
March
2012. |
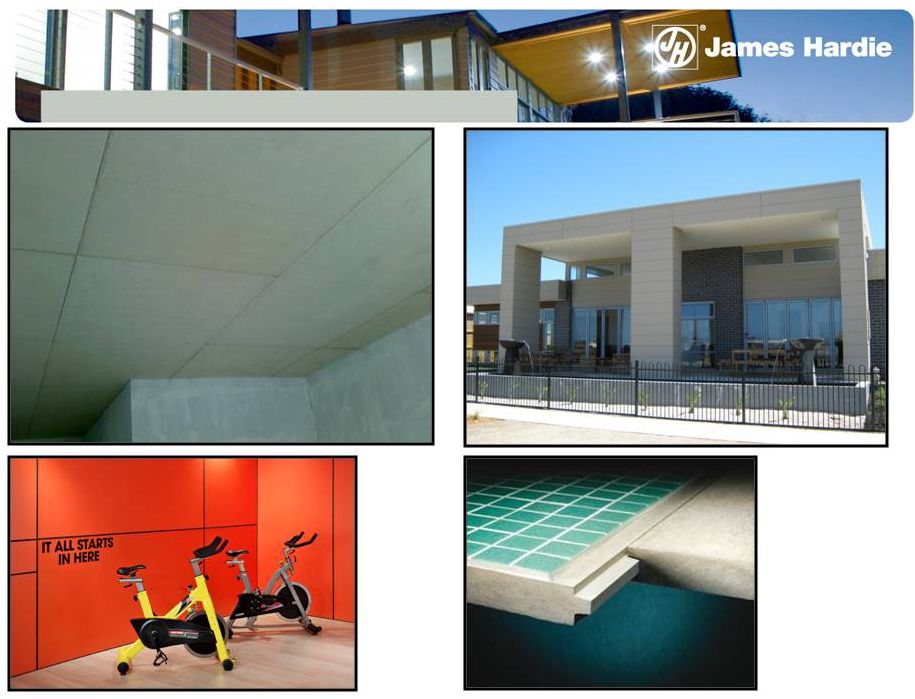 17
ASIA
PACIFIC
FIBRE
CEMENT
–
EXAMPLES
General purpose flooring
Exterior cladding
Philippines
Australia
New Zealand
Australia
Ceilings and partitions
Interior walls
17 |
 CAPITAL
MANAGEMENT A dividend
of
US38.0
cents
per
security
was
paid
on
23
July
2012
from
FY2012
earnings.
The
total
amount of the dividend was US$166.4 million
The
full
year
dividend
from
FY2012
earnings
was
US42.0
cents
per
security.
The
full
year
dividend
was
at
the
top
end
of
the
dividend
payout
ratio
of
20%
to
30%
of
profits
after
tax
(excluding
asbestos
adjustments)
On 21 May 2012, the company announced a new share buyback program to acquire up to
5% of its issued capital during the following twelve months
Administrative arrangements for the buyback have been completed and purchases may
commence in the future depending on market conditions and pricing
The company is continuing to explore options to improve capital efficiency through
a more appropriately leveraged balance sheet
18 |
 19
GROUP OUTLOOK
United States
Some
encouraging
industry
data
points
continued
to
emerge
during
the
quarter,
including
increased stability of house values in recent months
Early stages of a recovery in residential market appears to be underway
The extent and rate of improvement, however, is uncertain
Cost pressures are expected to remain at elevated levels when compared to historic
long-term averages
Asia Pacific
In Australia the market environment has weakened, reflecting an overall decline in
confidence In New Zealand the market continues to operate at subdued
levels The operating environment in the Philippines remains robust
|
 We
have a strong, well-established, growth-focused, strong cash-generating and high
return business
We have a sustainable competitive advantage
Our model for strong growth is based on:
–
Large market opportunity
–
Superior value proposition
–
Proprietary and/or protected technology
–
Ongoing commitment to research and development
–
Significant organisational advantages
–
Focused strategy and organisational effort
–
Scale
Throughout the low demand environment the company has performed exceptionally
well, consistently delivering solid financial returns
The company is well positioned to leverage its increased capabilities as the
recovery progresses
SUMMARY
20 |
 APPENDIX |
 22
Aggressively grow demand
for our products in targeted
market segments
Grow our overall market
position while defending our
share in existing market
segments
Introduce differentiated
products to deliver a
sustainable competitive
advantage
Industry
leadership and profitable growth
GLOBAL STRATEGY |
 *
Certain reclassifications have been reflected in the prior period shown above to
conform with current period presentation 1
Excludes
asbestos
adjustments,
AICF
SG&A
expenses,
AICF
interest
income,
gain
or
impairment
on
AICF
investments, tax benefits related to asbestos adjustments, ASIC
expenses/recoveries, tax adjustments and impairment charge 2
Excludes asbestos adjustments, AICF SG&A expenses, ASIC
expenses/recoveries and impairment charge 3
Excludes payments under the AFFA
23
*
KEY RATIOS
FY2012
FY 2011
FY 2010
EPS (Diluted)
32.1c
26.7c
30.5c
Dividend Paid per share
4.0c
N/A
N/A
Return on Shareholders’
Funds
10.9%
10.0%
13.3%
Return on Capital Employed
20.4%
19.7%
17.4%
EBIT/ Sales (EBIT margin)
15.3%
15.8%
18.6%
Gearing Ratio
-24.5%
3.2%
10.9%
Net Interest Expense Cover
23.8x
22.9x
28.6x
Net Interest Paid Cover
23.7x
21.8x
29.0x
Net Debt Payback
-
0.2yrs
0.7yrs
1, 3
1, 3
2, 3
2
1
2
2 |
 24
USA AND EUROPE 5 YEAR RESULTS OVERVIEW
FY07
FY08
FY09
FY10
FY11
FY12
Net Sales
US$m
1,262
1,144
910
828
814
862
Sales Volume
mmsf
2,148
1,916
1,508
1,303
1,248
1,332
Average Price
US$ per msf
588
597
604
635
652
647
EBIT
US$m
362
313
200
208
160
156
EBIT Margin
%
29
27
22
25
20
19 |
 25
ASIA PACIFIC 5 YEAR RESULTS OVERVIEW
FY07
FY08
FY09
FY10
FY11
FY12
Net Sales
US$m
223
298
273
296
353
376
Sales Volume
mmsf
390
398
390
389
407
392
Average Price
US$ per msf
842
862
879
894
916
916
EBIT
US$m
39
50
47
58
79
79
EBIT Margin
%
16
17
17
20
23
21 |
 This Management Presentation forms part of a package of information about the
company’s results. It should be read in conjunction with the
other parts of this package, including the Management’s Analysis of Results, Media Release and Consolidated Financial
Statements.
Definitions
Non-financial Terms
ABS
–
Australian Bureau of Statistics.
AFFA
–
Amended and Restated Final Funding Agreement.
AICF
–
Asbestos Injuries Compensation Fund Ltd.
ASIC
–
Australian Securities and Investments Commission.
ATO
–
Australian Taxation Office.
NBSK –
Northern Bleached Soft Kraft; the company's benchmark grade of pulp.
Financial Measures –
US GAAP equivalents
EBIT and EBIT Margin
-
EBIT, as used in this document, is equivalent to the US GAAP measure of operating
income. EBIT margin is defined as EBIT as a percentage of net sales.
Operating profit
-
is equivalent to the US GAAP measure of income.
Net operating profit
-
is equivalent to the US GAAP measure of net income.
26
ENDNOTES |
 Sales Volumes
mmsf
–
million
square
feet,
where
a
square
foot
is
defined
as
a
standard
square
foot
of
5/16”
thickness.
msf
–
thousand
square
feet,
where
a
square
foot
is
defined
as
a
standard
square
foot
of
5/16”
thickness.
Financial Ratios
Gearing
Ratio
–
Net
debt
(cash)
divided
by
net
debt
(cash)
plus
shareholders’
equity.
Net interest expense cover
–
EBIT divided by net interest expense (excluding loan establishment fees).
Net
interest
paid
cover
–
EBIT
divided
by
cash
paid
during
the
period
for
interest,
net
of
amounts
capitalised.
Net debt payback
–
Net debt (cash) divided by cash flow from operations.
Net debt (cash)
–
Short-term and long-term debt less cash and cash equivalents.
Return on Capital employed
–
EBIT divided by gross capital employed.
27
ENDNOTES (CONTINUED) |
  RESULTS
– Q1
28
US$ Millions
Q1 '13
Q1 '12
% Change
Net sales
339.7
313.6
8
Gross profit
110.0
108.2
2
SG&A expenses
(44.3)
(45.5)
3
Research & Development expenses
(8.4)
(7.0)
(20)
Asbestos adjustments
25.2
(38.2)
-
EBIT
82.5
17.5
-
Net interest expense (expense)
0.2
(1.0)
-
Other income (expense)
0.4
(1.5)
-
Income tax expense
(14.6)
(14.0)
(4)
Net operating profit
68.5
1.0
- |
 EBIT
and
EBIT
margin
excluding
asbestos
and
ASIC
expenses
29
NON-US GAAP FINANCIAL MEASURES
Q1
Q1
US$ Millions
FY 2013
FY 2012
EBIT
$ 82.5
$ 17.5
Asbestos:
Asbestos adjustments
(25.2)
38.2
AICF SG&A expenses
0.3
0.6
ASIC related expenses
0.1
0.2
EBIT excluding asbestos and ASIC expenses
57.7
56.5
Net sales
$ 339.7
$ 313.6
EBIT margin excluding asbestos and ASIC
expenses
17.0%
18.0%
–
EBIT and EBIT margin excluding asbestos and ASIC expenses are not
measures of financial performance under US GAAP and should not be considered to be more meaningful
than EBIT and EBIT margin. Management has included these financial measures to provide
investors with an alternative method for assessing its operating results in a manner that is
focussed on the performance of its ongoing operations and provides useful information regarding its financial condition and results of
operations. Management uses these non-US GAAP measures for the same purposes.
|
 Net
operating
profit
excluding
asbestos,
ASIC
expenses
and
tax
adjustments
–
Net
operating
profit
excluding
asbestos,
ASIC
expenses
and
tax
adjustments is not a measure of financial performance under US GAAP and should not
be considered to be more meaningful than net income. Management has included
this financial measure to provide investors with an alternative method for assessing its operating results in a manner that is
focussed on the performance of its ongoing operations. Management uses this
non-US GAAP measure for the same purposes. 30
NON-US GAAP FINANCIAL MEASURES (CONTINUED)
Q1
Q1
US$ Millions
FY 2013
FY 2012
Net operating profit
$ 68.5
$ 1.0
Asbestos:
Asbestos adjustments
(25.2)
38.2
AICF SG&A expenses
0.3
0.6
AICF interest income
(1.1)
(0.5)
Tax expense related to asbestos
adjustments
2.2
-
ASIC related expenses
0.1
0.2
Tax adjustments
(1.0)
(0.1)
Net operating profit excluding asbestos, ASIC
expenses and tax adjustments
$ 43.8
$ 39.4 |
 Non-US GAAP Financial Measures (continued)
Diluted
earnings
per
share
excluding
asbestos,
ASIC
expenses
and
tax
adjustments
–
Diluted
earnings
per
share
excluding
asbestos,
ASIC
expenses and tax adjustments is not a measure of financial performance under US
GAAP and should not be considered to be more meaningful than diluted
earnings per share. Management has included this financial measure to provide investors with an alternative method for assessing its operating
results in a manner that is focussed on the performance of its ongoing operations.
Management uses this non-US GAAP measure for the same purposes.
31
NON-US GAAP FINANCIAL MEASURES (CONTINUED)
Q1
Q1
US$ Millions
FY 2013
FY 2012
Net operating profit excluding asbestos, ASIC
expenses and tax adjustments
$ 43.8
$ 39.4
Weighted average common shares outstanding -
Diluted (millions)
438.5
438.7
Diluted earnings per share excluding asbestos, ASIC
expenses and tax adjustments
(US cents)
10.0
9.0 |
 Effective
tax
rate
excluding
asbestos
and
tax
adjustments
–
Effective
tax
rate
excluding
asbestos
and
tax
adjustments
is
not
a
measure
of
financial
performance
under
US
GAAP
and
should
not
be
considered
to
be
more
meaningful
than
effective
tax
rate.
Management
has
included
this financial measure to provide investors with an alternative method for
assessing its operating results in a manner that is focussed on the
performance of its ongoing operations. Management uses this non-US GAAP measure
for the same purposes. 32
NON-US GAAP FINANCIAL MEASURES (CONTINUED)
Q1
Q1
US$ Millions
FY 2013
FY 2012
Operating profit before income taxes
$ 83.1
$ 15.0
Asbestos:
Asbestos adjustments
(25.2)
38.2
AICF SG&A expenses
0.3
0.6
AICF interest income
(1.1)
(0.5)
Operating profit before income taxes excluding
asbestos
$ 57.1
$ 53.3
Income tax expense
(14.6)
(14.0)
Asbestos:
Tax expense related to asbestos adjustments
2.2
-
Tax adjustments
(1.0)
(0.1)
Income tax expense excluding tax adjustments
(13.4)
(14.1)
Effective tax rate excluding asbestos and tax
adjustments
23.5%
26.5% |
 EBITDA
–
is not a measure of financial performance under US GAAP and should not be
considered an alternative to, or more meaningful than, income from
operations, net income or cash flows as defined by US GAAP or as a measure of profitability or liquidity. Not all companies calculate
EBITDA in the same manner as James Hardie has and, accordingly, EBITDA may not be
comparable with other companies. Management has included information
concerning EBITDA because it believes that this data is commonly used by investors to evaluate the ability of a company’s
earnings from its core business operations to satisfy its debt, capital expenditure
and working capital requirements. 33
NON-US GAAP FINANCIAL MEASURES (CONTINUED)
Q1
Q1
US$ Millions
FY 2013
FY 2012
EBIT
$ 82.5
$ 17.5
Depreciation and amortisation
15.4
16.2
Adjusted EBITDA
$ 97.9
$ 33.7 |
 General
corporate
costs
excluding
ASIC
expenses
and
intercompany
foreign
exchange
gain
–
General
corporate
costs
excluding
ASIC
expenses
and
intercompany
foreign
exchange
gain
is
not
a
measure
of
financial
performance
under
US
GAAP
and
should
not
be
considered
to
be more meaningful than general corporate costs. Management has included these
financial measures to provide investors with an alternative method for
assessing its operating results in a manner that is focussed on the performance of its ongoing operations and provides useful
information regarding its financial condition and results of operations. Management
uses these non-US GAAP measures for the same purposes. 34
NON-US GAAP FINANCIAL MEASURES (CONTINUED)
Q1
Q1
US$ Millions
FY 2012
General corporate costs
$ 4.4
$ 7.7
Excluding:
ASIC related expenses
(0.1)
(0.2)
Intercompany foreign exchange gain
5.5
-
General corporate costs excluding
ASIC expenses and intercompany foreign
exchange gain
$ 9.8
$ 7.5
FY 2013 |
 INVESTOR
PRESENTATION October 2012 |