 Q2 FY13
MANAGEMENT PRESENTATION 15 November
2012
Exhibit 99.4 |
| Q2 FY13
MANAGEMENT PRESENTATION 15 November
2012
Exhibit 99.4 |
 DISCLAIMER
2
This Management Presentation contains forward-looking statements. James Hardie may from
time to time make forward-looking statements in its periodic reports filed with or furnished to the SEC, on Forms 20-F and 6-K, in its
annual reports to shareholders, in offering circulars, invitation memoranda and prospectuses,
in media releases and other written materials and in oral statements made by the company’s officers, directors or employees to
analysts, institutional investors, existing and potential lenders, representatives of the
media and others. Statements that are not historical facts are forward-looking statements and such forward-looking statements are
statements made pursuant to the Safe Harbor Provisions of the Private Securities Litigation
Reform Act of 1995. Examples of forward-looking statements include: statements about the company’s future performance;
projections of the company’s results of operations or financial condition;
statements regarding the company’s plans, objectives or goals, including those relating
to strategies, initiatives, competition, acquisitions, dispositions and/or our products; expectations concerning the costs associated with the suspension or closure of
operations at any of the company’s plants and future plans with respect to any such plants;
expectations that the company’s credit facilities will be extended or renewed;
expectations concerning dividend payments and share buy-backs;
statements concerning the company’s corporate and tax domiciles and structures and
potential changes to them, including potential tax charges; statements regarding tax liabilities and related audits, reviews and proceedings;
statements as to the possible consequences of proceedings brought against the company and
certain of its former directors and officers by the Australian Securities and Investments Commission (ASIC);
expectations about the timing and amount of contributions to the Asbestos Injuries
Compensation Fund (AICF), a special purpose fund for the compensation of proven Australian asbestos-related personal injury and
death claims;
expectations concerning indemnification obligations;
statements regarding the company’s ability to manage legal and regulatory matters
(including but not limited to product liability, environmental, intellectual property and competition law matters) and to resolve any such
pending legal and regulatory matters within current estimates and in anticipation of certain
third-party recoveries; and statements about economic conditions, such as economic or housing recovery, the levels of new
home construction and home renovations, unemployment levels, changes in consumer income, changes or stability in
housing values, the availability of mortgages and other financing, mortgage and other interest
rates, housing affordability and supply, the levels of foreclosures and home resales, currency exchange rates, and builder and
consumer confidence.
Words such as “believe,” “anticipate,” “plan,”
“expect,” “intend,” “target,” “estimate,” “project,” “predict,” “forecast,” “guideline,” “aim,” “will,” “should,” “likely,”
“continue” and similar expressions are intended to identify
forward-looking statements but are not the exclusive means of identifying such statements.
Readers are cautioned not to place undue reliance on these forward-looking statements and all such forward-looking statements are
qualified in their entirety by reference to the following cautionary statements.
Forward-looking statements are based on the company’s current expectations, estimates
and assumptions and because forward-looking statements address future results, events and conditions, they, by their very nature,
involve inherent risks and uncertainties, many of which are unforeseeable and beyond the
company’s control. Such known and unknown risks, uncertainties and other factors may cause actual results, performance or other
achievements to differ materially from the anticipated results, performance or achievements
expressed, projected or implied by these forward-looking statements. These factors, some of which are discussed under “Risks
Factors” in Section 3 of the Form 20-F filed with the Securities and Exchange
Commission on 2 July 2012, include, but are not limited to: all matters relating to or arising out of the prior manufacture of products that contained
asbestos by current and former James Hardie subsidiaries; required contributions to AICF, any
shortfall in AICF and the effect of currency exchange rate movements on the amount recorded in the company’s financial statements
as an asbestos liability; governmental loan facility to AICF; compliance with and changes in
tax laws and treatments; competition and product pricing in the markets in which the company operates; the consequences of product
failures or defects; exposure to environmental, asbestos, putative consumer class action or
other legal proceedings; general economic and market conditions; the supply and cost of raw materials; possible increases in
competition and the potential that competitors could copy the company’s products;
reliance on a small number of customers; a customer’s inability to pay; compliance with and changes in environmental and health and safety
laws; risks of conducting business internationally; compliance with and changes in laws and
regulations; the effect of the transfer of the company’s corporate domicile from The Netherlands to Ireland including employee
relations, changes in corporate governance and potential tax benefits; currency exchange
risks; dependence on customer preference and the concentration of the company’s customer base on large format retail customers,
distributors and dealers; dependence on residential and commercial construction markets; the
effect of adverse changes in climate or weather patterns; possible inability to renew credit facilities on terms favourable to the
company, or at all; acquisition or sale of businesses and business segments; changes in the
company’s key management personnel; inherent limitations on internal controls; use of accounting estimates; and all other risks
identified in the company’s reports filed with Australian, Irish and US securities
agencies and exchanges (as appropriate). The company cautions you that the foregoing list of factors is not exhaustive and that other risks and
uncertainties may cause actual results to differ materially from those in forward-looking
statements. Forward-looking statements speak only as of the date they are made and are statements of the company’s current
expectations concerning future results, events and conditions. The company assumes no
obligation to update any forward-looking statements or information except as required by law. |
 AGENDA
Overview and Operating Review –
Louis Gries, CEO
Financial Review –
Russell Chenu, CFO
Questions and Answers
3
In
this
Management
Presentation,
James
Hardie
may
present
financial
measures,
sales
volume
terms,
financial
ratios,
and
Non-US
GAAP
financial
measures
included
in
the
Definitions
section
of
this
document
starting
on
page
46.
The
company
presents
financial
measures
that
it
believes
are
customarily
used
by
its
Australian investors. Specifically, these financial measures, which are equivalent to or
derived from certain US GAAP measures as explained in the definitions, include
“EBIT”,
“EBIT
margin”,
“Operating
profit”
and
“Net
operating
profit”.
The
company
may
also
present
other
terms
for
measuring
its
sales
volumes
(“million
square
feet”
or
“mmsf”
and
“thousand
square
feet”
or
“msf”);
financial
ratios
(“Gearing
ratio”,
“Net
interest
expense
cover”,
“Net
interest
paid
cover”,
“Net
debt
payback”, “Net debt (cash)”); and Non-US GAAP financial measures
(“EBIT excluding asbestos and ASIC expenses”, “EBIT margin excluding asbestos and ASIC
expenses”, “Net operating profit excluding asbestos, ASIC expenses and tax
adjustments”, “Diluted earnings per share excluding asbestos, ASIC expenses, and
tax
adjustments”,
“Operating
profit
before
income
taxes
excluding
asbestos”,
“Effective
tax
rate
excluding
asbestos
and
tax
adjustments”,
“EBITDA”
and
“General
corporate costs excluding ASIC expenses, intercompany foreign exchange gain and recovery of
RCI legal costs”). Unless otherwise stated, results and comparisons are of the
2nd quarter and 1st half of the current fiscal year versus the 2nd quarter and 1st half of the prior fiscal year. |
 OVERVIEW
AND OPERATING REVIEW Louis Gries, CEO |
 GROUP
OVERVIEW 5
•
For the quarter, net operating profit excluding asbestos, ASIC expenses and tax
adjustments decreased 16% to US$34.8 million
•
For
the
half
year,
net
operating
profit
excluding
asbestos,
ASIC
expenses
and
tax
adjustments decreased 2% to US$78.6 million
•
2
quarter
and
half
year
operating
results
reflect
a
recovery
of
US$2.7
million
for
legal
costs associated with the conclusion of RCI’s disputed amended tax assessment with
the ATO and an increase of US$5.7 million in an accounting provision for certain New
Zealand product liability claims
•
Half
year
operating
results
also
reflect
a
foreign
exchange
gain
of
US$5.5
million
on
an
Australian dollar intercompany loan
•
FY2013 first half ordinary dividend of US5.0 cents per security announced
1
Comparisons
are
of
the
2nd
quarter
and
1st
half
of
the
current
fiscal
year
versus
the
2nd
quarter
and
1st
half
year
of
the
prior
fiscal
year
1
Q2
Q2
%
HY
HY
%
FY 2013
FY 2012
Change
FY 2013
FY 2012
Change
Net operating profit
15.0
127.4
(88)
83.5
128.4
(35)
Net operating profit excluding asbestos, ASIC
expenses and tax adjustments
34.8
41.2
(16)
78.6
80.6
(2)
Diluted earnings per share excluding asbestos, ASIC
expenses and tax adjustments (US cents)
7.9
9.4
(16)
17.9
18.3
(2)
US$ Millions
nd |
 USA AND
EUROPE FIBRE CEMENT 2nd Quarter Result
Net Sales
up
4% to US$238.1
million
Sales Volume
up
6% to 369.5 mmsf
Average Price
down
2% to US$644 per msf
EBIT
down
7% to US$44.0 million
EBIT Margin
down
2.2 pts to 18.5%
6
1
Comparisons are of the 2nd quarter of the current fiscal year versus the 2nd
quarter of the prior fiscal year
1 |
 USA AND
EUROPE FIBRE CEMENT Half Year Result
Net Sales
up
9% to US$490.1
million
Sales Volume
up
11% to 757.6 mmsf
Average Price
down
2% to US$647 per msf
EBIT
down
1% to US$94.3 million
EBIT Margin
down
2.0 pts to 19.2%
7
1
Comparisons are of the 1st half of the current fiscal year versus the 1st half of
the prior fiscal year
1 |
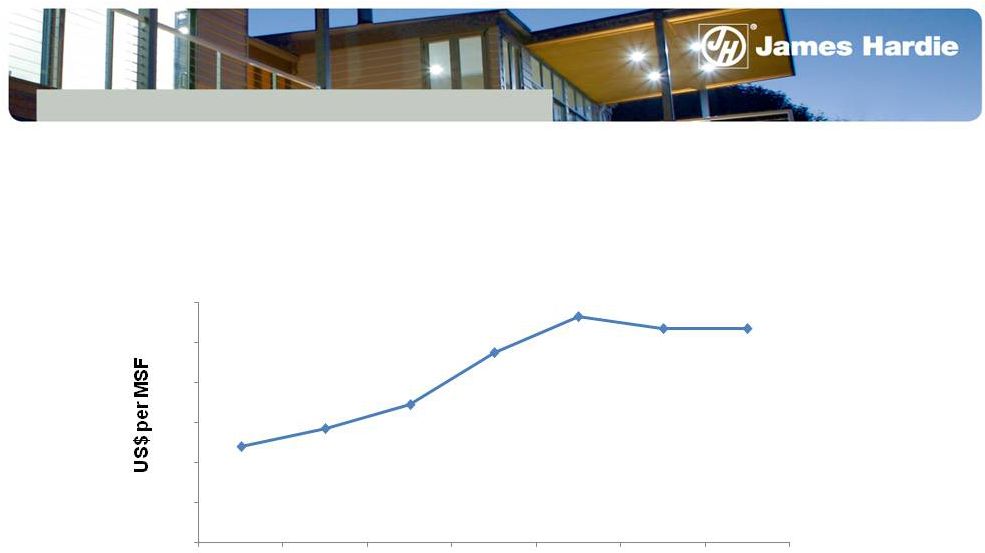 USA AND
EUROPE FIBRE CEMENT 8
Average Net Sales Price (US dollars)
US$647
1
1
FY13 average net sales price represents 2 quarter
year-to-date; other years presented are for the full year
660
640
620
600
580
560
540
FY07
FY08
FY09
FY10
FY11
FY12
Q2 YTD FY13
nd |
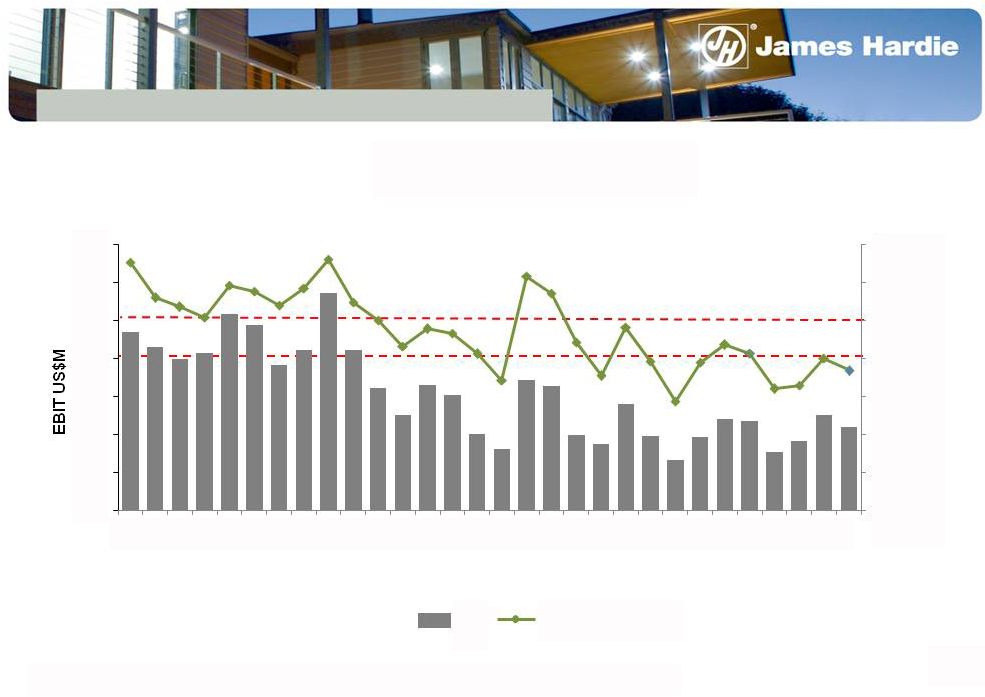 1
Excludes impairment charges of US$45.6 million in Q4 FY08 and US$14.3
million in Q4
FY12
9
EBIT and EBIT Margin
EBIT
EBIT Margin
USA AND EUROPE FIBRE CEMENT
1
140
120
100
80
60
40
20
0
FY06
FY07
FY08
FY09
FY10
FY11
FY12
FY13
0
5
10
15
20
25
30
35 |
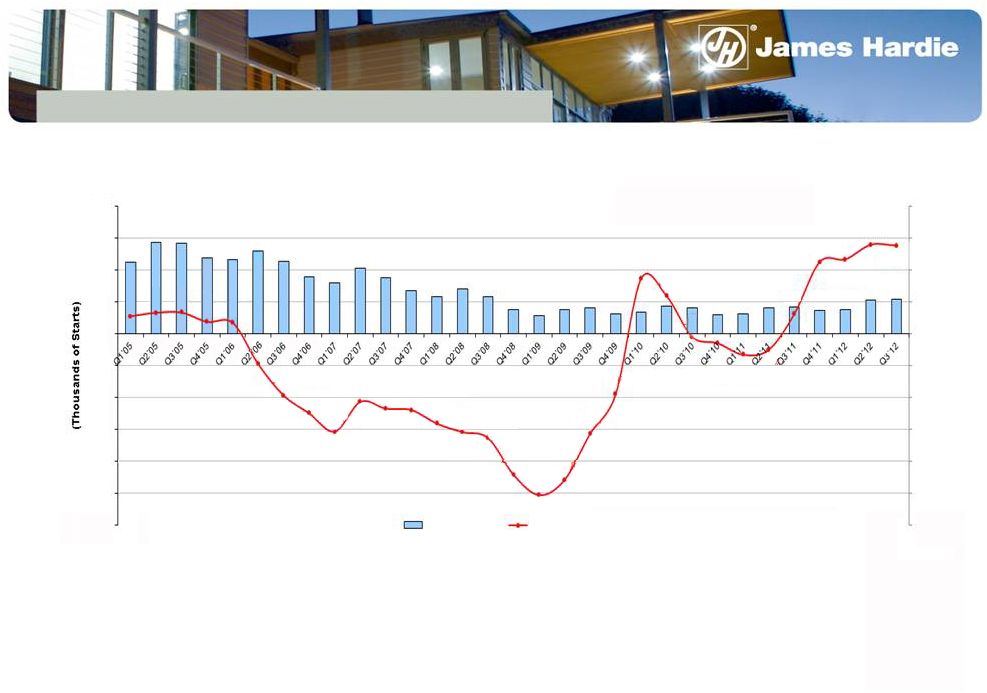 Source:
US
Census
Bureau
-
New
Privately-Owned
Housing
Units
Started
TOTAL US HOUSING STARTS
10
800
600
400
200
0
-200
-400
-600
-800
-1000
-1200
-60%
-50%
-40%
-30%
-20%
-10%
0%
10%
20%
30%
40%
23%
28.0%
6%
1%
12%
17%
27.7%
23.4%
-5%
-7%
-3%
-19%
-31%
-46%
-51%
-44%
-33%
-31%
-28%
-24%
-23%
-21%
-31%
-25%
-19%
9%
4%
4%
7%
7%
6%
Housing Starts
%Growth (same QtrPY)
U.S. Housing Starts
Calendar Quarters |
 ASIA
PACIFIC FIBRE CEMENT 2nd Quarter Result
Net Sales
down
6% to US$96.3 million
Sales Volume
down
4% to 102.2 mmsf
Average Price
down
2% to A$908 per msf
EBIT
down
39% to US$15.6 million
EBIT Margin
down
8.6 pts to 16.2%
11
1
Comparisons are of the 2nd quarter of the current fiscal year versus the 2nd
quarter of the prior fiscal year 1 |
 ASIA
PACIFIC FIBRE CEMENT Half Year Result
Net Sales
down
6% to US$184.0 million
Sales Volume
down
3% to 197.3 mmsf
Average Price
flat
at A$911 per msf
EBIT
down
29% to US$33.3 million
EBIT Margin
down
5.6 pts to 18.1%
12
1
Comparisons are of the 1st half of the current fiscal year versus the 1st half of
the prior fiscal year 1 |
 GROUP
2nd QUARTER SUMMARY 13
1
Comparisons are of the 2nd quarter of the current fiscal year versus the 2nd
quarter of the prior fiscal year 1
USA and Europe Fibre Cement results reflected:
Growth in US housing market
Increased proportion of volume in more price-sensitive market segments
Lower average net sales price
Lower input costs (primarily pulp and freight)
Higher fixed unit cost of manufacturing
Higher SG&A expenses to fund initiatives that improve organisational
capabilities Asia Pacific Fibre Cement results reflected:
Subdued operating environment in Australia
An improved but historically low operating environment in New Zealand
Lower sales volume and average net sales price
An increase of US$5.7 million in an accounting provision for certain New Zealand
product liability claims Unfavourable shift in product mix and higher fixed
unit manufacturing costs, partially offset by lower input costs (primarily
pulp) and improved plant performance |
 14
GROUP OUTLOOK
United States
Industry data indicates consistent improvement in builder confidence and increased
activity in US housing market
The
early
stages
of
a
recovery
in
the
residential
market
appears
to
be
underway
The extent and rate of improvement, however, is uncertain
The business is being positioned to accelerate growth in market share by funding of
initiatives to improve organisational capabilities, which may constrain
earnings in the initial phases of the housing market recovery
Asia Pacific
In Australia, the market environment remains subdued
The New Zealand housing market is improving
In the Philippines, the business continues to perform well in a stable operating
environment |
 15
GROUP OUTLOOK
Key Priorities
The company’s key medium-term priorities in the US are:
Grow
primary
demand
and
exterior
cladding
market
share
–
with
focus
on
repair
and
remodel and non-metro markets
Increase
market
penetration
of
ColorPlus
and
Trim
products
Continue to rollout the job pack distribution model
Overall Group Strategy
The company’s focus is to:
Aggressively grow demand for products in targeted market segments
Grow the company’s overall market position while defending market share in
existing segments
Introduce differentiated products to deliver a sustainable competitive
advantage Build operational strength and organisational capability to
increase output should a stronger than expected housing market recovery
eventuate ® |
 FINANCIAL REVIEW
Russell Chenu, CFO |
 OPERATING REVIEW
Highlights
Second quarter and half year earnings impacted by:
Improved sales volume in US business reflecting an improved market
environment Price in the US business constrained by targeted penetration
into price-sensitive market segments Funding of initiatives in the US
business to increase capabilities in the initial phase of a housing market
recovery Non-recurring foreign exchange gain of US$5.5 million (Q1) and
recovery of RCI legal costs of US$2.7 million (Q2)
Increase of US$5.7 million in an accounting provision for certain New Zealand
product liability claims
Total contribution of US$184.1 million to AICF in the 2013 financial year
represents 35% of free cash flow, as defined by the AFFA, in the 2012
financial year James Hardie’s strong cash position enabled the payment
of a FY2012 second half ordinary dividend of US38.0 cents per security on 23
July 2012. The total amount of the dividend was US$166.4 million FY2013 first
half ordinary dividend of US5.0 cents per security announced 17
|
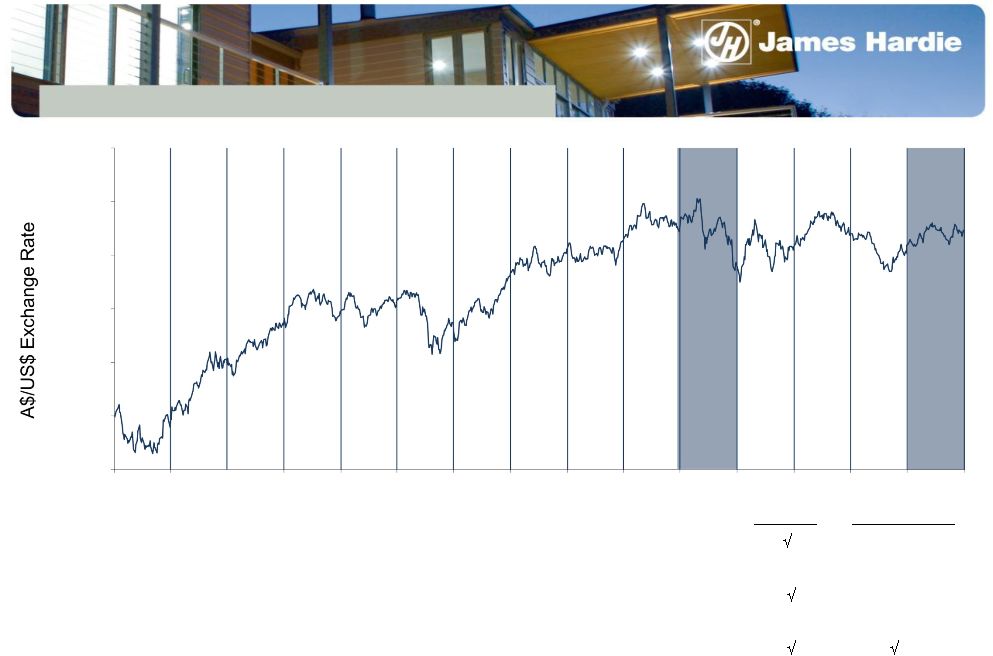 CHANGES
IN A$ VERSUS US$ –
Unfavourable impact from translation of Asia Pacific results –
Q2 FY13 vs Q2 FY12
–
Favourable impact on corporate costs incurred in Australian
dollars –
Q2 FY13 vs Q2 FY12
–
Unfavourable impact from translation of asbestos liability
balance –
30 September 2012 vs 31 March 2012
18
Earnings
Balance Sheet
N/A
N/A
1.20
1.10
1.00
0.90
0.80
0.70
0.60
31 Dec 08
31 Mar 09
30 Jun 09
30 Sep 09
31 Dec 09
31 Mar 10
30 Jun 10
30 Sep 10
31 Dec 10
31 Mar 11
30 Jun 11
30 Sep 11
31 Dec 11
31 Mar 12
30 Jun 12
30 Sep 12 |
 RESULTS
– Q2
19
US$ Millions
Q2 '13
Q2 '12
% Change
Net sales
334.4
331.6
1
Gross profit
111.3
112.6
(1)
SG&A expenses
(56.6)
(48.6)
(16)
Research & development expenses
(9.5)
(7.3)
(30)
Asbestos adjustments
(22.4)
86.9
-
EBIT
22.8
143.6
(84)
Net interest expense
-
(1.2)
-
Other income (expense)
0.3
(0.5)
-
Income tax expense
(8.1)
(14.5)
44
Net operating profit
15.0
127.4
(88) |
 RESULTS
– Q2 (CONTINUED)
20
1
Includes AICF SG&A expenses and AICF interest
income US$
Millions Q2 '13
Q2 '12
% Change
Net operating profit
15.0
127.4
(88)
Asbestos:
Asbestos adjustments
22.4
(86.9)
-
Other asbestos
(0.7)
(0.1)
-
Tax expense related to asbestos adjustments
0.4
-
-
ASIC expenses
0.3
0.5
(40)
Tax adjustments
(2.6)
0.3
-
Net operating profit excluding asbestos, ASIC
expenses and tax adjustments
34.8
41.2
(16)
1 |
 US$ Millions
HY '13
HY '12
Net sales
674.1
645.2
4
Gross profit
221.3
220.8
-
SG&A expenses
(100.9)
(94.1)
(7)
Research & Development expenses
(17.9)
(14.3)
(25)
Asbestos adjustments
2.8
48.7
(94)
EBIT
105.3
161.1
(35)
Net interest income (expense)
0.2
(2.2)
-
Other income (expense)
0.7
(2.0)
-
Income tax expense
(22.7)
(28.5)
20
Net operating profit
83.5
128.4
(35)
% Change
RESULTS –
Half Year
21 |
 RESULTS
– Half Year (CONTINUED)
22
1
Includes AICF SG&A expenses and AICF interest
income
US$ Millions
HY '13
HY '12
% Change
Net operating profit
83.5
128.4
(35)
Asbestos:
Asbestos adjustments
(2.8)
(48.7)
94
Other asbestos
(1.5)
-
-
Tax expense related to asbestos adjustments
2.6
-
-
ASIC expenses
0.4
0.7
(43)
Tax adjustments
(3.6)
0.2
-
Net operating profit excluding asbestos, ASIC
expenses, and tax adjustments
78.6
80.6
(2)
1 |
 US$ Millions
Q2 '13
Q2 '12
USA and Europe Fibre Cement
238.1
228.7
4
Asia Pacific Fibre Cement
96.3
102.9
(6)
Total
334.4
331.6
1
23
SEGMENT NET SALES –
Q2
% Change |
 24
SEGMENT NET SALES –
Half Year
US$ Millions
HY '13
HY '12
USA and Europe Fibre Cement
490.1
448.5
9
Asia Pacific Fibre Cement
184.0
196.7
(6)
Total
674.1
645.2
4
% Change |
 Research
and
development
expenses
include
costs
associated
with
research
projects
that
are
designed
to
benefit
all
business
units.
These
costs
are
recorded
in
the
Research
and
Development
segment
rather
than
attributed
to
individual
business
units
RCI’s disputed amended tax assessment with the ATO
1
Asia
Pacific
Fibre
Cement
EBIT
includes
an
increase
of
US$5.7
million
in
an
accounting
provision
of
certain
New
Zealand
product
liability
2
3
General
corporate
costs
excluding
asbestos
and
ASIC
expenses
reflect
a
legal
cost
recovery
of
US$2.7
million
associated
with
the
conclusion
of
25
SEGMENT EBIT –
Q2
US$ Millions
Q2 ’13
Q2 ’12
% Change
USA and Europe Fibre Cement
44.0
47.3
(7)
Asia Pacific Fibre Cement
15.6
25.5
(39)
Research & development
(6.3)
(5.1)
(24)
Total segment EBIT
53.3
67.7
(21)
General corporate costs excluding asbestos and
ASIC expenses
(7.4)
(9.7)
24
Total EBIT excluding asbestos and ASIC
expenses
45.9
58.0
(21)
Asbestos adjustments
(22.4)
86.9
-
AICF SG&A expenses
(0.4)
(0.8)
50
ASIC expenses
(0.3)
(0.5)
40
Total EBIT
22.8
143.6
(84)
claims
3
1
2 |
 1
Asia
Pacific
Fibre
Cement
EBIT
includes
an
increase
of
US$5.7
million
in
an
accounting
provision
of
certain
New
Zealand
product
liability claims
2
Research
and
development
expenses
include
costs
associated
with
research
projects
that
are
designed
to
benefit
all
business
units. These
costs are recorded in the Research and Development segment rather than attributed to
individual business units 3
General
corporate
costs
excluding
asbestos
and
ASIC
expenses
reflect
a
legal
cost
recovery
of
US$2.7
million
associated
with
the
conclusion of
RCI’s disputed amended tax assessment with the ATO and a US$5.5 million foreign
exchange gain related to an Australian dollar intercompany loan
26
SEGMENT EBIT –
Half Year
US$ Millions
HY '13
HY '12
% Change
USA and Europe Fibre Cement
94.3
95.3
(1)
Asia Pacific Fibre Cement
33.3
46.6
(29)
Research & Development
(12.3)
(10.2)
(21)
Total segment EBIT
115.3
131.7
(12)
General corporate costs excluding asbestos and
ASIC expenses
(11.7)
(17.2)
32
Total EBIT excluding asbestos and ASIC
expenses
103.6
114.5
(10)
Asbestos adjustments
2.8
48.7
(94)
AICF SG&A expenses
(0.7)
(1.4)
50
ASIC expenses
(0.4)
(0.7)
43
Total EBIT
105.3
161.1
(35)
2
1
3 |
 27
INCOME TAX EXPENSE –
Q2
US$ Millions
Operating profit before income taxes
23.1
141.9
Asbestos:
Asbestos adjustments
22.4
(86.9)
Other asbestos
(0.7)
(0.1)
Operating profit before income taxes excluding asbestos
44.8
54.9
Income tax expense
Asbestos:
Tax expense related to asbestos adjustments
0.4
-
Tax adjustments
(2.6)
0.3
Income tax expense excluding tax adjustments
(10.3)
(14.2)
Effective tax rate excluding asbestos and tax
adjustments
23.0%
25.9%
Q2 '13
Q2 '12
(8.1)
(14.5)
1
1
Includes AICF SG&A expenses and AICF interest income
|
 28
INCOME TAX EXPENSE –
Half Year
1
Includes AICF SG&A expenses and AICF interest
income HY
'13 HY '12
Operating profit before income taxes
106.2
156.9
Asbestos:
Asbestos adjustments
(2.8)
(48.7)
Other asbestos
(1.5)
-
Operating profit before income taxes excluding asbestos
101.9
108.2
Income tax expense
(22.7)
(28.5)
Asbestos:
Tax expense related to asbestos adjustments
2.6
-
Tax adjustments
(3.6)
0.2
Income tax expense excluding tax adjustments
(23.7)
(28.3)
Effective tax rate excluding asbestos and tax adjustments
23.3%
26.2%
US$
Millions
1 |
 29
CASHFLOW
1
US$ Millions
HY '13
HY '12
EBIT
105.3
161.1
Non-cash items:
Asbestos adjustments
(2.8)
(48.7)
Other non-cash items
33.3
33.7
Net working capital movements
(4.5)
(5.7)
Cash Generated By Trading Activities
131.3
140.4
Tax payments net
(84.9)
(27.1)
Change in other non-trading assets and liabilities
131.1
(22.9)
Change in asbestos-related assets & liabilities
1.1
(0.1)
Payment to the AICF
(184.1)
(51.5)
Interest paid (net)
(2.3)
(1.7)
Net Operating Cash Flow
(7.8)
37.1
Purchases of property, plant & equipment
(25.5)
(18.4)
Proceeds from sale of property, plant & equipment
0.1
0.2
Common stock repurchased and retired
-
(13.7)
Dividends paid
(166.4)
-
Proceeds from issuance of shares
12.4
-
Tax benefit from stock options exercised
-
1.5
Effect of exchange rate on cash
(0.9)
(3.0)
Movement In Net (Debt) Cash
(188.1)
3.7
Beginning Net Cash (Debt)
265.4
(40.4)
Ending Net Cash (Debt)
77.3
(36.7)
1
Comparisons are of the half year ended of the current fiscal year versus the half
year ended of the prior fiscal year |
 30
CAPITAL MANAGEMENT
If and to the extent the company does not undertake share buybacks between today and the
announcement of FY2013 results in May 2013, the company will consider an increase
of its dividend payout ratio for FY2013. In this event, the dividend in
respect of the second half of FY
2013
is
anticipated
to
be
approximately
US35
cents
per
security,
subject
to
certain conditions
as outlined in the results announcement
For dividends payable in respect of financial year 2014 onwards,
the company intends to
increase its dividend payout ratio from 20% to 30% of net operating profit (excluding
asbestos adjustments) to 30% to 50% of net operating profit (excluding asbestos
adjustments); Subject to
share
price
levels,
the
company
intends
to
distribute
approximately
US$150 million
to shareholders under its existing share buyback program, which expires in May 2013;
The
company
expects
to
be
in
a
position
to
make
further
distributions
to
shareholders
in
the
near
term
as follows:
No share buyback activity during the half year
An
ordinary
dividend
of
US5.0
cents
per
security
(approximately
US$22.0
million)
was announced
today. The dividend is declared in US currency and will be paid on 25 January 2012, with a
record date of 18 December 2012 |
 Net cash of US$77.3 million compared to net cash of US$265.4 million at 31 March
2012 Weighted average remaining term of total facilities was 0.5 years at 30
September 2012, down from 0.9 years at 31 March 2012. The Company is
intending to refinance its existing credit facilities during the balance of the 2013 financial
year
James Hardie remains well within its financial debt covenants
31
At 30 September 2012:
DEBT
US$ Millions
Total facilities
280.0
Gross debt
-
Cash
77.3
Net cash
(77.3)
Unutilised facilities and cash
357.3 |
 32
ASBESTOS
FUND
–
PRO
FORMA
(UNAUDITED)
1
In accordance with Amended and Restated Final Funding Agreement
A$ millions
AICF cash and deposits
- 31 March 2012
62.5
Contribution to AFFA by James Hardie (Early payment)
132.3
Contribution to AFFA by James Hardie (July payment)
45.2
Insurance and cross claim recoveries
26.3
Interest income and unrealised gain on investments
2.9
Claims paid
(67.1)
Operating costs
(1.8)
Repayment of NSW Government loan facility
(29.7)
Other
1.3
AICF net cash and deposits
- 30 September 2012
171.9
1
1 |
 1
Excludes
asbestos
adjustments,
AICF
SG&A
expenses,
AICF
interest
income,
gain
or
impairment
on
AICF
investments, tax benefits related to asbestos adjustments, ASIC expenses/recoveries, and tax
adjustments 2
Excludes asbestos adjustments, AICF SG&A expenses and ASIC
expenses/recoveries 3
Includes restricted cash set aside for AFFA
Note: For the 2012 and 2011 financial years, key ratios at the half year ended have been
presented above for comparative purposes 33
KEY RATIOS
1
HY '13
HY '12
HY '11
EPS (Diluted)
17.9c
18.3c
14.0c
EBIT/ Sales (EBIT margin)
15.4%
17.7%
17.7%
Gearing Ratio
-6.4%
2.7%
10.6%
Net Interest Expense Cover
51.8x
31.8x
28.9x
Net Interest Paid Cover
103.6x
30.1x
34.5x
Net Debt Payback
-
0.2yrs
1.0yrs
1
2
1
2
2
3 |
 34
SUMMARY
1
Comparisons are of the 2nd quarter of the current fiscal year versus the 2nd quarter of the
prior fiscal year 1
Net
operating
profit
excluding
asbestos, ASIC
expenses
and
tax
adjustments for the 2
quarter and half year was US$34.8 million and
US$78.6 million, respectively.
The 2
quarter results reflected:
Higher sales volume in the USA and Europe segment due to improved housing
activity and gains in market and category share in the US
Higher SG&A expenses driven by:
Increase of US$5.7 million in an accounting provision for certain product
liability claims in New Zealand, and
Funding of initiatives in the US in anticipation of market demand moving
back to more normal levels
Depreciation
of
Asia
Pacific
business’
currencies
against
US
dollar
Recovery of US$2.7 million for legal costs associated with the conclusion of
RCI’s disputed amended tax assessment with the ATO
nd
nd |
 FY2013
GUIDANCE Management expects full year earnings excluding asbestos, ASIC
expenses and tax adjustments to be between US$140 million and US$150
million Management cautions that guidance is dependent upon US housing
industry conditions continuing to improve, the accounting provision for New
Zealand product liability claims remaining adequate and the A$/US$ exchange
rate remaining
stable for the balance of the fiscal year ending 31 March 2013
Management cautions that housing market conditions remain uncertain and notes
that some input costs remain volatile
35 |
 QUESTIONS |
 APPENDIX |
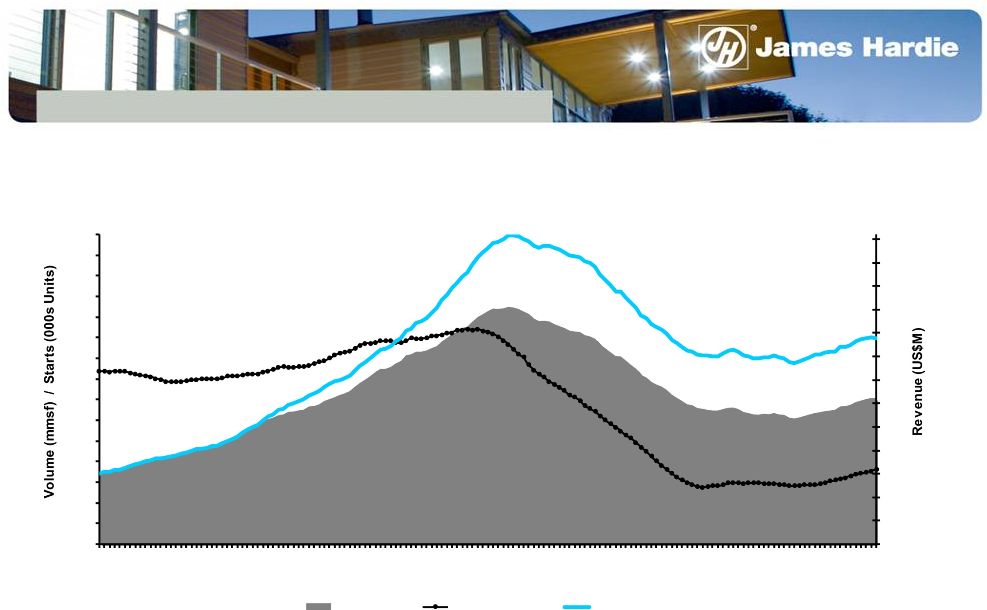 Rolling 12 month average of seasonally adjusted estimate of housing starts by US
Census Bureau 38
USA FIBRE CEMENT
Top Line Growth
JH Volume
Housing Starts
JH Revenue
'00
'01
'02
'03
'04
'05
'06
'07
'08
'09
'10
11
12 |
 GENERAL
CORPORATE COSTS – Q2
39
US$ Millions
% Change
Stock compensation expense
3.0
1.8
(67)
Other costs
7.1
7.9
10
General corporate costs excluding ASIC
expenses and recovery of legal costs
10.1
9.7
(4)
ASIC expenses
0.3
0.5
40
Recovery of RCI legal costs
(2.7)
-
-
General corporate costs
7.7
10.2
(25)
Q2 '13
Q2 '12 |
 40
GENERAL
CORPORATE
COSTS
–
Half
Year
US$ Millions
HY '13
HY '12
% Change
Stock compensation expense
5.6
3.8
(47)
Other costs
14.3
13.4
(7)
General corporate costs excluding ASIC
expenses, intercompany foreign exchange
gain and recovery of legal costs
19.9
17.2
(16)
ASIC expenses
0.4
0.7
43
Recovery of RCI legal costs
(2.7)
-
-
Intercompany foreign exchange gain
(5.5)
-
-
General corporate costs
12.1
17.9
32 |
 41
EBITDA –
Q2
US$ Millions
Q2 ’13
Q2 ’12
% Change
EBIT
USA and Europe Fibre Cement
44.0
47.3
(7)
Asia Pacific Fibre Cement
15.6
25.5
(39)
Research & development
(6.3)
(5.1)
(24)
General corporate excluding asbestos and ASIC expenses
(7.4)
(9.7)
24
Depreciation and Amortisation
USA and Europe Fibre Cement
12.0
12.2
(2)
Asia Pacific Fibre Cement
2.7
2.4
13
Total EBITDA excluding asbestos and ASIC expenses
60.6
72.6
(17)
Asbestos adjustments
(22.4)
86.9
-
AICF SG&A expenses
(0.4)
(0.8)
50
ASIC expenses
(0.3)
(0.5)
40
Total EBITDA
37.5
158.2
(76) |
 42
EBITDA –
Half Year
US$ Millions
HY '13
HY '12
% Change
EBIT
USA and Europe Fibre Cement
94.3
95.3
(1)
Asia Pacific Fibre Cement
33.3
46.6
(29)
Research & Development
(12.3)
(10.2)
(21)
General corporate excluding asbestos and ASIC expenses
(11.7)
(17.2)
32
Depreciation and Amortisation
USA and Europe Fibre Cement
25.3
25.4
-
Asia Pacific Fibre Cement
4.8
5.4
(11)
Total EBITDA excluding asbestos and ASIC expenses
133.7
145.3
(8)
Asbestos adjustments
2.8
48.7
(94)
AICF SG&A expenses
(0.7)
(1.4)
50
ASIC expenses
(0.4)
(0.7)
43
Total EBITDA
135.4
191.9
(29) |
 43
CAPITAL EXPENDITURE
US$ Millions
HY '13
HY '12
% Change
USA and Europe Fibre Cement
20.9
14.6
43
Asia Pacific Fibre Cement
4.6
3.8
21
Total
25.5
18.4
39 |
 44
NET INTEREST (EXPENSE) INCOME
US$ Millions
Q2 ’13
Q2 ’12
HY '13
HY '12
Gross interest expense
(0.8)
(1.1)
(1.6)
(2.0)
Interest income
0.2
-
0.6
0.2
Realised loss on interest rate swaps
(0.5)
(1.0)
(1.0)
(1.8)
Net interest expense excluding AICF interest income
(1.1)
(2.1)
(2.0)
(3.6)
AICF interest income
1.1
0.9
2.2
1.4
Net interest (expense) income
-
(1.2)
0.2
(2.2) |
 LEGACY
ISSUES UPDATE ASIC Proceedings
On 3 May 2012, the High Court of Australia delivered its judgment in the appeals
and cross-appeals of the December 2010 decision of the New South Wales
Court of Appeal James Hardie did not appeal the NSW Court of Appeal’s
decision, so it was not party to the High Court proceedings The High Court
upheld ASIC’s appeal and dismissed a former officer’s appeal of the Court of Appeal’s decision
The High Court remitted the matter back to the NSW Court of Appeal for further
consideration of claims to be excused from liability, penalty and
disqualification and on certain questions concerning costs The Court of
Appeal heard submissions on these issues at a proceeding held in late August 2012.
The Court of Appeal imposed penalties ranging from A$20,000 to A$25,000 and
banning orders for various lengths of time on the non-executive
directors, the longest of which is through 30 April 2013 The
former
officer
was
ordered
to
pay
A$75,000
plus
interest
and
was
banned
from
acting
as
a
director
for
a
period
of
seven years commencing on 27 August 2009
The parties to the proceedings have 28 days within which to lodge an application
seeking leave to appeal to the High Court of Australia
Readers are referred to Note 9 of the condensed consolidated financial statements
as of and for the period ended 30 September 2012 for further
information 45 |
 This Management Presentation forms part of a package of information about the
company’s results. It should be read in conjunction with the other
parts of this package, including the Management’s Analysis of Results, Media Release and Consolidated Financial Statements
Definitions
Non-financial Terms
ABS
–
Australian Bureau of Statistics
AFFA
–
Amended and Restated Final Funding Agreement
AICF
–
Asbestos Injuries Compensation Fund Ltd
ASIC
–
Australian Securities and Investments Commission
ATO
–
Australian Taxation Office
NBSK –
Northern Bleached Soft Kraft; the company's benchmark grade of pulp
Financial
Measures
–
US
GAAP equivalents
EBIT and EBIT Margin
-
EBIT, as used in this document, is equivalent to the US GAAP measure of operating
income. EBIT margin is defined as EBIT as a percentage of net sales
Operating profit
-
is equivalent to the US GAAP measure of income
Net operating profit -
is equivalent to the US GAAP measure of net income
46
ENDNOTES |
 Sales Volumes
mmsf
–
million
square
feet,
where
a
square
foot
is
defined
as
a
standard
square
foot
of
5/16”
thickness
msf
–
thousand
square
feet,
where
a
square
foot
is
defined
as
a
standard
square
foot
of
5/16”
thickness
Financial Ratios
Gearing
Ratio
–
Net
debt
(cash)
divided
by
net
debt
(cash)
plus
shareholders’
equity
Net
interest
expense
cover
–
EBIT
divided
by
net
interest
expense
(excluding
loan
establishment
fees)
Net
interest
paid
cover
–
EBIT
divided
by
cash
paid
during
the
period
for
interest,
net
of
amounts
capitalised
Net
debt
payback
–
Net
debt
(cash)
divided
by
cash
flow
from
operations
Net
debt
(cash)
–
Short-term
and
long-term
debt
less
cash
and
cash
equivalents
Return
on
Capital
employed
–
EBIT
divided
by
gross
capital
employed
47
ENDNOTES (CONTINUED) |
 EBIT
and EBIT margin excluding asbestos and ASIC expenses –
EBIT and EBIT margin excluding asbestos and ASIC expenses
are not measures of financial performance under US GAAP and should not be
considered to be more meaningful than EBIT and EBIT margin. Management has
included these financial measures to provide investors with an alternative method for assessing its operating
results in a manner that is focussed on the performance of its ongoing operations
and provides useful information regarding its financial condition and
results of operations. Management uses these non-US GAAP measures for the same purposes
48
NON-US GAAP FINANCIAL MEASURES
Q2
Q2
HY
HY
US$ Millions
FY 2013
FY 2012
FY 2013
FY 2012
EBIT
$ 22.8
$ 143.6
$ 105.3
$ 161.1
Asbestos:
Asbestos adjustments
22.4
(86.9)
(2.8)
(48.7)
AICF SG&A expenses
0.4
0.8
0.7
1.4
ASIC expenses
0.3
0.5
0.4
0.7
EBIT excluding asbestos and ASIC expenses
45.9
58.0
103.6
114.5
Net sales
$ 334.4
$ 331.6
$ 674.1
$ 645.2
EBIT margin excluding asbestos and
ASIC expenses
13.7%
17.5%
15.4%
17.7% |
 Net
operating
profit
excluding
asbestos,
ASIC
expenses
and
tax
adjustments
–
Net operating profit excluding asbestos, ASIC
expenses and tax adjustments is not a measure of financial performance under US
GAAP and should not be considered to be more meaningful than net income.
Management has included this financial measure to provide investors with an alternative method for
assessing its operating results in a manner that is focussed on the performance of
its ongoing operations. Management uses this non- US GAAP measure for the
same purposes 49
NON-US GAAP FINANCIAL MEASURES (CONTINUED)
Q2
Q2
HY
HY
US$ Millions
FY 2013
FY 2012
FY 2013
FY 2012
Net operating profit
$ 15.0
$ 127.4
$ 83.5
$ 128.4
Asbestos:
Asbestos adjustments
22.4
(86.9)
(2.8)
(48.7)
AICF SG&A expenses
0.4
0.8
0.7
1.4
AICF interest income
(1.1)
(0.9)
(2.2)
(1.4)
Tax expense related to asbestos
adjustments
0.4
-
2.6
-
ASIC expenses
0.3
0.5
0.4
0.7
Tax adjustments
(2.6)
0.3
(3.6)
0.2
Net operating profit excluding asbestos,
ASIC expenses and tax adjustments
$ 34.8
$ 41.2
$ 78.6
$ 80.6 |
 Diluted
earnings
per
share
excluding
asbestos,
ASIC
expenses
and
tax
adjustments
–
Diluted
earnings
per
share
excluding
asbestos,
ASIC
expenses
and
tax
adjustments
is
not
a
measure
of
financial
performance
under
US
GAAP
and
should
not
be
considered
to
be
more
meaningful
than
diluted
earnings
per
share.
Management
has
included
this
financial
measure
to
provide
investors
with
an
alternative
method
for
assessing
its
operating
results
in
a
manner
that
is
focussed
on
the
performance
of
its
ongoing
operations.
Management
uses
this
non-US
GAAP
measure
for
the
same
purposes
50
NON-US GAAP FINANCIAL MEASURES (CONTINUED)
Q2
Q2
HY
HY
US$ Millions
FY 2013
FY 2012
FY 2013
FY 2012
Net operating profit excluding asbestos,
ASIC expenses and tax adjustments
$ 34.8
$ 41.2
$ 78.6
$ 80.6
Weighted average common shares outstanding -
Diluted (millions)
439.7
440.0
439.3
440.0
Diluted earnings per share excluding asbestos,
ASIC expenses and tax adjustments
(US cents)
7.9
9.4
17.9
18.3 |
 Effective
tax
rate
excluding
asbestos
and
tax
adjustments
–
Effective tax rate excluding asbestos and tax adjustments is not
a
measure
of
financial
performance
under
US
GAAP
and
should
not
be
considered
to
be
more
meaningful
than
effective
tax
rate.
Management has included this financial measure to provide investors with an
alternative method for assessing its operating results in a manner that is
focussed on the performance of its ongoing operations. Management uses this non-US GAAP measure for the
same purposes
51
NON-US GAAP FINANCIAL MEASURES (CONTINUED)
Q2
Q2
HY
HY
US$ Millions
FY 2013
FY 2012
FY 2013
FY 2012
Operating profit before income taxes
$ 23.1
$ 141.9
$ 106.2
$ 156.9
Asbestos:
Asbestos adjustments
22.4
(86.9)
(2.8)
(48.7)
AICF SG&A expenses
0.4
0.8
0.7
1.4
AICF interest income
(1.1)
(0.9)
(2.2)
(1.4)
Operating profit before income taxes excluding
asbestos
$ 44.8
$ 54.9
$ 101.9
$ 108.2
Income tax expense
(8.1)
(14.5)
(22.7)
(28.5)
Asbestos:
Tax expense related to asbestos adjustments
0.4
-
2.6
-
Tax adjustments
(2.6)
0.3
(3.6)
0.2
Income tax expense excluding tax adjustments
(10.3)
(14.2)
(23.7)
(28.3)
Effective tax rate excluding asbestos and
tax adjustments
23.0%
25.9%
23.3%
26.2% |
 EBITDA
–
is not a measure of financial performance under US GAAP and should not be
considered an alternative to, or more meaningful than, income from
operations, net income or cash flows as defined by US GAAP or as a measure of profitability or liquidity.
Not all companies calculate EBITDA in the same manner as James Hardie has and,
accordingly, EBITDA may not be comparable with other companies. Management
has included information concerning EBITDA because it believes that this data is commonly used by
investors to evaluate the ability of a company’s earnings from its core
business operations to satisfy its debt, capital expenditure and working
capital requirements 52
NON-US GAAP FINANCIAL MEASURES (CONTINUED)
Q2
Q2
HY
HY
US$ Millions
FY 2013
FY 2012
FY 2013
FY 2012
EBIT
$ 22.8
$ 143.6
$ 105.3
$ 161.1
Depreciation and amortisation
14.7
14.6
30.1
30.8
Adjusted EBITDA
$ 37.5
$ 158.2
$ 135.4
$ 191.9 |
 General
corporate
costs
excluding
ASIC
expenses,
intercompany
foreign
exchange
gain
and
recovery
of
RCI
legal
costs
–
General corporate costs excluding ASIC expenses, intercompany foreign exchange gain
and recovery of RCI legal costs is not a measure of financial performance
under US GAAP and should not be considered to be more meaningful than general corporate
costs. Management has included these financial measures to provide investors with
an alternative method for assessing its operating results in a manner that
is focussed on the performance of its ongoing operations and provides useful information
regarding its financial condition and results of operations. Management uses these
non-US GAAP measures for the same purposes
53
NON-US GAAP FINANCIAL MEASURES (CONTINUED)
Q2
HY
HY
US$ Millions
FY 2012
FY 2012
General corporate costs
$ 7.7
$ 10.2
$ 12.1
$ 17.9
Excluding:
ASIC expenses
(0.3)
(0.5)
(0.4)
(0.7)
Intercompany foreign exchange gain
-
-
5.5
-
Recovery of RCI legal costs
2.7
-
2.7
-
General corporate costs excluding ASIC
expenses, intercompany foreign exchange
gain and recovery of RCI legal costs
$ 10.1
$ 9.7
$ 19.9
$ 17.2
FY 2013
Q2
FY 2013 |
 Q2 FY13
MANAGEMENT PRESENTATION 15 November 2012 |