 Q1
FY14 MANAGEMENT PRESENTATION 12 August 2013
Exhibit 99.4 |
| Q1
FY14 MANAGEMENT PRESENTATION 12 August 2013
Exhibit 99.4 |
 DISCLAIMER
This Management Presentation contains forward-looking statements. James Hardie
may from time to time make forward-looking statements in its periodic reports
filed
with
or
furnished
to
the
SEC,
on
Forms
20-F
and
6-K,
in
its
annual
reports
to
shareholders,
in
offering
circulars,
invitation
memoranda
and
prospectuses,
in
media releases and other written materials and in oral statements made by the
company’s officers, directors or employees to analysts, institutional investors,
existing
and
potential
lenders,
representatives
of
the
media
and
others.
Statements
that
are
not
historical
facts
are
forward-looking
statements
and
such
forward-
looking
statements
are
statements
made
pursuant
to
the
Safe
Harbor
Provisions
of
the
Private
Securities
Litigation
Reform
Act
of
1995.
Examples of forward-looking statements include:
•
statements about the company’s future performance;
•
projections of the company’s results of operations or financial
condition; •
statements regarding the company’s plans, objectives or goals, including those
relating to strategies, initiatives, competition, acquisitions, dispositions and/or
its products;
•
expectations
concerning
the
costs
associated
with
the
suspension
or
closure
of
operations
at
any
of
the
company’s
plants
and
future
plans
with
respect
to
any
such plants;
•
expectations regarding the extension or renewal of the company’s credit
facilities including changes to terms, covenants or ratios; •
expectations concerning dividend payments and share buy-backs;
•
statements concerning the company’s corporate and tax domiciles and structures
and potential changes to them, including potential tax charges; •
statements regarding tax liabilities and related audits, reviews
and proceedings;
•
statements as to the possible consequences of proceedings brought against the
company and certain of its former directors and officers by the Australian
Securities and Investments Commission (ASIC);
•
statements regarding the possible consequences and/or potential outcome of the
legal proceedings brought against two of the company’s subsidiaries by the
New Zealand Ministry of Education and the potential product liabilities, if any,
associated with such proceedings; •
expectations about the timing and amount of contributions to Asbestos Injuries
Compensation Fund (AICF), a special purpose fund for the compensation of
proven Australian asbestos-related personal injury and death claims;
•
expectations concerning indemnification obligations;
•
expectations concerning the adequacy of the company’s warranty provisions and
estimates for future warranty-related costs; •
statements regarding the company’s ability to manage legal and regulatory
matters (including but not limited to product liability, environmental, intellectual
property and competition law matters) and to resolve any such pending legal and
regulatory matters within current estimates and in anticipation of certain
third-party recoveries; and
•
statements
about
economic
conditions,
such
as
change
in
the
US
economic
or
housing
recovery,
the
levels
of
new
home
construction
and
home
renovations,
unemployment
levels,
changes
in
consumer
income,
changes
or
stability
in
housing
values,
the
availability
of
mortgages
and
other
financing,
mortgage
and
other interest rates, housing affordability and supply, the levels of foreclosures
and home resales, currency exchange rates, and builder and consumer
confidence.
2 |
 3
DISCLAIMER (CONTINUED)
Words such as “believe,” “anticipate,” “plan,” “expect,”
“intend,” “target,” “estimate,” “project,” “predict,” “forecast,” “guideline,” “aim,” “will,” “should,” “likely,”
“continue,” “may,” “objective,” “outlook” and similar
expressions are intended to identify forward-looking statements but are not the exclusive means of
identifying such statements. Readers are cautioned not to place undue reliance on these
forward-looking statements and all such forward-looking statements are qualified in
their entirety by reference to the following cautionary statements. Forward-looking
statements are based on the company’s current expectations, estimates and assumptions and because forward-looking statements address
future results, events and conditions, they, by their very nature, involve inherent risks and
uncertainties, many of which are unforeseeable and beyond the company’s control. Such
known and unknown risks, uncertainties and other factors may cause actual results, performance or other achievements to differ
materially from the anticipated results, performance or achievements expressed, projected or implied
by these forward-looking statements. These factors, some of which are discussed under
“Risk Factors” in Section 3 of the Form 20-F filed with the Securities and Exchange Commission on 27 June 2013,
include, but are not limited to: all matters relating to or arising out of the prior manufacture of
products that contained asbestos by current and former James Hardie subsidiaries; required
contributions to AICF, any shortfall in AICF and the effect of currency exchange rate movements on the amount recorded in the
company’s financial statements as an asbestos liability; governmental loan facility to AICF;
compliance with and changes in tax laws and treatments; competition and product pricing in the
markets in which the company operates; the consequences of product failures or defects; exposure to environmental,
asbestos, putative consumer class action or other legal proceedings; general economic and market
conditions; the supply and cost of raw materials; possible increases in competition and the
potential that competitors could copy the company’s products; reliance on a small number of customers; a customer’s
inability to pay; compliance with and changes in environmental and health and safety laws; risks of
conducting business internationally; compliance with and changes in laws and regulations; the
effect of the transfer of the company’s corporate domicile from The Netherlands to Ireland, including changes in
corporate governance and potential tax benefits; currency exchange risks; dependence on customer
preference and the concentration of the company’s customer base on large format retail
customers, distributors and dealers; dependence on residential and commercial construction markets; the effect of
adverse changes in climate or weather patterns; possible inability to renew credit facilities on terms
favourable to the company, or at all; acquisition or sale of businesses and business segments;
changes in the company’s key management personnel; inherent limitations on internal controls; use of accounting
estimates; and all other risks identified in the company’s reports filed with Australian, Irish
and US securities agencies and exchanges (as appropriate). The company cautions you that the
foregoing list of factors is not exhaustive and that other risks and uncertainties may cause actual results to differ materially
from those in forward-looking statements. Forward-looking statements speak only as of the date
they are made and are statements of the company’s current expectations concerning future
results, events and conditions. The company assumes no obligation to update any forward-looking statements or information
except as required by law. |
 •
Overview and Operating Review –
Louis Gries, CEO
•
Financial Review –
Russell Chenu, CFO
•
Questions and Answers
4
In
this
Management
Presentation,
James
Hardie
may
present
financial
measures,
sales
volume
terms,
financial
ratios,
and
Non-US
GAAP
financial
measures
included
in
the
Definitions
section
of
this
document
starting
on
page
39.
The
company
presents
financial
measures
that
it
believes
are
customarily
used
by
its
Australian
investors.
Specifically,
these
financial
measures,
which
are
equivalent
to
or
derived
from
certain
US
GAAP
measures
as
explained
in
the
definitions,
include
“EBIT”,
“EBIT
margin”,
“Operating
profit
before
income
taxes”
and
“Net
operating
profit”.
The
company
may
also
present
other
terms
for
measuring
its
sales
volumes
(“million
square
feet”
or
“mmsf”
and
“thousand
square
feet”
or
“msf”);
financial
ratios
(“Gearing
ratio”,
“Net
interest
expense
cover”,
“Net
interest
paid
cover”,
“Net
debt
payback”,
“Net
debt
(cash)”);
and
Non-US
GAAP
financial
measures
(“EBIT
excluding
asbestos,
ASIC
expenses
and
New
Zealand
product
liability
expenses”,
“EBIT
margin
excluding
asbestos,
ASIC
expenses
and
New
Zealand
product
liability
expenses”,
“Net
operating
profit
excluding
asbestos,
ASIC
expenses,
New
Zealand
product
liability
expenses
and
tax
adjustments”,
“Diluted
earnings
per
share
excluding
asbestos,
ASIC
expenses,
New
Zealand
product
liability
expenses
and
tax
adjustments”,
“Operating
profit
before
income
taxes
excluding
asbestos
and
New
Zealand
product
liability
expenses”,
“Effective
tax
rate
on
earnings
excluding
asbestos,
New
Zealand
product
liability
expenses
and
tax
adjustments”,
“Adjusted
EBITDA”,
“General
corporate
costs
excluding
ASIC
expenses
and
intercompany
foreign
exchange
gain”
and
“Selling,
general
and
administrative
expenses
excluding
New
Zealand
product
liability
expenses”).
Unless
otherwise
stated,
results
and
comparisons
are
of
the
1st
quarter
of
the
current
fiscal
year
versus
the
1st quarter of the prior fiscal year.
AGENDA |
 OVERVIEW AND OPERATING REVIEW
Louis Gries, CEO |
 GROUP
OVERVIEW 6
First quarter FY2014 net operating profit reflects:
•
USA and Europe Fibre Cement EBIT margin increased 1.4 percentage
points to 21.4%. EBIT increased 18% to
US$59.4 million
•
Asia Pacific Fibre Cement adjusted EBIT increased 19% to US$21.1
million, reflecting higher sales volume and a
slightly higher average net sales price, partially offset by depreciation of A$
against US$ •
New Zealand product liability expenses of US$4.6 million in Asia
Pacific Fibre Cement segment
1
Comparisons are of the 1***quarter of the current
fiscal year versus the 1***quarter of the prior fiscal year
**st
**st
1
Q1
Q1
%
FY 2014
FY 2013
Change
Net operating profit
142.2
68.5
-
Net operating profit excluding asbestos, ASIC expenses,
New Zealand product liability expenses and tax
adjustments
52.0
43.8
19
Diluted earnings per share excluding asbestos, ASIC
expenses, New Zealand product liability expenses and tax
adjustments (US cents)
11.7
10.0
17
US$ Millions |
 7
1
Comparisons
are
of
the
1
quarter
of
the
current
fiscal
year
versus
the
1
quarter
of
the
prior
fiscal
year
USA and Europe Fibre Cement results reflected:
•
Higher sales volume
•
Slightly higher average net sales price
•
Higher input costs
•
Favourable shift in product mix
•
Increased idle facility costs
•
Lower fixed unit manufacturing costs
•
Higher employment and marketing costs due to the ramp-up of
organisational capabilities during the second half of the prior year
1
USA
AND
EUROPE
FIBRE
CEMENT
1
QUARTER
SUMMARY
1
st
st
st
1 |
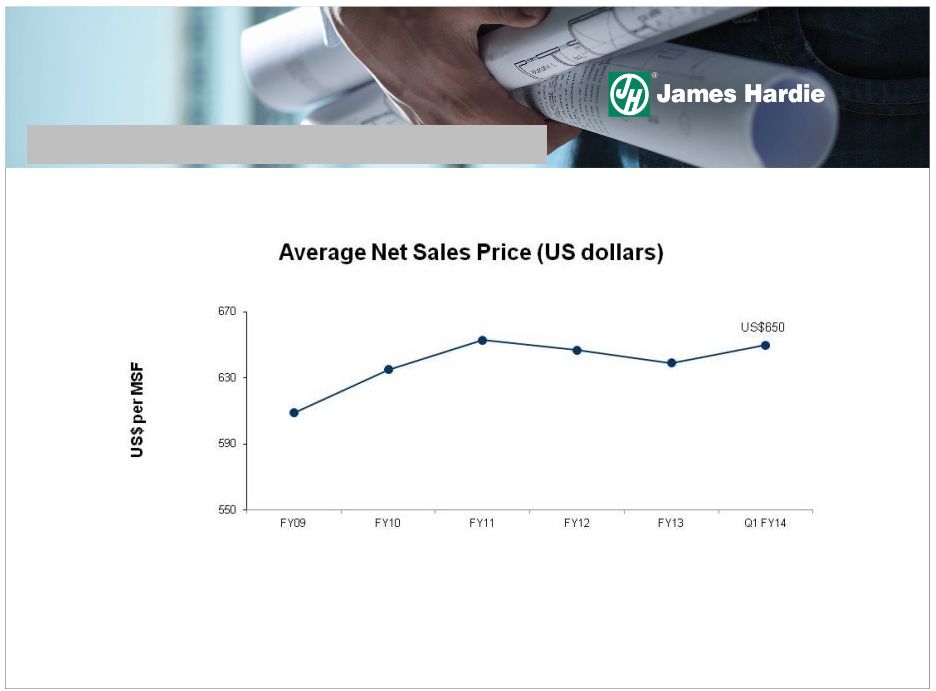
 1st
Quarter Result Net Sales
up
10% to US$278.1
million
Sales Volume
up
10% to 428.0 mmsf
Average Price
up
from US$649 per msf to US$650 per msf
EBIT
up
18% to US$59.4 million
EBIT Margin
up
1.4 pts to 21.4%
8
1
Comparisons
are
of
the
1
quarter
of
the
current
fiscal
year
versus
the
1
quarter
of
the
prior
fiscal
year
**1
USA AND EUROPE FIBRE CEMENT
st
**st |
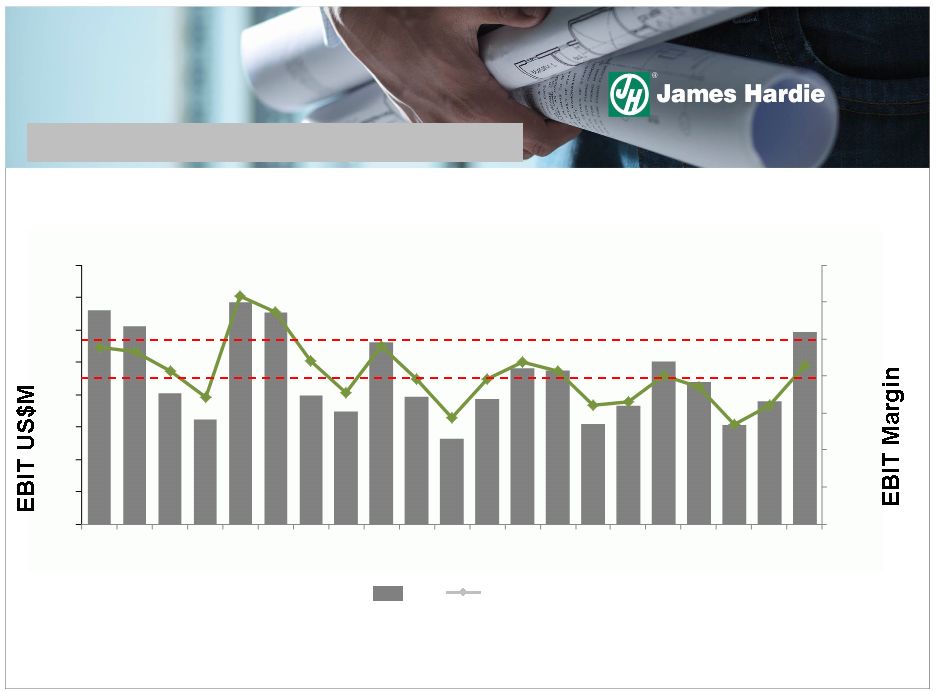 9
Quarterly EBIT and EBIT Margin
EBIT
EBIT Margin
1
USA AND EUROPE FIBRE CEMENT
0
5
10
15
20
25
30
35
0
10
20
30
40
50
60
70
80
FY09
FY10
FY11
FY12
FY13
FY14
1
Excludes
asset
impairment
charges
of
US$14.3
million
in
4
th
quarter
FY12,
US$5.8
million
in
3
rd
quarter
FY13
and
US$11.1
million
in
4
th
quarter FY13 |
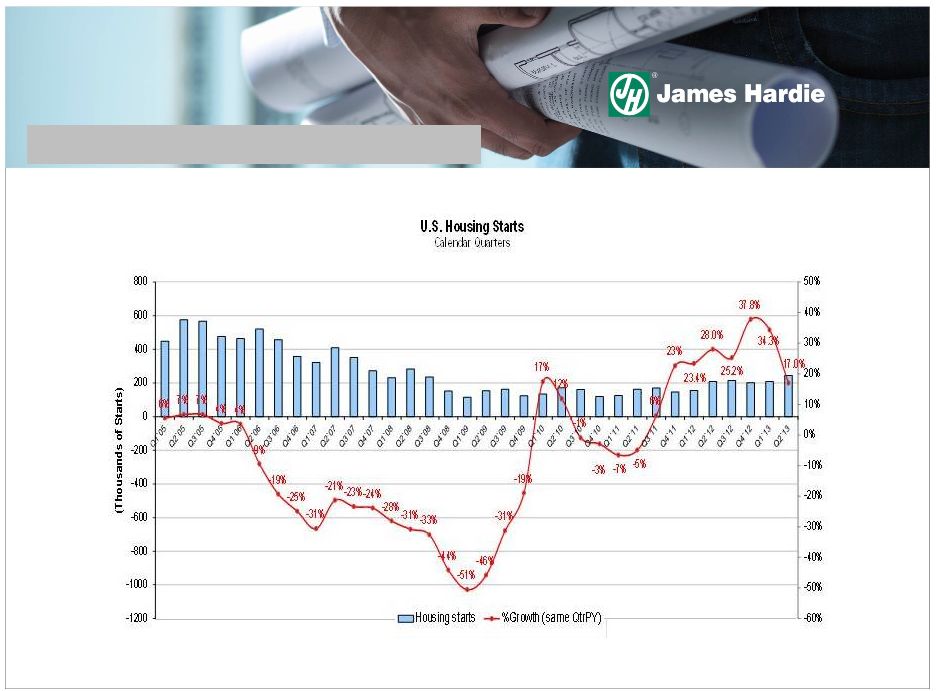
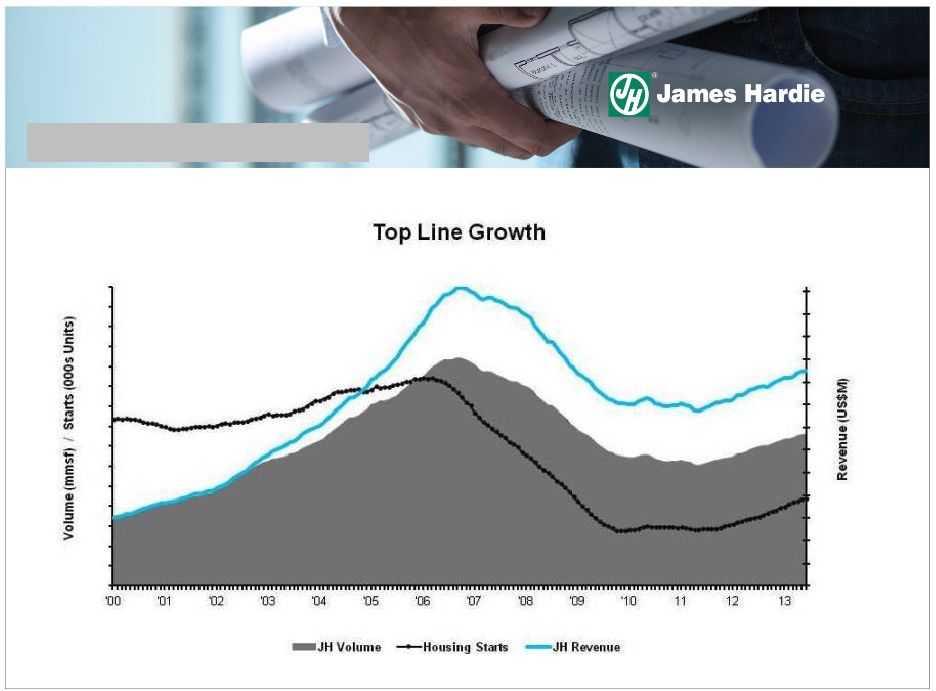 Rolling 12 month average of seasonally adjusted estimate of housing starts by US
Census Bureau 10
USA FIBRE CEMENT |
 11
USA AND EUROPE FIBRE CEMENT |
 ASIA
PACIFIC FIBRE CEMENT 1 QUARTER SUMMARY
12
1
Comparisons are of the 1 quarter of the current fiscal year versus the
1 quarter of the prior fiscal year Asia Pacific Fibre Cement
results reflected: •
Higher Australian and New Zealand housing starts
•
Increased sales volume and slightly higher average net sales price
•
Lower fixed unit manufacturing costs
•
Depreciation of the Australian dollar
st
st
st
1 |
 1st
Quarter Result Net Sales
up
7% to US$94.1 million
Sales Volume
up
8% to 102.4 mmsf
Average Price
up
1% to A$926 per msf
EBIT
up
19% to US$21.1 million
EBIT Margin
up
2.2 pts to 22.4%
13
1
Comparisons are of the 1
quarter of the current fiscal year versus the 1 quarter of the
prior fiscal year
2
Excludes New Zealand product liability expenses of US$4.6 million and nil in
1 quarter FY14 and 1 quarter FY13, respectively
1
2
2
ASIA PACIFIC FIBRE CEMENT
st
st
st
st |
 14
•
In Q1 FY14, James Hardie acquired the previously-leased land and
buildings at its existing Carole Park (Brisbane) plant and is expanding
production capacity at the site
•
New production capacity expected to be fully operational in first half of
CY15
•
Production at Rosehill (NSW) and Meeandah (Queensland) sites will
continue
NEW AUSTRALIAN MANUFACTURING CAPACITY |
 15
USA and Europe Fibre Cement
•
The US operating environment continues to reflect an increasing number of housing
starts and improving house values
•
Pick-up in repair and remodelling activity becoming apparent
•
The company is continuing with its plan to invest in capacity expansions through
re-commissioning of idled facilities in future periods
•
The company expects EBIT to revenue margin to be above 20% for FY14, absent major
adverse external factors
Asia Pacific Fibre Cement
•
In Australia, dwelling approvals continue to track on a gradual upward trend,
however the company is not anticipating any substantial increase in net
sales revenue in FY14 •
In New Zealand, the housing market continues to improve
•
In the Philippines, the business is experiencing growth in its core market segments
and is expected to deliver consistent earnings over the next 12 months
GROUP OUTLOOK |
 FINANCIAL REVIEW
Russell Chenu, CFO |
 Highlights
•
Earnings impacted by:
•
Increased sales volumes, revenues, EBIT and EBIT margins in all major business
units •
Unfavourable movement in the accounting provision for legacy product liability
claims in New Zealand, resulting in an expense of US$4.6 million
•
Favourable asbestos adjustments of US$94.5 million as a result of the 11%
depreciation of the Australian
dollar
spot
exchange
rate
against
the
US
dollar
at
30
June
2013
versus
31
March
2013
17
FINANCIAL REVIEW
•
58% increase in net operating cash flow to US$78.2 million
•
Completed purchase of the previously-leased land and buildings at our Carole
Park, Brisbane facility
•
An ordinary dividend of US13.0 cents per security and a special dividend of US24.0
cents per security, paid on 26 July 2013 from FY13 earnings. Total dividend
paid was US$163.6 million •
On 31 July 2013, the company repurchased 221,000 shares of its common stock, at
cost of A$2.0 million (US$1.8 million), at an average market price of A$9.02
(US$8.20) |
 18
US$ Millions
Q1 '14
Q1 '13
% Change
Net sales
372.2
339.7
10
Gross profit
126.3
110.0
15
SG&A expenses
(54.9)
(44.3)
(24)
Research & development expenses
(9.0)
(8.4)
(7)
Asbestos adjustments
94.5
25.2
-
EBIT
156.9
82.5
90
Net interest income
0.1
0.2
(50)
Other income
0.1
0.4
(75)
Income tax expense
(14.9)
(14.6)
(2)
Net operating profit
142.2
68.5
-
RESULTS Q1 |
 19
1
Includes AICF SG&A expenses and AICF interest income
RESULTS Q1 (CONTINUED)
US$ Millions
Q1 '14
Q1 '13
% Change
Net operating profit
142.2
68.5
-
Asbestos:
Asbestos adjustments
(94.5)
(25.2)
-
Other asbestos
(0.6)
(0.8)
25
ASIC expenses
-
0.1
-
New Zealand product liability expenses
4.6
-
-
Asbestos and other tax adjustments
0.3
1.2
(75)
Net operating profit excluding asbestos, ASIC
expenses, New Zealand product liability
expenses and tax adjustments
52.0
43.8
19
1 |
 US$ Millions
Q1 ’14
Q1 ’13
% Change
USA and Europe Fibre Cement
59.4
50.3
18
Asia Pacific Fibre Cement
21.1
17.7
19
Research & Development
(6.1)
(2)
Total segment EBIT excluding New Zealand product
liability expenses
74.4
20
General corporate costs excluding asbestos and
ASIC expenses
(6.9)
(4.3)
(60)
Total EBIT excluding asbestos, ASIC expenses
and New Zealand product liability expenses
67.5
57.7
17
Asbestos adjustments
94.5
-
AICF SG&A expenses
(0.5)
(0.3)
(67)
ASIC expenses
-
(0.1)
-
New Zealand product liaiblity expenses
(4.6)
-
Total EBIT
156.9
90
2
1
1
Asia Pacific Fibre Cement EBIT excludes New Zealand product liability expenses of
US$4.6 million and nil in Q1’FY14 and Q1’FY13, respectively
2
Research and development expenses include costs associated with research projects
that are designed to benefit all business units. These costs are recorded in
the Research and Development segment rather than attributed to individual business units
20
SEGMENT EBIT –
Q1
62.0
(6.0)
25.2
82.5 |
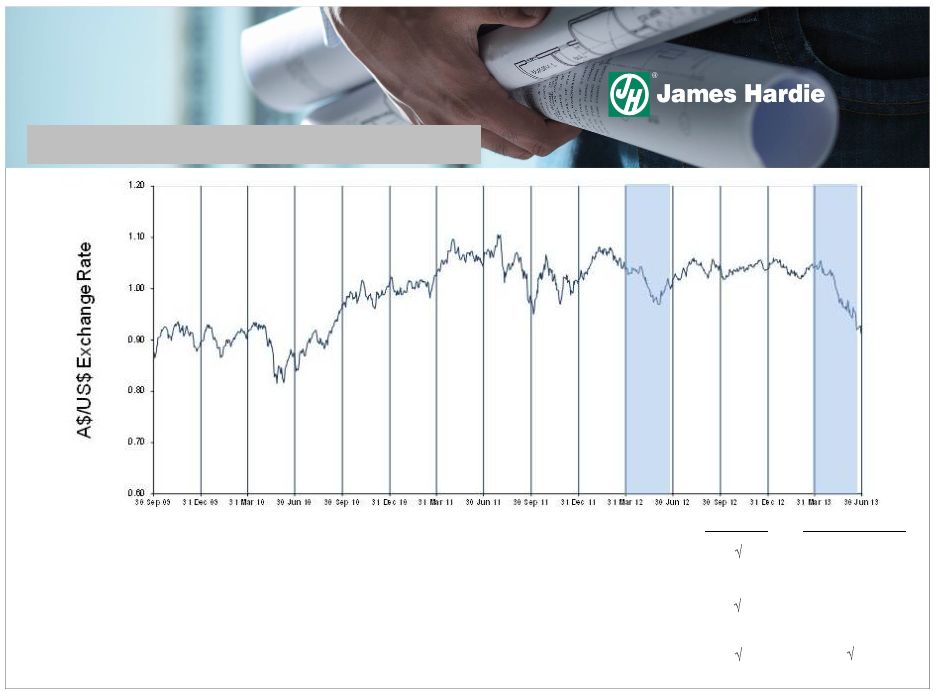 •
Unfavourable impact from translation of Asia Pacific results –
Q1 FY14
vs Q1 FY13
•
Favourable impact on corporate costs incurred in Australian dollars –
Q1 FY14 vs Q1 FY13
•
Favourable impact from translation of asbestos liability balance
–
30
June 2013 vs 31 March 2013
21
Earnings
Balance Sheet
N/A
N/A
CHANGES IN A$ VERSUS US$ |
 22
1
Includes AICF SG&A expenses and AICF interest income
INCOME TAX EXPENSE –
Q1
US$ Millions
Q1 ’14
Q1 ’13
Operating profit before income taxes
157.1
83.1
Asbestos:
Asbestos adjustments
(94.5)
(25.2)
Other asbestos
(0.6)
(0.8)
New Zealand product liability expenses
4.6
-
Operating profit before income taxes excluding asbestos
and New Zealand product liability expenses
66.6
57.1
Income tax expense
(14.9)
(14.6)
Asbestos and other tax adjustments
0.3
1.2
Income tax expense excluding tax adjustments
(14.6)
(13.4)
Effective tax rate excluding asbestos, New Zealand
product liability expenses and tax adjustments
21.9%
23.5%
1 |
 23
1
Certain reclassifications have been reflected in the prior period to conform with
current period presentation CASHFLOW
1
US$ Millions
Q1 ’14
Q1 ’13
EBIT
156.9
82.5
Non-cash items:
Asbestos adjustments
(94.5)
(25.2)
Other non-cash items
16.0
17.0
Net working capital movements
20.1
(8.1)
Cash Generated By Trading Activities
98.5
66.2
Tax payments, net
(1.7)
(0.6)
Change in other non-trading assets and liabilities
(16.7)
121.8
Change in asbestos-related assets & liabilities
(0.9)
1.4
Payment to the AICF
-
(138.7)
Interest paid
(1.0)
(0.5)
Net Operating Cash Flow
78.2
49.6
Purchases of property, plant & equipment
(26.1)
(14.9)
Proceeds from sale of property, plant & equipment
0.4
-
Proceeds from issuance of shares
2.5
1.1
Tax benefit from stock options exercised
0.2
-
Effect of exchange rate on cash
(10.8)
(3.6)
Movement In Net Cash
44.4
32.2
Beginning Net Cash
153.7
265.4
Ending Net Cash
198.1
297.6 |
 24
•
In Q1 FY14, the company completed the purchase of the previously-leased land
and buildings at Carole Park, Brisbane plant and commenced investments to
increase the plant’s production capacity
•
Refurbishment of Fontana, California plant remains on schedule and is expected to
reopen in early calendar year 2014
CAPITAL EXPENDITURE
US$ Millions
Q1 ’14
Q1 ’13
% Change
USA and Europe Fibre Cement (including
Research and Development)
11.6
13.1
(11)
Asia Pacific Fibre Cement
14.5
1.8
-
Total
26.1
14.9
75 |
 25
CAPITAL MANAGEMENT AND DIVIDENDS
•
An ordinary dividend of US13.0 cents per security and a special dividend of US24.0
cents
per
security
were
paid
on
26
July
2013
from
FY13
earnings.
Total
dividend
paid
was US$163.6 million
•
In May 2013, the company announced a new share buyback program to acquire up to
5% of its issued capital during the following 12 months
•
On 31 July 2013, the company repurchased 221,000 shares of its common stock, at
cost of A$2.0 million (US$1.8 million), at an average market price of A$9.02
(US$8.20) |
 26
•
At 30 June 2013:
DEBT
•
Weighted
average
remaining
term
of
debt
facilities
was
2.8
years
at
30
June
2013,
down
from
3.1 years at 31 March 2013
•
James Hardie remains well within its financial debt covenants
•
Net cash of US$198.1 million compared to net cash of US$153.7 million at 31 March
2013 •
Net cash position at 30 June 2013 was reduced to the extent of the July 2013
dividend payment of US$163.6 million
US$ Millions
Total facilities
405.0
Gross debt
-
Cash
198.1
Net cash
(198.1)
Unutilised facilities and cash
603.1 |
 27
New Zealand Product Liability Claims:
New Zealand Ministry of Education (MOE) claim:
NEW ZEALAND PRODUCT LIABILITY CLAIMS AND NEW ZEALAND MOE CLAIM
•
On
16
April
2013,
the
MOE
filed
a
‘representative
action’
against
two
James
Hardie
NZ
subsidiaries and other parties
•
The company is not yet able to determine the amount or range of loss, if any, that
the NZ subsidiaries may be liable for
•
The company has not made a provision for the MOE claim as of 30 June 2013
•
Since FY02 James Hardie NZ subsidiaries have been joined to product liability
claims that relate to buildings primarily constructed from 1998 to
2004 •
These claims often involve multiple parties and allege losses due to excessive
moisture penetration
•
Q1 FY14 expense of US$4.6 million reflects adverse movements in provisions for
existing claims during the quarter
•
At 30 June 2013 and 31 March 2013, the provision for NZ product liability, net of
anticipated third-party recoveries was US$18.0 million and US$15.2
million, respectively |
 28
ASBESTOS FUND –
PROFORMA (UNAUDITED)
A$ millions
AICF cash and investments -
31 March 2013
128.1
Insurance recoveries
5.4
Interest and investment income
2.0
Claims paid
(38.1)
Operating costs
(1.1)
AICF cash and investments -
30 June 2013
96.3 |
 29
•
Net operating profit of US$52.0 million, which excludes asbestos, ASIC
expenses, New Zealand product liability expenses and tax adjustments,
reflected:
•
Improved sales volumes and higher average net sales prices in both the
USA and Europe and the Asia Pacific Fibre Cement segments
•
Increased employment and marketing costs in the US due to ramp up of
organisational capabilities that occurred in the second half of the prior fiscal
year
•
Higher operating earnings in the US business with the USA and Europe
Fibre Cement EBIT margin at 21.4% for the quarter
•
Increased contribution by the Asia Pacific Fibre Cement segment with
adjusted EBIT margin for the quarter at 22.4%
•
Ongoing investment in the refurbishment and re-commissioning of our Fontana,
California plant which remains scheduled to reopen in early calendar year
2014 •
Purchase of the previously-leased land and buildings at our Carole Park,
Brisbane facility
SUMMARY |
 30
•
Management notes the range of analysts’
forecasts for net operating profit
excluding asbestos for the year ending 31 March 2014 is between US$165
million and US$194 million
•
Management expects full year earnings excluding asbestos, asset
impairments, ASIC expenses, New Zealand product liability expenses and tax
adjustments to be within that range
•
Guidance is dependent on, among other things, housing industry conditions in
the US continuing to improve and an average exchange rate at or near
current levels applying for the balance of the year ending 31 March 2014
•
Although US housing activity has been improving for some time, market
conditions remain somewhat uncertain and some input costs remain
volatile
•
Management is unable to forecast the comparable US GAAP financial
measure due to uncertainty regarding the impact of actuarial estimates on
asbestos-related assets and liabilities in future periods
FY2014 GUIDANCE |
 QUESTIONS |
 APPENDIX |
 33
1
Asia Pacific Fibre Cement EBIT excludes New Zealand product liability expenses of
US$4.6 million and nil in Q1 ‘14 and Q1 ‘13, respectively FINANCIAL
SUMMARY US$ Millions
% Change
Net Sales
USA and Europe Fibre Cement
278.1
$
252.0
$
10
Asia Pacific Fibre Cement
94.1
87.7
7
Total Net Sales
372.2
$
339.7
$
10
EBIT -
US$ Millions
USA and Europe Fibre Cement
59.4
$
50.3
$
18
Asia Pacific Fibre Cement
21.1
17.7
19
Research & Development
(6.1)
(6.0)
(2)
General corporate costs excluding
asbestos and ASIC
(6.9)
(4.3)
(60)
Total EBIT excluding asbestos, ASIC
expenses and New Zealand product
liability expenses
67.5
$
57.7
$
17
Net interest expense excluding AICF
interest income
(1.0)
(0.9)
(11)
Other income
0.1
0.4
(75)
Income tax expense excluding tax
adjustments
(14.6)
(13.4)
(9)
Net operating profit excluding
asbestos, ASIC expenses, New
Zealand product liability expenses
and tax adjustments
52.0
$
43.8
$
19
Q1 '14
Q1 '13
1 |
 1
Excludes
asbestos
adjustments,
AICF
SG&A
expenses,
AICF
interest
income,
tax
expense
related
to
asbestos
adjustments,
ASIC
expenses,
New
Zealand product liability expenses and tax adjustments
2
Excludes asbestos adjustments, AICF SG&A expenses, New Zealand product
liability expenses and ASIC expenses 34
KEY RATIOS
3 Months
FY2014
3 Months
FY2013
3 Months
FY2012
EPS (Diluted)
11.7c
10.0c
9.0c
EBIT/ Sales (EBIT margin)
18.1%
17.0%
18.0%
Gearing Ratio
(16.5)%
(32.1)%
2.1%
Net Interest Expense Cover
84.4x
57.7x
37.7x
Net Interest Paid Cover
67.5x
115.4x
33.2x
Net Debt Payback
-
-
0.4yrs
1
2
1
2
2 |
 35
1
Excludes New Zealand product liability expenses of US$4.6 million and nil in Q1
FY14 and Q1 FY13, respectively EBITDA –
Q1
US$ Millions
Q1 ’14
Q1 ’13
% Change
EBIT
USA and Europe Fibre Cement
59.4
50.3
18
Asia Pacific Fibre Cement
21.1
17.7
19
Research & Development
(6.1)
(6.0)
(2)
General corporate excluding asbestos and ASIC expenses
(6.9)
(4.3)
(60)
Depreciation and Amortisation
USA and Europe Fibre Cement
13.4
13.3
1
Asia Pacific Fibre Cement
2.0
2.1
(5)
Total EBITDA excluding asbestos, ASIC expenses and
New Zealand product liability expenses
82.9
73.1
13
Asbestos adjustments
94.5
25.2
-
AICF SG&A expenses
(0.5)
(0.3)
(67)
ASIC expenses
-
(0.1)
-
New Zealand product liability expenses
(4.6)
-
-
Total EBITDA
172.3
97.9
76
1 |
 36
GENERAL CORPORATE COSTS –
Q1
US$ Millions
Q1 '14
Q1 '13
% Change
Stock compensation expense
0.4
2.6
85
Corporate structure simplification expense
0.2
1.5
87
Other costs
6.3
5.7
(11)
General corporate costs excluding ASIC
expenses and intercompany foreign
exchange gain
6.9
9.8
30
ASIC expenses
-
0.1
-
Intercompany foreign exchange gain
-
(5.5)
-
General corporate costs
6.9
4.4
(57) |
 37
NET INTEREST INCOME
US$ Millions
Q1 ’14
Q1 ’13
Gross interest expense
(1.0)
(0.8)
Interest income
0.1
0.4
Realised loss on interest rate swaps
(0.1)
(0.5)
Net interest expense excluding AICF interest income
(1.0)
(0.9)
AICF interest income
1.1
1.1
Net interest income
0.1
0.2 |
 38
TOTAL US HOUSING STARTS |
 This Management Presentation forms part of a package of information about the
company’s results. It should be read in conjunction with the other
parts of this package, including the Management’s Analysis of Results, Media
Release and Consolidated Financial Statements Definitions
Non-financial Terms
ABS
–
Australian Bureau of Statistics
AFFA
–
Amended and Restated Final Funding Agreement
AICF
–
Asbestos Injuries Compensation Fund Ltd
ASIC
–
Australian Securities and Investments Commission
ATO
–
Australian Taxation Office
NBSK –
Northern Bleached Soft Kraft; the company's benchmark grade of pulp
39
ENDNOTES |
 Financial Measures –
US GAAP equivalents
This
document
contains
financial
statement
line
item
descriptions
that
are
considered
to
be
non-US
GAAP,
but
are
consistent
with
those
used
by
Australian
companies.
Because
the
company
prepares
its
consolidated
financial
statements
under
US
GAAP,
the
following
table
cross-references
each
non-US
GAAP
line
item
description,
as
used
in
Management’s
Analysis
of
Results
and
Media
Release,
to
the
equivalent
US
GAAP
financial
statement
line
item
description
used
in
the
company’s
consolidated
financial statements:
40
Management's Analysis of Results and
Consolidated Statements of Operations
Media Release
and Other Comprehensive Income (Loss)
(US GAAP)
Net sales
Net sales
Cost of goods sold
Cost of goods sold
Gross profit
Gross profit
Selling, general and administrative expenses
Selling, general and administrative expenses
Research and development expenses
Research and development expenses
Asbestos adjustments
Asbestos adjustments
EBIT
*
Operating income (loss)
Net interest income (expense)*
Sum of interest expense and interest income
Other income (expense)
Other income (expense)
Operating profit (loss) before income taxes*
Income (loss) before income taxes
Income tax (expense) benefit
Income tax (expense) benefit
Net operating profit (loss)*
Net income (loss)
*- Represents non-U.S. GAAP descriptions used by Australian companies.
ENDNOTES (CONTINUED) |
 EBIT
margin – EBIT margin is defined as EBIT as a percentage of net
sales. Sales Volumes
mmsf
–
million
square
feet,
where
a
square
foot
is
defined
as
a
standard
square
foot
of
5/16”
thickness
msf
–
thousand
square
feet,
where
a
square
foot
is
defined
as
a
standard
square
foot
of
5/16”
thickness
Financial Ratios
Gearing Ratio
–
Net debt (cash) divided by net debt (cash) plus shareholders’
equity
Net interest expense cover
–
EBIT divided by net interest expense (excluding loan establishment fees)
Net interest paid cover
–
EBIT divided by cash paid during the period for interest, net of
amounts capitalised
Net debt payback
–
Net debt (cash) divided by cash flow from operations
Net debt (cash)
–
Short-term and long-term debt less cash and cash equivalents
Return on Capital employed
–
EBIT divided by gross capital employed
41
ENDNOTES (CONTINUED) |
 EBIT
and
EBIT
margin
excluding
asbestos,
ASIC
expenses
and
New
Zealand
product
liability
expenses
–
EBIT
and
EBIT
margin
excluding
asbestos,
ASIC
expenses
and
New
Zealand
product
liability
expenses
are
not
measures
of
financial
performance
under
US
GAAP
and
should
not
be
considered
to
be
more
meaningful
than
EBIT
and
EBIT
margin.
Management
has
included
these
financial
measures
to
provide
investors
with
an
alternative
method
for
assessing
its
operating
results
in
a
manner
that
is
focussed
on
the
performance
of
its
ongoing
operations
and
provides
useful
information
regarding
its
financial
condition
and
results
of
operations.
Management
uses
these
non-US
GAAP
measures
for
the
same
purposes
42
NON-US GAAP FINANCIAL MEASURES
Q1
Q1
US$ Millions
FY 2014
FY 2013
EBIT
$ 156.9
$ 82.5
Asbestos:
Asbestos adjustments
(94.5)
(25.2)
AICF SG&A expenses
0.5
0.3
ASIC expenses
-
0.1
New Zealand product liability expenses
4.6
-
EBIT excluding asbestos, ASIC expenses and New
Zealand product liability expenses
67.5
57.7
Net sales
$ 372.2
$ 339.7
EBIT margin excluding asbestos, ASIC expenses and
New Zealand product liability expenses
18.1%
17.0% |
 Net
operating
profit
excluding
asbestos,
ASIC
expenses,
New
Zealand
product
liability
expenses
and
tax
adjustments
–
Net operating
profit excluding asbestos, ASIC expenses, New Zealand product liability expenses
and tax adjustments is not a measure of financial performance under US GAAP
and should not be considered to be more meaningful than net operating
profit. Management has included this financial measure to provide investors
with an alternative method for assessing its operating results in a manner that is focussed on the performance of its ongoing
operations. Management uses this non-US GAAP measure for the same
purposes 43
Q1
Q1
US$ Millions
FY 2014
FY 2013
Net operating profit
$ 142.2
$ 68.5
Asbestos:
Asbestos adjustments
(94.5)
(25.2)
AICF SG&A expenses
0.5
0.3
AICF interest income
(1.1)
(1.1)
ASIC expenses
-
0.1
New Zealand product liability expenses
4.6
-
Asbestos and other tax adjustments
0.3
1.2
Net operating profit excluding asbestos, ASIC
expenses, New Zealand product liability expenses
and tax adjustments
$ 52.0
$ 43.8
NON-US GAAP FINANCIAL MEASURES (CONTINUED) |
 Diluted
earnings
per
share
excluding
asbestos,
ASIC
expenses,
New
Zealand
product
liability
expenses
and
tax adjustments
–
Diluted
earnings
per
share
excluding
asbestos,
ASIC
expenses,
New
Zealand
product
liability
expenses
and
tax
adjustments
is
not
a
measure
of
financial
performance
under
US
GAAP
and
should
not
be
considered
to
be
more
meaningful
than
diluted
earnings
per
share.
Management
has
included
this
financial
measure
to
provide
investors
with
an
alternative
method
for
assessing
its
operating
results
in
a
manner
that
is
focussed
on
the
performance
of
its
ongoing
operations.
Management
uses
this non-
US
GAAP
measure
for
the
same
purposes
44
NON-US GAAP FINANCIAL MEASURES (CONTINUED)
Q1
Q1
US$ Millions
FY 2014
FY 2013
Net operating profit excluding asbestos, ASIC
expenses, New Zealand product liability expenses
and tax adjustments
$ 52.0
$ 43.8
Weighted average common shares outstanding -
Diluted (millions)
443.1
438.5
Diluted earnings per share excluding asbestos,
ASIC expenses, New Zealand product liability
expenses and tax adjustments (US cents)
11.7
10.0 |
 Effective
tax
rate
excluding
asbestos,
New
Zealand
product
liability
expenses
and
tax
adjustments
–
Effective
tax
rate
on
earnings
excluding
asbestos,
New
Zealand
product
liability
expenses
and
tax
adjustments
is
not
a
measure
of
financial
performance
under
US
GAAP
and
should
not
be
considered
to
be
more
meaningful
than
effective
tax
rate.
Management
has
included
this
financial
measure
to
provide
investors
with
an
alternative
method
for
assessing
its
operating
results
in
a
manner
that
is
focussed
on
the
performance
of
its
ongoing
operations.
Management
uses
this
non-US
GAAP
measure
for
the
same
purposes
45
NON-US GAAP FINANCIAL MEASURES (CONTINUED)
Q1
Q1
US$ Millions
FY 2014
FY 2013
Operating profit before income taxes
$ 157.1
$ 83.1
Asbestos:
Asbestos adjustments
(94.5)
(25.2)
AICF SG&A expenses
0.5
0.3
AICF interest income
(1.1)
(1.1)
New Zealand product liability expenses
4.6
-
Operating profit before income taxes excluding asbestos and New
Zealand product liability expenses
$ 66.6
$ 57.1
Income tax expense
(14.9)
(14.6)
Asbestos and other tax adjustments
0.3
1.2
Income tax expense excluding tax adjustments
(14.6)
(13.4)
Effective tax rate
9.5%
17.6%
Effective tax rate excluding asbestos, New Zealand product liability
expenses and tax adjustments
21.9%
23.5% |
 Adjusted
EBITDA
–
is
not
a
measure
of
financial
performance
under
US
GAAP
and
should
not
be
considered
an
alternative
to,
or
more
meaningful
than,
income
from
operations,
net
income
or
cash
flows
as
defined
by
US
GAAP
or
as
a
measure
of
profitability
or
liquidity.
Not
all
companies
calculate
Adjusted
EBITDA
in
the
same
manner
as
James
Hardie
has
and,
accordingly,
Adjusted
EBITDA
may
not
be
comparable
with
other
companies.
Management
has
included
information
concerning
Adjusted
EBITDA
because
it
believes
that
this
data
is
commonly
used
by
investors
to
evaluate
the
ability
of
a
company’s
earnings
from
its
core
business
operations
to
satisfy
its
debt,
capital
expenditure
and
working
capital
requirements
46
NON-US GAAP FINANCIAL MEASURES (CONTINUED)
Q1
Q1
US$ Millions
FY 2014
FY 2013
EBIT
$ 156.9
$ 82.5
Depreciation and amortisation
15.4
15.4
Adjusted EBITDA
$ 172.3
$ 97.9 |
 General
corporate
costs
excluding
ASIC
expenses
and
intercompany
foreign
exchange
gain
–
General
corporate
costs
excluding
ASIC
expenses
and
intercompany
foreign
exchange
gain
is
not
a
measure
of
financial
performance
under
US
GAAP
and
should
not
be
considered
to
be
more
meaningful
than
general
corporate
costs.
Management
has
included
these
financial
measures
to
provide
investors
with
an
alternative
method
for
assessing
its
operating
results
in
a
manner
that
is
focussed
on
the
performance
of
its
ongoing
operations
and
provides
useful
information
regarding
its
financial
condition
and
results
of
operations.
Management
uses
these
non-US
GAAP
measures
for
the
same
purposes
47
NON-US GAAP FINANCIAL MEASURES (CONTINUED)
Q1
Q1
US$ Millions
FY 2013
General corporate costs
$ 6.9
$ 4.4
Excluding:
ASIC expenses
-
(0.1)
Intercompany foreign exchange gain
-
5.5
General corporate costs excluding ASIC
expenses and intercompany foreign exchange
gain
$ 6.9
$ 9.8
FY 2014 |
 Selling,
general
and
administrative
expenses
excluding
New
Zealand
product
liability
expenses
–
Selling,
general
and
administrative
expenses
excluding
New
Zealand
product
liability
expenses
is
not
a
measure
of
financial
performance
under
US
GAAP
and
should
not
be
considered
to
be
more
meaningful
than
selling,
general
and
administrative
expenses.
Management
has
included
these
financial
measures
to
provide
investors
with
an
alternative
method
for
assessing
its
operating
results
in
a
manner
that
is
focussed
on
the
performance
of
its
ongoing
operations
and
provides
useful
information
regarding
its
financial
condition
and
results
of
operations.
Management
uses
these
non-US
GAAP
measures
for
the
same
purposes
48
NON-US GAAP FINANCIAL MEASURES (CONTINUED)
Q1
Q1
US$ Millions
FY 2013
Selling, general and administrative expenses
$ 54.9
$ 44.3
Excluding:
New Zealand product liability expenses
(4.6)
-
Selling, general and administrative expenses
excluding New Zealand product liability expenses
$ 50.3
$ 44.3
Net Sales
$ 372.2
$ 339.7
Selling, general and administrative expenses as a
percentage of net sales
14.8%
13.0%
Selling, general and administrative expenses
excluding New Zealand product liability expenses as
a percentage of net sales
13.5%
13.0%
FY 2014 |
 Q1
FY14 MANAGEMENT PRESENTATION 12 August 2013 |