Exhibit 99.7
South division Ryan Sullivan USA Investor/Analyst Tour – Thursday 19th September 2013
South Division Overview Division Overview Market Trim ColorPlus Channel Manufacturing Capability Capacity
AGENDA
| 2 |
|
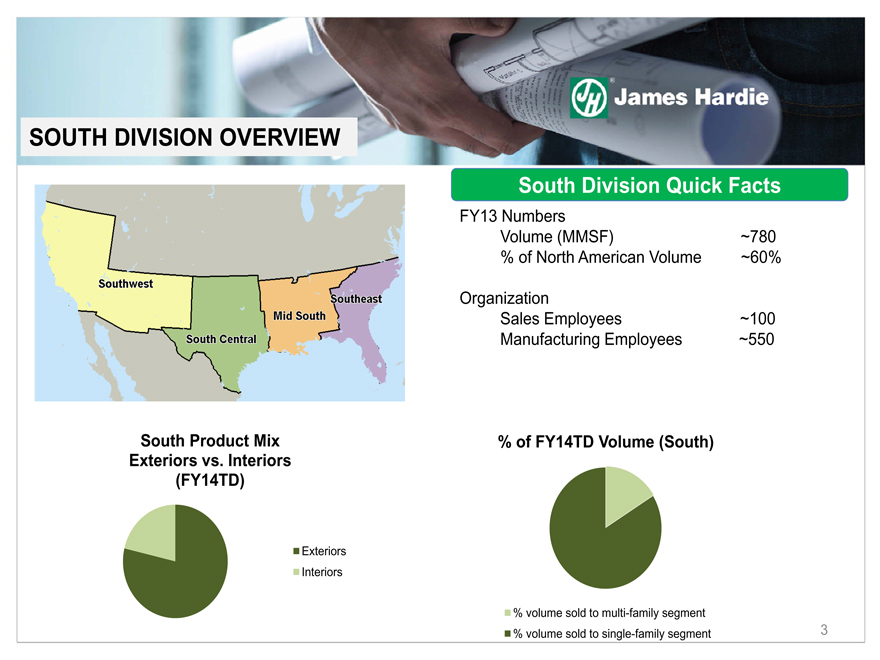
South Division Quick Facts
FY13 Numbers Volume (MMSF) ~780 % of North American Volume ~60% Organization Sales Employees ~100 Manufacturing Employees ~550 (CHART) (CHART)
SOUTH DIVISION OVERVIEW
| 3 |
|
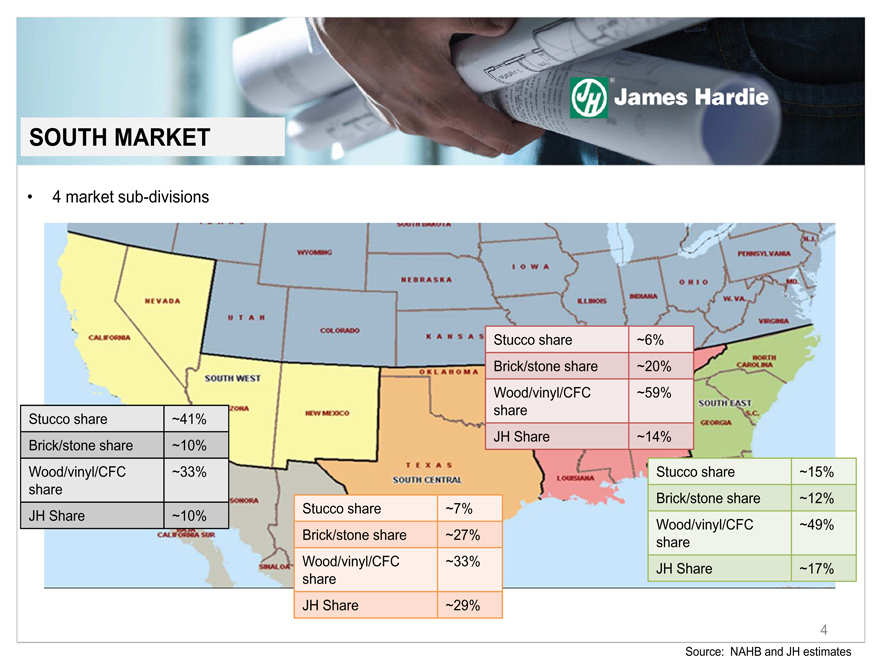
4 market sub-divisions Stucco share ~41% Brick/stone share ~10% Wood/vinyl/CFC share ~33% JH Share ~10% Stucco share ~7% Brick/stone share ~27% Wood/vinyl/CFC share ~33% JH Share ~29% Stucco share ~6% Brick/stone share ~20% Wood/vinyl/CFC share ~59% JH Share ~14% Stucco share ~15% Brick/stone share ~12% Wood/vinyl/CFC share ~49% JH Share ~17%
Source: NAHB and JH estimates
SOUTH MARKET
| 4 |
|
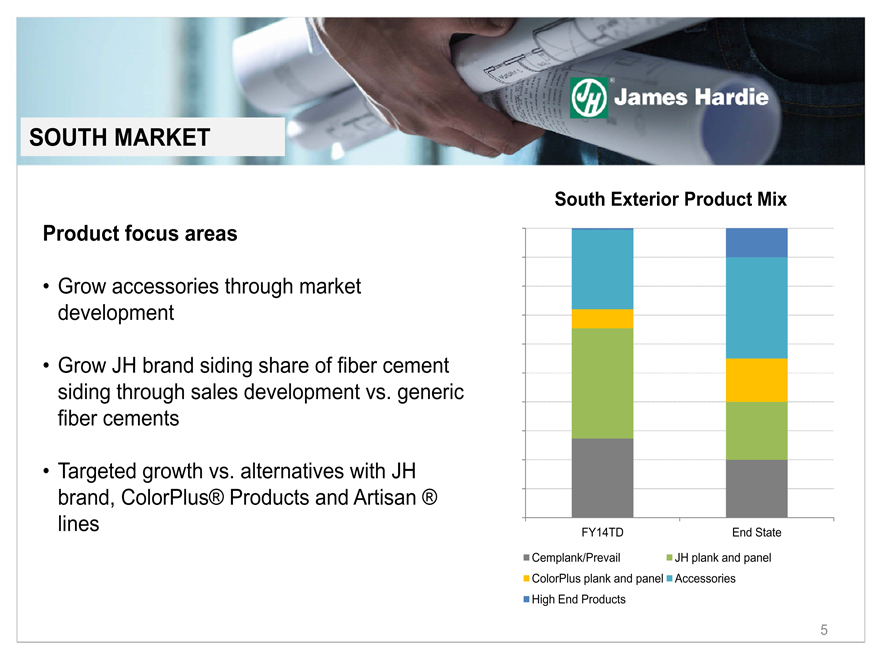
Product focus areas Grow accessories through market development Grow JH brand siding share of fiber cement siding through sales development vs. generic fiber cements Targeted growth vs. alternatives with JH brand, ColorPlus® Products and Artisan ® lines
South Exterior Product Mix (CHART)
SOUTH MARKET
| 5 |
|
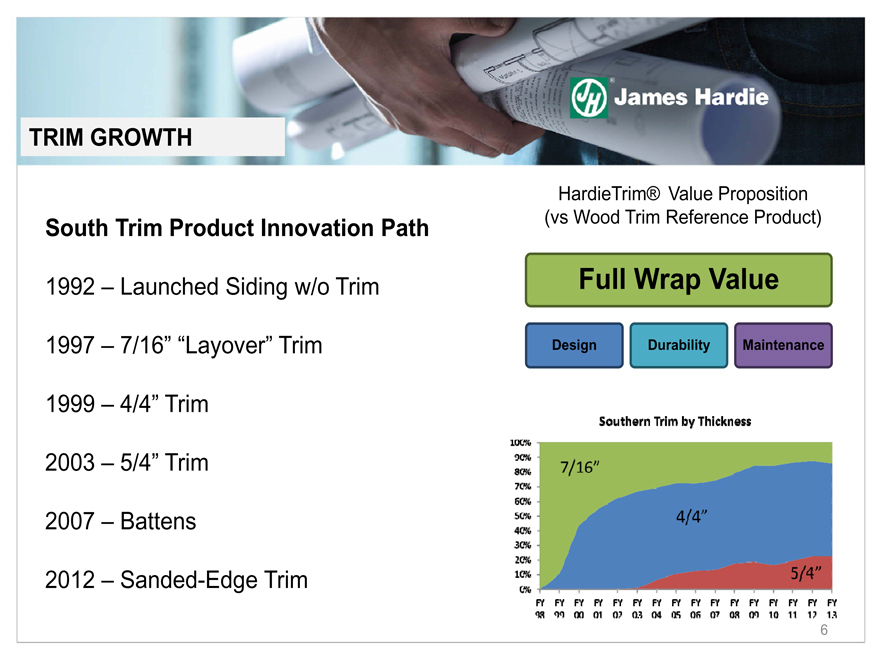
HardieTrim® Value Proposition (vs Wood Trim Reference Product)
South Trim Product Innovation Path 1992 – Launched Siding w/o Trim 1997 – 7/16” “Layover” Trim 1999 – 4/4” Trim 2003 – 5/4” Trim 2007 – Battens 2012 – Sanded-Edge Trim
TRIM GROWTH
| 6 |
|
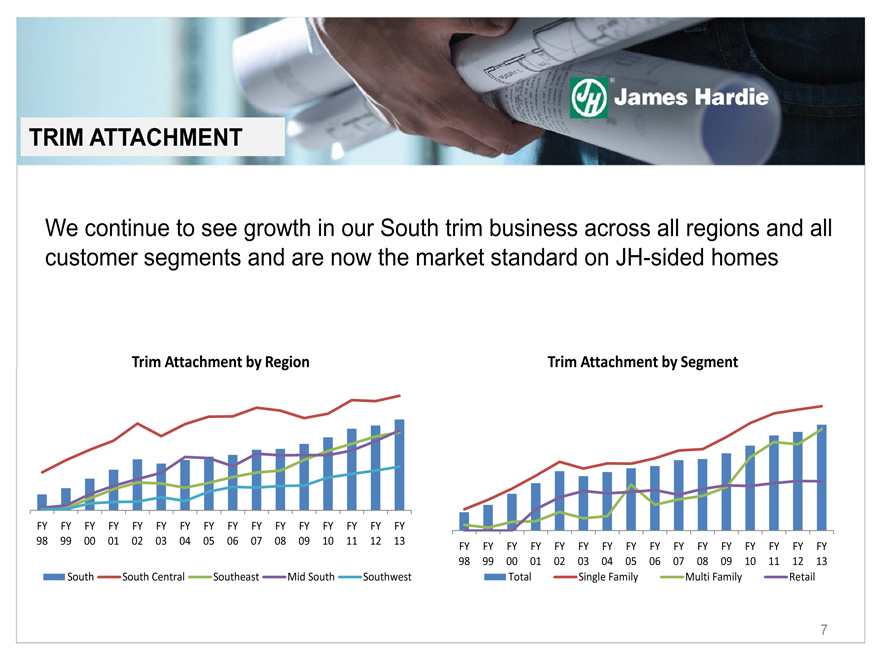
We continue to see growth in our South trim business across all regions and all customer segments and are now the market standard on JH-sided homes
TRIM ATTACHMENT
| 7 |
|
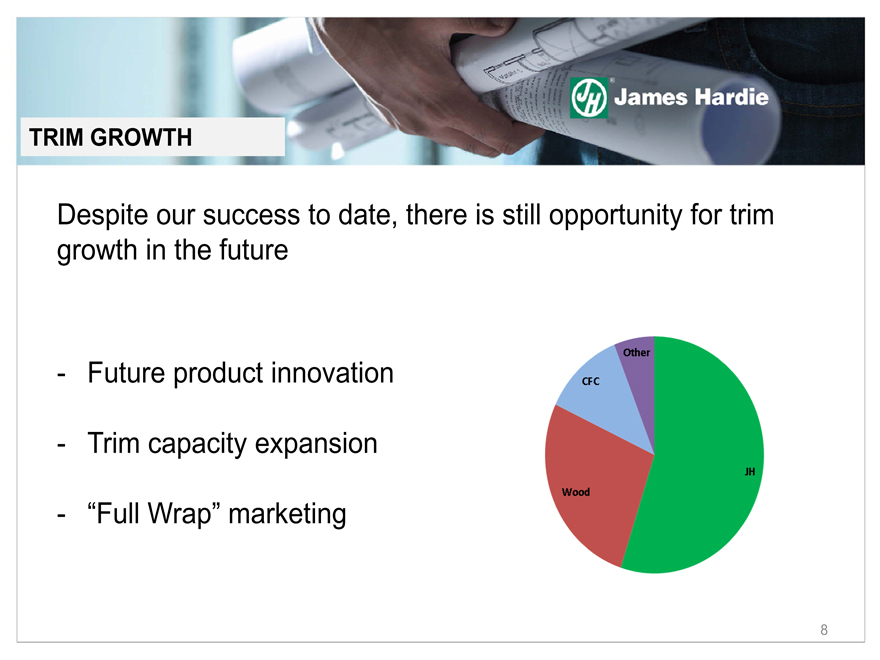
Despite our success to date, there is still opportunity for trim growth in the future
Future product innovation Trim capacity expansion “Full Wrap” marketing
TRIM GROWTH
| 8 |
|
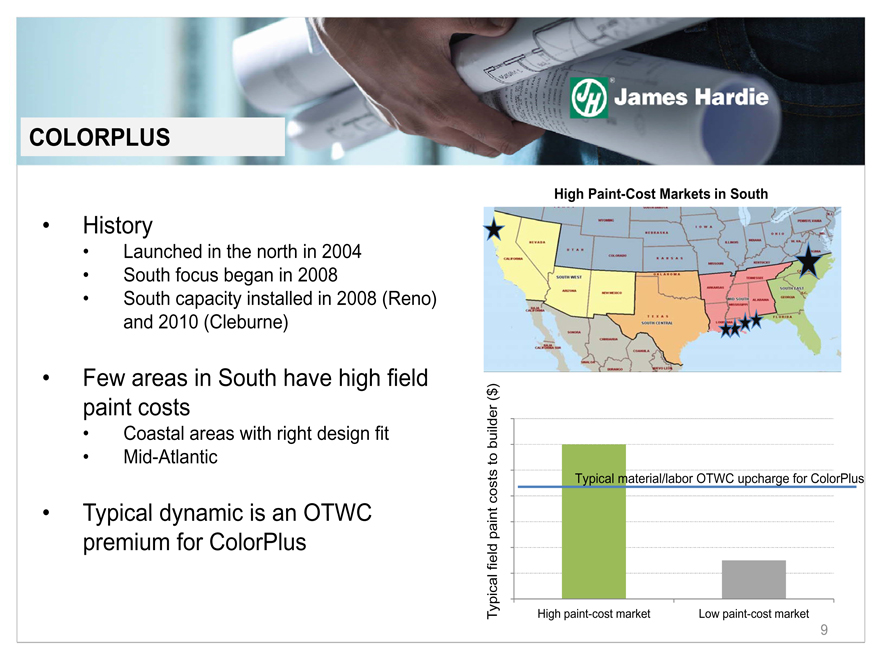
History Launched in the north in 2004 South focus began in 2008 South capacity installed in 2008 (Reno) and 2010 (Cleburne) Few areas in South have high field paint costs Coastal areas with right design fit Mid-Atlantic Typical dynamic is an OTWC premium for ColorPlus
High Paint-Cost Markets in South (CHART)
Typical material/labor OTWC upcharge for ColorPlus
Typical field paint costs to builder ($)
COLORPLUS
9
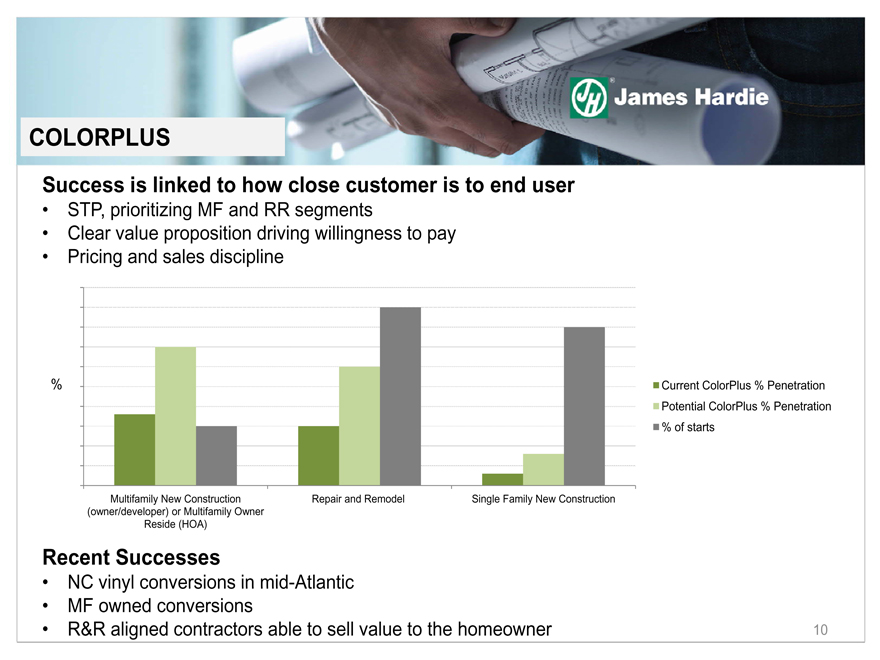
Success is linked to how close customer is to end user STP, prioritizing MF and RR segments Clear value proposition driving willingness to pay Pricing and sales discipline Recent Successes NC vinyl conversions in mid-Atlantic MF owned conversions R&R aligned contractors able to sell value to the homeowner (CHART)
%
COLORPLUS
10
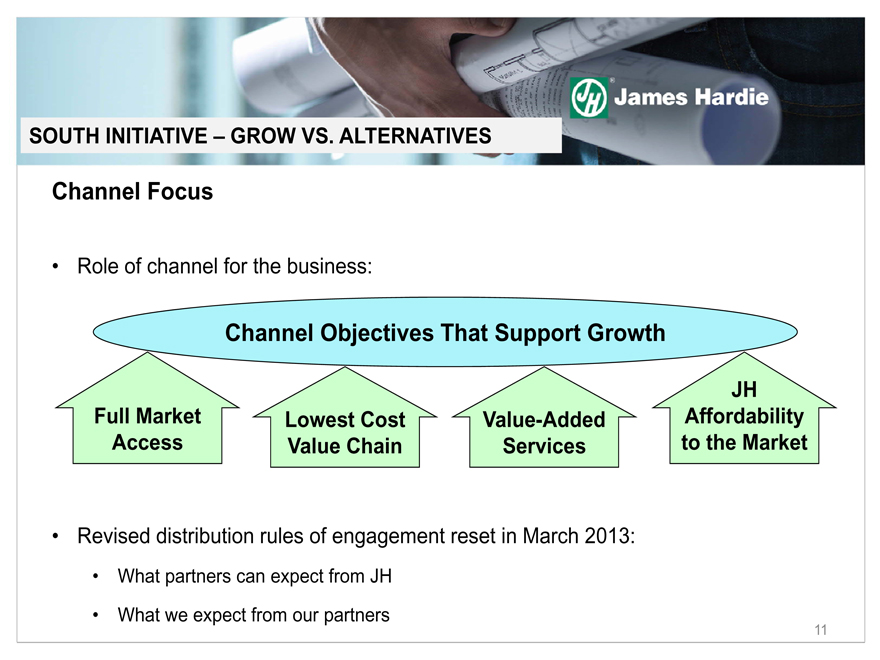
Channel Focus Role of channel for the business: Revised distribution rules of engagement reset in March 2013: What partners can expect from JH What we expect from our partners
Lowest Cost Value Chain
Full Market Access
Value-Added Services
Channel Objectives That Support Growth
JH Affordability to the Market
SOUTH INITIATIVE – GROW VS. ALTERNATIVES
11
South Manufacturing Network Capacity
SOUTH MANUFACTURING
12
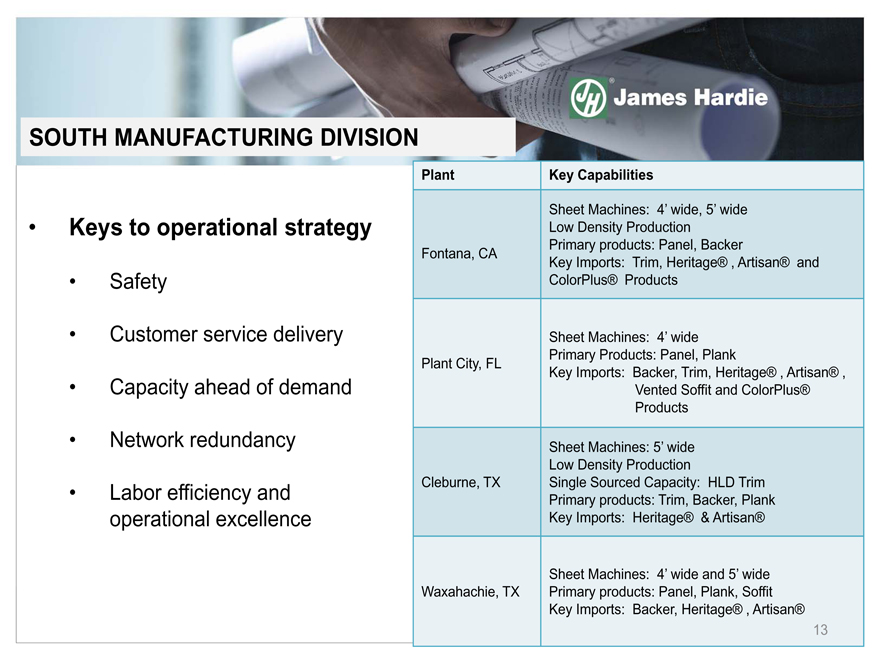
Plant Key Capabilities Fontana, CA Sheet Machines: 4’ wide, 5’ wideLow Density ProductionPrimary products: Panel, BackerKey Imports: Trim, Heritage®, Artisan® and ColorPlus® Products Plant City, FL Sheet Machines: 4’ widePrimary Products: Panel, PlankKey Imports: Backer, Trim, Heritage®, Artisan®, Vented Soffit and ColorPlus® Products Cleburne, TX Sheet Machines: 5’ wideLow Density ProductionSingle Sourced Capacity: HLD TrimPrimary products: Trim, Backer, PlankKey Imports: Heritage® & Artisan® Waxahachie, TX Sheet Machines: 4’ wide and 5’ widePrimary products: Panel, Plank, SoffitKey Imports: Backer, Heritage®, Artisan®
Keys to operational strategy Safety Customer service delivery Capacity ahead of demand Network redundancy Labor efficiency and operational excellence
SOUTH MANUFACTURING DIVISION
13
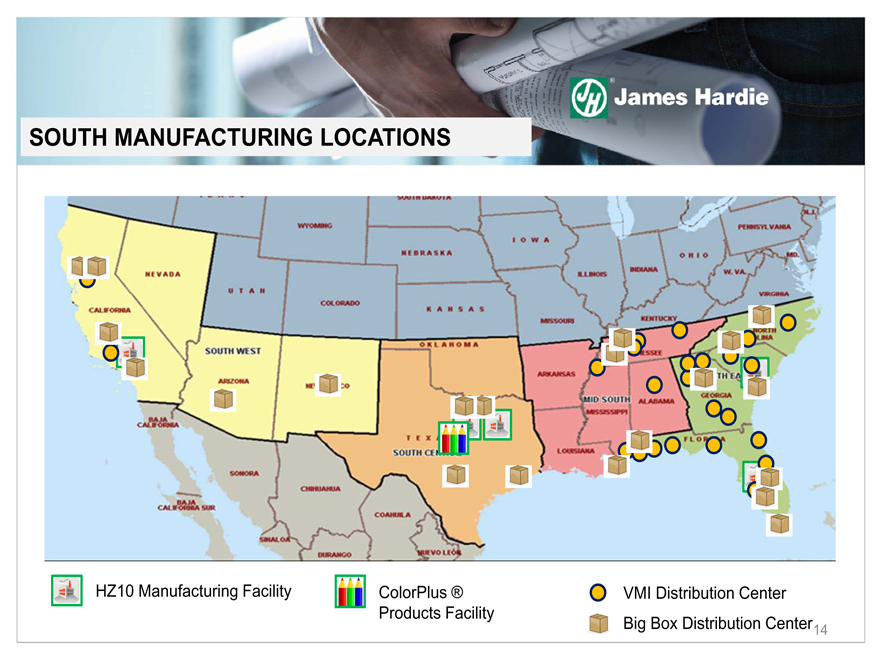
HZ10 Manufacturing Facility
ColorPlus ® Products Facility
VMI Distribution Center
Big Box Distribution Center
SOUTH MANUFACTURING LOCATIONS
14
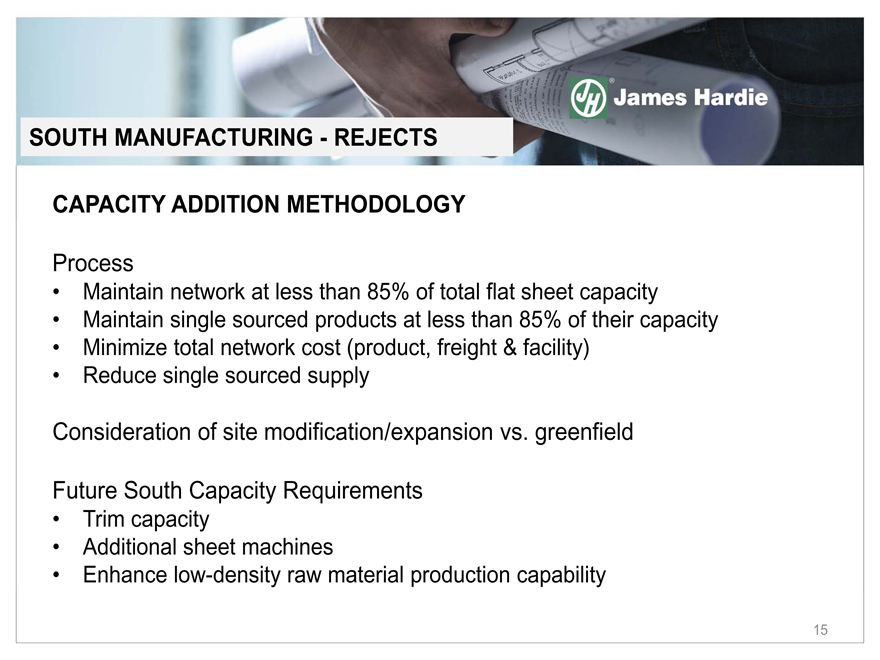
CAPACITY ADDITION METHODOLOGY Process Maintain network at less than 85% of total flat sheet capacity Maintain single sourced products at less than 85% of their capacity Minimize total network cost (product, freight & facility) Reduce single sourced supply Consideration of site modification/expansion vs. greenfield Future South Capacity Requirements Trim capacity Additional sheet machines Enhance low-density raw material production capability
SOUTH MANUFACTURING—REJECTS
15
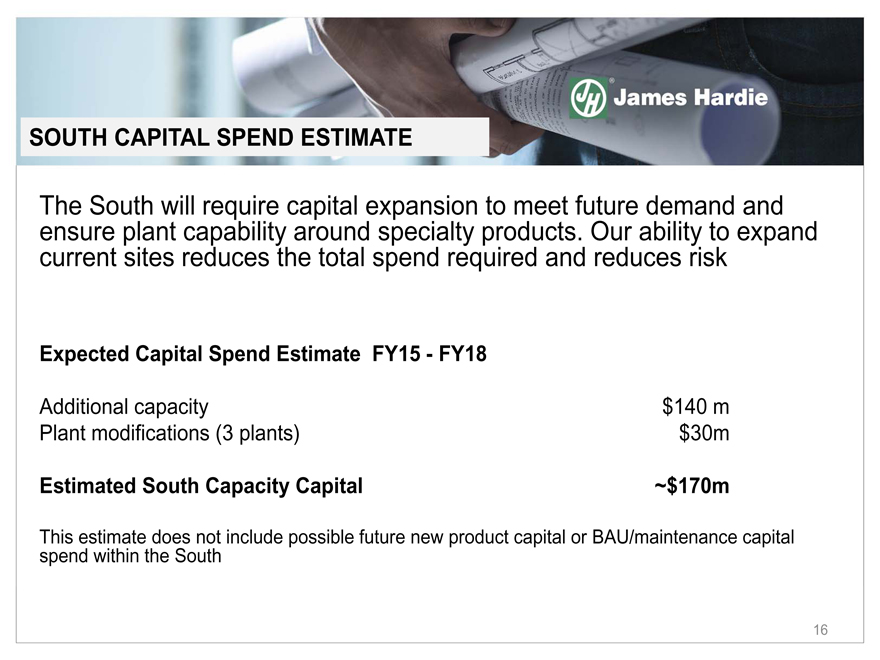
The South will require capital expansion to meet future demand and ensure plant capability around specialty products. Our ability to expand current sites reduces the total spend required and reduces risk Expected Capital Spend Estimate FY15—FY18 Additional capacity $140 m Plant modifications (3 plants) $30m Estimated South Capacity Capital ~$170m This estimate does not include possible future new product capital or BAU/maintenance capital spend within the South
SOUTH CAPITAL SPEND ESTIMATE
16
Summary Largely HZ10 prime product line Many large fiber cement standard markets Main growth opportunities in non-metro markets and accessories attachment Product mix shift will continue as business evolves
SOUTH DIVISION SUMMARY
17