 Q2
FY14 MANAGEMENT PRESENTATION 14 November 2013
Exhibit 99.4 |
| Q2
FY14 MANAGEMENT PRESENTATION 14 November 2013
Exhibit 99.4 |
 This
Management
Presentation
contains
forward-looking
statements.
James
Hardie
may
from
time
to
time
make
forward-looking
statements
in
its
periodic
reports
filed
with
or
furnished
to
the
SEC,
on
Forms
20-F
and
6-K,
in
its
annual
reports
to
shareholders,
in
offering
circulars,
invitation
memoranda
and
prospectuses,
in
media
releases
and
other
written
materials
and
in
oral
statements
made
by
the
company’s
officers,
directors
or
employees
to
analysts,
institutional
investors,
existing
and
potential
lenders,
representatives
of
the
media
and
others.
Statements
that
are
not
historical
facts
are
forward-looking
statements
and
such
forward-looking
statements
are
statements
made
pursuant
to
the
Safe
Harbor
Provisions
of
the
Private
Securities
Litigation
Reform
Act
of
1995.
Examples
of
forward-looking
statements
include:
•
statements
about
the
company’s
future
performance;
•
projections
of
the
company’s
results
of
operations
or
financial
condition;
•
statements
regarding
the
company’s
plans,
objectives
or
goals,
including
those
relating
to
strategies,
initiatives,
competition,
acquisitions,
dispositions
and/or
its
products;
•
expectations
concerning
the
costs
associated
with
the
suspension
or
closure
of
operations
at
any
of
the
company’s
plants
and
future
plans
with
respect
to
any
such
plants;
•
expectations
regarding
the
extension
or
renewal
of
the
company’s
credit
facilities
including
changes
to
terms,
covenants
or
ratios;
•
expectations
concerning
dividend
payments
and
share
buy-backs;
•
statements
concerning
the
company’s
corporate
and
tax
domiciles
and
structures
and
potential
changes
to
them,
including
potential
tax
charges;
•
statements
regarding
tax
liabilities
and
related
audits,
reviews
and
proceedings;
•
statements
as
to
the
possible
consequences
of
proceedings
brought
against
the
company
and
certain
of
its
former
directors
and
officers
by
the
Australian
Securities
and
Investments
Commission
(ASIC);
•
statements
regarding
the
possible
consequences
and/or
potential
outcome
of
the
legal
proceedings
brought
against
two
of
the
company’s
subsidiaries
by
the
New
Zealand
Ministry
of
Education
and
the
potential
product
liabilities,
if
any,
associated
with
such
proceedings;
•
expectations
about
the
timing
and
amount
of
contributions
to
Asbestos
Injuries
Compensation
Fund
(AICF),
a
special
purpose
fund
for
the
compensation
of
proven
Australian
asbestos-related
personal
injury
and
death
claims;
•
expectations
concerning
indemnification
obligations;
•
expectations
concerning
the
adequacy
of
the
company’s
warranty
provisions
and
estimates
for
future
warranty-related
costs;
•
statements
regarding
the
company’s
ability
to
manage
legal
and
regulatory
matters
(including
but
not
limited
to
product
liability,
environmental,
intellectual
property
and
competition
law
matters)
and
to
resolve
any
such
pending
legal
and
regulatory
matters
within
current
estimates
and
in
anticipation
of
certain
third-party
recoveries;
and
•
statements
about
economic
conditions,
such
as
changes
in
the
US
economic
or
housing
recovery
or
changes
in
the
market
conditions
in
the
Asia
Pacific
region,
the
levels
of
new
home
construction
and
home
renovations,
unemployment
levels,
changes
in
consumer
income,
changes
or
stability
in
housing
values,
the
availability
of
mortgages
and
other
financing,
mortgage
and
other
interest
rates,
housing
affordability
and
supply,
the
levels
of
foreclosures
and
home
resales,
currency
exchange
rates,
and
builder
and
consumer
confidence.
2
DISCLAIMER |
 Words
such
as
“believe,”
“anticipate,”
“plan,”
“expect,”
“intend,”
“target,”
“estimate,”
“project,”
“predict,”
“forecast,”
“guideline,”
“aim,”
“will,”
“should,”
“likely,”
“continue,”
“may,”
“objective,”
“outlook”
and
similar
expressions
are
intended
to
identify
forward-looking
statements
but
are
not
the
exclusive
means
of
identifying
such
statements.
Readers
are
cautioned
not
to
place
undue
reliance
on
these
forward-looking
statements
and
all
such
forward-looking
statements
are
qualified
in
their
entirety
by
reference
to
the
following
cautionary
statements.
Forward-looking
statements
are
based
on
the
company’s
current
expectations,
estimates
and
assumptions
and
because
forward-looking
statements
address
future
results,
events
and
conditions,
they,
by
their
very
nature,
involve
inherent
risks
and
uncertainties,
many
of
which
are
unforeseeable
and
beyond
the
company’s
control.
Such
known
and
unknown
risks,
uncertainties
and
other
factors
may
cause
actual
results,
performance
or
other
achievements
to
differ
materially
from
the
anticipated
results,
performance
or
achievements
expressed,
projected
or
implied
by
these
forward-looking
statements.
These
factors,
some
of
which
are
discussed
under
“Risk
Factors”
in
Section
3
of
the
Form
20-F
filed
with
the
Securities
and
Exchange
Commission
on
27
June
2013,
include,
but
are
not
limited
to:
all
matters
relating
to
or
arising
out
of
the
prior
manufacture
of
products
that
contained
asbestos
by
current
and
former
James
Hardie
subsidiaries;
required
contributions
to
AICF,
any
shortfall
in
AICF
and
the
effect
of
currency
exchange
rate
movements
on
the
amount
recorded
in
the
company’s
financial
statements
as
an
asbestos
liability;
governmental
loa
n facility
to
AICF;
compliance
with
and
changes
in
tax
laws
and
treatments;
competition
and
product
pricing
in
the
markets
in
which
the
company
operates;
the
consequences
of
product
failures
or
defects;
exposure
to
environmental,
asbestos,
putative
consumer
class
action
or
other
legal
proceedings;
general
economic
and
market
conditions;
the
supply
and
cost
of
raw
materials;
possible
increases
in
competition
and
the
potential
that
competitors
could
copy
the
company’s
products;
reliance
on
a
small
number
of
customers;
a
customer’s
inability
to
pay;
compliance
with
and
changes
in
environmental
and
health
and
safety
laws;
risks
of
conducting
business
internationally;
compliance
with
and
changes
in
laws
and
regulations;
the
effect
of
the
transfer
of
the
company’s
corporate
domicile
from
The
Netherlands
to
Ireland,
including
changes
in
corporate
governance
and
any
potential
tax
benefits
related
thereto;
currency
exchange
risks;
dependence
on
customer
preference
and
the
concentration
of
the
company’s
customer
base
on
large
format
retail
customers,
distributors
and
dealers;
dependence
on
residential
and
commercial
construction
markets;
the
effect
of
adverse
changes
in
climate
or
weather
patterns;
possible
inability
to
renew
credit
facilities
on
terms
favourable
to
the
company,
or
at
all;
acquisition
or
sale
of
businesses
and
business
segments;
changes
in
the
company’s
key
management
personnel;
inherent
limitations
on
internal
controls;
use
of
accounting
estimates;
and
all
other
risks
identified
in
the
company’s
reports
filed
with
Australian,
Irish
and
US
securities
agencies
and
exchanges
(as
appropriate).
The
company
cautions
you
that
the
foregoing
list
of
factors
is
not
exhaustive
and
that
other
risks
and
uncertainties
may
cause
actual
results
to
differ
materially
from
those
referenced
in
our
forward-looking
statements.
Forward-looking
statements
speak
only
as
of
the
date
they
are
made
and
are
statements
of
the
company’s
current
expectations
concerning
future
results,
events
and
conditions.
The
company
assumes
no
obligation
to
update
any
forward-looking
statements
or
information
except
as
required
by
law.
3
DISCLAIMER (CONTINUED) |
 •
Overview and Operating Review –
Louis Gries, CEO
•
Financial Review –
Russell Chenu, CFO
•
Questions and Answers
4
In
this
Management
Presentation,
James
Hardie
may
present
financial
measures,
sales
volume
terms,
financial
ratios,
and
Non-US
GAAP
financial
measures
included
in
the
Definitions
section
of
this
document
starting
on
page
47.
The
company
presents
financial
measures
that
it
believes
are
customarily
used
by
its
Australian
investors.
Specifically,
these
financial
measures,
which
are
equivalent
to
or
derived
from
certain
US
GAAP
measures
as
explained
in
the
definitions,
include
“EBIT”,
“EBIT
margin”,
“Operating
profit
before
income
taxes”
and
“Net
operating
profit”.
The
company
may
also
present
other
terms
for
measuring
its
sales
volumes
(“million
square
feet”
or
“mmsf”
and
“thousand
square
feet”
or
“msf”);
financial
ratios
(“Gearing
ratio”,
“Net
interest
expense
cover”,
“Net
interest
paid
cover”,
“Net
debt
payback”,
“Net
debt
(cash)”);
and
Non-US
GAAP
financial
measures
(“EBIT
excluding
asbestos,
ASIC
expenses
and
New
Zealand
product
liability
expenses”,
“EBIT
margin
excluding
asbestos,
ASIC
expenses
and
New
Zealand
product
liability
expenses”,
“Net
operating
profit
excluding
asbestos,
ASIC
expenses,
New
Zealand
product
liability
expenses
and
tax
adjustments”,
“Diluted
earnings
per
share
excluding
asbestos,
ASIC
expenses,
New
Zealand
product
liability
expenses
and
tax
adjustments”,
“Operating
profit
before
income
taxes
excluding
asbestos
and
New
Zealand
product
liability
expenses”,
“Effective
tax
rate
on
earnings
excluding
asbestos,
New
Zealand
product
liability
expenses
and
tax
adjustments”,
“Adjusted
EBITDA”,
“General
corporate
costs
excluding
ASIC
expenses,
intercompany
foreign
exchange
gain
and
recovery
of
RCI
legal
costs”
and
“Selling,
general
and
administrative
expenses
excluding
New
Zealand
product
liability
expenses”).
Unless
otherwise
stated,
results
and
comparisons
are
of
the
2
nd
quarter
and
1
st
half
of
the
current
fiscal
year
versus
the
2
nd
quarter
and
1
st
half
of
the
prior
fiscal
year.
AGENDA |
 OVERVIEW AND OPERATING REVIEW
Louis Gries, CEO |
 GROUP
OVERVIEW
6
Net operating profit reflects:
USA
and
Europe
Fibre
Cement
EBIT
margins
of
22.5%
and
22.0%
for
the
quarter
and
half
year,
respectively,
are within target EBIT margin range
1
Comparisons
are
of
the
2
nd
quarter
and
1
st
half
of
the
current
fiscal
year
versus
the
2
nd
quarter
and
1
st
half
of
the
prior
fiscal
year
1
Q2
Q2
%
HY
HY
%
FY 2014
FY 2013
Change
FY 2014
FY 2013
Change
Net operating profit
51.9
15.0
194.1
83.5
Net operating profit excluding asbestos, ASIC expenses,
New Zealand product liability expenses and tax
adjustments
56.3
38.9
45
108.3
82.7
31
Diluted earnings per share excluding asbestos, ASIC
expenses, New Zealand product liability expenses and tax
adjustments (US cents)
12.7
8.8
44
24.4
18.8
30
US$ Millions
•
Higher
sales
volumes
and
average
net
sales
price
in
the
USA
and
Europe
Fibre
Cement
business
•
Higher
sales
volumes
and
average
net
sales
price
in
the
Asia
Pacific
Fibre
Cement
business-
however,
a stronger
US
dollar
partially
offset
the
improved
financial
performance
in
local
currencies |
 7
USA and Europe Fibre Cement results reflected:
•
Higher sales volume due to increased activity in new construction
market and modest growth in R&R market
•
Higher average net sales price
2
•
Higher production costs, including higher input costs
•
Increased idle facility costs incurred on existing manufacturing
equipment in the Fontana, California plant as part of its refurbishment
•
Leveraging on prior year investment in organisational capability
1
USA AND EUROPE FIBRE CEMENT 2
nd
QUARTER SUMMARY
1
1
Comparisons
are
of
the
2
nd
quarter
of
the
current
fiscal
year
versus
the
2
nd
quarter
of
the
prior
fiscal
year
2
During
the
second
quarter
of
FY14,
the
company
refined
its
methodology
for
calculating
average
net
sales
price
in
both
the
USA
and
Europe
and
Asia
Pacific
Fibre
Cement
segments
to
exclude
ancillary
products
that
have
no
impact
on
fibre
cement
sales
volume,
which
is
measured
and
reported
in
million
square
feet
(“mmsf”).
As
the
revenue
contribution
of
these
ancillary
products
has
been
increasing,
the
company
believes
the
refined
methodology
provides
an
improved
disclosure
of
average
net
sales
price,
in
line
with
the
company’s
primary
fibre
cement
business,
which
is
a
key
segment
performance
indicator.
The
company
has
restated
average
net
sales
price
in
the
prior
periods
to
conform
with
the
current
quarter
and
half
year
calculation
of
average
net
sales
price.
Readers
are
referred
to
the
“Five
Year
Financial
Summary”
on
the
company’s
Investor
Relations
website
at
http://www.ir.jameshardie.com.au/jh/results_briefings.jsp
for
the
refined
comparative
average
net
sales
price
for
the
periods
FY2009
through
FY2013
using
this
revised
methodology |
 2nd
Quarter Result Net Sales
up
25% to US$298.7
million
Sales Volume
up
21% to 446.4 mmsf
Average Price
up
4% to US$658 per msf
EBIT
up
53% to US$67.3 million
EBIT Margin
up
4.0 pts to 22.5%
8
1
Comparisons
are
of
the
2
nd
quarter
of
the
current
fiscal
year
versus
the
2
nd
quarter
of
the
prior
fiscal
year
2
Prior
period
amounts
have
been
restated
to
conform
with
current
year
refined
methodology
for
calculating
average
net
sales
price
1
USA AND EUROPE FIBRE CEMENT
2 |
 Half
Year Result Net Sales
up
18% to US$576.8
million
Sales Volume
up
15% to 874.3 mmsf
Average Price
up
2% to US$648 per msf
EBIT
up
34% to US$126.7 million
EBIT Margin
up
2.8 pts to 22.0%
9
1
Comparisons
are
of
the
1
st
half
of
the
current
fiscal
year
versus
the
1
st
half
of
the
prior
fiscal
year
2
Prior
period
amounts
have
been
restated
to
conform
with
current
year
refined
methodology
for
calculating
average
net
sales
price
1
USA AND EUROPE FIBRE CEMENT
2 |
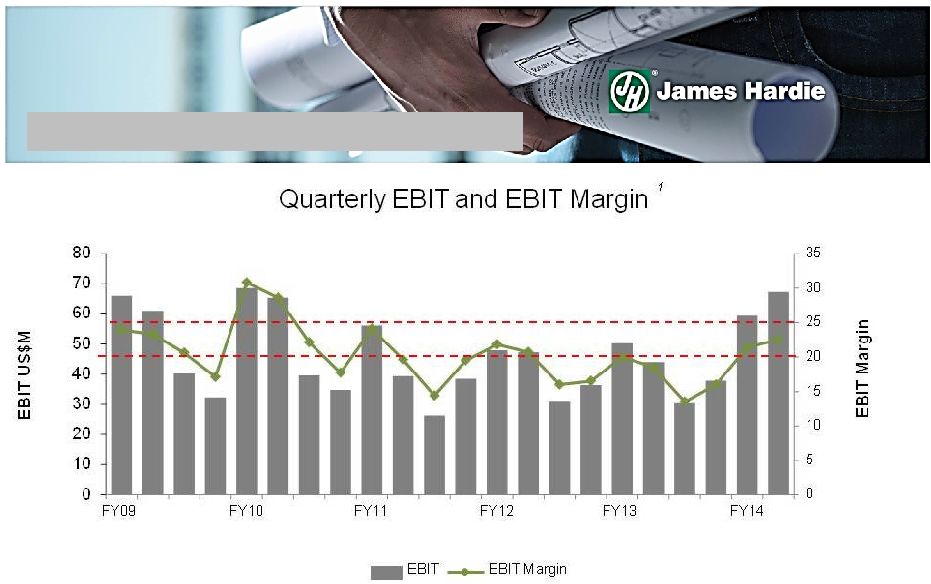 1
Excludes
asset
impairment
charges
of
US$14.3
million
in
4
th
quarter
FY12,
US$5.8
million
in
3
rd
quarter
FY13
and
US$11.1
million
in
4
th
quarter FY13
10
USA AND EUROPE FIBRE CEMENT |
 Rolling 12 month average of seasonally adjusted estimate of housing starts by US
Census Bureau 11
USA FIBRE CEMENT |
 550
590
630
670
FY09
FY10
FY11
FY12
FY13
HY FY14
12
Average Net Sales Price (US dollars)
US$648
USA AND EUROPE FIBRE CEMENT
1
Prior period amounts have been restated to conform with current year refined
methodology for calculating average net sales price 1
|
 ASIA
PACIFIC FIBRE CEMENT 2 nd
QUARTER SUMMARY
13
1
Comparisons
are
of
the
2
nd
quarter
of
the
current
fiscal
year
versus
the
2
nd
quarter
of
the
prior
fiscal
year
2
Prior period amounts have been restated to conform with current year refined
methodology for calculating average net sales price Asia Pacific Fibre Cement
results reflected: •
Higher sales volume
•
Improvement in Australia’s new residential market; however, revenue growth
constrained by decrease in the R&R market
•
Continued increase in New Zealand housing activity
•
Higher
A$
average
net
sales
price
2
•
Lower manufacturing costs
•
Depreciation of A$ against US$
1 |
 2nd
Quarter Result Net Sales
down
3% to US$93.3 million
Sales Volume
up
5% to 107.7 mmsf
Average Price
up
4% to A$933 per msf
EBIT
up
4% to US$22.1 million
A$ EBIT
up
15% to A$23.9 million
EBIT Margin
up
1.6 pts to 23.7%
14
1
Comparisons
are
of
the
2
nd
quarter
of
the
current
fiscal
year
versus
the
2
nd
quarter
of
the
prior
fiscal
year
2
Prior period amounts have been restated to conform with current year refined
methodology for calculating average net sales price 3
Excludes
New
Zealand
product
liability
expenses
of
US$0.3
million
and
US$5.7
million
in
the
2
nd
quarter
of
the
current
fiscal
year
and
2
nd
quarter of the prior fiscal year, respectively
1
3
3
ASIA PACIFIC FIBRE CEMENT
2
3 |
 Half
Year Result Net Sales
up
2% to US$187.4 million
Sales Volume
up
6% to 210.1 mmsf
Average Price
up
3% to A$924 per msf
EBIT
up
11% to US$43.2 million
A$ EBIT
up
18% to A$45.3 million
EBIT Margin
up
1.9 pts to 23.1%
15
1
Comparisons
are
of
the
1
st
half
of
the
current
fiscal
year
versus
the
1
st
half
of
the
prior
fiscal
year
2
Prior
period
amounts
have
been
restated
to
conform
with
current
year
refined
methodology
for
calculating
average
net
sales
price
3
Excludes
New
Zealand
product
liability
expenses
of
US$4.9
million
and
US$5.7
million
in
the
1
st
half
of
the
current
fiscal
year
and
1
st
half
of
the prior
fiscal
year,
respectively
1
3
3
ASIA PACIFIC FIBRE CEMENT
2
3 |
 16
USA and Europe Fibre Cement
•
The US operating environment continues to reflect an increasing number of housing
starts and improving house values
•
The company is continuing with its plan to expand capacity through new capital
investments and re- commissioning of idled facilities in future
periods •
FY14 EBIT margin is expected to be above 20%, absent major adverse external
factors Asia Pacific Fibre Cement
•
In Australia, new residential market picking up, but earnings performance expected
to be only slightly improved compared to prior year
•
In New Zealand, the housing market continues to improve, particularly in the
Auckland and Christchurch areas
•
In the Philippines, the business continues to experience steady growth in its core
market segments and is expected to deliver consistent earnings in the
remainder of the financial year GROUP OUTLOOK |
 17
Asia Pacific Fibre Cement
USA and Europe Fibre Cement
1
Nominal capacities are based on production of 5/16’’
HardieZone 10 product, without regard to actual or anticipated product mix
MANUFACTURING CAPACITY EXPANSION
•
In Q1 FY14, James Hardie acquired the previously-leased land and buildings at
its existing Carole Park (Brisbane)
plant
and
is
expanding
production
capacity
at
the
site
-
investment
of
approximately
A$89 million
•
New production capacity on-track to be fully operational in first half of
CY15 •
Production at Rosehill (NSW) and Meeandah (Queensland) sites will continue
•
Refurbishment
of
the
Fontana,
California
plant
with
investment
of
US$34
million
with
nominal
capacity
of
300
mmsf
1
remains
on
schedule
for
an
early
2014
reopening
•
A
fourth
sheet
machine
and
ancillary
facilities
at
the
Plant
City,
Florida
location
approved,
with
an
investment
of
US$65
million
with
nominal
capacity
of
240
mmsf
1
•
A
third
sheet
machine
and
ancillary
facilities
at
the
Cleburne,
Texas
location
approved,
with
an
investment
of
US$37
million
with
nominal
capacity
of
200
mmsf
1
•
Plant City and Cleburne expansions are expected to be commissioned by mid-2015
calendar year |
 FINANCIAL REVIEW
Russell Chenu, CFO |
 Overview
•
Higher sales volumes, local currency revenues, EBIT and EBIT margins in all major
business units •
Unfavourable movement in the accounting provision for legacy product liability
claims in New Zealand, resulting
in
an
expense
of
US$0.3
million
and
US$4.9
million
for
the
quarter
and
half
year,
respectively
•
Favourable asbestos adjustments of US$90.4 million during the half year as a
result of the 11% depreciation of the A$/US$ spot exchange rate at 30
September 2013 versus 31 March 2013 •
Depreciation of A$ against US$
19
FINANCIAL REVIEW
•
Earnings impacted by:
•
Increase in net operating cash flow to US$175.4 million for the current half year
compared to net cash used of US$7.8 million in the prior half year
•
Increase in net capital expenditures to US$44.0 million, including purchase of the
previously-leased land and buildings located at the Carole Park,
Brisbane plant and the refurbishment of idled manufacturing assets at the
Fontana, California plant
•
Dividends totaling US$163.6 million, representing US37.0 cents per security were
paid on 26 July 2013 from FY13 earnings
•
The company today announced an ordinary dividend of US8.0 cents per security,
reflecting increase in dividend payout ratio, effective in the current
financial year |
 20
RESULTS -
Q2
US$ Millions
Q2 '14
Q2 '13
% Change
Net sales
392.0
334.4
17
Gross profit
133.1
111.3
20
SG&A expenses
(53.8)
(56.6)
5
Research & development expenses
(7.4)
(9.5)
22
Asbestos adjustments
(4.1)
(22.4)
82
EBIT
67.8
22.8
Net interest expense
(0.4)
-
Other income
0.1
0.3
(67)
Income tax expense
(15.6)
(8.1)
Net operating profit
51.9
15.0 |
 21
1
Includes AICF SG&A expenses and AICF interest income
RESULTS -
Q2 (CONTINUED)
US$ Millions
Q2 '14
Q2 '13
% Change
Net operating profit
51.9
15.0
Asbestos:
Asbestos adjustments
4.1
22.4
(82)
Other asbestos
(0.2)
(0.7)
71
ASIC expenses
-
0.3
New Zealand product liability expenses
0.3
5.7
(95)
Asbestos and other tax adjustments
0.2
(3.8)
Net operating profit excluding asbestos, ASIC
expenses, New Zealand product liability
expenses and tax adjustments
56.3
38.9
45
1 |
 22
1
Includes AICF SG&A expenses and AICF interest income
RESULTS –
HALF YEAR
US$ Millions
HY '14
HY '13
% Change
Net sales
764.2
674.1
13
Gross profit
259.4
221.3
17
SG&A expenses
(108.7)
(100.9)
(8)
Research & development expenses
(16.4)
(17.9)
8
Asbestos adjustments
90.4
2.8
EBIT
224.7
105.3
Net interest expense (income)
(0.3)
0.2
Other income
0.2
0.7
(71)
Income tax expense
(30.5)
(22.7)
(34)
Net operating profit
194.1
83.5 |
 23
1
Includes AICF SG&A expenses and AICF interest income
RESULTS -
HALF YEAR (CONTINUED)
US$ Millions
HY '14
HY '13
% Change
Net operating profit
194.1
83.5
Asbestos:
Asbestos adjustments
(90.4)
(2.8)
Other
asbestos
1
(0.8)
(1.5)
47
ASIC expenses
-
0.4
New Zealand product liability expenses
4.9
5.7
(14)
Asbestos and other tax adjustments
0.5
(2.6)
Net operating profit excluding asbestos, ASIC
expenses, New Zealand product liability
expenses and tax adjustments
108.3
82.7
31
Diluted earnings per share excluding asbestos,
ASIC expenses, New Zealand product liability
expenses and tax adjustments (US cents)
24.4
18.8
30
Ordinary dividend declared (US cents)
8.0
5.0
60 |
 1
Research and development expenses include costs associated with research projects
that are designed to benefit all business units. These costs are recorded in
the Research and Development segment rather than attributed to individual business units
2
Refer slide 43 for further information
24
SEGMENT EBIT –
Q2
US$ Millions
Q2 '14
Q2 '13
% Change
USA and Europe Fibre Cement
67.3
44.0
53
Asia Pacific Fibre Cement, excluding New Zealand
product liability expenses
22.1
21.3
4
Research
&
Development
1
(5.5)
(6.3)
13
Total segment EBIT excluding New Zealand
product liability expenses
83.9
59.0
42
General corporate costs excluding asbestos and
ASIC
expenses
2
(11.2)
(7.4)
(51)
Total EBIT excluding asbestos, ASIC expenses
and New Zealand product liability expenses
72.7
51.6
41
Asbestos adjustments
(4.1)
(22.4)
82
AICF SG&A expenses
(0.5)
(0.4)
(25)
ASIC expenses
-
(0.3)
New Zealand product liability expenses
(0.3)
(5.7)
95
Total EBIT
67.8
22.8 |
 1
Research and development expenses include costs associated with research projects
that are designed to benefit all business units. These costs are recorded in
the Research and Development segment rather than attributed to individual business units
2
Refer slide 44 for further information
25
SEGMENT EBIT –
HALF YEAR
US$ Millions
HY '14
HY '13
% Change
USA and Europe Fibre Cement
126.7
94.3
34
Asia Pacific Fibre Cement, excluding New Zealand
product liability expenses
43.2
39.0
11
Research & Development
(11.6)
(12.3)
6
Total segment EBIT excluding New Zealand
product liability expenses
158.3
121.0
31
General corporate costs excluding asbestos and
ASIC expenses
(18.1)
(11.7)
(55)
Total EBIT excluding asbestos, ASIC expenses
and New Zealand product liability expenses
140.2
109.3
28
Asbestos adjustments
90.4
2.8
AICF SG&A expenses
(1.0)
(0.7)
(43)
ASIC expenses
-
(0.4)
New Zealand product liaiblity expenses
(4.9)
(5.7)
14
Total EBIT
224.7
105.3
2
1 |
 •
Unfavourable
impact
from
translation
of
Asia
Pacific
results
–
Q2
FY14
vs
Q2
FY13
•
Favourable
impact
on
corporate
costs
incurred
in
Australian
dollars
–
Q2
FY14
vs
Q2 FY13
•
Favourable
impact
from
translation
of
asbestos
liability
balance
–
30
September
2013
vs
31
March
2013
26
Earnings
Balance Sheet
N/A
N/A
CHANGES IN A$ VERSUS US$ |
 27
1
Includes AICF SG&A expenses and AICF interest income
INCOME TAX EXPENSE –
Q2
US$ Millions
Operating profit before income taxes
67.5
23.1
Asbestos:
Asbestos adjustments
4.1
22.4
Other asbestos
1
(0.2)
(0.7)
New Zealand product liability expenses
0.3
5.7
Operating profit before income taxes excluding asbestos
and New Zealand product liability expenses
71.7
50.5
Income tax expense
(15.6)
(8.1)
Asbestos and other tax adjustments
0.2
(3.8)
Income tax expense excluding tax adjustments
(15.4)
(11.9)
Effective tax rate excluding asbestos, New Zealand
product liability expenses and tax adjustments
21.5%
23.6%
Q2 '14
Q2 '13 |
 28
1
Includes AICF SG&A expenses and AICF interest income
INCOME TAX EXPENSE –
HALF YEAR
US$ Millions
HY '14
HY '13
Operating profit before income taxes
224.6
106.2
Asbestos:
Asbestos adjustments
(90.4)
(2.8)
Other asbestos
(0.8)
(1.5)
New Zealand product liability expenses
4.9
5.7
Operating profit before income taxes excluding asbestos
and New Zealand product liability expenses
138.3
107.6
Income tax expense
(30.5)
(22.7)
Asbestos and other tax adjustments
0.5
(2.6)
Income tax expense excluding tax adjustments
(30.0)
(25.3)
Effective tax rate excluding asbestos, New Zealand
product liability expenses and tax adjustments
21.7%
23.5%
1 |
 29
1
Certain reclassifications have been reflected in the prior period to conform with
current period presentation CASHFLOW
1
US$ Millions
HY '14
HY '13
EBIT
224.7
105.3
Non-cash items:
Asbestos adjustments
(90.4)
(2.8)
Other non-cash items
33.4
30.5
Net working capital movements
31.4
(8.2)
Cash Generated By Trading Activities
199.1
124.8
Tax payments, net
(12.3)
(84.9)
Change in other non-trading assets and liabilities
(7.9)
137.6
Change in asbestos-related assets & liabilities
(1.7)
1.1
Payment to the AICF
-
(184.1)
Interest paid
(1.8)
(2.3)
Net Operating Cash Flow
175.4
(7.8)
Purchases of property, plant & equipment
(44.5)
(25.5)
Proceeds from sale of property, plant & equipment
0.5
0.1
Common stock repurchased and retired
(1.8)
-
Dividends paid
(163.6)
(166.4)
Proceeds from issuance of shares
6.5
12.4
Tax benefit from stock options exercised
0.3
-
Effect of exchange rate on cash
0.1
(0.9)
Movement In Net Cash
(27.1)
(188.1)
Beginning Net Cash
153.7
265.4
Ending Net Cash
126.6
77.3 |
 30
•
In Q1 FY14, the company completed the purchase of the previously-leased land
and buildings at Carole Park, Brisbane plant and commenced projects to
increase the plant’s production capacity •
Refurbishment
of
Fontana,
California
plant
at
cost
of
US$34
million
remains
on
schedule
and
is
expected
to
reopen
in
early
calendar
year
2014
•
As
announced
today,
the
company
expects
to
invest
approximately
US$100
million
on
manufacturing
capacity
expansion
projects
at
the
Cleburne,
Texas
and
Plant
City,
Florida
plants
during
the
remainder
of
FY14
and
FY15
•
Further capacity expansion options in the US being evaluated
CAPITAL EXPENDITURE
US$ Millions
HY '14
HY '13
% Change
USA and Europe Fibre Cement (including
Research and Development)
23.0
20.9
10
Asia Pacific Fibre Cement
21.5
4.6
Total
44.5
25.5
75 |
 •
On 14 November 2013, the company announced an ordinary dividend of US8.0 cents per
security, up from US5.0 cents per security in the prior corresponding half
year. The dividend was declared in US currency and will be paid on 28 March
2014, with a record date of 19 December 2013
•
Effective
from
and
including
FY14,
dividend
payout
ratio
increased
from
between
30%
and
50%
to
between
50%
and
70%
of
annual
NPAT
excluding
asbestos
adjustments
•
An
ordinary
dividend
of
US13.0
cents
per
security
and
a
special
dividend
of
US24.0
cents per
security
were
paid
on
26
July
2013
from
FY13
earnings.
Total
dividend
paid
was
US$163.6
million
•
In May 2013, the company announced a new share buyback program to acquire up to 5%
of its issued capital during the following 12 months
•
On 31 July 2013, the company repurchased 221,000 shares of its common stock, at
cost of A$2.0 million (US$1.8 million), at an average market price of A$9.02
(US$8.20) 31
CAPITAL MANAGEMENT AND DIVIDENDS |
 32
•
At 30 September 2013:
DEBT
•
Weighted
average
remaining
term
of
debt
facilities
was
2.6
years
at
30
September
2013,
down
from
3.1
years
at 31 March 2013
•
James
Hardie
remains
well
within
its
financial
debt
covenants
•
Net
cash
of
US$126.6
million
compared
to
net
cash
of
US$153.7
million
at
31
March
2013
US$ Millions
Total facilities
405.0
Gross debt
-
Cash
126.6
Net cash
126.6
Unutilised facilities and cash
531.6 |
 33
New Zealand Product Liability claims:
•
Since FY02 James Hardie NZ subsidiaries have been joined to product liability
claims that relate to buildings primarily constructed from 1998 to
2004 •
These claims often involve multiple parties and allege losses due to excessive
moisture penetration New Zealand Ministry of Education (MOE) representative
action: •
On
16
April
2013,
the
MOE
filed
a
‘representative
action’
against
two
James
Hardie
NZ subsidiaries
and other parties
At 30 September 2013 and 31 March 2013, the total provision for these matters
collectively, net of estimated third-party recoveries was US$20.4
million and US$15.2 million, respectively Q2
FY14
and
half
year
FY14
expense
for
these
matters
collectively,
of
US$0.3
million
and
US$4.9
million,
primarily
reflect
adverse
movements
in
provisions
for
existing
claims
during
each
respective period
NZ PRODUCT LIABILITY CLAIMS AND NZ MOE REPRESENTATIVE ACTION |
 34
ASBESTOS FUND –
PROFORMA (UNAUDITED)
•
Year to date claims experience of liable entities is adverse relative to the 31
March 2013 actuarial forecast for FY2014 and relative to the prior
corresponding period. Specifically, both primary claims and
cross-claims (from other defendants) are tracking higher for mesothelioma
•
Readers are referred to Note 7 of the company’s 30 September 2013 Condensed
Consolidated Financial Statements for further information on asbestos
claims experience A$ millions
AICF cash and investments -
31 March 2013
128.1
Insurance and cross-claim recoveries
15.2
Interest and investment income
1.9
Claims paid
(72.8)
Operating costs
(2.1)
Other
1.8
AICF cash and investments -
30 September 2013
72.1 |
 35
•
Net operating profit excluding asbestos, ASIC expenses, New Zealand product
liability expenses and tax adjustments was US$56.3 million and US$108.3
million, for the quarter and half year, respectively
•
The
2
nd
quarter
results
reflected:
•
Improved sales volumes and higher average net sales prices in both the USA and
Europe and the Asia Pacific Fibre Cement segments
•
Higher EBIT margins, with USA and Europe Fibre Cement up 4.0 percentage points to
22.5% and Asia Pacific Fibre Cement EBIT margin excluding New Zealand
product liability expenses up 1.6 percentage points to 23.7%
•
Ongoing investment in the refurbishment and re-commissioning of the Fontana,
California plant which remains scheduled to reopen in early calendar year
2014 •
Ongoing investment in increasing plant capacity at the Carole Park, Brisbane
plant •
Additional manufacturing expansion projects announced at the Cleburne, Texas and
Plant City, Florida plants
•
Dividends of US$163.6 million paid July 2013
•
First half dividend of 8.0 cents per share and increase in dividend payout ratio,
effective current financial year
SUMMARY |
 36
•
Management notes the range of analysts’
forecasts for net operating profit excluding asbestos
for
the
year
ending
31
March
2014
is
between
US$164
million
and
US$181
million
1
•
Management expects full year earnings excluding asbestos, asset impairments, ASIC
expenses, New Zealand product liability expenses and tax adjustments to
be between US$180 million and
US$195 million
•
Guidance is dependent on, among other things, housing industry conditions in the
US continuing to improve and an average exchange rate of approximately
US$0.93/A$1.00 applies for the balance of the year ending 31 March
2014 •
Although US housing activity has been improving for some time, market conditions
remain somewhat uncertain and some input costs remain volatile
•
Management is unable to forecast the comparable US GAAP financial measure due to
uncertainty regarding the impact of actuarial estimates on
asbestos-related assets and liabilities in future periods
FY2014 GUIDANCE
1
Analysts’
forecasts as of 6 November 2013 |
 QUESTIONS |
 APPENDIX |
 39
1
Asia Pacific Fibre Cement EBIT excludes New Zealand product liability expenses of
US$0.3 million and US$5.7 million in Q2 ‘14 and Q2 ‘13, respectively and US$4.9
million and US$5.7 million in HY ’14 and HY ‘13 , respectively
FINANCIAL SUMMARY
US$ Millions
% Change
% Change
Net Sales
USA and Europe Fibre Cement
298.7
$
238.1
$
25
576.8
$
490.1
$
18
Asia Pacific Fibre Cement
93.3
96.3
(3)
187.4
184.0
2
Total Net Sales
392.0
$
334.4
$
17
764.2
$
674.1
$
13
EBIT -
US$ Millions
USA and Europe Fibre Cement
67.3
$
44.0
$
53
126.7
$
94.3
$
34
Asia Pacific Fibre Cement
22.1
21.3
4
43.2
39.0
11
Research & Development
(5.5)
(6.3)
13
(11.6)
(12.3)
6
General corporate costs excluding
asbestos and ASIC expenses
(11.2)
(7.4)
(51)
(18.1)
(11.7)
(55)
Total EBIT excluding asbestos, ASIC
expenses and New Zealand product
liability expenses
72.7
$
51.6
$
41
140.2
$
109.3
$
28
Net interest expense excluding AICF
interest income
(1.1)
(1.1)
(2.1)
(2.0)
(5)
Other income
0.1
0.3
(67)
0.2
0.7
(71)
Income tax expense excluding tax
adjustments
(15.4)
(11.9)
(29)
(30.0)
(25.3)
(19)
Net operating profit excluding
asbestos, ASIC expenses, New
Zealand product liability expenses
and tax adjustments
56.3
$
38.9
$
45
108.3
$
82.7
$
31
Q2 '14
Q2 '13
HY '14
HY '13 |
 1
Excludes
asbestos
adjustments,
AICF
SG&A
expenses,
AICF
interest
income,
tax
expense
related
to
asbestos
adjustments,
ASIC
expenses,
New
Zealand
product
liability
expenses
and
tax
adjustments
2
Excludes
asbestos
adjustments,
AICF
SG&A
expenses,
New
Zealand
product
liability
expenses
and
ASIC
expenses
40
KEY RATIOS
HY '14
HY '13
HY '12
EPS (Diluted)
24.4c
18.8c
18.5c
EBIT/ Sales (EBIT margin)
18.3%
16.2%
17.9%
Gearing Ratio
(9.5)%
(6.4)%
2.7%
Net Interest Expense Cover
66.8x
54.7x
32.0x
Net Interest Paid Cover
77.9x
109.3x
30.3x
Net Debt Payback
-
-
0.2yrs
1
2
1
2
2 |
 41
1
Excludes New Zealand product liability expenses of US$0.3 million and US$5.7
million in Q2 FY14 and Q2 FY13, respectively EBITDA –
Q2
US$ Millions
Q2 '14
Q2 '13
% Change
EBIT
USA and Europe Fibre Cement
67.3
44.0
53
Asia
Pacific
Fibre
Cement
1
22.1
21.3
4
Research & Development
(5.5)
(6.3)
13
General corporate excluding asbestos and ASIC expenses
(11.2)
(7.4)
(51)
Depreciation and Amortisation
USA and Europe Fibre Cement
13.2
12.0
10
Asia Pacific Fibre Cement
2.0
2.7
(26)
Total EBITDA excluding asbestos, ASIC expenses and
New Zealand product liability expenses
87.9
66.3
33
Asbestos adjustments
(4.1)
(22.4)
82
AICF SG&A expenses
(0.5)
(0.4)
(25)
ASIC expenses
-
(0.3)
New Zealand product liability expenses
(0.3)
(5.7)
95
Total EBITDA
83.0
37.5 |
 42
1
Excludes New Zealand product liability expenses of US$4.9 million and US$5.7
million in HY ’14 and HY ‘13, respectively EBITDA –
HALF YEAR
US$ Millions
HY '14
HY '13
% Change
EBIT
USA and Europe Fibre Cement
126.7
94.3
34
Asia Pacific Fibre Cement
43.2
39.0
11
Research & Development
(11.6)
(12.3)
6
General corporate excluding asbestos and ASIC expenses
(18.1)
(11.7)
(55)
Depreciation and Amortisation
USA and Europe Fibre Cement
26.6
25.3
5
Asia Pacific Fibre Cement
4.0
4.8
(17)
Total EBITDA excluding asbestos, ASIC expenses and
New Zealand product liability expenses
170.8
139.4
23
Asbestos adjustments
90.4
2.8
AICF SG&A expenses
(1.0)
(0.7)
(43)
ASIC expenses
-
(0.4)
New Zealand product liability expenses
(4.9)
(5.7)
14
Total EBITDA
255.3
135.4
89
1 |
 43
GENERAL CORPORATE COSTS –
Q2
US$ Millions
% Change
Stock compensation expense
3.4
3.0
(13)
Other costs
7.8
7.1
(10)
General corporate costs excluding ASIC
expenses and recovery of RCI legal costs
11.2
10.1
(11)
ASIC expenses
-
0.3
Recovery of RCI legal costs
-
(2.7)
General corporate costs
11.2
7.7
(45)
Q2 '14
Q2 '13 |
 44
GENERAL CORPORATE COSTS –
HALF YEAR
US$ Millions
HY '14
HY '13
% Change
Stock compensation expense
3.7
5.6
34
Other costs
14.4
14.3
(1)
General corporate costs excluding ASIC
expenses, intercompany foreign exchange
gain and recovery of RCI legal costs
18.1
19.9
9
ASIC expenses
-
0.4
Recovery of RCI legal costs
-
(2.7)
Intercompany foreign exchange gain
-
(5.5)
General corporate costs
18.1
12.1
(50) |
 45
NET INTEREST (EXPENSE) INCOME
US$ Millions
Q2 '14
Q2 '13
HY '14
HY '13
Gross interest expense
(1.0)
(0.8)
(2.0)
(1.6)
Interest income
0.1
0.2
0.2
0.6
Realised loss on interest rate swaps
(0.2)
(0.5)
(0.3)
(1.0)
Net interest expense excluding AICF interest income
(1.1)
(1.1)
(2.1)
(2.0)
AICF interest income
0.7
1.1
1.8
2.2
Net interest (expense) income
(0.4)
-
(0.3)
0.2 |
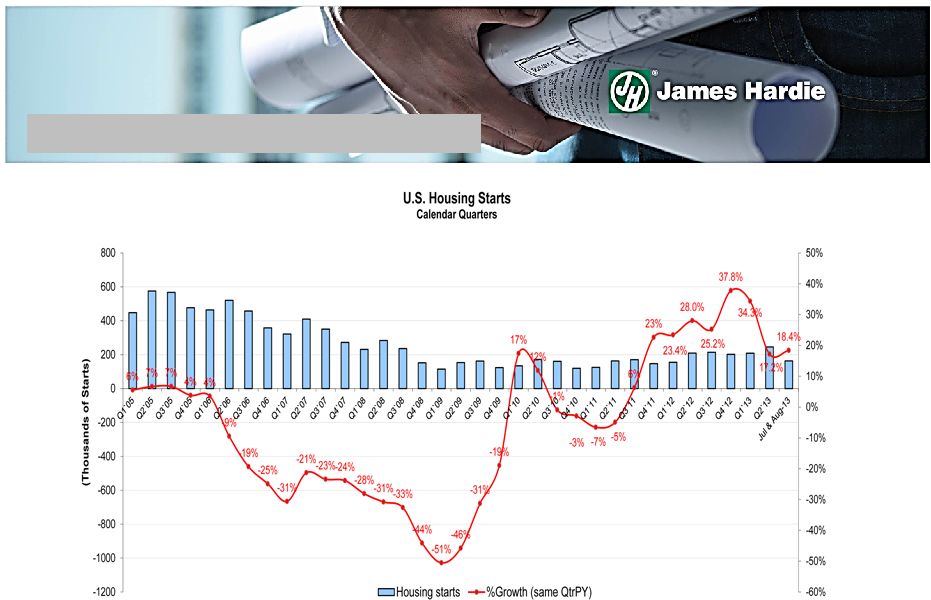 46
TOTAL US HOUSING STARTS |
 This
Management
Presentation
forms
part
of
a
package
of
information
about
the
company’s
results.
It
should
be
read
in
conjunction
with
the
other
parts
of
this
package,
including
the
Management’s
Analysis
of
Results,
Media
Release
and
Condensed
Consolidated
Financial Statements
Definitions
Non-financial Terms
ABS
–
Australian Bureau of Statistics
AFFA
–
Amended and Restated Final Funding Agreement
AICF
–
Asbestos Injuries Compensation Fund Ltd
ASIC
–
Australian Securities and Investments Commission
ATO
–
Australian Taxation Office
NBSK –
Northern Bleached Soft Kraft; the company's benchmark grade of pulp
Legacy
New
Zealand
product
liability
expenses
(“New
Zealand
product
liability
expenses”)
–
Expenses
arising
from
defending
and
resolving
claims
in
New
Zealand
that
allege
poor
building
design,
inadequate
certification
of
plans,
inadequate
construction
review
and
compliance
certification
and
deficient
work
by
sub-contractors
47
ENDNOTES |
 Financial Measures –
US GAAP equivalents
This
document
contains
financial
statement
line
item
descriptions
that
are
considered
to
be
non-US
GAAP,
but
are
consistent
with
those
used
by
Australian
companies.
Because
the
company
prepares
its
consolidated
financial
statements
under
US
GAAP,
the
following
table
cross-references
each
non-US
GAAP
line
item
description,
as
used
in
Management’s
Analysis
of
Results
and
Media
Release,
to
the
equivalent
US
GAAP
financial
statement
line
item
description
used
in
the
company’s
condensed
consolidated
financial statements:
48
Management's Analysis of Results and
Consolidated Statements of Operations
Media Release
and Other Comprehensive Income (Loss)
(US GAAP)
Net sales
Net sales
Cost of goods sold
Cost of goods sold
Gross profit
Gross profit
Selling, general and administrative expenses
Selling, general and administrative expenses
Research and development expenses
Research and development expenses
Asbestos adjustments
Asbestos adjustments
EBIT
*
Operating income (loss)
Net interest income (expense)*
Sum of interest expense and interest income
Other income (expense)
Other income (expense)
Operating profit (loss) before income taxes*
Income (loss) before income taxes
Income tax (expense) benefit
Income tax (expense) benefit
Net operating profit (loss)*
Net income (loss)
*- Represents non-U.S. GAAP descriptions used by Australian companies.
ENDNOTES (CONTINUED) |
 EBIT
margin
–
EBIT
margin
is
defined
as
EBIT
as
a
percentage
of
net
sales.
Sales Volumes
mmsf
–
million
square
feet,
where
a
square
foot
is
defined
as
a
standard
square
foot
of
5/16”
thickness
msf
–
thousand
square
feet,
where
a
square
foot
is
defined
as
a
standard
square
foot
of
5/16”
thickness
Financial Ratios
Gearing
Ratio
–
Net
debt
(cash)
divided
by
net
debt
(cash)
plus
shareholders’
equity
Net
interest
expense
cover
–
EBIT
divided
by
net
interest
expense
(excluding
loan
establishment
fees)
Net
interest
paid
cover
–
EBIT
divided
by
cash
paid
during
the
period
for
interest,
net
of
amounts
capitalised
Net
debt
payback
–
Net
debt
(cash)
divided
by
cash
flow
from
operations
Net
debt
(cash)
–
Short-term
and
long-term
debt
less
cash
and
cash
equivalents
Return
on
Capital
employed
–
EBIT
divided
by
gross
capital
employed
49
ENDNOTES (CONTINUED) |
 EBIT
and
EBIT
margin
excluding
asbestos,
ASIC
expenses
and
New
Zealand
product
liability
expenses
–
EBIT
and
EBIT
margin
excluding
asbestos,
ASIC
expenses
and
New
Zealand
product
liability
expenses
are
not
measures
of
financial
performance
under
US
GAAP
and
should
not
be
considered
to
be
more
meaningful
than
EBIT
and
EBIT
margin.
Management
has
included
these
financial
measures
to
provide
investors
with
an
alternative
method
for
assessing
its
operating
results
in
a
manner
that
is
focussed
on
the
performance
of
its
ongoing
operations
and
provides
useful
information
regarding
its
financial
condition
and
results
of
operations.
Management
uses
these
non-US
GAAP
measures
for
the
same
purposes
50
NON-US GAAP FINANCIAL MEASURES
Q2
Q2
HY
HY
US$ Millions
FY 2014
FY 2013
FY 2014
FY 2013
EBIT
$ 67.8
$ 22.8
$ 224.7
$ 105.3
Asbestos:
Asbestos adjustments
4.1
22.4
(90.4)
(2.8)
AICF SG&A expenses
0.5
0.4
1.0
0.7
ASIC expenses
-
0.3
-
0.4
New Zealand product liability expenses
0.3
5.7
4.9
5.7
EBIT excluding asbestos, ASIC expenses and New
Zealand product liability expenses
72.7
51.6
140.2
109.3
Net sales
$ 392.0
$ 334.4
$ 764.2
$ 674.1
EBIT margin excluding asbestos, ASIC expenses
and New Zealand product liability expenses
18.5%
15.4%
18.3%
16.2% |
 Net
operating
profit
excluding
asbestos,
ASIC
expenses,
New
Zealand
product
liability
expenses
and
tax
adjustments
–
Net
operating
profit
excluding
asbestos,
ASIC
expenses,
New
Zealand
product
liability
expenses
and
tax
adjustments
is
not
a
measure
of
financial
performance
under
US
GAAP
and
should
not
be
considered
to
be
more
meaningful
than
net
operating
profit.
Management
has
included
this
financial
measure
to
provide
investors
with
an
alternative
method
for
assessing
its
operating
results
in
a
manner
that
is
focussed
on
the
performance
of
its
ongoing
operations.
Management
uses
this
non-US
GAAP
measure
for
the
same
purposes
51
NON-US GAAP FINANCIAL MEASURES (CONTINUED)
Q2
Q2
HY
HY
US$ Millions
FY 2014
FY 2013
FY 2014
FY 2013
Net operating profit
$ 51.9
$ 15.0
$ 194.1
$ 83.5
Asbestos:
Asbestos adjustments
4.1
22.4
(90.4)
(2.8)
AICF SG&A expenses
0.5
0.4
1.0
0.7
AICF interest income
(0.7)
(1.1)
(1.8)
(2.2)
ASIC expenses
-
0.3
-
0.4
New Zealand product liability expenses
0.3
5.7
4.9
5.7
Asbestos and other tax adjustments
0.2
(3.8)
0.5
(2.6)
Net operating profit excluding asbestos, ASIC
expenses, New Zealand product liability
expenses and tax adjustments
$ 56.3
$ 38.9
$ 108.3
$ 82.7 |
 Diluted
earnings
per
share
excluding
asbestos,
ASIC
expenses,
New
Zealand
product
liability
expenses
and
tax
adjustments
–
Diluted
earnings
per
share
excluding
asbestos,
ASIC
expenses,
New
Zealand
product
liability
expenses
and
tax
adjustments
is
not
a
measure
of
financial
performance
under
US
GAAP
and
should
not
be
considered
to
be
more
meaningful
than
diluted
earnings
per
share.
Management
has
included
this
financial
measure
to
provide
investors
with
an
alternative
method
for
assessing
its
operating
results
in
a
manner
that
is
focussed
on
the
performance
of
its
ongoing
operations.
Management
uses
this
non-US
GAAP
measure
for
the
same
purposes
52
NON-US GAAP FINANCIAL MEASURES (CONTINUED)
Q2
Q2
HY
HY
US$ Millions
FY 2014
FY 2013
FY 2014
FY 2013
Net operating profit excluding asbestos, ASIC
expenses, New Zealand product liability
expenses and tax adjustments
$ 56.3
$ 38.9
$ 108.3
$ 82.7
Weighted average common shares outstanding -
Diluted (millions)
443.5
439.7
443.2
439.3
Diluted earnings per share excluding asbestos,
ASIC expenses, New Zealand product liability
expenses and tax adjustments (US cents)
12.7
8.8
24.4
18.8 |
 Effective
tax
rate
excluding
asbestos,
New
Zealand
product
liability
expenses
and
tax
adjustments
–
Effective
tax
rate
on
earnings
excluding
asbestos,
New
Zealand
product
liability
expenses
and
tax
adjustments
is
not
a
measure
of
financial
performance
under
US
GAAP
and
should
not
be
considered
to
be
more
meaningful
than
effective
tax
rate.
Management
has
included
this
financial
measure
to
provide
investors
with
an
alternative
method
for
assessing
its
operating
results
in
a
manner
that
is
focussed
on
the
performance
of
its
ongoing
operations.
Management
uses
this
non-US
GAAP
measure
for
the
same
purposes
53
NON-US GAAP FINANCIAL MEASURES (CONTINUED)
Q2
Q2
HY
HY
US$ Millions
FY 2014
FY 2013
FY 2014
FY 2013
Operating profit before income taxes
$ 67.5
$ 23.1
$ 224.6
$ 106.2
Asbestos:
Asbestos adjustments
4.1
22.4
(90.4)
(2.8)
AICF SG&A expenses
0.5
0.4
1.0
0.7
AICF interest income
(0.7)
(1.1)
(1.8)
(2.2)
New Zealand product liability expenses
0.3
5.7
4.9
5.7
Operating profit before income taxes excluding asbestos
and New Zealand product liability expenses
$ 71.7
$ 50.5
$ 138.3
$ 107.6
Income tax expense
(15.6)
(8.1)
(30.5)
(22.7)
Asbestos and other tax adjustments
0.2
(3.8)
0.5
(2.6)
Income tax expense excluding tax adjustments
(15.4)
(11.9)
(30.0)
(25.3)
Effective tax rate
23.1%
35.1%
13.6%
21.4%
Effective tax rate excluding asbestos, New Zealand
Product
liability expenses and tax adjustments
21.5%
23.6%
21.7%
23.5% |
 Adjusted
EBITDA
–
is
not
a
measure
of
financial
performance
under
US
GAAP
and
should
not
be
considered
an
alternative
to,
or
more
meaningful
than,
income
from
operations,
net
income
or
cash
flows
as
defined
by
US
GAAP
or
as
a
measure
of
profitability
or
liquidity.
Not
all
companies
calculate
Adjusted
EBITDA
in
the
same
manner
as
James
Hardie
has
and,
accordingly,
Adjusted
EBITDA
may
not
be
comparable
with
other
companies.
Management
has
included
information
concerning
Adjusted
EBITDA
because
it
believes
that
this
data
is
commonly
used
by
investors
to
evaluate
the
ability
of
a
company’s
earnings
from
its
core
business
operations
to
satisfy
its
debt,
capital
expenditure
and
working
capital
requirements
54
NON-US GAAP FINANCIAL MEASURES (CONTINUED)
Q2
Q2
HY
HY
US$ Millions
FY 2014
FY 2013
FY 2014
FY 2013
EBIT
$ 67.8
$ 22.8
$ 224.7
$ 105.3
Depreciation and amortisation
15.2
14.7
30.6
30.1
Adjusted EBITDA
$ 83.0
$ 37.5
$ 255.3
$ 135.4 |
 General
corporate
costs
excluding
ASIC
expenses,
intercompany
foreign
exchange
gain
and
recovery
of
RCI
legal
costs
–
General
corporate
costs
excluding
ASIC
expenses,
intercompany
foreign
exchange
gain
and
recovery
of
RCI
legal
costs
is
not
a
measure
of
financial
performance
under
US
GAAP
and
should
not
be
considered
to
be
more
meaningful
than
general
corporate
costs.
Management
has
included
these
financial
measures
to
provide
investors
with
an
alternative
method
for
assessing
its
operating
results
in
a
manner
that
is
focussed
on
the
performance
of
its
ongoing
operations
and
provides
useful
information
regarding
its
financial
condition
and
results
of
operations.
Management
uses
these
non-US
GAAP
measures
for
the
same
purposes
55
NON-US GAAP FINANCIAL MEASURES (CONTINUED)
Q2
HY
HY
US$ Millions
FY 2013
FY 2013
General corporate costs
$ 11.2
$ 7.7
$ 18.1
$ 12.1
Excluding:
ASIC expenses
-
(0.3)
-
(0.4)
Intercompany foreign exchange gain
-
-
-
5.5
Recovery of RCI legal costs
-
2.7
-
2.7
General corporate costs excluding ASIC
expenses, intercompany foreign exchange
gain and recovery of RCI legal costs
$ 11.2
$ 10.1
$ 18.1
$ 19.9
Q2
FY 2014
FY 2014 |
 Selling,
general
and
administrative
expenses
excluding
New
Zealand
product
liability
expenses
–
Selling,
general
and
administrative
expenses
excluding
New
Zealand
product
liability
expenses
is
not
a
measure
of
financial
performance
under
US
GAAP
and
should
not
be
considered
to
be
more
meaningful
than
selling,
general
and
administrative
expenses.
Management
has
included
these
financial
measures
to
provide
investors
with
an
alternative
method
for
assessing
its
operating
results
in
a
manner
that
is
focussed
on
the
performance
of
its
ongoing
operations
and
provides
useful
information
regarding
its
financial
condition
and
results
of
operations.
Management
uses
these
non-US
GAAP
measures
for
the
same
purposes
56
NON-US GAAP FINANCIAL MEASURES (CONTINUED)
Q2
HY
HY
US$ Millions
FY 2013
FY 2013
Selling, general and administrative expenses
$ 53.8
$ 56.6
$ 108.7
$ 100.9
Excluding:
New Zealand product liability expenses
(0.3)
(5.7)
(4.9)
(5.7)
Selling, general and administrative expenses
excluding New Zealand product liability expenses
$ 53.5
$ 50.9
$ 103.8
$ 95.2
Net Sales
$ 392.0
$ 334.4
$ 764.2
$ 674.1
Selling, general and administrative expenses as a
percentage of net sales
13.7%
16.9%
14.2%
15.0%
Selling, general and administrative expenses
excluding New Zealand product liability expenses as
a percentage of net sales
13.6%
15.2%
13.6%
14.1%
Q2
FY 2014
FY 2014 |
 Q2
FY14 MANAGEMENT PRESENTATION 14 November 2013 |