 INVESTOR PRESENTATION
March 2014
Exhibit 99.1 |
| INVESTOR PRESENTATION
March 2014
Exhibit 99.1 |
 2
DISCLAIMER
This Management Presentation contains forward-looking statements. James Hardie may from
time to time make forward-looking statements in its periodic reports filed with or
furnished to the SEC, on Forms 20-F and 6-K, in its annual reports to shareholders,
in offering circulars, invitation memoranda and prospectuses, in media releases and other
written materials and in oral statements made by the company's officers, directors or
employees to analysts, institutional investors, existing and potential lenders, representatives
of the media and others. Statements that are not historical facts are forward-looking
statements and such forward-looking statements are statements made pursuant to the Safe
Harbor Provisions of the Private Securities Litigation Reform Act of 1995.
Examples of forward-looking statements include:
•
statements about the company's future performance;
•
projections of the company's results of operations or financial condition;
•
statements regarding the company's plans with respect to the introduction of new products,
product lines and businesses; •
statements regarding the company's plans, objectives or goals, including those relating to
strategies, initiatives, competition, acquisitions, dispositions and/or its
products;
•
expectations concerning the costs associated with the suspension, closure, opening or
expansion of operations at any of the company's plants and future plans with respect
to any such plants; •
expectations regarding the extension or renewal of the company's credit facilities
including changes to terms, covenants or ratios; •
expectations concerning dividend payments and share buy-backs;
•
statements concerning the company's corporate and tax domiciles and structures and
potential changes to them, including potential tax charges; •
statements regarding tax liabilities and related audits, reviews and proceedings;
•
statements as to the possible consequences of proceedings brought against the Company and
certain of its former directors and officers by the Australian Securities and
Investments Commission (ASIC); •
statements regarding the possible consequences, value, impact or effect of the Settlement
Deed resolving the legal proceedings brought by the New Zealand Ministry of
Education against two of the company's New Zealand subsidiaries; •
expectations about the timing and amount of contributions to Asbestos Injuries Compensation
Fund (AICF), a special purpose fund for the compensation of proven Australian
asbestos-related personal injury and death claims; •
expectations concerning indemnification obligations;
•
expectations concerning the adequacy of the company's warranty provisions and estimates for
future warranty-related costs; •
statements regarding the company's ability to manage legal and regulatory matters
(including but not limited to product liability, environmental, intellectual property
and competition law matters) and to resolve any such pending legal and regulatory matters
within current estimates and in anticipation of certain third-party recoveries;
and •
statements about economic conditions, such as changes in the US economic or housing
recovery or changes in the market conditions in the Asia Pacific region, the levels
of new home construction and home renovations, unemployment levels, changes in consumer income, changes or stability in housing values, the
availability of mortgages and other financing, mortgage and other interest rates, housing
affordability and supply, the levels of foreclosures and home resales, currency
exchange rates, and builder and consumer confidence. |
 3
DISCLAIMER (CONTINUED)
Words such as “believe,” “anticipate,” “plan,”
“expect,” “intend,” “target,” “estimate,” “project,” “predict,” “forecast,” “guideline,” “aim,” “will,” “should,” “likely,”
“continue,” “may,” “objective,” “outlook” and
similar expressions are intended to identify forward-looking statements but are not the exclusive means of identifying such statements. Readers are
cautioned not to place undue reliance on these forward-looking statements and all such
forward-looking statements are qualified in their entirety by reference to the following
cautionary statements.
Forward-looking statements are based on the company's current expectations, estimates
and assumptions and because forward-looking statements address future results,
events and conditions, they, by their very nature, involve inherent risks and uncertainties,
many of which are unforeseeable and beyond the company's control. Such known and
unknown risks, uncertainties and other factors may cause actual results, performance or other achievements to differ materially from the anticipated results,
performance or achievements expressed, projected or implied by these forward-looking
statements. These factors, some of which are discussed under “Risk Factors” in
Section 3 of the Form 20-F filed with the Securities and Exchange Commission on 27 June
2013, include, but are not limited to: all matters relating to or arising out of the
prior manufacture of products that contained asbestos by current and former James Hardie
subsidiaries; required contributions to AICF, any shortfall in AICF and the effect of
currency exchange rate movements on the amount recorded in the company's financial statements as an asbestos liability; governmental loan facility to AICF; compliance
with and changes in tax laws and treatments; competition and product pricing in the markets
in which the company operates; the consequences of product failures or defects;
exposure to environmental, asbestos, putative consumer class action or other legal
proceedings; general economic and market conditions; the supply and cost of raw
materials; possible increases in competition and the potential that competitors could copy
the company's products; reliance on a small number of customers; a customer’s
inability to pay; compliance with and changes in environmental and health and safety laws;
risks of conducting business internationally; compliance with and changes in laws and
regulations; the effect of the transfer of the company's corporate domicile from The Netherlands to Ireland, including changes in corporate governance and any potential
tax benefits related thereto; currency exchange risks; dependence on customer preference and
the concentration of the company's customer base on large format retail customers,
distributors and dealers; dependence on residential and commercial construction markets; the effect of adverse changes in climate or weather patterns; possible
inability to renew credit facilities on terms favourable to the company, or at all;
acquisition or sale of businesses and business segments; changes in the company's key
management personnel; inherent limitations on internal controls; use of accounting
estimates; and all other risks identified in the company's reports filed with Australian, Irish
and US securities agencies and exchanges (as appropriate). The company cautions you that the
foregoing list of factors is not exhaustive and that other risks and uncertainties
may cause actual results to differ materially from those referenced the company's forward-looking statements. Forward-looking statements speak only as of the
date they are made and are statements of the company's current expectations concerning
future results, events and conditions. The company assumes no obligation to update
any forward-looking statements or information except as required by law.
|
 •
Business Overview
•
USA & Europe Fibre Cement
•
Asia Pacific Fibre Cement
•
Capital Management and Dividends
•
Group Outlook and Summary
•
Appendix
4
AGENDA
In this Management Presentation, James Hardie may present financial measures, sales volume
terms, financial ratios, and Non-US GAAP financial measures included in the
Definitions section of this document starting on slide 29. The company presents financial measures that it believes are customarily
used by its Australian investors. Specifically, these financial measures, which are
equivalent to or derived from certain US GAAP measures as explained in the
definitions, include “EBIT”, “EBIT margin”, “Operating profit before income taxes” and “Net operating profit”. The company may also present other terms
for measuring its sales volumes (“million square feet” or “mmsf” and
“thousand square feet” or “msf”); financial ratios (“Gearing ratio”, “Net interest expense
cover”, “Net interest paid cover”, “Net debt payback”, “Net
debt (cash)”); and Non-US GAAP financial measures (“EBIT excluding asbestos, asset
impairments, ASIC expenses and New Zealand product liability”, “EBIT margin
excluding asbestos, asset impairments, ASIC expenses and New Zealand product
liability”, “Net operating profit excluding asbestos, asset impairments, ASIC expenses, New Zealand product liability and tax adjustments”, “Diluted
earnings per share excluding asbestos, asset impairments, ASIC expenses, New Zealand product
liability and tax adjustments”, “Operating profit before income taxes
excluding asbestos, asset impairments and New Zealand product liability”, “Effective tax rate on earnings excluding asbestos, asset
impairments, New Zealand product liability and tax adjustments”, “Adjusted
EBITDA”, “General corporate costs excluding ASIC expenses, intercompany
foreign exchange gain and recovery of RCI legal costs” and “Selling, general and
administrative expenses excluding New Zealand product liability”). Unless otherwise
stated,
results
and
comparisons
are
of
the
3
quarter
and
nine
months
of
the
current
fiscal
year
versus
the
3
quarter
and
nine
months
of
the
prior fiscal year.
rd
rd |
 Annual net sales US$1.5b
Total assets US$1.9b
Net cash US$185m
Operations in North America, Asia Pacific and Europe
2,700 employees
Market cap US$6+b
S&P/ASX 100 company
NYSE ADR listing
Note:
Market
capitalization
as
at
7
March
2014.
Total
assets
and
net
cash
are
as
at
31
December
2013.
Annual
net
sales
equal
YTD
as
at
31
December
2013 net sales annualised. Total assets exclude asbestos compensation
JHX: A GROWTH FOCUSED COMPANY
5 |
 1
Comparisons
are
of
the
3
quarter
and
nine
months
of
the
current
fiscal
year
versus
the
3
quarter
and
nine
months
of
the
prior
fiscal
year
Q3
FY2014
Q3
FY2013
%
Change
9 Months
FY2014
9 Months
FY2013
%
Change
43.7
26.7
64
152.0
109.4
39
Net Operating Profit
92.2
31.5
286.3
115.0
GROUP OVERVIEW
1
6
rd
rd
Net operating profit excluding
asbestos, asset impairments, ASIC
expenses, New Zealand product
liability and tax adjustments
US
Millions |
 •
USA and Europe Fibre Cement
Products
•
Siding
•
Soffit
•
Fascia
•
Trim
•
Backerboard
•
Asia Pacific Fibre Cement Products
•
Residential siding
•
Commercial exteriors
•
Flooring
•
Ceilings and internal walls
JHX: A WORLD LEADER IN FIBRE CEMENT
7 |
 20%
Volume
74%
71%
29%
EBIT*
USA and Europe Fibre Cement
Asia Pacific Fibre Cement
1
All numbers are for the 3
quarter ended 31 December 2013
*EBIT –
Excludes Research and Development, asset impairments, asbestos-related items, New
Zealand product liability expenses and general corporate costs
Net Sales
GLOBAL BUSINESS PORTFOLIO
8
80%
26%
1
rd |
 Fibre cement is more durable than wood and engineered wood, looks and performs
better than
vinyl,
and
is
more
cost
effective
and
quicker
to
build
with
than
brick
Fibre
Cement
Vinyl
Engineered
Wood
Fire resistant
Hail resistant
Resists warping
Resists buckling
Colour lasts longer
Dimensional stability
Can be repainted
?
?
?
?
?
?
?
?
?
?
?
?
?
?
FIBRE CEMENT:
SUPERIOR PRODUCT PERFORMANCE
9 |
 •
7
Generation versus 2
Generation generic fibre cement
•
The HardieZone™
System represents a logical extension of Hardie technology
PRODUCT LEADERSHIP EXAMPLE:
HARDIEZONE™
SYSTEM
10
th
nd |
 THE USA
BUSINESS: LARGEST FIBRE CEMENT PRODUCER IN NORTH AMERICA
Flat Sheet
Plants
Capacity
(mmsf)
Plants operating
Cleburne, Texas
500
Additional capacity by mid
calendar year 2015
200
Peru, Illinois
560
Plant City, Florida
300
Additional capacity by mid
calendar year 2015
300
Pulaski, Virginia
600
Reno, Nevada
300
Tacoma, Washington
200
Waxahachie, Texas
360
Plant re-opening early CY14
250
Plant suspended
190
Flat Sheet Total
3,750
Plant locations
Tacoma, WA
Plant City, FL
Waxahachie, TX
Cleburne, TX
Peru,
IL
Summerville, SC
Pulaski, VA
•
Reno, NV
•
Fontana, CA
JH Plant Design Capacity
11
1
1
Fontana,
California
Summerville, South Carolina
1
Production was suspended at the Summerville plant in
November 2008. The Fontana plant is expected to
recommence production in the 4 quarter of fiscal 2014
th |
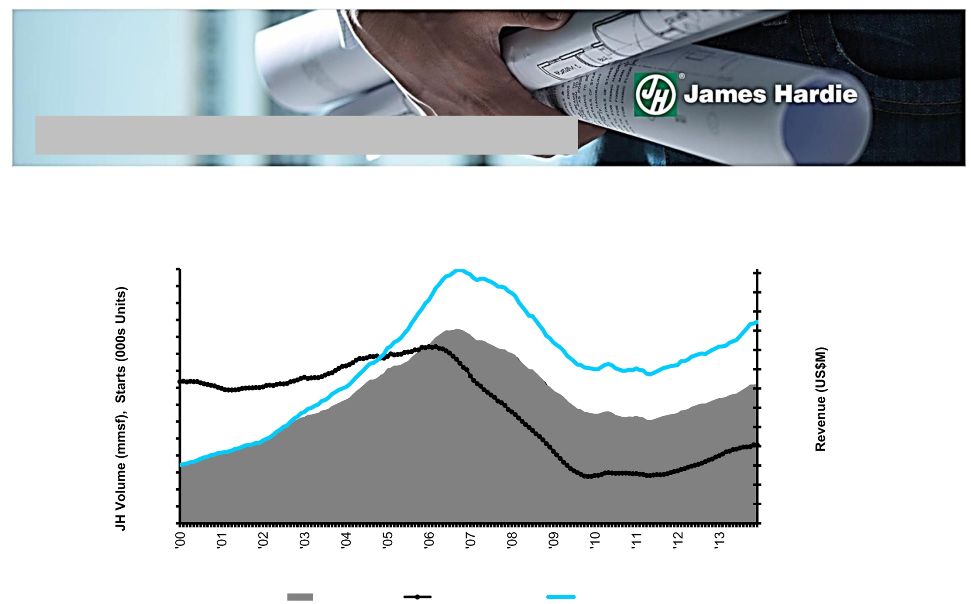 Rolling 12
month average of seasonally adjusted estimate of housing starts by US Census Bureau
12
USA FIBRE CEMENT
JH Volume
Housing Starts
JH Revenue
0
400
600
800
1,000
1,200
1,400
1,600
1,800
2,000
2,200
2,400
2,600
2,800
3,000
200
$0
$100
$200
$300
$400
$500
$600
$700
$800
$900
$1,000
$1,100
$1,200
$1,300
Top Line Growth |
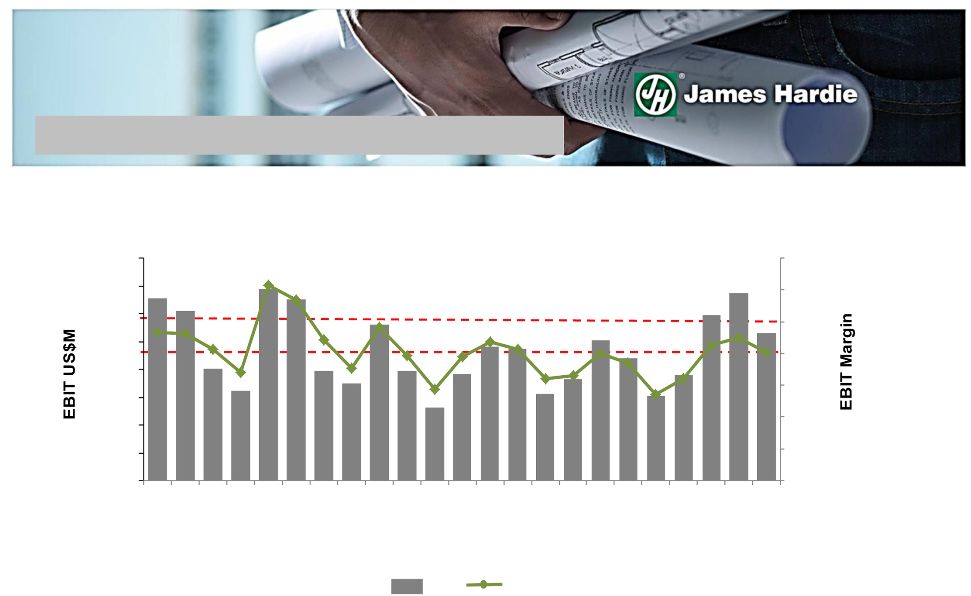 13
Quarterly EBIT and EBIT Margin
EBIT
EBIT Margin
1
USA AND EUROPE FIBRE CEMENT
0
5
10
15
20
25
30
35
0
10
20
30
40
50
60
70
80
FY09
FY10
FY11
FY12
FY13
FY14
1
Excludes
asset
impairment
charges
of
US$14.3
million
in
4
th
quarter
FY12,
US$5.8
million
in
3
rd
quarter
FY13
and
US$11.1
million
in
4
th
quarter
FY13 |
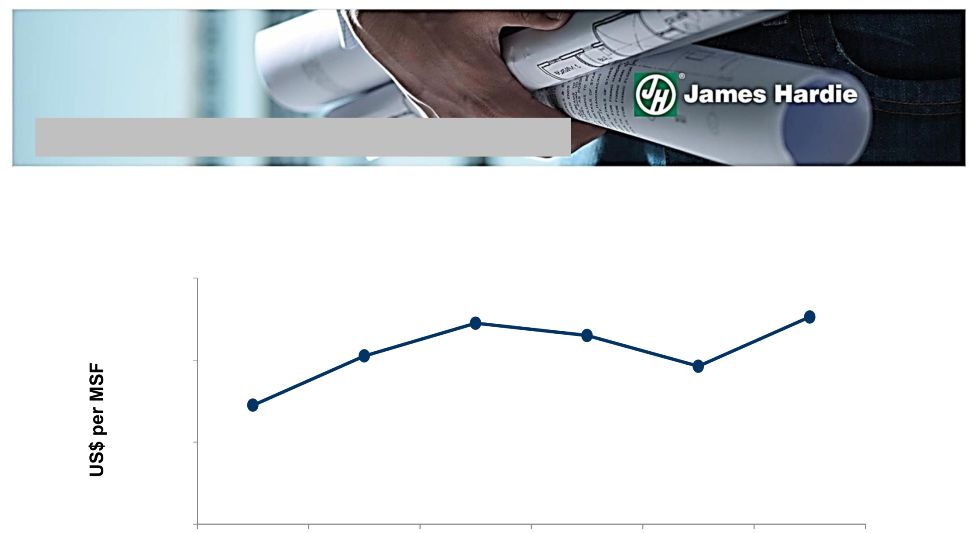 14
Average Net Sales Price (US dollars)
US$651
USA AND EUROPE FIBRE CEMENT
1
Prior period amounts have been restated to conform with current year refined
methodology for calculating average net sales price 1
670
630
590
550
FY09
FY10
FY11
FY12
FY13
Q3 YTD FY14 |
 •
Five manufacturing plants in Asia
Pacific
•
Net sales US$370.7m
•
EBIT US$86.0m
•
Higher value differentiated products
Asia Pacific manufacturing facilities
Net
Sales
and
EBIT
equal
to
YTD
as
at
31
December
2013
annualised.
EBIT
excludes
New
Zealand
product
liability
expenses
1
1
1
ASIA PACIFIC FIBRE CEMENT
15 |
 Ceilings and partitions
Philippines
Exterior cladding
Australia
General purpose flooring
Australia
New Zealand
Interior walls
ASIA PACIFIC FIBRE CEMENT -
EXAMPLES
16 |
 Objectives
•
To optimize JHX capital structure with a view towards a target net debt position in
the range of 1-2 times Adjusted EBITDA
Strategy
•
While reinvesting in R&D and capacity expansion required for growth;
•
Provide consistent dividend payments with the payout ratio of 50-70% of NPAT
excluding asbestos; •
More
aggressive
approach
to
share
buy
back
program
together
with
possible
use
of
special
dividends
Framework
17
CAPITAL MANAGEMENT FRAMEWORK
•
Manage capital efficiency within a prudent and rigorous financial policy
Ensure
sufficient
liquidity
to
support
financial
obligations
and
execute
strategy
Minimize
cost
of
capital
while
taking
into
consideration
current
and
future
industry,
market
and
economic risks and conditions
•
Strong cash flow generation expected to continue, and grow
Fund CAPEX and reinvestment in the company
Maintain flexibility to capitalize on market and strategic opportunities
1
1
Adjusted EBITDA is defined as EBITDA excluding asbestos |
 Dividends
18
CAPITAL MANAGEMENT AND DIVIDENDS
In February 2014 the company announced a 125 year anniversary special dividend of
US28.0 cents per security in
recognition of the company's 125 year anniversary
Declared in US currency and will be paid on 30 May 2014 with a record date of 21
March 2014 Effective from and including FY14, dividend payout ratio increased
from between 30% and 50% to between 50% and 70% of annual NPAT excluding
asbestos adjustments On
14
November
2013,
the
company
announced
an
ordinary
dividend
of
US8.0
cents
per
security,
up
from
US5.0
cents
per
security
in
the
prior
corresponding
fiscal
year.
The
dividend
was
declared
in
US
currency
and
will
be
paid on 28 March 2014
An ordinary dividend of US13.0 cents per security and a special dividend of US24.0
cents per security were paid on 26 July 2013 from FY13 earnings. Total
dividends paid was US$163.6 million In May 2013, the company announced a new
share buyback program to acquire up to 5% of its issued capital during the
following 12 months As at 28 February 2014, the Company repurchased a total
of 1,139,214 shares of its common stock, with an aggregate cost of A$13.6
million (US$12.2 million), at an average market price of A$11.94 (US$10.75)
Share Buybacks |
 19
USA and Europe Fibre Cement
•
The US operating environment continues to reflect an increasing number of housing
starts •
The company is continuing with its plan to expand production capacity through new
capital investments and re-commissioning of idled facilities in future
periods •
Full year FY14 EBIT margin is expected to be above 20%, absent major adverse
external factors Asia Pacific Fibre Cement
•
In Australia, approvals for detached homes continues to increase, however the
repair and remodel market
continues
to
decline.
Thus,
business
is
expected
to
track
in
line
with
any
growth
in
the
detached housing market, and be impacted by positive/negative movements in the
repair and remodel market
•
In New Zealand, the housing market continues to improve, particularly in the
Auckland and Christchurch areas
GROUP OUTLOOK |
 20
•
Management
notes
the
range
of
analysts’
forecasts
for
net
operating
profit
excluding
asbestos for the year ending 31 March 2014 is between US$189 million and US$202
million
•
Management expects full year earnings excluding asbestos, asset impairments, ASIC
expenses, New Zealand product liability and tax adjustments to be between
US$190 million and US$200 million
•
Guidance is dependent on, among other things, housing industry conditions in the US
continuing to improve and an average exchange rate of approximately
US$0.89/A$1.00 applies for the balance of the year ending 31 March
2014 •
Although US housing activity has been improving for some time, market conditions
remain somewhat uncertain and some input costs remain volatile
•
Management is unable to forecast the comparable US GAAP financial measure due to
uncertainty regarding the impact of actuarial estimates on
asbestos-related assets and liabilities in future periods
FY2014 GUIDANCE
1
Analysts’
forecasts as of 10 February 2014
1 |
 •
We have a strong, well-established, growth-focused, strong
cash-generating and high return business
•
We have a sustainable competitive advantage
•
Our model for strong growth is based on:
Large market opportunity
Superior value proposition
Proprietary and/or protected technology
Ongoing commitment to research and development
Significant organisational advantages
Focused strategy and organisational effort
Scale
•
Throughout the low demand environment the company has performed exceptionally well,
consistently delivering solid financial returns
•
The company is on track to leverage its increased capabilities as the US housing
market recovery progresses
SUMMARY
21 |
 APPENDIX |
 Industry leadership and profitable growth
•
Aggressively grow demand for our
products in targeted market
segments
•
Grow our overall market position
while defending our share in existing
market segments
•
Introduce differentiated products to
deliver a sustainable competitive
advantage
23
GLOBAL STRATEGY |
 24
TOTAL US HOUSING STARTS |
 9
Months FY2014
9 Months
FY2013
9 Months
FY2012
EPS (Diluted)
1
34c
25c
25c
EBIT/Sales (EBIT Margin)
2
17.5%
14.5%
16.5%
US & Europe EBIT/Sales (EBIT Margin)
3
21.4%
17.5%
15.3%
Gearing Ratio
1
(13.4)%
(13.9)%
(2.0)%
Net Interest Expense Cover
2
63.0x
43.6x
25.9x
Net Interest Paid Cover
2
65.1x
110.8x
25.1x
Net Debt Payback
-
-
-
Excludes asbestos adjustments, asset impairments, AICF SG&A expenses, AICF interest
income, ASIC expenses, New Zealand product liability and tax adjustments
Excludes asbestos adjustments, asset impairments, AICF SG&A expenses, ASIC expenses, New
Zealand product liability Excludes
asset
impairments
charges
of
US$5.8
million
in
the
nine
months
of
the
prior
fiscal
year
25
KEY RATIOS
1
2
3 |
 FY09
FY10
FY11
FY12
FY13
Net Sales
US$m
929
828
814
862
951
Sales Volume
mmsf
1,527
1,304
1,248
1,332
1,489
Average Price
US$ per msf
608
632
648
642
627
EBIT US$m
199
209
160
163
163
EBIT Margin %
21
25
20
19
17
26
1
1
2
During the second quarter of FY14, the company refined its methodology for calculating
average net sales price in both the USA and Europe and Asia Pacific Fibre Cement
segments to exclude ancillary products that have no impact on fibre cement sales volume, which is measured and reported in million square feet (“mmsf”). As the
revenue contribution of these ancillary products has been increasing, the company believes
the refined methodology provides an improved disclosure of average net sales price,
in line with the company’s primary fibre cement business, which is a key segment performance indicator. The company has restated average net sales price in the
prior periods to conform with the current quarter and half year calculation of average net
sales price. USA AND EUROPE FIBRE CEMENT
5 YEAR RESULTS OVERVIEW
2
1
Excludes asset impairment charges of US$14.3 million and US$16.9 million in FY12 and FY13,
respectively |
 1
Excludes New Zealand product liability expenses of US$5.4 million and US$13.2
million in FY12 and FY13, respectively 2
During the second quarter of FY14, the company refined its methodology for
calculating average net sales price in both the USA and Europe and Asia Pacific Fibre
Cement segments to exclude ancillary products that have no impact on fibre cement
sales volume, which is measured and reported in million square feet (“mmsf”). As the
revenue contribution of these ancillary products has been increasing, the company
believes the refined methodology provides an improved disclosure of average net sales
price, in line with the company’s primary fibre cement business, which is a
key segment performance indicator. The company has restated average net sales price in the
prior periods to conform with the current quarter and half year calculation of
average net sales price. FY09
FY10
FY11
FY12
FY13
Net Sales
US$m
273
297
353
376
370
Sales Volume
mmsf
391
390
408
392
394
Average Price
US$ per msf
871
886
906
906
901
EBIT US$m
47
59
79
86
75
EBIT Margin %
17
20
23
23
20
27
1
1
ASIA PACIFIC FIBRE CEMENT
5 YEAR RESULTS OVERVIEW
2 |
 28
1
Excludes
asset
impairments
charges
of
US$5.8
million in
the
3
quarter
and
nine
months
of
the
prior
fiscal
year.
2 Asia Pacific Fibre Cement EBIT excludes New Zealand product benefit of US$4.2
million and expense US$7.5 million in Q3 ‘14 and Q3 ‘13, respectively and
US$0.7 million and US$13.2 million in nine months FY14 and nine months FY13, respectively
FINANCIAL SUMMARY
rd
US$ Millions
% Change
% Change
Net Sales
USA and Europe Fibre Cement
262.6
$
224.5
$
17
839.4
$
714.6
$
17
Asia Pacific Fibre Cement
90.6
95.9
(6)
278.0
279.9
(1)
Total Net Sales
353.2
$
320.4
$
10
1,117.4
$
994.5
$
12
EBIT -
US$ Millions
USA and Europe Fibre Cement
53.1
$
30.4
$
75
179.8
$
124.7
$
44
Asia Pacific Fibre Cement
21.3
19.2
11
64.5
58.2
11
Research & Development
(6.4)
(6.8)
6
(18.0)
(19.1)
6
General corporate costs excluding
asbestos and ASIC expenses
(12.8)
(8.1)
(58)
(30.9)
(19.8)
(56)
Total EBIT excluding asbestos, asset
imparments, ASIC expenses and
New Zealand product liability
55.2
$
34.7
$
59
195.4
$
144.0
$
36
Net interest expense excluding AICF
interest income
(1.0)
(1.3)
23
(3.1)
(3.3)
6
Other income
1.2
0.5
1.4
1.2
17
Income tax expense excluding tax
adjustments
(11.7)
(7.2)
(63)
(41.7)
(32.5)
(28)
Net operating profit excluding
asbestos, asset impairments, ASIC
expenses, New Zealand product
liability and tax adjustments
43.7
$
26.7
$
64
152.0
$
109.4
$
39
Q3 '14
Q3 '13
9 Months
FY 2014
9 Months
FY 2013
2
1 |
 This Management Presentation forms part of a package of information about the
company's results. It should be read in conjunction with the other parts of
this package, including the Management’s Analysis of Results, Media Release and
Condensed Consolidated Financial Statements
Definitions
Non-financial Terms
ABS
–
Australian Bureau of Statistics
AFFA
–
Amended and Restated Final Funding Agreement
AICF
–
Asbestos Injuries Compensation Fund Ltd
ASIC
–
Australian Securities and Investments Commission
ATO
–
Australian Taxation Office
NBSK –
Northern Bleached Soft Kraft; the company's benchmark grade of pulp
Legacy
New
Zealand
product
liability
benefit
(expenses)
(“New
Zealand
product
liability”)
–
Expenses
arising
from
defending and resolving claims in New Zealand that allege poor building design,
inadequate certification of plans, inadequate construction review and
compliance certification and deficient work by sub-contractors 29
ENDNOTES |
 Financial Measures –
US GAAP equivalents
This document contains financial statement line item descriptions that are
considered to be non-US GAAP, but are consistent with those used by
Australian companies. Because the company prepares its consolidated financial statements
under US GAAP, the following table cross-references each non-US GAAP line
item description, as used in Management’s Analysis
of
Results
and
Media
Release,
to
the
equivalent
US
GAAP
financial
statement
line
item
description
used
in
the
company's condensed consolidated financial statements:
30
ENDNOTES (CONTINUED)
Management's Analysis of Results and
Consolidated Statements of Operations
Media Release
and Other Comprehensive Income (Loss)
(US GAAP)
Net sales
Net sales
Cost of goods sold
Cost of goods sold
Gross profit
Gross profit
Selling, general and administrative expenses
Selling, general and administrative expenses
Research and development expenses
Research and development expenses
Asbestos adjustments
Asbestos adjustments
EBIT*
Operating income (loss)
Net interest income (expense)*
Sum of interest expense and interest income
Other income (expense)
Other income (expense)
Operating profit (loss) before income taxes*
Income (loss) before income taxes
Income tax (expense) benefit
Income tax (expense) benefit
Net operating profit (loss)*
Net income (loss)
*-
Represents non-U.S. GAAP descriptions used by Australian companies.
|
 EBIT
margin –
EBIT margin is defined as EBIT as a percentage of net sales
Sales Volumes
mmsf
–
million
square
feet,
where
a
square
foot
is
defined
as
a
standard
square
foot
of
5/16”
thickness
msf
–
thousand
square
feet,
where
a
square
foot
is
defined
as
a
standard
square
foot
of
5/16”
thickness
Financial Ratios
Gearing
ratio
–
Net
debt
(cash)
divided
by
net
debt
(cash)
plus
shareholders’
equity
Net interest expense cover
–
EBIT divided by net interest expense (excluding loan establishment fees)
Net
interest
paid
cover
–
EBIT
divided
by
cash
paid
during
the
period
for
interest,
net
of
amounts
capitalised
Net debt payback
–
Net debt (cash) divided by cash flow from operations
Net debt (cash)
–
Short-term and long-term debt less cash and cash equivalents
Return on capital employed
–
EBIT divided by gross capital employed
31
ENDNOTES (CONTINUED) |
 32
NON-US GAAP FINANCIAL MEASURES
Q3
Q3
9 Months
9 Months
US$ Millions
FY 2014
FY 2013
FY 2014
FY 2013
EBIT
$ 94.8
$ 32.5
$ 319.5
$ 137.8
Asbestos:
Asbestos adjustments
(35.8)
(11.7)
(126.2)
(14.5)
AICF SG&A expenses
0.4
0.5
1.4
1.2
Asset impairments
-
5.8
-
5.8
ASIC expenses
-
0.1
-
0.5
New Zealand product liability (benefit) expenses
(4.2)
7.5
0.7
13.2
EBIT excluding asbestos, asset impairments, ASIC
expenses and New Zealand product liability
55.2
34.7
195.4
144.0
Net sales
$ 353.2
$ 320.4
$ 1,117.4
$ 994.5
EBIT margin excluding asbestos, asset
impairments, ASIC expenses and New Zealand
product liability
15.6%
10.8%
17.5%
14.5%
EBIT and EBIT margin excluding asbestos, asset impairments, ASIC
expenses and New Zealand product liability
–
EBIT
and EBIT margin excluding asbestos, asset impairments, ASIC expenses and New
Zealand product liability are not measures of financial performance
under
US
GAAP
and
should
not
be
considered
to
be
more
meaningful
than
EBIT
and
EBIT
margin.
Management has included these financial measures to provide investors with an
alternative method for assessing its operating results in a manner that is
focussed on the performance of its ongoing operations and provides useful information regarding its
financial condition and results of operations. Management uses these non-US
GAAP measures for the same purposes |
 Net
operating
profit
excluding
asbestos,
asset
impairments,
ASIC
expenses,
New
Zealand
product
liability
and
tax
adjustments
–
Net operating profit excluding asbestos, asset impairments, ASIC expenses, New
Zealand product liability and tax adjustments is not a measure of financial
performance under US GAAP and should not be considered to be more meaningful
than net operating profit. Management has included this financial measure to provide investors with an
alternative method for assessing its operating results in a manner that is focussed
on the performance of its ongoing operations. Management uses this
non-US GAAP measure for the same purposes 33
NON-US GAAP FINANCIAL MEASURES (CONTINUED)
Q3
Q3
9 Months
9 Months
US$ Millions
FY 2014
FY 2013
FY 2014
FY 2013
Net operating profit
$ 92.2
$ 31.5
$ 286.3
$ 115.0
Asbestos:
Asbestos adjustments
(35.8)
(11.7)
(126.2)
(14.5)
AICF SG&A expenses
0.4
0.5
1.4
1.2
AICF interest income
(0.6)
(3.4)
(2.4)
(5.6)
Asset impairments
-
5.8
-
5.8
ASIC expenses
-
0.1
-
0.5
New Zealand product liability (benefit) expenses
(4.2)
7.5
0.7
13.2
Asbestos and other tax adjustments
(8.3)
(3.6)
(7.8)
(6.2)
Net operating profit excluding asbestos, asset
impairments, ASIC expenses, New Zealand
product liability and tax adjustments
$ 43.7
$ 26.7
$ 152.0
$ 109.4 |
 Diluted
earnings
per
share
excluding
asbestos,
asset
impairments,
ASIC
expenses,
New
Zealand
product
liability
and tax adjustments
–
Diluted earnings per share excluding asbestos, asset impairments, ASIC expenses,
New Zealand product liability and tax adjustments is not a measure of
financial performance under US GAAP and should not be considered to be more
meaningful than diluted earnings per share. Management has included this financial measure to provide investors
with an alternative method for assessing its operating results in a manner that is
focussed on the performance of its ongoing operations. Management uses this
non-US GAAP measure for the same purposes 34
NON-US GAAP FINANCIAL MEASURES (CONTINUED)
Q3
Q3
9 Months
9 Months
US$ Millions
FY 2014
FY 2013
FY 2014
FY 2013
Net operating profit excluding asbestos, asset
impairments, ASIC expenses, New Zealand
product liability and tax adjustments
$ 43.7
$ 26.7
$ 152.0
$ 109.4
Weighted average common shares outstanding -
Diluted (millions)
445.2
440.3
444.2
439.0
Diluted earnings per share excluding asbestos,
asset impairments, ASIC expenses, New
Zealand product liability and tax adjustments
(US cents)
10
6
34
25 |
 Effective
tax
rate
excluding
asbestos,
asset
impairments,
New
Zealand
product
liability
and
tax
adjustments
–
Effective tax
rate on earnings excluding asbestos, asset impairments, New Zealand product
liability and tax adjustments is not a measure of financial
performance
under
US
GAAP
and
should
not
be
considered
to
be
more
meaningful
than
effective
tax
rate.
Management
has
included
this
financial
measure
to
provide
investors
with
an
alternative
method
for
assessing
its
operating
results
in
a
manner
that is focussed on the performance of its ongoing operations. Management uses this
non-US GAAP measure for the same purposes
35
NON-US GAAP FINANCIAL MEASURES (CONTINUED)
Q3
Q3
9 Months
9 Months
US$ Millions
FY 2014
FY 2013
FY 2014
FY 2013
Operating profit before income taxes
$ 95.6
$ 35.1
$ 320.2
$ 141.3
Asbestos:
Asbestos adjustments
(35.8)
(11.7)
(126.2)
(14.5)
AICF SG&A expenses
0.4
0.5
1.4
1.2
AICF interest income
(0.6)
(3.4)
(2.4)
(5.6)
Asset impairments
-
5.8
-
5.8
New Zealand product liability (benefit) expenses
(4.2)
7.5
0.7
13.2
Operating profit before income taxes excluding asbestos, asset
impairments and New Zealand product liability
$ 55.4
$ 33.8
$ 193.7
$ 141.4
Income tax expense
(3.4)
(3.6)
(33.9)
(26.3)
Asbestos-related and other tax adjustments
(8.3)
(3.6)
(7.8)
(6.2)
Income tax expense excluding tax adjustments
(11.7)
(7.2)
(41.7)
(32.5)
Effective tax rate
3.6%
10.3%
10.6%
18.6%
Effective tax rate excluding asbestos, asset impairments,
New Zealand product liability, and tax adjustments
21.1%
21.3%
21.5%
23.0% |
 Adjusted EBITDA
–
is not a measure of financial performance under US GAAP and should not be
considered an alternative to, or more meaningful than, income from
operations, net income or cash flows as defined by US GAAP or as a measure of
profitability
or
liquidity.
Not
all
companies
calculate
Adjusted
EBITDA
in
the
same
manner
as
James
Hardie
has
and,
accordingly, Adjusted EBITDA may not be comparable with other companies. Management
has included information concerning
Adjusted
EBITDA
because
it
believes
that
this
data
is
commonly
used
by
investors
to
evaluate
the
ability
of a
company's earnings from its core business operations to satisfy its debt, capital
expenditure and working capital requirements 36
NON-US GAAP FINANCIAL MEASURES (CONTINUED)
Q3
Q3
9 Months
9 Months
US$ Millions
FY 2014
FY 2013
FY 2014
FY 2013
EBIT
$ 94.8
$ 32.5
$ 319.5
$ 137.8
Depreciation and amortisation
15.6
17.3
46.2
48.0
Adjusted EBITDA
$ 110.4
$ 49.8
$ 365.7
$ 185.8 |
 37
NON-US GAAP FINANCIAL MEASURES (CONTINUED)
General corporate costs excluding ASIC expenses, intercompany foreign exchange gain
and recovery of RCI legal costs
–
General
corporate
costs
excluding
ASIC
expenses,
intercompany
foreign
exchange
gain
and
recovery
of
RCI
legal
costs is not a measure of financial performance under US GAAP and should not be
considered to be more meaningful than general corporate costs.
Management
has
included
these
financial
measures
to
provide
investors
with
an
alternative
method
for
assessing its operating results in a manner that is focussed on the performance of
its ongoing operations and provides useful information regarding its
financial condition and results of operations. Management uses these non-US GAAP measures for the
same purposes
Q3
Q3
9 Months
9 Months
US$ Millions
FY 2013
FY 2013
General corporate costs
$ 12.8
$ 8.2
$ 30.9
$ 20.3
Excluding:
ASIC expenses
-
(0.1)
-
(0.5)
Intercompany foreign exchange gain
-
-
-
5.5
Recovery of RCI legal costs
-
-
-
2.7
General corporate costs excluding ASIC
expenses, intercompany foreign exchange
gain and recovery of RCI legal costs
$ 12.8
$ 8.1
$ 30.9
$ 28.0
FY 2014
FY 2014 |
 Selling,
general
and
administrative
expenses
excluding
New
Zealand
product
liability
–
Selling,
general
and
administrative expenses excluding New Zealand product liability is not a measure of
financial performance under US GAAP and
should
not
be
considered
to
be
more
meaningful
than
selling,
general
and
administrative
expenses.
Management
has
included these financial measures to provide investors with an alternative method
for assessing its operating results in a manner that is focussed on the
performance of its ongoing operations and provides useful information regarding its
financial condition and results of operations. Management uses these non-US
GAAP measures for the same purposes 38
NON-US GAAP FINANCIAL MEASURES (CONTINUED)
Q3
Q3
9 Months
9 Months
US$ Millions
FY 2013
FY 2013
Selling, general and administrative expenses
$ 53.8
$ 59.7
$ 162.5
$ 160.6
Excluding:
New Zealand product liability benefit (expenses)
4.2
(7.5)
(0.7)
(13.2)
Selling, general and administrative expenses
excluding New Zealand product liability
$ 58.0
$ 52.2
$ 161.8
$ 147.4
Net Sales
$ 353.2
$ 320.4
$ 1,117.4
$ 994.5
Selling, general and administrative expenses as a
percentage of net sales
15.2%
18.6%
14.5%
16.1%
Selling, general and administrative expenses
excluding New Zealand product liability as a
percentage of net sales
16.4%
16.3%
14.5%
14.8%
FY 2014
FY 2014 |
 INVESTOR PRESENTATION
March 2014 |