 Q4
FY14 MANAGEMENT PRESENTATION Exhibit 99.4
22 May 2014 |
| Q4
FY14 MANAGEMENT PRESENTATION Exhibit 99.4
22 May 2014 |
 2
DISCLAIMER
•
statements about the company's future performance;
•
projections of the company's results of operations or financial
condition; •
statements regarding the company's plans with respect to the
introduction of new products, product lines and businesses; •
statements regarding the company's plans, objectives or goals,
including those relating to strategies, initiatives, competition, acquisitions,
dispositions and/or its products;
•
expectations concerning the costs associated with the suspension,
closure, opening or expansion of operations at any of the company's plants and
future plans with respect to any such plants;
•
expectations regarding the extension or renewal of the company's credit
facilities including changes to terms, covenants or ratios; •
expectations concerning dividend payments and share buy-backs;
•
statements concerning the company's corporate and tax domiciles and
structures and potential changes to them, including potential tax charges; •
statements regarding tax liabilities and related audits, reviews and
proceedings; •
statements regarding the possible consequences, value, impact or effect
of the Settlement Deed resolving the legal proceedings brought by the
New Zealand Ministry of Education against two of the company's New
Zealand subsidiaries; •
expectations about the timing and amount of contributions to Asbestos
Injuries Compensation Fund (AICF), a special purpose fund for the
compensation of proven Australian asbestos-related personal injury
and death claims; •
expectations concerning indemnification obligations;
•
expectations concerning the adequacy of the company's warranty
provisions and estimates for future warranty-related costs; •
statements regarding the company's ability to manage legal and
regulatory matters (including but not limited to product liability, environmental,
intellectual property and competition law matters) and to resolve any
such pending legal and regulatory matters within current estimates and in
anticipation of certain third-party recoveries; and
•
statements about economic conditions, such as changes in the US
economic or housing recovery or changes in the market conditions in the Asia
Pacific region, the levels of new home construction and home
renovations, unemployment levels, changes in consumer income, changes or
stability in housing values, the availability of mortgages and other
financing, mortgage and other interest rates, housing affordability and supply,
the levels of foreclosures and home resales, currency exchange rates,
and builder and consumer confidence. Examples of
forward-looking statements include: This Management
Presentation contains forward-looking statements. James Hardie may from time to time make forward-looking statements in its periodic reports filed with
or furnished to the SEC, on Forms 20-F and 6-K, in its annual
reports to shareholders, in offering circulars, invitation memoranda and prospectuses, in media releases and
other written materials and in oral statements made by the company's
officers, directors or employees to analysts, institutional investors, existing and potential lenders,
representatives of the media and others. Statements that are not
historical facts are forward-looking statements and such forward-looking statements are statements made
pursuant to the Safe Harbor Provisions of the Private Securities
Litigation Reform Act of 1995. |
 3
DISCLAIMER (CONTINUED)
Words such as “believe,” “anticipate,”
“plan,” “expect,” “intend,” “target,” “estimate,” “project,” “predict,” “forecast,” “guideline,” “aim,” “will,” “should,”
“likely,” “continue,” “may,”
“objective,” “outlook” and similar expressions are intended to identify forward-looking statements but are not the exclusive means of identifying such
statements. Readers are cautioned not to place undue reliance on these
forward-looking statements and all such forward-looking statements are qualified in their entirety by
reference to the following cautionary statements.
Forward-looking statements are based on the company's current
expectations, estimates and assumptions and because forward-looking statements address future results,
events and conditions, they, by their very nature, involve inherent
risks and uncertainties, many of which are unforeseeable and beyond the company's control. Such known
and unknown risks, uncertainties and other factors may cause actual
results, performance or other achievements to differ materially from the anticipated results, performance
or achievements expressed, projected or implied by these
forward-looking statements. These factors, some of which are discussed under “Risk Factors” in Section 3 of the
Form 20-F filed with the Securities and Exchange Commission on 27
June 2014, include, but are not limited to: all matters relating to or arising out of the prior manufacture
of products that contained asbestos by current and former James Hardie
subsidiaries; required contributions to AICF, any shortfall in AICF and the effect of currency
exchange rate movements on the amount recorded in the company's
financial statements as an asbestos liability; governmental loan facility to AICF; compliance with and
changes in tax laws and treatments; competition and product pricing in
the markets in which the company operates; the consequences of product failures or defects; exposure
to environmental, asbestos, putative consumer class action or other
legal proceedings; general economic and market conditions; the supply and cost of raw materials; possible
increases in competition and the potential that competitors could copy
the company's products; reliance on a small number of customers; a customer’s inability to pay;
compliance with and changes in environmental and health and safety
laws; risks of conducting business internationally; compliance with and changes in laws and regulations;
the effect of the transfer of the company's corporate domicile from The
Netherlands to Ireland, including changes in corporate governance and any potential tax benefits
related thereto; currency exchange risks; dependence on customer
preference and the concentration of the company's customer base on large format retail customers,
distributors and dealers; dependence on residential and commercial
construction markets; the effect of adverse changes in climate or weather patterns; possible inability to
renew credit facilities on terms favourable to the company, or at all;
acquisition or sale of businesses and business segments; changes in the company's key management
personnel; inherent limitations on internal controls; use of accounting
estimates; and all other risks identified in the company's reports filed with Australian, Irish and US
securities agencies and exchanges (as appropriate). The company
cautions you that the foregoing list of factors is not exhaustive and that other risks and uncertainties may
cause actual results to differ materially from those referenced the
company's forward-looking statements. Forward-looking statements speak only as of the date they are made
and are statements of the company's current expectations concerning
future results, events and conditions. The company assumes no obligation to update any forward-looking
statements or information except as required by law.
|
 •
Overview
and
Operating
Review
–
Louis
Gries,
CEO
•
Financial
Review
–
Matt
Marsh,
CFO
•
Questions and Answers
4
AGENDA
In
this
Management
Presentation,
James
Hardie
may
present
financial
measures,
sales
volume
terms,
financial
ratios,
and
Non-US
GAAP
financial
measures
included
in
the
Definitions
section
of
this
document
starting
on
page
46..
The
company
presents
financial
measures
that
it
believes
are
customarily used by its Australian investors. Specifically, these financial measures, which are
equivalent to or derived from certain US GAAP measures
as
explained
in
the
definitions,
include
“EBIT”,
“EBIT
margin”,
“Operating
profit
before
income
taxes”
and
“Net
operating
profit”.
The
company
may
also
present
other
terms
for
measuring
its
sales
volumes
(“million
square
feet”
or
“mmsf”
and
“thousand
square
feet”
or
“msf”);
financial ratios (“Gearing ratio”, “Net interest expense cover”, “Net
interest paid cover”, “Net debt payback”, “Net debt (cash)”); and Non-US GAAP
financial measures (“EBIT excluding asbestos, asset impairments, ASIC expenses and New Zealand
product liability”, “EBIT margin excluding asbestos, asset impairments, ASIC expenses
and New Zealand product liability”, “Net operating profit excluding asbestos, asset impairments, ASIC
expenses, New Zealand product liability and tax adjustments”, “Diluted earnings per share
excluding asbestos, asset impairments, ASIC expenses, New Zealand product liability and tax
adjustments”, “Operating profit before income taxes excluding asbestos, asset impairments and New Zealand
product
liability”,
“Effective
tax
rate
on
earnings
excluding
asbestos,
asset
impairments,
New
Zealand
product
liability
and
tax
adjustments”,
“Adjusted
EBITDA”,
“General
corporate
costs
excluding
ASIC
expenses,
intercompany
foreign
exchange
gain
and
recovery
of
RCI
legal
costs”
and
“Selling,
general and administrative expenses excluding New Zealand product liability”). Unless otherwise
stated, results and comparisons are of the 3 quarter and nine months of the current fiscal year
versus the 3 quarter and nine months of the prior fiscal year.
rd
rd |
 OVERVIEW AND OPERATING REVIEW
Louis Gries, CEO |
 GROUP
OVERVIEW
1
6
Net operating profit reflects:
1
Comparisons
are
of
the
4
th
quarter
and
full
year
of
the
current
fiscal
year
versus
the
4
th
quarter
and
full
year
of
the
prior
fiscal
year
Q4
Q4
%
%
FY 2014
FY 2013
Change
FY 2014
FY 2013
Change
Net operating profit
(186.8)
(69.5)
99.5
45.5
Net operating profit excluding asbestos, ASIC
expenses, New Zealand product liability expenses
and tax adjustments
45.3
30.7
48
197.2
140.8
40
Diluted earnings per share excluding asbestos, ASIC
expenses, New Zealand product liability expenses
and tax adjustments (US cents)
10
7
44
32
US$ Millions
•
Higher sales volumes and average net sales price in local currencies in both the
USA and Europe Fibre Cement and Asia Pacific Fibre Cement segments
•
USA and Europe Fibre Cement EBIT margins of 19.8% and 21.0% for the quarter and
full year ended 31 March 2014, respectively
|
 7
1
Comparisons
are
of
the
4
th
quarter
of
the
current
fiscal
year
versus
the
4
th
quarter
of
the
prior
fiscal
year
2
During the second quarter of FY2014, the company refined its methodology for
calculating average net sales price in both the USA and Europe Fibre Cement
and Asia Pacific Fibre Cement segments to exclude ancillary products that have no impact on fibre cement
sales volume, which is measured and reported in million square feet
(“mmsf”). As the revenue contribution of these ancillary products
has
been
increasing,
the
company
believes
the
refined
methodology
provides
an
improved
disclosure
of
average
net
sales
price,
in
line
with
the
company's
primary
fibre
cement
business,
which
is
a
key
segment
performance
indicator.
The
company
has
restated
average
net
sales
price
in
the
prior
periods
to
conform
with
the
current
quarter
and
half
year
calculation
of
average
net
sales
price.
Readers
are
referred
to
the
“Five
Year
Financial
Summary”
on
the
company's
Investor
Relations
website
at
http://www.ir.jameshardie.com.au
for
the
refined comparative average net sales price for the periods FY2010 through FY2013
using this revised methodology. USA and Europe Fibre Cement results
reflected: •
Higher sales volume due to increased activity in new construction market and
increased market penetration
•
Higher average net sales price
•
Economies of scale achieved through an increase in volume
•
Higher input costs
•
Increased idle facility costs due to the ramp up of capacity at the company's
newly recommissioned Fontana, California location
1
USA
AND
EUROPE
FIBRE
CEMENT
4
th
QUARTER
SUMMARY
1
2 |
 4th
Quarter Result Net Sales
up
22% to US$288.2
million
Sales Volume
up
14% to 433.4 mmsf
Average Price
up
7% to US$653 per msf
EBIT
up
51% to US$57.2 million
EBIT
Margin
up
3.8
pts
to
19.8%
8
1
Comparisons
are
of
the
4
quarter
of
the
current
fiscal
year
versus
the
4
quarter
of
the
prior
fiscal
year
2
Prior period amounts have been restated to conform with current year refined
methodology for calculating the change in average net sales price 3
Excludes
asset
impairments
charges
of
US$11.1
million
in
the
4
th
quarter
of
the
prior
fiscal
year
USA AND EUROPE FIBRE CEMENT
2
3
th
th
1
3 |
 Full
Year
Result
Net Sales
up
19% to US$1,127.6
million
Sales Volume
up
14% to 1,696.9 mmsf
Average Price
up
4% to US$652 per msf
EBIT
up
46% to US$237.0 million
EBIT
Margin
3
up
3.9 pts to 21.0%
9
1
Comparisons are of the full year of the current fiscal year versus the full year of
the prior fiscal year 2
Prior period amounts have been restated to conform with current year refined
methodology for calculating the change in average net sales price 3
Excludes asset impairments charges of US$16.9 million in the full year of the prior
fiscal year 1
USA AND EUROPE FIBRE CEMENT
2
3 |
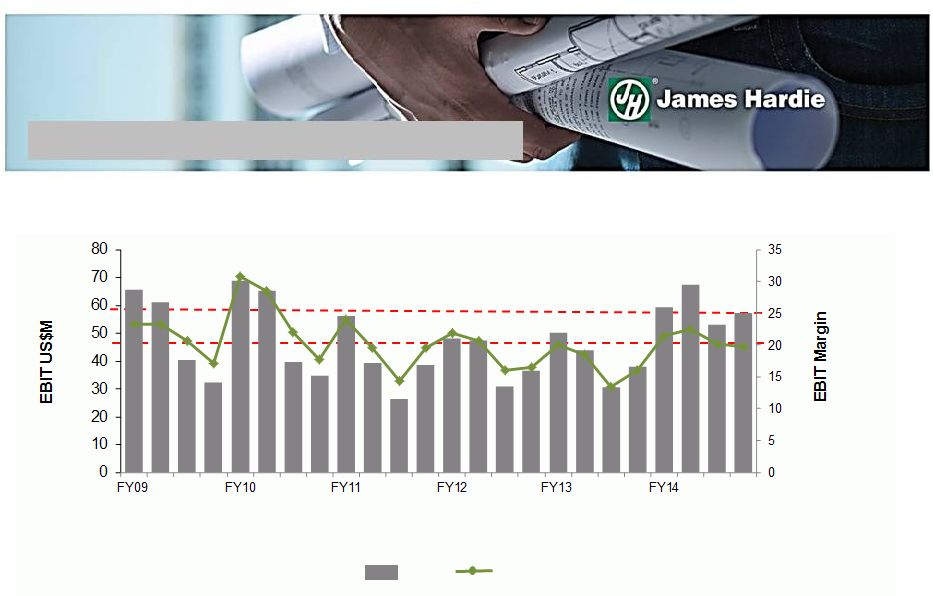 1
Excludes
asset
impairment
charges
of
US$14.3
million
in
4
th
quarter
FY12,
US$5.8
million
in
3
rd
quarter
FY13
and
US$11.1
million
in
4
th
quarter
FY13
10
Quarterly
EBIT
and
EBIT
Margin
1
EBIT
EBIT Margin
USA AND EUROPE FIBRE CEMENT |
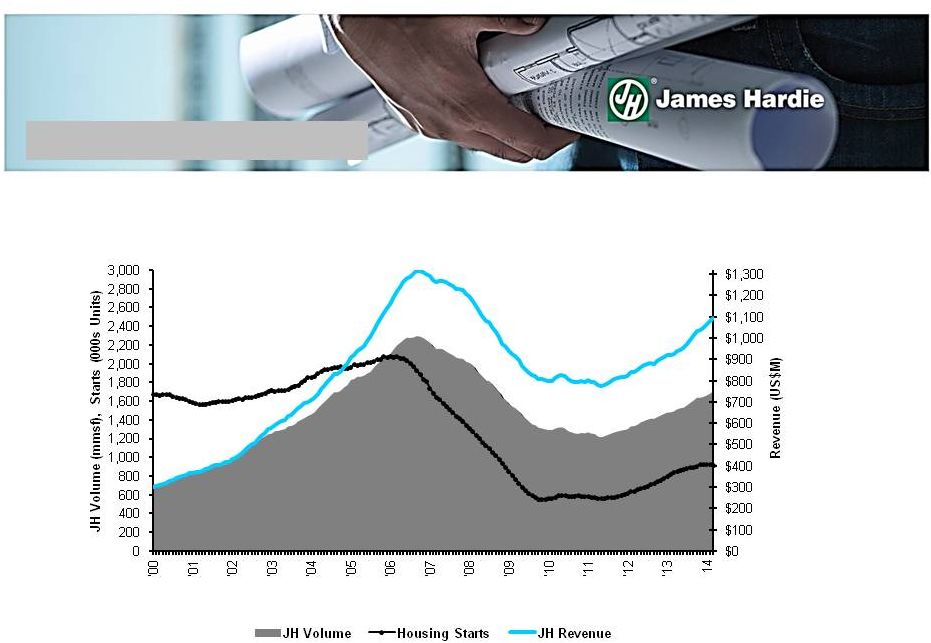 Rolling 12 month average of seasonally adjusted estimate of housing starts by US
Census Bureau 11
USA FIBRE CEMENT
Top Line Growth |
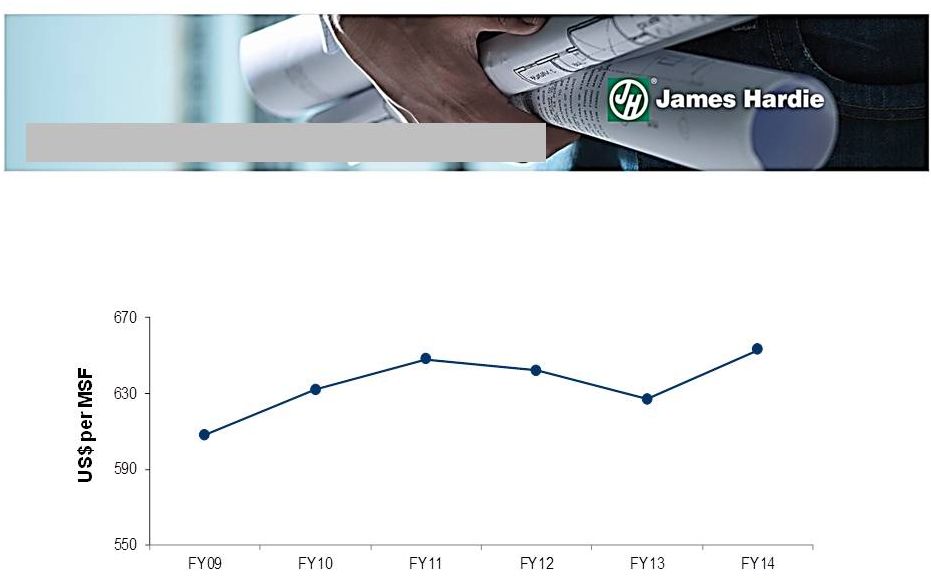 12
Average
Net
Sales
Price
(US
dollars)
1
US$652
1
Prior period amounts have been restated to conform with current year refined
methodology for calculating average net sales price USA AND EUROPE FIBRE CEMENT
|
 ASIA
PACIFIC FIBRE CEMENT 4 th
QUARTER SUMMARY
1
Comparisons are of the 4
quarter of the current fiscal year versus the 4
quarter of the prior fiscal year
2
Prior period amounts have been restated to conform with current year refined
methodology for calculating the change in average net sales price
3
Impact is in local currency
Asia Pacific Fibre Cement results reflected:
Higher average net sales price
2, 3
Increased sales volume
Lower
production
costs
3
achieved
through
economies
of
scale
driven
by
volume
Higher
input
costs
3
Depreciation of local currencies against US$
causing reported US$ Asia
Pacific Fibre Cement results to appear worse than underlying performance
1
th
th
13 |
 4th
Quarter Result Net Sales
down
2% to US$88.2 million
Sales Volume
11% to 106.9 mmsf
Average Price
2% to A$910 per msf
EBIT
10% to US$18.4 million
A$ EBIT
28% to A$20.7 million
EBIT Margin
2.3 pts to 20.9%
14
1
Comparisons
are
of
the
4
quarter
of
the
current
fiscal
year
versus
the
4
th
quarter
of
the
prior
fiscal
year
2
Prior
period
amounts
have
been
restated
to
conform
with
current
year
refined
methodology
for
calculating
the
change
in
average
net
sales price
3
Excludes
New
Zealand
product
liability
expense
of
US$1.1
million
in
the
4
th
quarter
of
the
current
fiscal
year
1
3
3
ASIA PACIFIC FIBRE CEMENT
2
3
th
up
up
up
up
up |
 Full
Year Result Net Sales
down
1% to US$366.2 million
Sales Volume
6% to 417.2 mmsf
Average Price
3% to A$930 per msf
EBIT
11% to US$82.9 million
A$ EBIT
21% to A$88.9 million
EBIT Margin
2.3 pts to 22.6%
15
1
Comparisons are of the full year of the current fiscal year versus the full year of
the prior fiscal year 2
Prior
period
amounts
have
been
restated
to
conform
with
current
year
refined
methodology
for
calculating
the
change
in
average
net
sales price
3
Excludes New Zealand product liability expenses of US$1.8 million and US$13.2
million in FY2014 and FY 2013, respectively 1
3
3
ASIA PACIFIC FIBRE CEMENT
2
3
up
up
up
up
up |
 16
USA and Europe Fibre Cement
•
The company expects continued improvement in the US operating environment, though
cautions, it is predicated upon the strength of employment and consumer
confidence •
The
company
is
proceeding
with
its
previously
announced
plans
to
increase
production
capacity
•
The company anticipates that EBIT margin in FY15 will increase as contribution
margin exceeds spending on organisational costs and research and
development Asia Pacific Fibre Cement
•
In Australia, approvals for detached homes continues to increase, however the
repair and remodel market continues to decline. Thus, business is expected
to track in line with any growth in the detached housing market, and be
impacted by positive/negative movements in the repair and remodel
market •
In New Zealand, the housing market continues to improve, particularly in the
Auckland and Christchurch areas
GROUP OUTLOOK |
 17
USA and Europe Fibre Cement
MANUFACTURING CAPACITY EXPANSION
1
Nominal
capacities
are
based
on
production
of
5/16’’
HardieZone
10
product,
without
regard
to
actual
or
anticipated
product
mix
•
In Q1 FY2014, James Hardie acquired the previously-leased land and buildings at
its existing Carole Park, Queensland location and is expanding production
capacity at the site at a total estimated investment of approximately A$89
million Asia Pacific Fibre Cement
•
Plant City and Cleburne expansions are expected to be commissioned by the first
half of fiscal 2016 •
A third sheet machine and ancillary facilities at the Cleburne, Texas location,
with an estimated investment
of
US$37
million
with
nominal
capacity
of
200
mmsf
1
•
A fourth sheet machine and ancillary facilities at the Plant City, Florida
location, with an estimated investment
of
US$65
million
with
nominal
capacity
of
300
mmsf
1
•
The company has completed the refurbishment of the Fontana, California location and
commenced production
in
the
fourth
quarter
of
fiscal
2014
with
nominal
capacity
of
250
mmsf
1 |
 FINANCIAL REVIEW
Matt Marsh, CFO |
 Earnings impacted by:
Higher volumes and average net sales prices in local currencies
Higher EBIT and EBIT margins in all major business units compared to prior
corresponding periods Unfavourable movement in asbestos adjustments of
US$195.8 million during full year ended 31 Increase in net
operating cash flow to US$322.8 million for the full year ended 31 March 2014,
19
HIGHLIGHTS
March 2014, primarily due to a change in actuarial valuation assumptions
compared to US$109.3 million in the prior year
Increase of US$54.3 million in capital expenditure to US$115.4 million for the full
year ended 31 March 2014 when compared to the prior year
Ordinary dividends declared of US40 cents per security for the full year ended 31
March 2014 compared to ordinary dividends declared of US18 cents per
security in the prior corresponding period Special dividends declared of US48
cents per security for the full year ended 31 March 2014 compared to special
dividends declared of US24 cents per security in the prior corresponding period |
 20
RESULTS –
Q4
US$ Millions
Q4 '14
Q4 '13
% Change
Net sales
376.4
326.8
15
Gross profit
125.5
101.8
23
SG&A expenses
(61.9)
(58.0)
(7)
Research & development expenses
(8.0)
(9.4)
15
Asset impairments
-
(11.1)
Asbestos adjustments
(322.0)
(131.6)
EBIT
(266.4)
(108.3)
Net interest (expense) income
(0.4)
0.1
Other income
1.2
0.6
Income tax benefit
78.8
38.1
Net operating profit
(186.8)
(69.5)
Highlights:
Higher sales volumes; and
Higher average net sales prices in local
currencies
Higher sales volumes and average net sales
prices in local currencies; and
Higher input costs and idle facility costs, partially
offset by volume related economics of scale
Primarily due to higher compensation expenses
Increase in legacy New Zealand product liability
Changes in the underlying actuarial valuation
assumptions
A$ exchange rate against US$ at 31 March
compared to 31 December
Gross profit margin increased 210 bps impacted by:
SG&A expenses increased:
Asbestos adjustments were unfavourable due to:
Net sales increased 15% favourably impacted by: |
 21
1
Includes AICF SG&A expenses and AICF interest income
RESULTS –
Q4 (CONTINUED)
Highlights:
Asbestos adjustments were
unfavourable due to:
$308.2 million change in the
underlying actuarial valuation
assumptions; and
Exchange rate difference of
$23.3 million due to the
change in the AUD spot
exchange rate against the
USD at 31 March 2014 versus
31 December 2013.
Net operating profit excluding
asbestos, asset impairments, ASIC,
and New Zealand product liability
increased 48%
Q4 '14
Q4 '13
% Change
Net operating profit
(186.8)
(69.5)
Asbestos:
Asbestos adjustments
322.0
131.6
Other asbestos
0.2
(0.9)
Asset impairment
-
11.1
ASIC expenses
-
2.1
New Zealand product liability (benefit) expenses
1.1
-
Asbestos and other tax adjustments
(91.2)
(43.7)
Net operating profit excluding asbestos, asset
impairments, ASIC expenses, New Zealand
product liability and tax adjustments
45.3
30.7
48
1
US$ Millions |
 22
RESULTS
–
FULL
YEAR
US$ Millions
FY 2014
FY 2013
% Change
Net sales
1,493.8
1,321.3
13
Gross profit
506.4
419.3
21
SG&A expenses
(224.4)
(218.6)
(3)
Research & development
expenses
(33.1)
(37.2)
11
Asset impairments
-
(16.9)
Asbestos adjustments
(195.8)
(117.1)
(67)
EBIT
53.1
29.5
80
Net interest (expense)
income
(1.1)
2.4
Other income
2.6
1.8
44
Income tax benefit
44.9
11.8
Net operating profit
99.5
45.5
Highlights:
Higher sales volumes; and
Higher average net sales prices in local
currencies
Higher sales volumes and average net sales
prices in local currencies; and
Higher input costs and idle facility costs,
partially offset by volume related economics
of scale
Changes in the underlying actuarial
valuation assumptions;
offset by favourable foreign exchange rate at
31 March 2014 compared to 31 March 2013
Net sales increased 13% favourably impacted by:
Gross profit margin increased 220 bps impacted by:
R&D expenses decreased during the full year
primarily as a result of timing for the completion of
certain core projects and start of new projects
Unfavourable asbestos adjustments driven by: |
 23
1
Includes AICF SG&A expenses and AICF interest income
RESULTS –
FULL YEAR (CONTINUED)
Highlights:
Improved headline net operating profit
driven by higher net sales and gross profit
Unfavourable asbestos adjustments
driven by changes in the underlying
actuarial valuation assumptions, offset by
favourable foreign exchange rate at
31 March 2014 compared to 31 March
2013
Legacy New Zealand product liability
expenses for the full year decreased
compared to the prior year due to:
Substantial reductions in value of
new claims received
Fewer new claims received
Excluding asbestos, asset impairments,
ASIC expenses, and New Zealand
product liability, net operating profit
increased 40%
FY 2014
FY 2013
% Change
Net operating profit
99.5
45.5
Asbestos:
Asbestos adjustments
195.8
117.1
67
Other asbestos
(0.8)
(5.3)
85
Asset impairments
-
16.9
ASIC expenses
-
2.6
New Zealand product liability expenses
1.8
13.2
(86)
Asbestos and other tax adjustments
(99.1)
(49.2)
Net operating profit excluding asbestos,
asset impairments, ASIC expenses,
New Zealand product liability and tax
adjustments
197.2
140.8
40
Diluted earnings per share excluding
asbestos, asset imparments, ASIC expenses,
New Zealand product liability and tax
adjustments (US cents)
44
32
US$ Millions
1 |
 1
Research and development expenses include costs associated with research projects
that are designed to benefit all business units. These costs are recorded in
the Research and Development segment rather than attributed to individual business units
2
Excludes
ASIC
expenses
of
US$2.1
million
in
the
4
th
quarter
of
the
prior
fiscal
year
24
Highlights:
Adjusted USA and Europe Fibre
Cement EBIT margin increased
3.8 percentage points to 19.8%
Adjusted Asia Pacific Fibre
Cement EBIT margin increased
2.3 percentage points to 20.9%
General corporate costs
excluding ASIC expenses were
higher compared to the prior
corresponding quarter primarily
due to an increase in salary and
compensation expenses
US$ Millions
Q4 '14
Q4 '13
% Change
USA and Europe Fibre Cement exluding asset
impairments
57.2
37.8
51
Asia Pacific Fibre Cement, excluding New Zealand
product liability expenses
18.4
16.7
10
Research
&
Development
1
(6.4)
(6.9)
7
Total segment EBIT excluding asset
imparments and New Zealand product liability
69.2
47.6
45
General
corporate
costs
excluding
ASIC
expenses
2
(11.8)
(10.6)
(11)
Total EBIT excluding asbestos, asset
impairments, ASIC expenses and New Zealand
product liability
57.4
37.0
55
Asbestos adjustments
(322.0)
(131.6)
AICF SG&A expenses
(0.7)
(0.5)
(40)
Asset impairments
-
(11.1)
ASIC expenses
-
(2.1)
New Zealand product liability expenses
(1.1)
-
Total EBIT
(266.4)
(108.3)
SEGMENT EBIT –
Q4 |
 1
Research and development expenses include costs associated with research projects
that are designed to benefit all business units. These costs are recorded in
the Research and Development segment rather than attributed to individual business units
2
Excludes ASIC expenses of US$2.6 million in the prior fiscal year
25
SEGMENT EBIT –
FULL YEAR
Highlights:
Adjusted USA and Europe Fibre
Cement EBIT margin increased 3.9
percentage points to 21.0%
Adjusted Asia Pacific Fibre Cement
EBIT margin increased 2.3
percentage points to 22.6%
General corporate costs were
higher compared to the prior
corresponding period primarily due:
Prior year included non-
recurring ASIC expenses of
US$2.6M; foreign exchange
gain of US$5.5M; and US$2.7M
non-recurring recovery of legal
costs
Compensation expenses
increased
US$ Millions
FY 2014
FY 2013
% Change
USA and Europe Fibre Cement excluding asset
impairments
237.0
162.5
46
Asia Pacific Fibre Cement excluding New Zealand
product liability
82.9
74.9
11
Research & Development
1
(24.4)
(26.0)
6
Total segment EBIT excluding asset
impairments and New Zealand product liability
295.5
211.4
40
General corporate costs excluding ASIC expenses
2
(42.7)
(30.4)
(41)
Total EBIT excluding asbestos, asset
impairments, ASIC expenses and New Zealand
product liability
252.8
181.0
40
Asbestos adjustments
(195.8)
(117.1)
(67)
AICF SG&A expenses
(2.1)
(1.7)
(24)
ASIC expenses
-
(2.6)
New Zealand product liaiblity expenses
(1.8)
(13.2)
86
Total EBIT
53.1
29.5
80 |
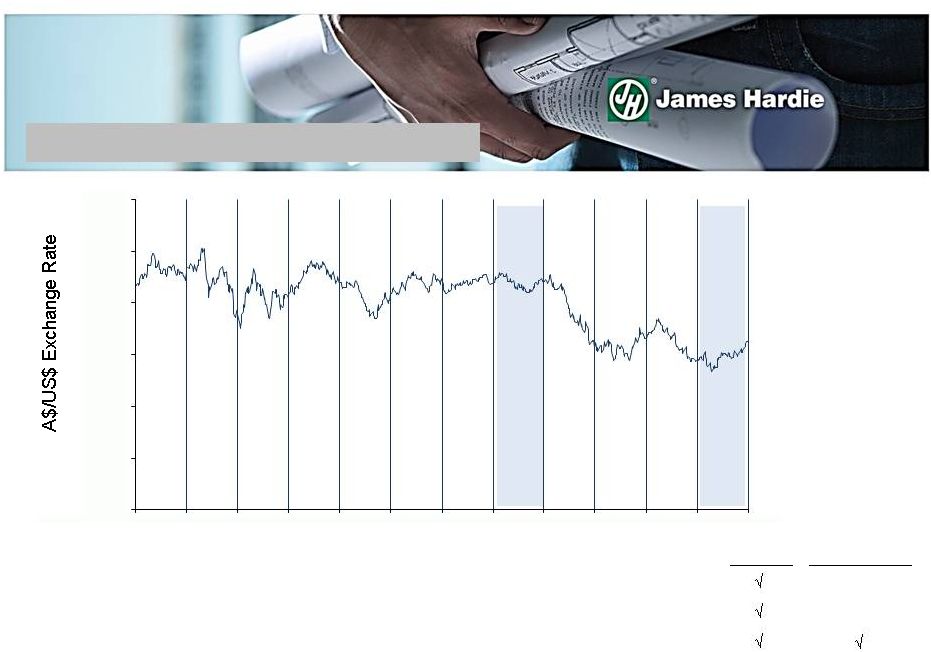 •
Unfavourable
impact
from
translation
of
Asia
Pacific
earnings
–
Q4’14
vs
Q4’13
•
Favourable
impact
on
corporate
costs
incurred
in
Australian
dollars
–
Q4’14
vs
Q4’13
•
Favourable impact on translation of Asbestos Liability at year end spot rates
26
Earnings
Balance Sheet
N/A
N/A
CHANGES IN A$ VERSUS US$
0.60
0.70
0.80
0.90
1.00
1.10
1.20
31 Mar 11
30 Jun 11
30 Sep 11
31 Dec 11
31 Mar 12
30 Jun 12
30 Sep 12
31 Dec 12
31 Mar 13
30 Jun 13
30 Sep 13
31 Dec 13
31 Mar 14 |
 27
1
Includes AICF SG&A expenses and AICF interest income
INCOME TAX EXPENSE –
Q4
US$ Millions
Operating profit before income taxes
(265.6)
(107.6)
Asbestos:
Asbestos adjustments
322.0
131.6
Other asbestos
0.2
(0.9)
Asset impairments
-
11.1
New Zealand product liability expenses
1.1
-
Operating profit before income taxes excluding asbestos,
asset imparments and New Zealand product liability
57.7
34.2
Income tax expense
78.8
38.1
Asbestos related and other tax adjustments
(91.2)
(43.7)
Income tax expense excluding tax adjustments
(12.4)
(5.6)
Effective tax rate excluding asbestos, asset impairments,
New Zealand product liability and tax adjustments
21.5%
16.4%
Q4 '14
Q4 '13
Highlights:
Income tax expense excluding
asbestos-related and other tax
adjustments for the quarter
increased due to higher taxable
earnings.
Effective tax rate excluding
asbestos, asset impairments,
New Zealand product liability,
and tax adjustments increased
compared to the prior
corresponding quarter
Asbestos related and other tax
adjustments increased due to
increase in asbestos adjustments
caused by changes in actuarial
valuation assumptions
1 |
 28
1
Includes AICF SG&A expenses and AICF interest income
INCOME TAX EXPENSE –
FULL YEAR
Highlights:
Effective tax rate excluding
asbestos related and other tax
adjustments remained consistent
year over year due to an increase
in taxable earnings relative to
recurring tax adjustments
In FY14, the asbestos related and
other tax adjustments includes an
interest refund from the ATO of
US$15.4m in connection with
finalization of the RCI 1999
Amended Assessment
FY 2014
FY 2013
Operating profit before income taxes
54.6
33.7
Asbestos:
Asbestos adjustments
195.8
117.1
Other asbestos
(0.8)
(5.3)
Asset impairments
-
16.9
New Zealand product liability expenses
1.8
13.2
Operating profit before income taxes excluding asbestos
asset impairments and New Zealand product liability
251.4
175.6
Income tax expense
44.9
11.8
Asbestos related and other tax adjustments
(99.1)
(49.2)
Income tax expense excluding tax adjustments
(54.2)
(37.4)
Effective tax rate excluding asbestos, asset impairments,
New Zealand product liability and tax adjustments
21.6%
21.3%
1
US$ Millions |
 29
1
Certain reclassifications have been reflected in the prior period to conform with
current period presentation CASHFLOW
1
FY 2014
FY 2013
EBIT
53.1
29.5
Non-cash items:
Asbestos adjustments
195.8
117.1
Asset impairments
-
16.9
Other non-cash items
65.0
64.7
Net working capital movements
19.0
(34.0)
Cash Generated By Trading Activities
332.9
194.2
Tax payments, net
(11.6)
(83.3)
Change in other non-trading assets and liabilities
4.9
187.9
Change in asbestos-related assets & liabilities
(3.4)
(5.3)
Payment to the AICF
-
(184.1)
Interest paid
-
(0.1)
Net Operating Cash Flow
322.8
109.3
Purchases of property, plant & equipment
(115.4)
(61.1)
Proceeds from sale of property, plant & equipment
0.7
1.4
Acquisition of business
(4.1)
-
Common stock repurchased and retired
(22.1)
-
Dividends paid
(199.1)
(188.5)
Proceeds from issuance of shares
29.3
26.3
Tax benefit from stock options exercised
5.6
3.5
Effect of exchange rate on cash
(3.9)
(2.6)
Movement In Net Cash
13.8
(111.7)
Beginning Net Cash
153.7
265.4
Ending Net Cash
167.5
153.7
US$ Millions |
 30
•
In Q1 FY14, the company completed the purchase of the previously-leased land
and buildings at Carole Park, Brisbane plant and commenced projects to
increase the plant’s production capacity •
The company completed the refurbishment of the Fontana, California location.
Production commenced during Q4 FY14.
•
Capital expenditures for the capacity expansion in Plant City, Florida and
Cleburne, Texas commenced in Q4 FY14
•
Total capital expenditures in the USA and Europe Fibre Cement segment exclude
capital assets of US$4.8 million related to the fibre glass window business
acquisition CAPITAL EXPENDITURE
US$ Millions
FY 2014
FY 2013
% Change
USA and Europe Fibre Cement (including
Research and Development)
76.5
50.4
52
Asia Pacific Fibre Cement
38.9
10.7
Total
115.4
61.1
89 |
 CAPITAL
MANAGEMENT FRAMEWORK 1
Adjusted EBITDA is defined as EBITDA excluding asbestos
31
Objectives
•
Strategy
•
Reinvest
in
R&D
and
capacity
expansion
projects
required
for
growth;
•
Provide consistent dividend payments within the ordinary dividend payout ratio of
50-70% of net operating profit excluding asbestos; and
•
Continue to execute the share buy back program and to consider further payment of
special dividends
Framework
•
Manage capital efficiency within a prudent and rigorous financial policy
•
Strong cash flow generation expected to continue, and grow
To optimize JHI plc capital structure with a view towards a target net debt
position in the range of 1-2 times Adjusted EBITDA
Ensure sufficient liquidity to support financial obligations and execute
strategy Minimize
cost
of
capital
while
taking
into
consideration
current
and
future
industry,
market and economic risks and conditions
Fund capital expenditure and reinvestment in the Company
Maintain flexibility to capitalize on market and strategic opportunities
|
 32
CAPITAL MANAGEMENT AND DIVIDENDS
•
For the share buyback plan announced in May 2013, the Company repurchased a total
of 2,610,214 shares of its common stock, with an aggregate cost of A$34.3
million (US$31.2 million), at an average market price of A$13.14
(US$11.94) •
Today, the company announced a new share buyback program to acquire up to 5% of its
issued capital during the following 12 months
Share Buybacks
•
Special dividends declared of US48 cents per security for the full year ended 31
March 2014 compared to special dividends declared of US24 cents per security
in the prior corresponding period •
Ordinary dividends declared of US40 cents per security for the full year ended 31
March 2014 compared to ordinary dividends declared of US18 cents per
security in the prior corresponding period •
As previously announced and including FY2014, dividend payout ratio increased from
between 30% and 50% to between 50% and 70% of annual NOPAT excluding
asbestos adjustments •
Declared in US currency and will be paid on 08 August 2014 with a record date of
12 June 2014 •
The company announced today a FY2014 special dividend of US20.0 cents per security
and a second half ordinary dividend of US32.0 cents per security
Dividends |
 33
DEBT
At 31 March 2014:
•
The company added US$150.0 million of facilities after year end to replace and
augment facilities that expired during FY2014
•
Weighted average remaining term of debt facilities is 3.1 years at 22 May 2014, up
from 2.4 years at 31 March 2014
•
James Hardie remains well within its financial debt covenants
•
Net cash of US$167.5 million compared to net cash of US$153.7 million at 31 March
2013 US$ Millions
Total facilities
355.0
Gross debt
-
Cash
167.5
Net cash
167.5
Unutilised facilities and cash
522.5 |
 34
New Zealand Product Liability claims:
•
Since FY02 James Hardie NZ subsidiaries have been joined to product liability
claims that relate to buildings primarily constructed from 1998 to
2004 •
These claims often involve multiple parties and allege losses due to excessive
moisture penetration
•
At 31 March 2014 and 31 March 2013, the total provision for these matters
collectively, net of estimated third-party recoveries was US$12.7
million and US$15.2 million, respectively •
The company recognized an expense of US$1.1 million in the current quarter and
US$1.8 million for
the
full
year
to
reflect
the
movements
in
the
provisions
for
new
and
existing
claims
•
During the full year of the current fiscal year, the company noted an increased
rate of claim resolution resulting in fewer open claims at year end,
substantial reductions in the value of new claims received and fewer new
claims being received than in prior years NZ PRODUCT LIABILITY CLAIMS
|
 35
ASBESTOS COMPENSATION
•
The company anticipates it will make a further contribution of approximately US$113
million to AICF on 1 July 2014. This amount represents 35% of the
company’s free cash flow for financial year 2014, as defined by the
AFFA •
From
the
time
AICF
was
established
in
February
2007,
the
company
has
contributed
A$599.2 million to the fund
•
Total
contributions
of
US$184.1
million
were
made
to
AICF
during
FY2013
from
the
company’s FY2012 free cashflow. No contributions were made from FY2013
free cashflow in accordance with the terms of the AFFA, and the arrangements
agreed with the NSW Government and AICF
•
Undiscounted and uninflated central estimate increased to A$1.547 billion from
A$1.345 billion
•
Updated actuarial report completed as at 31 March 2014
Summary |
 36
FUNDING ARRANGEMENTS
Large mesothelioma claims increased
frequency relative to prior year
Claims average awards tracking
considerably better than expectations
Claims reporting for mesothelioma –
20% higher than previous year, 23%
higher than expectation. Other
disease types in line with
expectations.
The A$176M increase reflects $294M
increase arising from actuarial valuation
assumption changes, and A$117M
reduction from roll-forward and higher
discount rates
Change in estimate –
NPV is now
A$1,870M. Increased from A$1,694M at
31 March 2014
Summary
A$ millions (except where stated)
31-Mar-14
31-Mar-13
Central Estimate –
Undiscounted and Uninflated
1,546.6
1,345.0
35.2
36.2
23.3
21.8
(15.4)
(128.1)
1.8
1.8
(529.5)
(459.3)
1,062.1
817.4
0.9220
1.0420
979.2
851.6
Net post-tax unfunded accounting liability in A$
Exchange rate US$ per A$1.00
Net post-tax unfunded accounting liability in US$ millions
Provision for claims handling costs of AICF
Other US GAAP adjustments
Net assets of AICF
Contributions for asbestos research and education
Effect of tax |
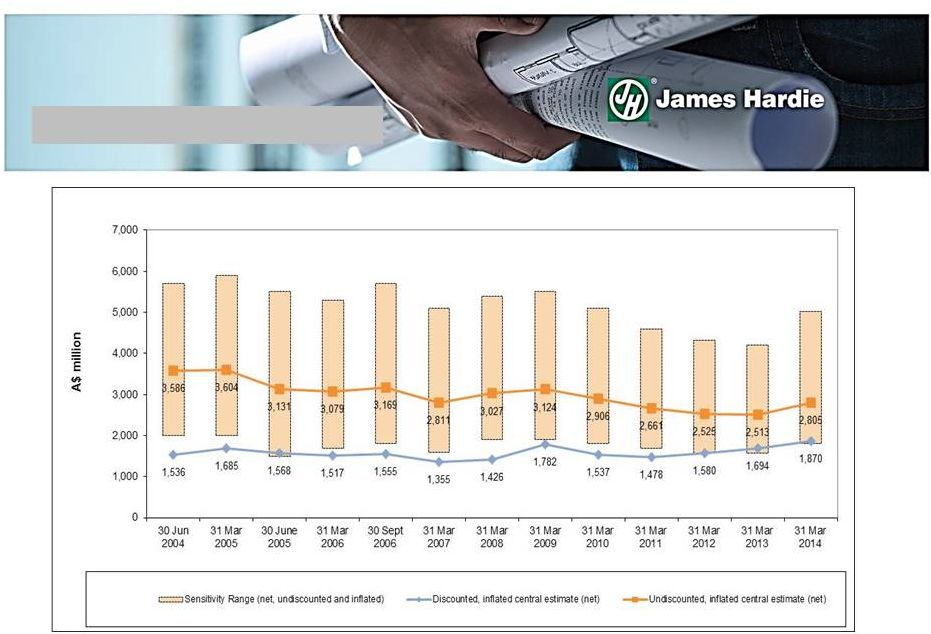 37
UPDATED ACTUARIAL ESTIMATE |
 38
*
FY 2014 Actuarial Estimate as of 31 March 2013
Net claims paid full year FY2014:
NET CLAIMS
Claims Paid
131.4
117.3
112.6
Legal Costs
9.0
14.1
8.7
Insurance and cross claim recoveries
(27.5)
(17.6)
(35.7)
Total net claims costs
112.9
113.8
85.6
A$ Millions
AICF
Full Year
2013
AICF
Full Year
2014
KPMG
Actuarial
Estimate For
FY 2014*
•
While total net claim payments were up 32%, they were in line with the actuarial
estimate from 31 March 2013 |
 39
•
Net
operating
profit
excluding
asbestos,
asset
impairments,
ASIC
expenses,
New
Zealand
product
liability and tax adjustments was US$45.3 million and US$197.2 million, for the
quarter and full year ended 31 March 2014, respectively
•
The full year results reflected:
•
Higher sales volumes and average net sales price in local currencies in both the
USA and Europe Fibre Cement and Asia Pacific Fibre Cement segments
•
Higher EBIT margins, with USA and Europe Fibre Cement excluding asset impairments,
up 3.9 percentage points to 21.0% and Asia Pacific Fibre Cement EBIT margin
excluding New Zealand product liability up 2.3 percentage points to
22.6% •
The commencement of production at the Fontana, California plant and ongoing
investment in production capacity expansion at the Cleburne, Texas and
Plant City, Florida plants •
Second half ordinary dividends declared of US32.0 cents per security and FY2014
special dividend declared of US20.0 cents per security.
•
Announced a new share buyback program to acquire up to 5% of issued capital during
the FY 2015 •
In
line
with
previously
announced
capital
management
objectives,
increased
total
credit
facilities
to
$505
million
to
fund
capital
expenditures
and
FY2015
shareholder
returns
SUMMARY |
 QUESTIONS |
 APPENDIX |
 42
FINANCIAL SUMMARY
US$ Millions
% Change
% Change
Net Sales
USA and Europe Fibre Cement
288.2
$
236.8
$
22
1,127.6
$
951.4
$
19
Asia Pacific Fibre Cement
88.2
90.0
(2)
366.2
369.9
(1)
Total Net Sales
376.4
$
326.8
$
15
1,493.8
$
1,321.3
$
13
EBIT -
US$ Millions
USA and Europe Fibre Cement
57.2
$
37.8
$
51
237.0
$
162.5
$
46
Asia Pacific Fibre Cement
18.4
16.7
10
82.9
74.9
11
Research & Development
(6.4)
(6.9)
7
(24.4)
(26.0)
6
General corporate costs excluding
asbestos and ASIC expenses
(11.8)
(10.6)
(11)
(42.7)
(30.4)
(41)
Total EBIT excluding asbestos, asset
imparments, ASIC expenses and
New Zealand product liability
57.4
$
37.0
$
55
252.8
$
181.0
$
40
Net interest expense excluding AICF
interest income
(0.9)
(1.3)
31
(4.0)
(4.6)
13
Other income
1.2
0.6
2.6
1.8
44
Income tax expense excluding tax
adjustments
(12.4)
(5.6)
(54.2)
(37.4)
(45)
Net operating profit excluding
asbestos, asset impairments, ASIC
expenses, New Zealand product
liability and tax adjustments
45.3
$
30.7
$
48
197.2
$
140.8
$
40
Q4 '14
Q4 '13
FY 2014
FY 2013
2
1 Excludes asset impairments charges of US$11.1
million and US$16.9 million in the 4 quarter and full year of
the prior fiscal year, respectively.
2 Asia Pacific Fibre Cement EBIT excludes New Zealand
product liability expenses of US$1.1 million and expense of nil in Q4 ‘14 and Q4 ‘13,
respectively and US$1.8 million and US$13.2 million in FY 2014 and FY
2013, respectively. th
1 |
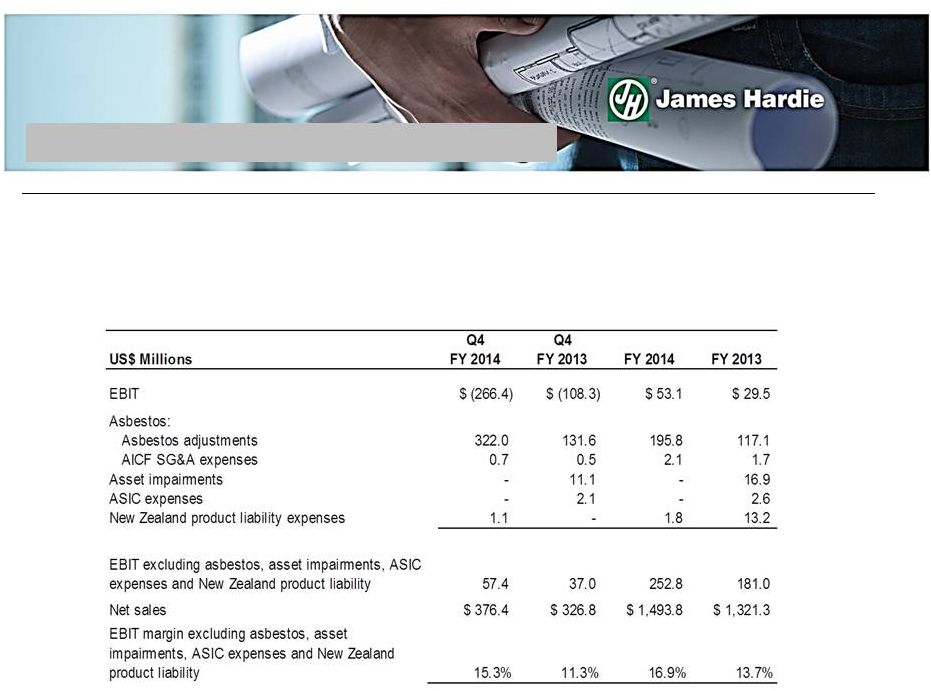
 1
Excludes asbestos adjustments, asset impairments, AICF SG&A expenses, AICF
interest income, ASIC expenses, New Zealand product 2
Excludes asbestos adjustments, asset impairments, AICF SG&A expenses, New
Zealand product liability and ASIC expenses 3
Includes restricted cash set aside for AFFA
43
KEY RATIOS
FY 2014
FY 2013
FY 2012
EPS (Diluted)
44c
32c
33c
Dividend Paid per share
88c
42c
4c
Return on Shareholders’
Funds
16.6%
10.4%
11.2%
Return
on
Capital
Employed
28.0%
20.4%
21.0%
EBIT/ Sales (EBIT margin)
16.9%
13.7%
15.7%
Gearing Ratio
(19.4)%
(12.9)%
(24.4)%
Net Interest Expense Cover
63.2x
39.3x
23.8x
Net Interest Paid Cover
-
-
24.5x
Net Debt Payback
-
-
-
1
1, 3
2, 3
1
2
2
3
2
liability and tax adjustments |
 44
1
Excludes asset impairments charges of US$16.9 million in the prior fiscal
year 2
Excludes New Zealand product expenses of US$1.8 million and expense US$13.2 million
in FY2014 and FY2013, respectively 3
USA
and
Europe
Fibre
Cement
depreciation
and
amortisation
in
4
Quarter
of
FY
2013
includes
a
favourable
accounting
adjustment
which
is
not
expected
to
recur
in
the
future,
related
to
the
company’s
estimated
useful
life
for
certain
production
assets
EBITDA –
FULL YEAR
US$ Millions
FY 2014
FY 2013
% Change
EBIT
USA and Europe Fibre Cement
237.0
162.5
46
Asia Pacific Fibre Cement
82.9
74.9
11
Research & Development
(24.4)
(26.0)
6
General corporate excluding asbestos and ASIC expenses
(42.7)
(30.4)
(41)
Depreciation and Amortisation
USA and Europe Fibre Cement
53.1
51.4
3
Asia
Pacific
Fibre
Cement
8.3
9.8
(15)
Total EBITDA excluding asbestos, asset imparments,
ASIC expenses and New Zealand product liability
314.2
242.2
30
Asbestos adjustments
(195.8)
(117.1)
(67)
AICF SG&A expenses
(2.1)
(1.7)
(24)
Asset impairments
-
(16.9)
ASIC expenses
-
(2.6)
New Zealand product liability expenses
(1.8)
(13.2)
86
Total EBITDA
114.5
90.7
26
1
3
th
2 |
 45
1
In accordance with Amended and Restated Final Funding Agreement
ASBESTOS FUND
A$ millions
AICF
cash
and
investments
-
31
March
2013
128.1
Insurance and cross-claim recoveries
27.5
Interest and investment income
4.0
Proceeds from loan facility
50.6
Claims paid
(140.4)
Operating costs
(5.0)
Other
0.7
AICF
cash
and
investments
-
31
March
2014
65.5 |
 This Management Presentation forms part of a package of information about the
company's results. It should be read in conjunction with the other parts of
this package, including the Management’s Analysis of Results, Media Release and
Condensed Consolidated Financial Statements
Definitions
Non-financial Terms
ABS
–
Australian Bureau of Statistics
AFFA
–
Amended and Restated Final Funding Agreement
AICF
–
Asbestos Injuries Compensation Fund Ltd
ASIC
–
Australian Securities and Investments Commission
ATO
–
Australian Taxation Office
NBSK –
Northern Bleached Soft Kraft; the company's benchmark grade of pulp
Legacy
New
Zealand
product
liability
benefit
(expenses)
(“New
Zealand
product
liability”)
–
Expenses
arising
from
defending and resolving claims in New Zealand that allege poor building design,
inadequate certification of plans, inadequate construction review and
compliance certification and deficient work by sub-contractors 46
ENDNOTES |
 Financial
Measures
–
US
GAAP
equivalents
This document contains financial statement line item descriptions that are
considered to be non-US GAAP, but are consistent with those used by
Australian companies. Because the company prepares its consolidated financial
statements under US GAAP, the following table cross-references each non-US
GAAP line item description, as used in Management’s Analysis of Results
and Media Release, to the equivalent US GAAP financial statement line item
description used in the company's condensed consolidated financial
statements: 47
Management's Analysis of Results and
Consolidated Statements of Operations
Media Release
and Other Comprehensive Income (Loss)
(US GAAP)
Net sales
Net sales
Cost of goods sold
Cost of goods sold
Gross profit
Gross profit
Selling, general and administrative expenses
Selling, general and administrative expenses
Research and development expenses
Research and development expenses
Asbestos adjustments
Asbestos adjustments
EBIT
*
Operating income (loss)
Net interest income (expense)*
Sum of interest expense and interest income
Other income (expense)
Other income (expense)
Operating profit (loss) before income taxes*
Income (loss) before income taxes
Income tax (expense) benefit
Income tax (expense) benefit
Net operating profit (loss)*
Net income (loss)
*- Represents non-U.S. GAAP descriptions used by Australian companies.
ENDNOTES (CONTINUED) |
 EBIT
margin –
EBIT margin is defined as EBIT as a percentage of net sales
Sales Volumes
mmsf
–
million
square
feet,
where
a
square
foot
is
defined
as
a
standard
square
foot
of
5/16”
thickness
msf
–
thousand
square
feet,
where
a
square
foot
is
defined
as
a
standard
square
foot
of
5/16”
thickness
Financial Ratios
Gearing
ratio
–
Net
debt
(cash)
divided
by
net
debt
(cash)
plus
shareholders’
equity
Net interest expense cover
–
EBIT divided by net interest expense (excluding loan establishment fees)
Net
interest
paid
cover
–
EBIT
divided
by
cash
paid
during
the
period
for
interest,
net
of
amounts
capitalised
Net debt payback
–
Net debt (cash) divided by cash flow from operations
Net debt (cash)
–
Short-term and long-term debt less cash and cash equivalents
Return on capital employed
–
EBIT divided by gross capital employed
48
ENDNOTES (CONTINUED) |
 49
NON-US GAAP FINANCIAL MEASURES
–
EBIT and EBIT margin excluding asbestos, asset impairments, ASIC
expenses and New Zealand product liability
EBIT
and
EBIT
margin
excluding
asbestos,
asset
impairments,
ASIC
expenses
and
New
Zealand
product
liability
are
not
measures
of
financial
performance
under
US
GAAP
and
should
not
be
considered
to
be
more
meaningful
than
EBIT
and
EBIT
margin.
Management
has
included
these
financial
measures
to
provide
investors
with
an
alternative
method
for
assessing
its
operating
results
in
a
manner
that
is
focussed
on
the
performance
of
its
ongoing
operations
and
provides
useful
information
regarding
its
financial
condition
and
results
of
operations.
Management
uses
these
non-US
GAAP
measures
for
the
same
purposes |
 Net
operating
profit
excluding
asbestos,
asset
impairments,
ASIC
expenses,
New
Zealand
product
liability
and
tax adjustments
–
Net operating profit excluding asbestos, asset impairments, ASIC expenses, New
Zealand product liability and tax adjustments is not a measure of financial
performance under US GAAP and should not be considered to be more meaningful
than net operating profit. Management has included this financial measure to provide investors with
an alternative method for assessing its operating results in a manner that is
focussed on the performance of its ongoing operations. Management uses this
non-US GAAP measure for the same purposes 50
NON-US GAAP FINANCIAL MEASURES (CONTINUED)
Q4
Q4
US$ Millions
FY 2014
FY 2013
FY 2014
FY 2013
Net operating (loss) profit
$ (186.8)
$ (69.5)
$ 99.5
$ 45.5
Asbestos:
Asbestos adjustments
322.0
131.6
195.8
117.1
AICF SG&A expenses
0.7
0.5
2.1
1.7
AICF interest income
(0.5)
(1.4)
(2.9)
(7.0)
-
Asset impairments
-
11.1
-
16.9
ASIC expenses
-
2.1
-
2.6
New Zealand product liability expenses
1.1
-
1.8
13.2
Asbestos and other tax adjustments
(91.2)
(43.7)
(99.1)
(49.2)
Net operating profit excluding asbestos, asset
impairments, ASIC expenses, New Zealand
product liability and tax adjustments
$ 45.3
$ 30.7
$ 197.2
$ 140.8 |
 Diluted
earnings
per
share
excluding
asbestos,
asset
impairments,
ASIC
expenses,
New
Zealand
product
liability and tax adjustments
–
Diluted earnings per share excluding asbestos, asset impairments, ASIC expenses,
New Zealand product liability and tax adjustments is not a measure of
financial performance under US GAAP and should not be considered to be more
meaningful than diluted earnings per share. Management has included this financial measure
to provide investors with an alternative method for assessing its operating results
in a manner that is focussed on the performance of its ongoing operations.
Management uses this non-US GAAP measure for the same purposes 51
NON-US GAAP FINANCIAL MEASURES (CONTINUED)
Q4
Q4
US$ Millions
FY 2014
FY 2013
FY 2014
FY 2013
Net operating profit excluding asbestos, asset
impairments, ASIC expenses, New Zealand
product liability and tax adjustments
$ 45.3
$ 30.7
$ 197.2
$ 140.8
Weighted average common shares outstanding -
Diluted (millions)
445.8
442.6
444.6
440.6
Diluted earnings per share excluding asbestos,
asset impairments, ASIC expenses, New
Zealand product liability and tax adjustments
(US cents)
10
7
44
32 |
 Effective
tax
rate
excluding
asbestos,
asset
impairments,
New
Zealand
product
liability
and
tax
adjustments
–
Effective tax rate on earnings excluding asbestos, asset impairments, New Zealand
product liability and tax adjustments is not a measure of financial
performance under US GAAP and should not be considered to be more meaningful than
effective tax rate. Management has included this financial measure to provide
investors with an alternative method for assessing its operating results in
a manner that is focussed on the performance of its ongoing operations. Management
uses this non-US GAAP measure for the same purposes
52
NON-US GAAP FINANCIAL MEASURES (CONTINUED)
Q4
Q4
US$ Millions
FY 2014
FY 2013
FY 2014
FY 2013
Operating (loss) profit before income taxes
$ (265.6)
$ (107.6)
$ 54.6
$ 33.7
Asbestos:
Asbestos adjustments
322.0
131.6
195.8
117.1
AICF SG&A expenses
0.7
0.5
2.1
1.7
AICF interest income
(0.5)
(1.4)
(2.9)
(7.0)
Asset impairments
-
11.1
-
16.9
New Zealand product liability expenses
1.1
-
1.8
13.2
Operating profit before income taxes excluding asbestos,
asset impairments and New Zealand product liability
$ 57.7
$ 34.2
$ 251.4
$ 175.6
Income tax benefit
78.8
38.1
44.9
11.8
Asbestos-related and other tax adjustments
(91.2)
(43.7)
(99.1)
(49.2)
Income tax expense excluding tax adjustments
(12.4)
(5.6)
(54.2)
(37.4)
Effective tax rate
29.7%
35.4%
82.2%
35.0%
Effective tax rate excluding asbestos, asset impairments,
New Zealand product liability, and tax adjustments
21.5%
16.4%
21.6%
21.3% |
 Adjusted
EBITDA
–
is
not
a
measure
of
financial
performance
under
US
GAAP
and
should
not
be
considered
an
alternative
to,
or
more
meaningful
than,
income
from
operations,
net
income
or
cash
flows
as
defined
by
US
GAAP
or
as
a
measure
of
profitability
or
liquidity.
Not
all
companies
calculate
Adjusted
EBITDA
in
the
same
manner
as
James
Hardie
has
and,
accordingly,
Adjusted
EBITDA
may
not
be
comparable
with
other
companies.
Management
has
included
information
concerning
Adjusted
EBITDA
because
it
believes
that
this
data
is
commonly
used
by
investors
to
evaluate
the
ability
of
a
company's
earnings
from
its
core
business
operations
to
satisfy
its
debt,
capital
expenditure
and
working
capital
requirements
53
NON-US GAAP FINANCIAL MEASURES (CONTINUED)
Q4
Q4
US$ Millions
FY 2014
FY 2013
FY 2014
FY 2013
EBIT
$ (266.4)
$ (108.3)
$ 53.1
$ 29.5
Depreciation and amortisation
15.2
13.2
61.4
61.2
Adjusted EBITDA
$ (251.2)
$ (95.1)
$ 114.5
$ 90.7 |
 General
corporate
costs
excluding
ASIC
expenses,
intercompany
foreign
exchange
gain
and
recovery
of
RCI
legal costs
–
General corporate costs excluding ASIC expenses, intercompany foreign exchange
gain and recovery of RCI legal costs is not a measure of financial
performance under US GAAP and should not be considered to be more
meaningful
than
general
corporate
costs.
Management
has
included
these
financial
measures
to
provide
investors
with
an alternative method for assessing its operating results in a manner that is
focussed on the performance of its ongoing operations and provides useful
information regarding its financial condition and results of operations. Management uses
these non-US GAAP measures for the same purposes
54
NON-US GAAP FINANCIAL MEASURES (CONTINUED)
Q4
Q4
US$ Millions
FY 2013
FY 2013
General corporate costs
$ 11.8
$ 12.7
$ 42.7
$ 33.0
Excluding:
ASIC expenses
-
(2.1)
-
(2.6)
Intercompany foreign exchange gain
-
-
-
5.5
Recovery of RCI legal costs
-
-
-
2.7
General corporate costs excluding ASIC
expenses, intercompany foreign exchange
gain and recovery of RCI legal costs
$ 11.8
$ 10.6
$ 42.7
$ 38.6
FY 2014
FY 2014 |
 Selling,
general
and
administrative
expenses
excluding
New
Zealand
product
liability
–
Selling,
general
and
administrative expenses excluding New Zealand product liability is not a measure of
financial performance under US GAAP and should not be considered to be more
meaningful than selling, general and administrative expenses. Management has
included these financial measures to provide investors with an alternative method for assessing its
operating results in a manner that is focussed on the performance of its ongoing
operations and provides useful information regarding its financial condition
and results of operations. Management uses these non-US GAAP measures
for the same purposes 55
NON-US GAAP FINANCIAL MEASURES (CONTINUED)
Q4
Q4
US$ Millions
FY 2013
FY 2013
Selling, general and administrative expenses
$ 61.9
$ 58.0
$ 224.4
$ 218.6
Excluding:
New Zealand product liability expenses
(1.1)
-
(1.8)
(13.2)
Selling, general and administrative expenses
excluding New Zealand product liability
$ 60.8
$ 58.0
$ 222.6
$ 205.4
Net Sales
$ 376.4
$ 326.8
$ 1,493.8
$ 1,321.3
Selling, general and administrative expenses
as a percentage of net sales
16.4%
17.7%
15.0%
16.5%
Selling, general and administrative expenses
excluding New Zealand product liability as a
percentage of net sales
16.2%
17.7%
14.9%
15.5%
FY 2014
FY 2014 |
 Q4
FY14 MANAGEMENT PRESENTATION 22 May 2014 |