Exhibit 99.6
JH® James Hardie
JH® James
125 years of
Leadership
Determination Innovation
2014 ANNUAL REVIEW
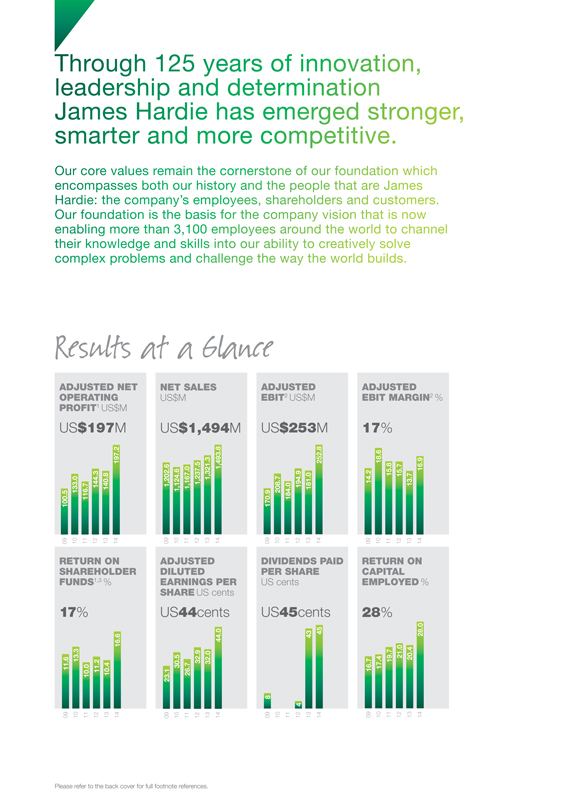
Through 125 years of innovation, leadership and determination James Hardie has emerged stronger, smarter and more competitive. Our core values remain the cornerstone of our foundation which encompasses both our history and the people that are James Hardie: the company’s employees, shareholders and customers. Our foundation is the basis for the company vision that is now enabling more than 3,100 employees around the world to channel their knowledge and skills into our ability to creatively solve complex problems and challenge the way the world builds. Results at a Glance ADJUSTED NET OPERATING PROFIT1 US$M US$197M 100.5 133.0 116.7 144.3 140.8 197.2 09 10 11 12 13 14 NET SALES US$M US$1,494M 1,202.6 1,124.6 1,167.0 1,237.5 1,321.3 1,493.8 09 10 11 12 13 14 ADJUSTED EBIT2 US$M US$253M 170.9 208.7 184.0 194.9 181.0 252.8 09 10 11 12 13 14 ADJUSTED EBIT MARGIN2 % 17% 14.2 18.6 15.8 15.7 13.7 16.9 09 10 11 12 13 14 RETURN ON SHAREHOLDER FUNDS1,3 % 17% 09 11.6 10 13.3 11 10.0 12 11.2 13 10.4 14 16.6 ADJUSTED DILUTED EARNINGS PER SHARE US cents US44cents 23.1 30.5 26.7 32.9 32.0 44.0 09 10 11 12 13 14 DIVIDENDS PAID PER SHARE US cents US45cents 8 4 43 45 09 10 11 12 13 14 RETURN ON CAPITAL EMPLOYED % 28% 09 10 11 12 13 14 16.7 17.4 19.7 21.0 20.4 28.0 Please refer to the back cover for full footnote references.
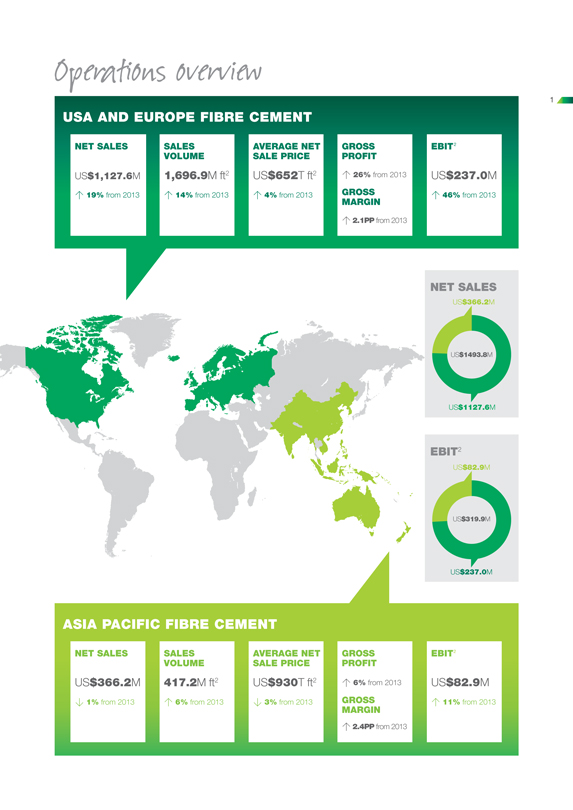
Operations overview 1 USA AND EUROPE FIBRE CEMENT NET SALES US$1,127.6M 19% from 2013 SALES VOLUME 1,696.9M ft2 14% from 2013 AVERAGE NET SALE PRICE US$652T ft2 4% from 2013 GROSS PROFIT 26% from 2013 GROSS MARGIN 2.1PP from 2013 EBIT2 US$237.0M 46% from 2013 NET SALES US$366.2M US$1493.8M US$1127.6M EBIT2 US$82.9M US$319.9M US$237.0M ASIA PACIFIC FIBRE CEMENT NET SALES SALES VOLUME AVERAGE NET SALE PRICE GROSS PROFIT US$366.2M 417.2M ft2 US$930T ft2 6% from 2013 1% from 2013 6% from 2013 3% from 2013 GROSS MARGIN 2.4PP from 2013 EBIT2 US$82.9M 11% from 2013
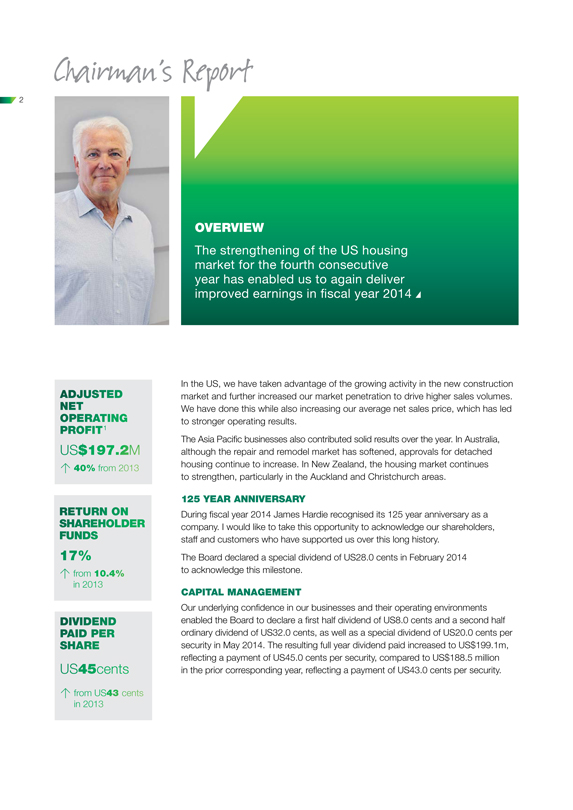
Chairman’s Report 2 OVERVIEW The strengthening of the US housing market for the fourth consecutive year has enabled us to again deliver improved earnings in fiscal year 2014 ADJUSTED NET OPERATING PROFIT1 US$197.2M 40% from 2013 RETURN ON SHAREHOLDER FUNDS 17% from 10.4% in 2013 DIVIDEND PAID PER SHARE US45cents from US43 cents in 2013 In the US, we have taken advantage of the growing activity in the new construction market and further increased our market penetration to drive higher sales volumes. We have done this while also increasing our average net sales price, which has led to stronger operating results. The Asia Pacific businesses also contributed solid results over the year. In Australia, although the repair and remodel market has softened, approvals for detached housing continue to increase. In New Zealand, the housing market continues to strengthen, particularly in the Auckland and Christchurch areas. 125 YEAR ANNIVERSARY During fiscal year 2014 James Hardie recognised its 125 year anniversary as a company. I would like to take this opportunity to acknowledge our shareholders, staff and customers who have supported us over this long history. The Board declared a special dividend of US28.0 cents in February 2014 to acknowledge this milestone. CAPITAL MANAGEMENT Our underlying confidence in our businesses and their operating environments enabled the Board to declare a first half dividend of US8.0 cents and a second half ordinary dividend of US32.0 cents, as well as a special dividend of US20.0 cents per security in May 2014. The resulting full year dividend paid increased to US$199.1m, reflecting a payment of US45.0 cents per security, compared to US$188.5 million in the prior corresponding year, reflecting a payment of US43.0 cents per security.
3
The ordinary dividend reflects our commitment to
provide consistent dividend payments within the payout ratio of 50 to 70% of net operating profit, excluding asbestos adjustments. The special dividend represents amounts that were not utilised in the company’s share buyback program which
expired in May 2014.
The company also announced a new share buyback program in May 2014 to acquire up to 5% of its issued capital within the 12 month period to May
2015. To the extent the company does not undertake share buy backs, the Board may consider further distributions to shareholders during fiscal year 2015, as part of its capital management strategy.
We have also confirmed our commitment to lift our capital expenditure to an average of approximately US$200 million per year, over the next three years, to further capitalise on
the projected growth in the US housing market and our anticipated market share growth across all the geographies in which we operate.
Additionally on 1 July
2014, James Hardie will contribute US$113.0 million to the Asbestos Injuries Compensation Fund. This amount represents 35% of the company’s free cash flow for fiscal year 2014, which the company is obliged to contribute as part of its
commitment under the Amended and Restated Final Funding Agreement.
Including this contribution James Hardie has provided over A$1 Billion towards asbestos
compensation since 2001.
ANNUAL GENERAL MEETING
This year’s AGM will be
held on Friday, 15 August 2014, in Dublin, Ireland.
Shareholders can participate via a teleconference. Details are contained in the Notice of Meeting for the
2014 AGM.
CONCLUSION
Under the leadership of CEO, Louis Gries, and the
management team, the company has delivered a stable operating result and is strongly positioned to take advantage of the anticipated upswing in our key product segments and markets.
Michael Hammes
Under the leadership of CEO, Louis Gries, and the management team, the company
has delivered a stable operating result and is strongly positioned to take advantage of the anticipated upswing in our key product segments and markets.
CEO’s Report
4
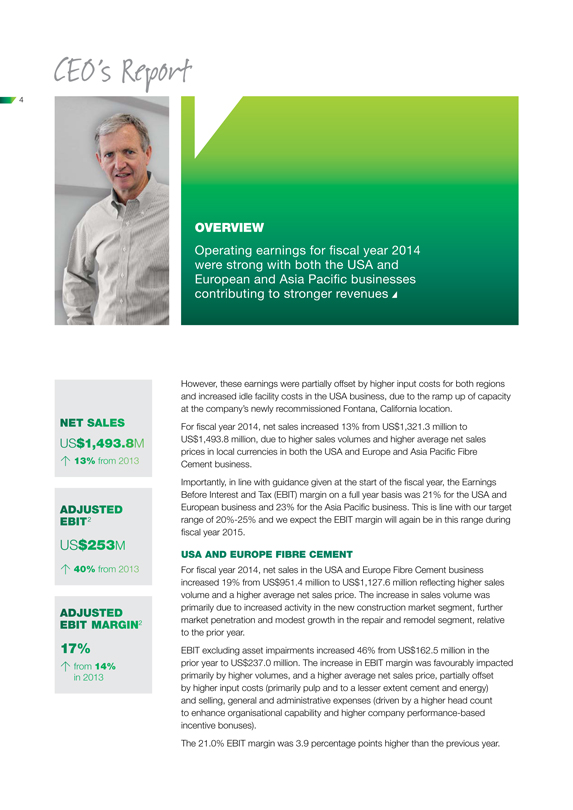
OVERVIEW
Operating earnings for fiscal year 2014 were strong with both the USA and European
and Asia Pacific businesses contributing to stronger revenues
However, these earnings were partially offset by higher input costs for both regions and increased
idle facility costs in the USA business, due to the ramp up of capacity at the company’s newly recommissioned Fontana, California location.
NET SALES
US$1,493.8M 13% from 2013
For fiscal year 2014, net sales increased 13% from US$1,321.3 million to US$1,493.8 million, due to higher sales volumes and higher
average net sales prices in local currencies in both the USA and Europe and Asia Pacific Fibre Cement business.
ADJUSTED EBIT2 US$253M 40% from 2013
Importantly, in line with guidance given at the start of the fiscal year, the Earnings Before Interest and Tax (EBIT) margin on a full year basis was 21% for the USA and European
business and 23% for the Asia Pacific business. This is line with our target range of 20%-25% and we expect the EBIT margin will again be in this range during fiscal year 2015.
USA AND EUROPE FIBRE CEMENT
For fiscal year 2014, net sales in the USA and Europe Fibre Cement
business increased 19% from US$951.4 million to US$1,127.6 million reflecting higher sales volume and a higher average net sales price. The increase in sales volume was primarily due to increased activity in the new construction market segment,
further market penetration and modest growth in the repair and remodel segment, relative to the prior year.
ADJUSTED EBIT MARGIN2
17% from 14% in 2013
EBIT excluding asset impairments increased 46% from US$162.5 million in
the prior year to US$237.0 million. The increase in EBIT margin was favourably impacted primarily by higher volumes, and a higher average net sales price, partially offset by higher input costs (primarily pulp and to a lesser extent cement and
energy) and selling, general and administrative expenses (driven by a higher head count to enhance organisational capability and higher company performance-based incentive bonuses).
The 21.0% EBIT margin was 3.9 percentage points higher than the previous year.
5
ASIA PACIFIC FIBRE CEMENT
For fiscal year 2014, the Asia Pacific Fibre Cement business contributed higher operating earnings. In US dollars, net sales decreased 1% to US$366.2 million compared with US$369.9
million in the prior year though this was unfavourably impacted by a 10% depreciation in the Australian dollar/US dollar average exchange rate.
In Australian
dollars, Asia Pacific net sales increased compared to the prior year due to an increase in sales volume, driven by market growth and market penetration, and a higher average net sales price. In Australia, net sales increased primarily due to higher
sales volumes and a higher average net sales price, however this was constrained by a reduction in repair and remodel activity, relative to the prior year. In New Zealand, net sales reflected the continued increase in activity in the New Zealand
housing market and a modest average net sales price increase compared to the prior year. EBIT, excluding New Zealand weathertightness claim liability, increased 11% from US$74.9 million to US$82.9 million. In Australian dollars, EBIT, excluding New
Zealand weathertightness claim liability, increased 21% compared to the prior year, due to an increase in the Australian dollar average net sales price, and a decrease in production costs driven lower by economies of scale achieved through a 6%
increase in volume.
The 23% EBIT margin, excluding New Zealand weathertightness claim liability, was 2.3 percentage points higher than the previous year.
CAPACITY EXPANSION
To take advantage of the improving operating environment
and to grow market share the company is proceeding with its plans to increase production capacity. This includes the reopening of our Fontana, California location, commencement of capacity expansion projects at our Cleburne, Texas and Plant City,
Florida locations and the construction of a new manufacturing line at our Carole Park, Queensland location.
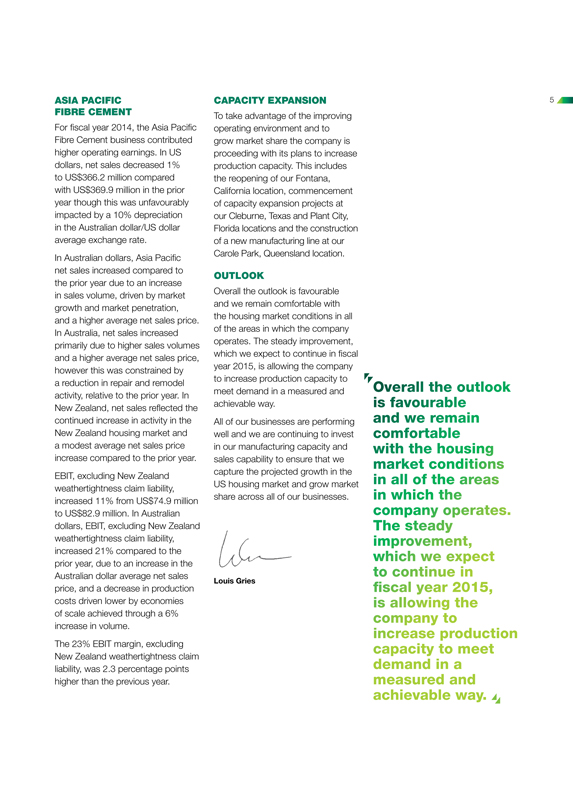
OUTLOOK
Overall the outlook is favourable and we remain comfortable with the housing market conditions in all of the areas in which the company operates. The steady improvement, which we
expect to continue in fiscal year 2015, is allowing the company to increase production capacity to meet demand in a measured and achievable way.
All of our
businesses are performing well and we are continuing to invest in our manufacturing capacity and sales capability to ensure that we capture the projected growth in the US housing market and grow market share across all of our businesses.
Louis Gries
“Overall the outlook is favourable and we remain comfortable with the housing
market conditions in all of the areas in which the company operates. The steady improvement, which we expect to continue in fiscal year 2015, is allowing the company to increase production capacity to meet demand in a measured and achievable
way.”
6 Sustainability Report
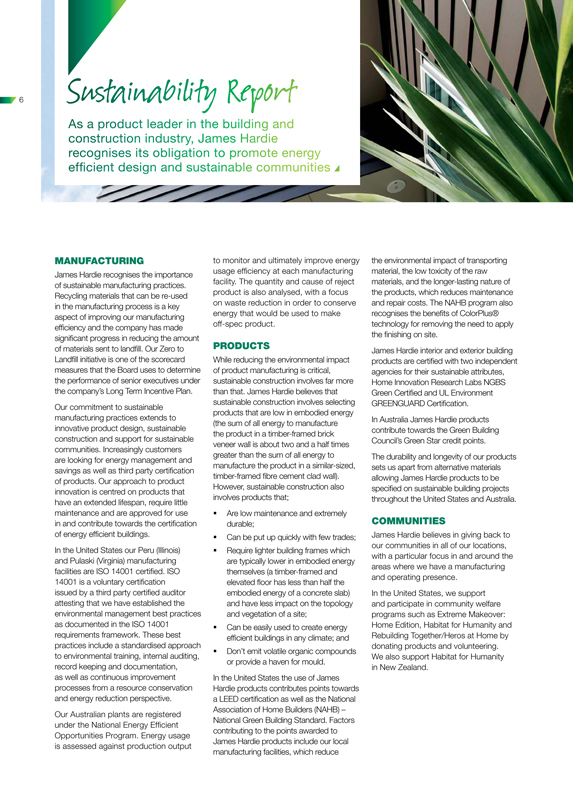
As a product leader in the
building and construction industry, James Hardie recognises its obligation to promote energy efficient design and sustainable communities
MANUFACTURING
James Hardie recognises the importance of sustainable manufacturing practices. Recycling materials that can be re-used in the manufacturing process is a key aspect of improving our
manufacturing efficiency and the company has made significant progress in reducing the amount of materials sent to landfill. Our Zero to Landfill initiative is one of the scorecard measures that the Board uses to determine the performance of senior
executives under the company’s Long Term Incentive Plan.
Our commitment to sustainable manufacturing practices extends to innovative product design,
sustainable construction and support for sustainable communities. Increasingly customers are looking for energy management and savings as well as third party certification of products. Our approach to product innovation is centred on products that
have an extended lifespan, require little maintenance and are approved for use in and contribute towards the certification of energy efficient buildings.
In the
United States our Peru (Illinois) and Pulaski (Virginia) manufacturing facilities are ISO 14001 certified. ISO 14001 is a voluntary certification issued by a third party certified auditor attesting that we have established the environmental
management best practices as documented in the ISO 14001 requirements framework. These best practices include a standardised approach to environmental training, internal auditing, record keeping and documentation, as well as continuous improvement
processes from a resource conservation and energy reduction perspective.
Our Australian plants are registered under the National Energy Efficient Opportunities
Program. Energy usage is assessed against production output to monitor and ultimately improve energy usage efficiency at each manufacturing facility. The quantity and cause of reject product is also analysed, with a focus on waste reduction in order
to conserve energy that would be used to make off-spec product.
PRODUCTS
While reducing the environmental impact of product manufacturing is critical, sustainable construction involves far more than that. James Hardie believes that
sustainable construction involves selecting products that are low in embodied energy (the sum of all energy to manufacture the product in a timber-framed brick veneer wall is about two and a half times greater than the sum of all energy to
manufacture the product in a similar-sized, timber-framed fibre cement clad wall).
However, sustainable construction also involves products that;
Are low maintenance and extremely durable;
Can be put up quickly with few trades;
Require lighter building frames which are typically lower in embodied energy themselves (a timber-framed and elevated floor has less than half the embodied energy of a concrete
slab) and have less impact on the topology and vegetation of a site;
Can be easily used to create energy efficient buildings in any climate; and
Don’t emit volatile organic compounds or provide a haven for mould.
In the United States
the use of James Hardie products contributes points towards a LEED certification as well as the National Association of Home Builders (NAHB) – National Green Building Standard. Factors contributing to the points awarded to James Hardie products
include our local manufacturing facilities, which reduce the environmental impact of transporting material, the low toxicity of the raw materials, and the longer-lasting nature of the products, which reduces maintenance and repair costs. The NAHB
program also recognises the benefits of ColorPlus® technology for removing the need to apply the finishing on site.
James Hardie interior and exterior building
products are certified with two independent agencies for their sustainable attributes, Home Innovation Research Labs NGBS Green Certified and UL Environment GREENGUARD Certification.
In Australia James Hardie products contribute towards the Green Building Council’s Green Star credit points. The durability and longevity of our products sets us apart from
alternative materials allowing James Hardie products to be specified on sustainable building projects throughout the United States and Australia.
COMMUNITIES
James Hardie believes in giving back to our communities in all of our locations, with a particular focus in and around the areas where we have a manufacturing and
operating presence.
In the United States, we support and participate in community welfare programs such as Extreme Makeover: Home Edition, Habitat for Humanity and
Rebuilding Together/Heros at Home by donating products and volunteering. We also support Habitat for Humanity in New Zealand.
Diversity Report
James Hardie recognises the value
of having a workforce that reflects the diverse communities and markets in which we operate and do business
DIVERSITY
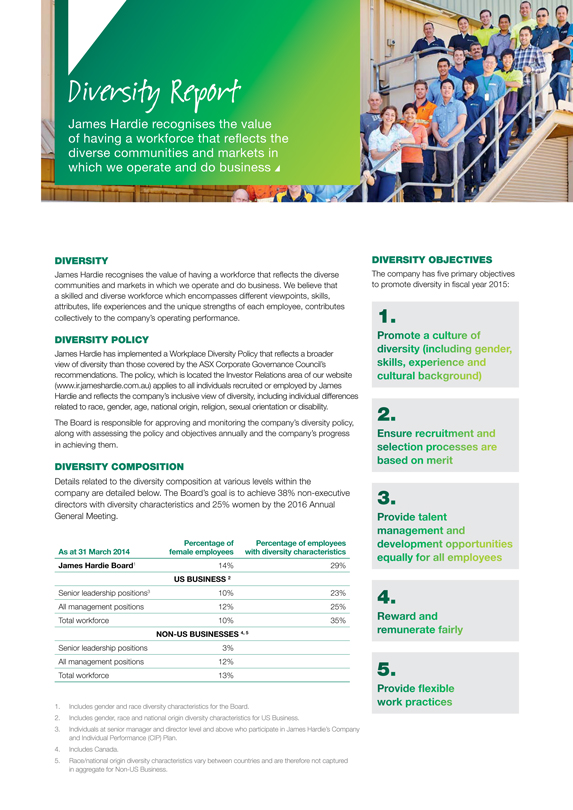
James Hardie recognises the value of having a workforce that reflects the diverse communities and markets in which we operate and do business. We believe that a skilled and diverse
workforce which encompasses different viewpoints, skills, attributes, life experiences and the unique strengths of each employee, contributes collectively to the company’s operating performance.
DIVERSITY POLICY
James Hardie has implemented a Workplace Diversity Policy that reflects a
broader view of diversity than those covered by the ASX Corporate Governance Council’s recommendations. The policy, which is located the Investor Relations area of our website (www.ir.jameshardie.com.au) applies to all individuals recruited or
employed by James Hardie and reflects the company’s inclusive view of diversity, including individual differences related to race, gender, age, national origin, religion, sexual orientation or disability. The Board is responsible for approving
and monitoring the company’s diversity policy, along with assessing the policy and objectives annually and the company’s progress in achieving them.
DIVERSITY COMPOSITION
Details related to the diversity composition at various
levels within the company are detailed below. The Board’s goal is to achieve 38% non-executive directors with diversity characteristics and 25% women by the 2016 Annual General Meeting.
As at 31 March 2014
Percentage of female employees
Percentage of employees with diversity characteristics
James Hardie Board1 14% 29%
US BUSINESS 2
Senior leadership positions3 10% 23%
All management positions 12% 25%
Total workforce 10% 35%
NON-US BUSINESSES 4, 5
Senior leadership positions 3%
All management positions 12%
Total workforce 13%
1. Includes gender and race diversity characteristics for the Board.
2. Includes gender, race
and national origin diversity characteristics for US Business.
3. Individuals at senior manager and director level and above who participate in James Hardie’s
Company and Individual Performance (CIP) Plan.
4. Includes Canada.
5.
Race/national origin diversity characteristics vary between countries and are therefore not captured in aggregate for Non-US Business.
DIVERSITY OBJECTIVES
The company has five primary objectives to promote diversity in fiscal year 2015:
1. Promote a culture of diversity (including gender, skills, experience and cultural background)
2. Ensure recruitment and selection processes are based on merit
3. Provide
talent management and development opportunities equally for all employees
4. Reward and remunerate fairly
5. Provide flexible work practices
8 Workplace Safety
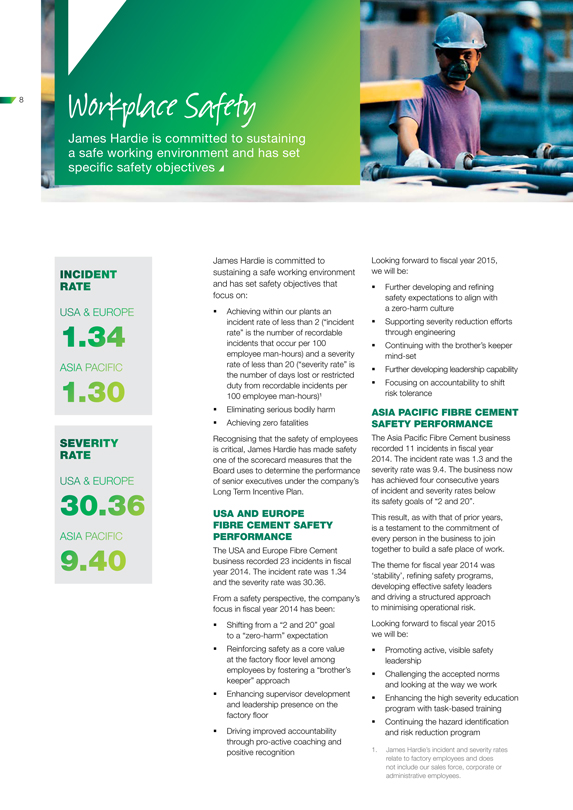
James Hardie is committed to
sustaining a safe working environment and has set specific safety objectives
INCIDENT RATE
USA & EUROPE
1.34
ASIA PACIFIC
1.30
SEVERITY RATE
USA & EUROPE
30.36
ASIA PACIFIC
9.40
James Hardie is committed to sustaining a safe working environment and has set safety
objectives that focus on:
Achieving within our plants an incident rate of less than 2 (“incident rate” is the number of recordable incidents that occur
per 100 employee man-hours) and a severity rate of less than 20 (“severity rate” is the number of days lost or restricted duty from recordable incidents per 100 employee man-hours)1
Eliminating serious bodily harm
Achieving zero fatalities
Recognising that the safety of employees is critical, James Hardie has made safety one of the scorecard measures that the Board uses to determine the performance of senior
executives under the company’s Long Term Incentive Plan.
USA AND EUROPE FIBRE CEMENT SAFETY PERFORMANCE
The USA and Europe Fibre Cement business recorded 23 incidents in fiscal year 2014. The incident rate was 1.34 and the severity rate was 30.36. From a safety perspective, the
company’s focus in fiscal year 2014 has been:
Shifting from a “2 and 20” goal to a “zero-harm” expectation
Reinforcing safety as a core value at the factory floor level among employees by fostering a “brother’s keeper” approach
Enhancing supervisor development and leadership presence on the factory floor
Driving improved
accountability through pro-active coaching and positive recognition
Looking forward to fiscal year 2015, we will be:
Further developing and refining safety expectations to align with a zero-harm culture
Supporting severity reduction efforts through engineering
Continuing with the
brother’s keeper mind-set
Further developing leadership capability
Focusing on accountability to shift risk tolerance
ASIA PACIFIC FIBRE CEMENT
SAFETY PERFORMANCE
The Asia Pacific Fibre Cement business recorded 11 incidents in fiscal year 2014. The incident rate was 1.3 and the severity rate was 9.4. The
business now has achieved four consecutive years of incident and severity rates below its safety goals of “2 and 20”.
This result, as with that of prior
years, is a testament to the commitment of every person in the business to join together to build a safe place of work. The theme for fiscal year 2014 was ‘stability’, refining safety programs, developing effective safety leaders and
driving a structured approach to minimising operational risk.
Looking forward to fiscal year 2015 we will be:
Promoting active, visible safety leadership
Challenging the accepted norms and looking at the
way we work
Enhancing the high severity education program with task-based training
Continuing the hazard identification and risk reduction program
1. James Hardie’s
incident and severity rates relate to factory employees and does not include our sales force, corporate or administrative employees.
9
Asbestos funding
As of 31 March 2014, the Asbestos Injuries
Compensation Fund (AICF) had net cash and
investments of A$65.5 million
In 2014, James Hardie will contribute US$113.0 million to the Asbestos Injuries Compensation Fund (AICF). This amount represents 35%
of the company’s free cash flow for fiscal year 2014 which the company is obliged to contribute as part of its commitment under the Amended and Restated Final Funding Agreement. Including this contribution, James Hardie has provided over A$1
Billion towards asbestos compensation since 2001. James Hardie also contributed A$3 million to the establishment of the Asbestos Diseases Research Centre based at Concord Hospital, and continues to contribute to medical research into the prevention,
treatment and cure of asbestos related diseases and has more recently provided additional amounts to support clinical trials to develop a new treatment for mesothelioma.
Additionally James Hardie is the primary supporter (and only commercial supporter) of Australia’s largest education campaign regarding the dangers of asbestos.
The education campaign is run by a committee with representatives from the NSW government, the ACTU and James Hardie and it is aimed at educating home renovators about the risk of
asbestos in the built environment. An example of the committee’s work is the website asbestosawareness.com.au
ANNUAL ACTUARIAL ASSESSMENT
KPMG Actuarial conducts an annual actuarial assessment of the liabilities of the AICF to enable projections to be regularly updated in line with actual claims experience and the
claims outlook. James Hardie discloses summary information on claims numbers each quarter with its quarterly results releases. Additional information contained in the annual actuarial report is available in the Investor Relations area of the James
Hardie website (www.jameshardie.com.au).
UPDATED ACTUARIAL ASSESSMENT
James
Hardie received an updated actuarial report from KPMG Actuarial at 31 March 2014, which showed the undiscounted and uninflated central estimate net of insurance recoveries increasing from A$1.345 billion at 31 March 2013 to A$1.547 Billion at 31
March 2014.
The increase of A$202 million is primarily due to an increase in the projected future number of claims for mesothelioma reflecting both higher level of
claims volumes and a change in the incidence pattern for mesothelioma, an increased allowance for large claims for mesothelioma resulting from higher numbers of large claims, lower nil settlement rates being assumed for mesothelioma and lung cancer,
partially offset by lower average claim sizes and average defence legal costs for most disease types.
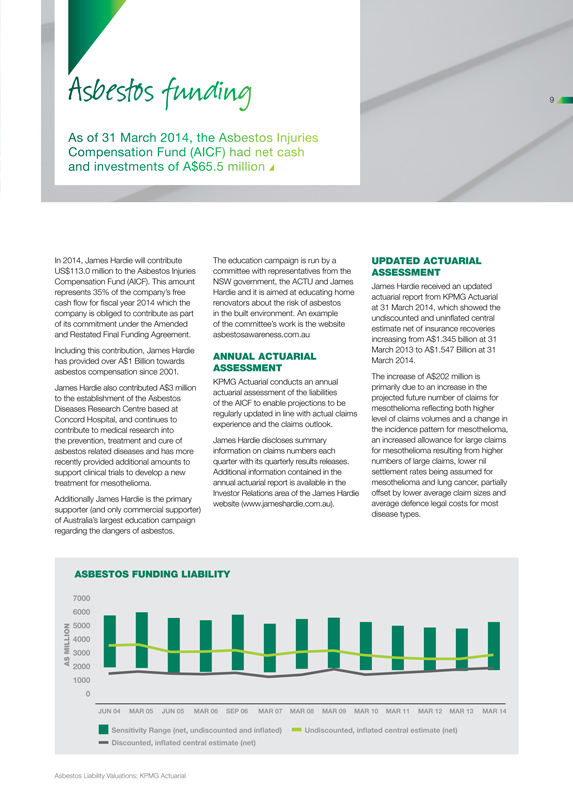
ASBESTOS FUNDING LIABILITY
7000
6000
5000
4000
3000
2000
1000
0
A $ million
JUN 04 MAR 05 JUN 05 MAR 06 SEP 06 MAR 07 MAR 08 MAR 09 MAR 10 MAR 11 MAR 12 MAR
13 MAR 14
Sensitivity Range (net, undiscounted and inflated)
Undiscounted,
inflated central estimate (net)
Discounted, inflated central estimate (net)
Asbestos Liability Valuations: KPMG Actuarial
JH® James Hardie
CORPORATE HEADQUARTERS
Second Floor, Europa House, Harcourt Centre Harcourt Street, Dublin 2, Ireland Telephone +353 1 411 6924 Facsimile +353 1 479 1128
KEY DATES
31 MARCH
End of James Hardie Industries plc Fiscal Year 2014
22 MAY
FY14 Quarter 4 and Full Year results and management presentation
27 JUNE
Annual Review released
13 AUGUST
Voting Instruction Forms close 7.00pm Sydney time for Annual General Meeting
15 AUGUST
Annual General Meeting, Dublin
19 AUGUST
FY15 Quarter 1 results announcement and management presentation
13 NOVEMBER
FY15 Quarter 2 and Half Year results and management presentation
ANNUAL GENERAL MEETING
The 2014 Annual General Meeting of CUFS holders of James Hardie Industries plc will be held in Dublin, Ireland, at 7:00am Dublin time, on Friday, 15 August 2014.
The AGM will be broadcast via a teleconference at 4:00pm AEST. Further details are set out in the Notice of Annual General Meeting 2014.
SHARE/CUFS REGISTRY
James Hardie Industries plc’s registry is managed by Computershare. All enquiries and correspondence regarding holdings should be directed to: Computershare
Investor Services Pty Ltd Level 4, 60 Carrington Street, Sydney NSW 2000 or GPO Box 2975 Melbourne VIC 3001 Telephone within Australia: 1300 855 080 Telephone outside Australia: +61 (03) 9415 4000 Email: [email protected] Website:
www.computershare.com James Hardie Industries plc (ARBN 097 829 895) Incorporated in Ireland with its registered office at Second Floor, Europa House, Harcourt Centre, Harcourt Street, Dublin 2, Ireland and registered number 485719. The liability of
its members is limited.
™ or ® denotes a trademark or Registered mark owned by James Hardie Technology Ltd.
© 2014. James Hardie Industries plc.
For more information about James Hardie, please
visit our website: www.jameshardie.com.au
DISCLAIMER
Certain statements in
this Annual Review may constitute “forward-looking statements” as defined in the Private Securities Litigation Reform Act of 1995. James Hardie uses such words as “believe,” “anticipate,” “plan,”
“expect,” “intend,” “target,”, “estimate,” “project,” “predict,” “forecast,” “guideline,” “aim,” “will,” “should,” “likely,”
“continue,” “may,” “objective,” “outlook,” and similar expressions are intended to identify forward-looking statements but are not the exclusive means of identifying such statements. Readers are cautioned not
to place undue reliance on these forward-looking statements and all such forward-looking statements are qualified in their entirety by reference to the following cautionary statements.
Forward-looking statements are based on the company’s current expectations, estimates and assumptions and because forward-looking statement address future results, events and
conditions, they, by their very nature, involve inherent risks and uncertainties, many of which are unforeseeable and beyond the company’s control. Such known and unknown risks, uncertainties and other factors may cause actual results,
performance or other achievements to differ materially from the anticipated results, performance or achievements expressed, projected or implied by these forward-looking statements. These factors which are discussed in further detail in our annual
report on Form 20-F (“Annual Report”), which will be filed with the United States Securities and Exchange Commission and the Australian Securities Exchange. These forward-looking statements are made as of the date of this Annual Review and
James Hardie does not assume any obligation to update them. Investors are encouraged to review James Hardie’s Annual Report, and specifically the risk factors discussed therein, as it contains important disclosures regarding the risks attendant
to investing in our securities.
1. Unless otherwise stated for fiscal years 2014, 2013 and 2012, Adjusted Net Operating Profit graphs and editorial comments
throughout this report refer to results from operations excluding asbestos, asset impairments, ASIC expenses, New Zealand product liability expenses and tax adjustments. The same can be said for 2009, 2010 and 2011 except they do not exclude New
Zealand product liability expenses.
2. Unless otherwise stated for fiscal years 2014, 2013 and 2012, Adjusted EBIT graphs and editorial comments throughout this
report refer to EBIT excluding asbestos, asset impairments, ASIC expenses and New Zealand product liability expenses. The same can be said for 2009, 2010 and 2011 except they do not exclude New Zealand product liability expenses.
3. Includes restricted cash set aside for AFFA.