  SUPPLY
CHAIN Ryan Kilcullen
24 September 2014
Exhibit 99.6 |
| SUPPLY
CHAIN Ryan Kilcullen
24 September 2014
Exhibit 99.6 |
 DISCLAIMER
2
This Management Presentation contains forward-looking statements. James Hardie may from time to
time make forward-looking statements in its periodic reports filed with or furnished to the
SEC, on Forms 20-F and 6-K, in its annual reports to shareholders, in offering circulars, invitation memoranda and prospectuses, in media releases and other written
materials and in oral statements made by the company’s officers, directors or employees to
analysts, institutional investors, existing and potential lenders, representatives of the media
and others. Statements that are not historical facts are forward-looking statements and such
forward-looking statements are statements made pursuant to the Safe Harbor Provisions of
the Private Securities Litigation Reform Act of 1995.
Examples of forward-looking statements include: •
statements about the company’s future performance; •
projections of the company’s results of operations or financial condition; •
statements regarding the company’s plans, objectives or goals, including those relating to
strategies, initiatives, competition, acquisitions, dispositions and/or its products;
•
expectations concerning the costs associated with the suspension or closure of operations at any of
the company’s plants and future plans with respect to any such plants;
•
expectations concerning the costs associated with the significant capital expenditure projects at any
of the company’s plants and future plans with respect to any such projects; •
expectations regarding the extension or renewal of the company’s credit facilities including
changes to terms, covenants or ratios;
•
expectations concerning dividend payments and share buy-backs; •
statements concerning the company’s corporate and tax domiciles and structures and potential
changes to them, including potential tax charges;
•
statements regarding tax liabilities and related audits, reviews and proceedings; •
statements regarding the possible consequences and/or potential outcome of the legal proceedings
brought against two of the company’s subsidiaries by the New Zealand Ministry of Education
and the potential product liabilities, if any, associated with such proceedings;
•
expectations about the timing and amount of contributions to Asbestos Injuries Compensation Fund
(AICF), a special purpose fund for the compensation of proven Australian asbestos-related
personal injury and death claims;
•
expectations concerning indemnification obligations; •
expectations concerning the adequacy of the company’s warranty provisions and estimates for
future warranty-related costs;
•
statements regarding the company’s ability to manage legal and regulatory matters (including but
not limited to product liability, environmental, intellectual property and competition law
matters) and to resolve any such pending legal and regulatory matters within current estimates and in anticipation of certain third-party recoveries; and
•
statements about economic conditions, such as changes in the US economic or housing recovery or
changes in the market conditions in the Asia Pacific region, the levels of new home
construction and home renovations, unemployment levels, changes in consumer income, changes or stability in housing values, the availability of mortgages and
other financing, mortgage and other interest rates, housing affordability and supply, the levels of
foreclosures and home resales, currency exchange rates, and builder and consumer confidence. |
 3
Words such as “believe,” “anticipate,” “plan,” “expect,”
“intend,” “target,” “estimate,” “project,” “predict,” “forecast,” “guideline,” “aim,” “will,” “should,” “likely,” “continue,”
“may,” “objective,” “outlook” and similar expressions are
intended to identify forward-looking statements but are not the exclusive means of identifying such statements. Readers are cautioned
not to place undue reliance on these forward-looking statements and all such forward-looking
statements are qualified in their entirety by reference to the following cautionary statements.
Forward-looking statements are based on the company’s current expectations, estimates and
assumptions and because forward-looking statements address future results, events and
conditions, they, by their very nature, involve inherent risks and uncertainties, many of which are
unforeseeable and beyond the company’s control. Such known and unknown risks,
uncertainties and other factors may cause actual results, performance or other achievements to differ
materially from the anticipated results, performance or achievements expressed, projected or
implied by these forward-looking statements. These factors, some of which are discussed under “Risk Factors” in Section 3 of the Form 20-F filed with the Securities and
Exchange Commission on 26 June 2014, include, but are not limited to: all matters relating to or
arising out of the prior manufacture of products that contained asbestos by current and former
James Hardie subsidiaries; required contributions to AICF, any shortfall in AICF and the effect of currency exchange rate movements on the amount recorded in the company’s
financial statements as an asbestos liability; governmental loan facility to AICF; compliance with and
changes in tax laws and treatments; competition and product pricing in the markets in which the
company operates; the consequences of product failures or defects; exposure to environmental, asbestos, putative consumer class action or other legal
proceedings; general economic and market conditions; the supply and cost of raw materials; possible
increases in competition and the potential that competitors could copy the company’s
products; reliance on a small number of customers; a customer’s inability to pay; compliance with and changes in environmental and health and safety laws; risks of
conducting business internationally; compliance with and changes in laws and regulations; the effect
of the transfer of the company’s corporate domicile from The Netherlands to Ireland,
including changes in corporate governance and any potential tax benefits related thereto; currency exchange risks; dependence on customer preference and the concentration
of the company’s customer base on large format retail customers, distributors and dealers;
dependence on residential and commercial construction markets; the effect of adverse changes in
climate or weather patterns; possible inability to renew credit facilities on terms favourable to the company, or at all; acquisition or sale of businesses and business
segments; changes in the company’s key management personnel; inherent limitations on internal
controls; use of accounting estimates; and all other risks identified in the company’s
reports filed with Australian, Irish and US securities agencies and exchanges (as appropriate). The
company cautions you that the foregoing list of factors is not exhaustive and that other risks
and uncertainties may cause actual results to differ materially from those referenced in the company’s forward-looking statements. Forward-looking statements speak only
as of the date they are made and are statements of the company’s current expectations concerning
future results, events and conditions. The company assumes no obligation to update any
forward-looking statements or information except as required by law. |
 •
Supply Chain at JH
•
Network Expansion Impact
•
Customer Focus
•
Freight Market and JH Performance
AGENDA
4 |
 JH
SUPPLY CHAIN OVERVIEW 5 |
 JH
SUPPLY CHAIN Raw Material
Suppliers
Manufacturing
Scheduling
Outbound
Freight
Channel
Management
Warehousing
Jobsite
Delivery
Raw Material
Requirements
Inventory
Strategy
Capacity
Planning
Production
Scheduling
Demand
Forecasting
Managing the three flows: Product, Information and Cash Flow
Product Flow
Information Flow
JH Supply Chain Organization
6 |
 JH
SUPPLY CHAIN OBJECTIVES JH Supply Chain has two primary objectives
1.
Customer value creation
2.
Operational and financial efficiency
We accomplish by
•
Leveraging our network scope and operating capability
to enhance the profitability and experience of our
customers
•
Deploying optimization concepts and tactics to
maximize financial returns to JH
7 |
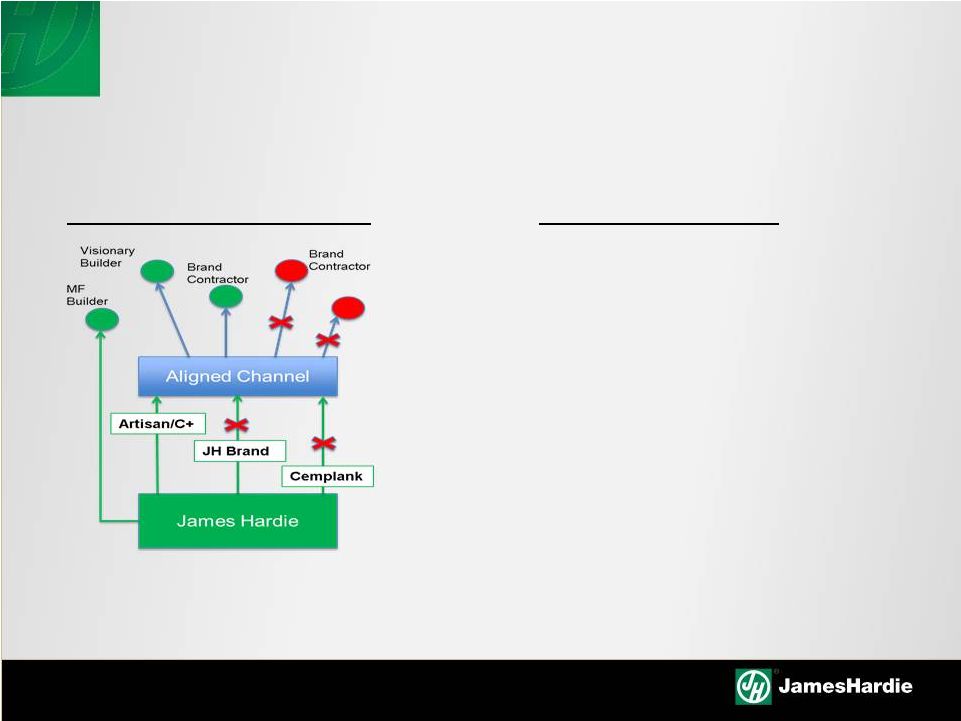
 EXAMPLE 1: VMIS
VMIs increase the profitability of our channel partners
VMIs are a critical element of our overall business strategy
8
Optimizing JH Returns
Customer Value Creation
Lower freight costs
-
Weight max, ideal sourcing, lead time
Order volatility is greatly reduced
Increase in C+ penetration
Enables scale for jobpack LTLs
Significant reduction in working capital
Wider SKU offering
Reduced
order
processing
costs
–
JH
does
all replenishment activities
Ability to place LTL special orders |
 EXAMPLE 2: JOBPACKS
Customer Value Creation
•
To-the-piece ordering capability reduces
jobsite waste and returns cost
•
Made-to-order at standard lead-times
eliminates the need for inventory
•
Access to the full JH line enables selling
the whole house
The efficiency of our jobpack supply chain enables a competitive
advantage by delivering “the tail”
at an unmatched cost-to-service
Jobpacks enable full wrap ColorPlus through an efficient supply chain
Optimizing JH Returns
•
HardieLink enables efficient order flow
•
APO scheduling creates efficient
manufacturing sequencing and changeovers
•
Manugistics
TMS optimizes multi-stop routing
& leverages VMI volume scale
9 |
 JH
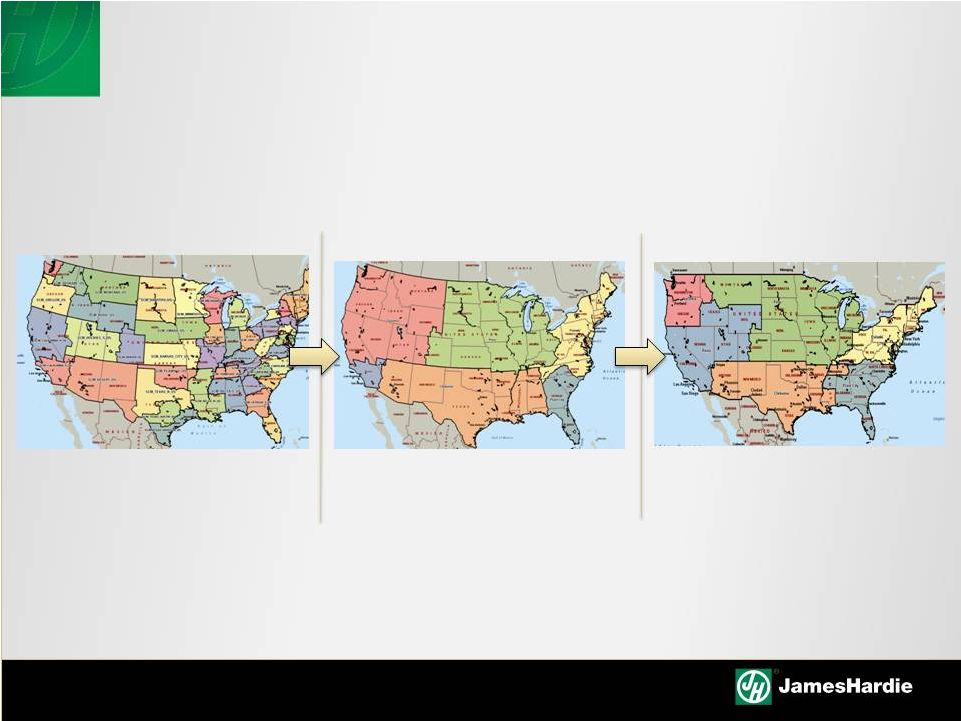
NETWORK EVOLUTION JH Network –
FY05
Customer Value Creation
Optimizing JH Returns
10
•
Limited non-product value creation in JH
supply Chain
•
Product mixing rules force complexity
onto our customer base
•
Production scheduling is focused on
enabling flat sheet PcI/PdI
•
Freight model is optimized for full
truckload purchasing performance |
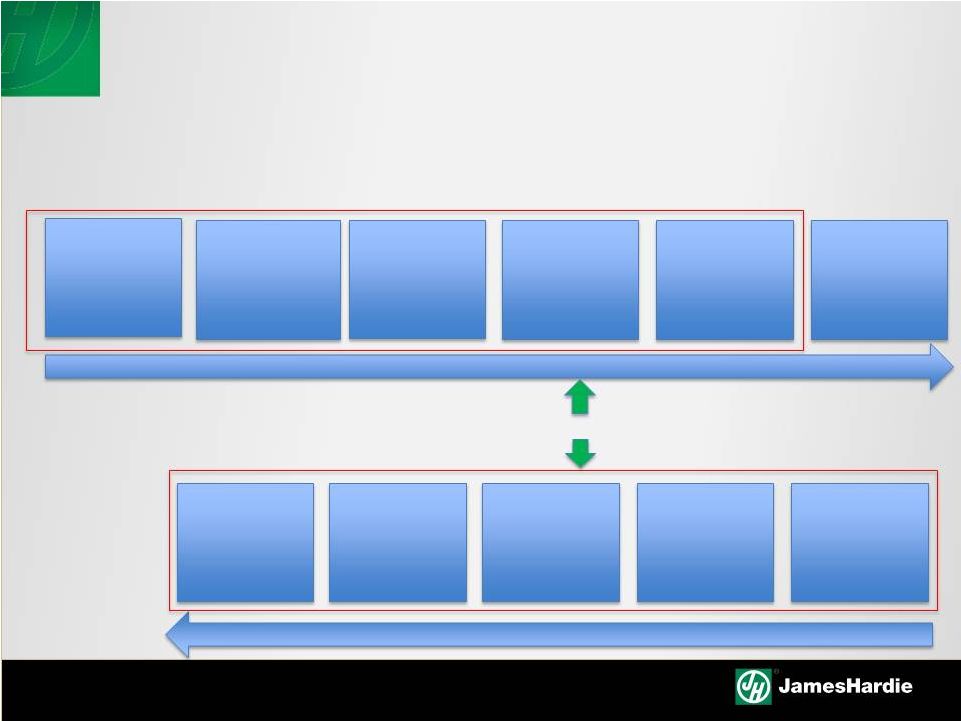
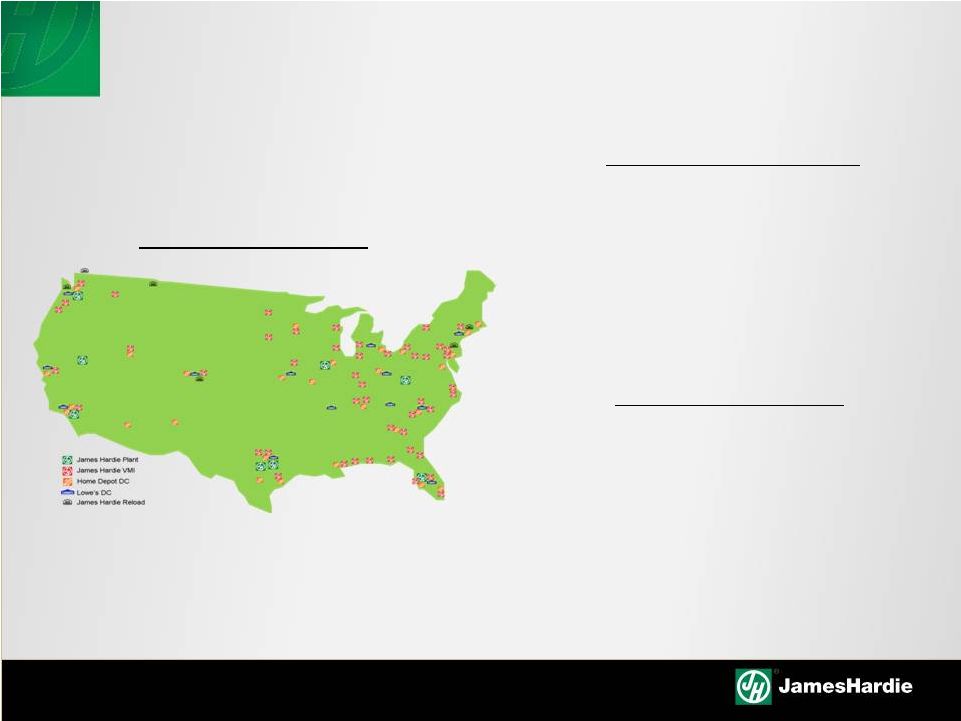 JH
NETWORK EVOLUTION JH Network –
Today
Optimizing JH Returns
Customer Value Creation
11
•
Network density enables flexible ordering
rules to mix full range of products
•
VMIs and jobpacks create profitable options
for servicing all builder types
•
Focus is on internal JH optimization of
production scheduling and freight routing
•
Expanded scope of JH network enables
significant reduction of average truck haul |
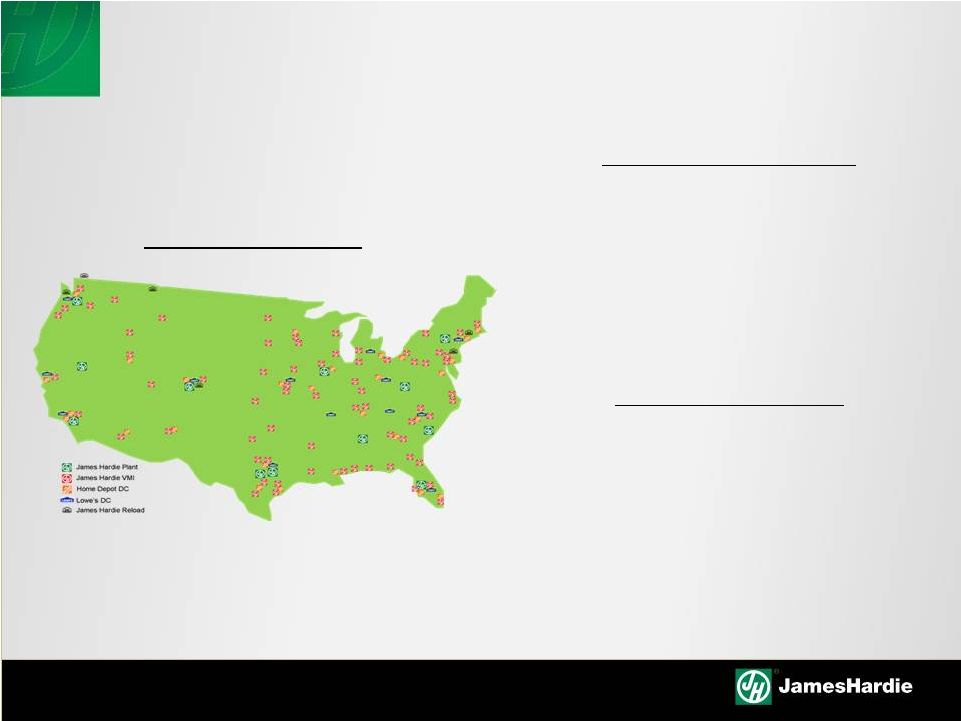 JH
NETWORK EVOLUTION JH Network –
35/90
Customer Value Creation
Optimizing JH Returns
12
•
Customer-focused value chain makes JH
an easy-to-work with Business Partner •
Deeper understanding of non-product value
enhances customer profitability
•
Integrated supply chain (raw materials to
market) enables true optimization
•
Efficiency focus is on inbound/outbound
opportunities and deep customer
partnerships
|
 CHALLENGES OF INCREASING NETWORK SCALE
A growing network also brings supply chain challenges
Capturing the full benefit of scale requires:
1.
A step change in organizational capability
2.
Optimization logic in our daily supply chain operations
13 |
 ORGANIZATIONAL CAPABILITY
5 Pillar Strategy
Recruit
Engage
Develop
Evaluate
Grow/Promote
Attract, develop and retain supply chain talent that
can manage the challenges of our 35/90 network
External
Technical
Expertise
Leverage the
Chicago MBA
Program
Customer
Operations as
a Pipeline
Quality
Performance
Management
In-Role Career
Progression
Mapping
Manufacturing
Experience
Assignment
Pilot
APICS
Technical
Development
Program
PG&D Goal
Setting and
Progress
Tracking
14
Connection to
the Business
Speaker Series
JHMT Lunch
events
Early-Career
“Next Steps”
Events |
 PROCESS CAPABILITY
Capturing the opportunities of a highly integrated network
requires enhanced operating capabilities
Order Flow
Planning Processes
Freight Management
•
Integration with
customer ERPs
•
HardieLink
•
VMI Transaction
Automation
•
Flat sheet
scheduling logic
•
APO deployment
•
Network landed
cost optimization
•
Multi-stop
optimization
•
Purchasing
model
enhancements
15 |
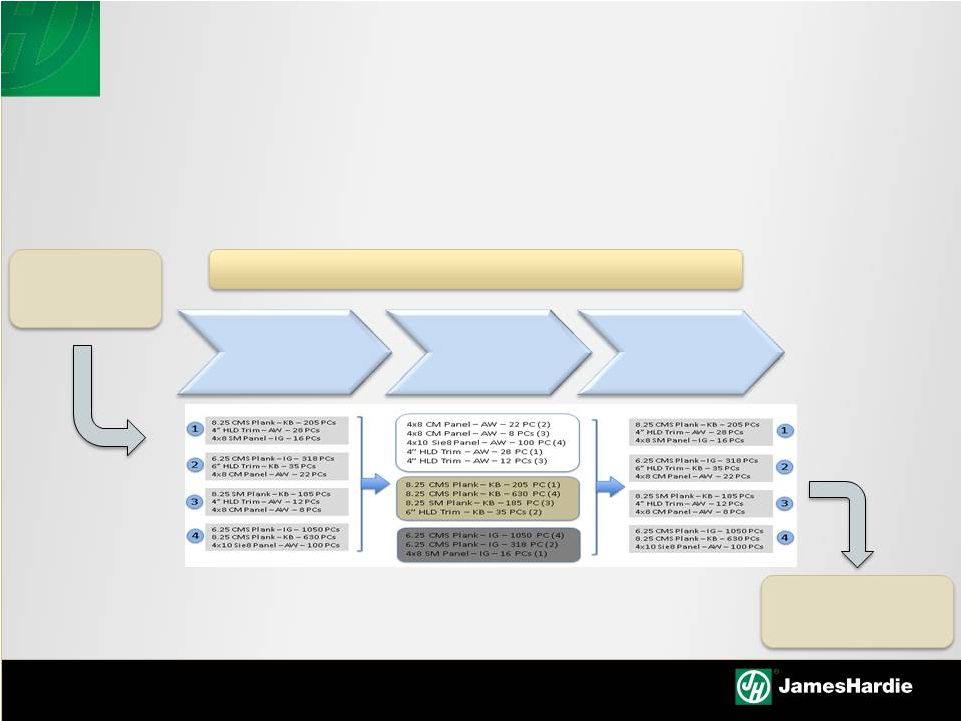 PROCESS ENHANCEMENT EXAMPLE
Automated order flow systems enable jobpack fulfillment with high
organizational, manufacturing and freight cost efficiency
Customer
orders with
multiple SKUs
& colors
Automated,
optimized
sequencing
Re-aggregated
orders, ready
for shipment
HardieLink
Order Entry
System
TMS Multi-Stop
Optimizer
APO Production Scheduling Optimization
16 |
 CUSTOMER VALUE INITIATIVE:
ON-TIME SERVICE
17 |
 THE
IMPORTANCE OF CONSISTENT SERVICE •
Secures market position
•
Enables us to capitalize on our sales force
investment
•
Maintains our brand
•
Reduces waste in our internal organization
–
allows us to invest in growth, rather than
maintenance of our existing base
Consistent on-time performance critical component of enabling 35/90
Importance to the Channel
Importance to Hardie
On-time service performance requires a systematic approach
to capacity management and day-to-day operational planning
18 |
 ENSURING SUFFICIENT CAPACITY FOR DEMAND
Regional Sourcing Zones
Customer demand is grouped into
sourcing zones
Lowest Cost Sourcing
Manufacturing & freight costs
determine “ideal”
source plant
Introducing manufacturing
capacities shifts the model
Actual Network Sourcing
Constant network balancing ensures we have sufficient production
capacity to meet customer demand
Our objective is to fulfill every customer order at the lowest landed cost,
with a high level of on-time service
19 |
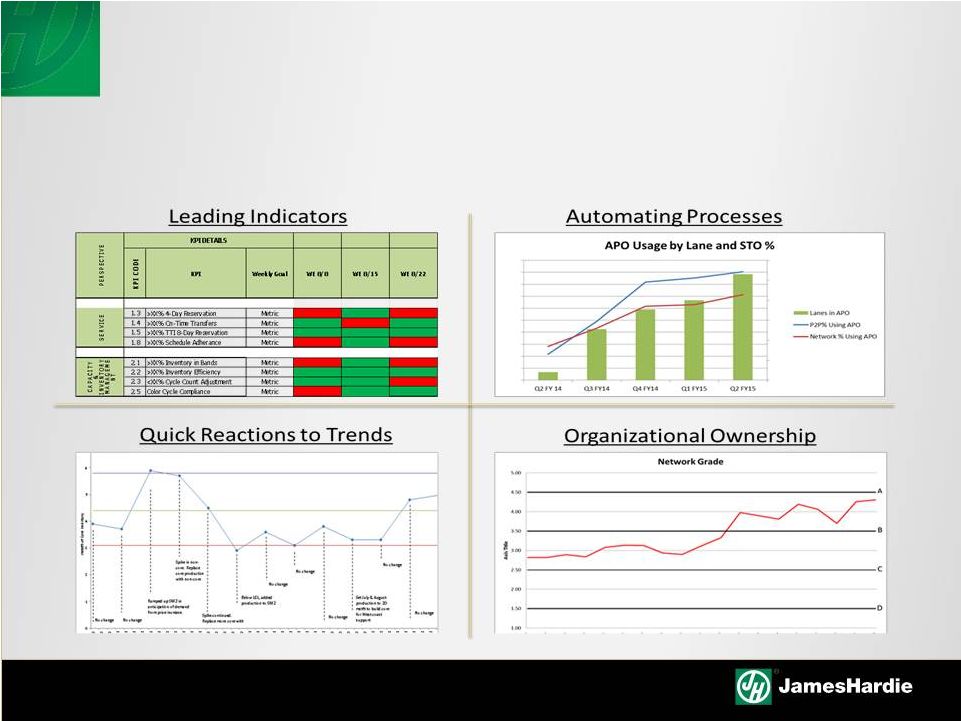 OPERATIONAL EXCELLENCE IN ORDER FULFILLMENT
A strong customer focus drives our daily replenishment activities
20 |
 ON-TIME SERVICE SUMMARY
•
On-time service is an important component of JH Customer
Focus and has a direct link to 35/90
•
Our supply chain systems are designed for on-time service at
optimized total landed cost
•
Our recent performance has been strong –
the most recent 3
quarters are our highest service performance in the last 5 years
•
Consistent on-time service enables us to continue to pull buffers
out of our supply chain –
resulting in further cost reductions
21 |
 MAXIMIZING JH RETURNS: MANAGING
THE RISING TRANSPORTATION MARKET
22 |
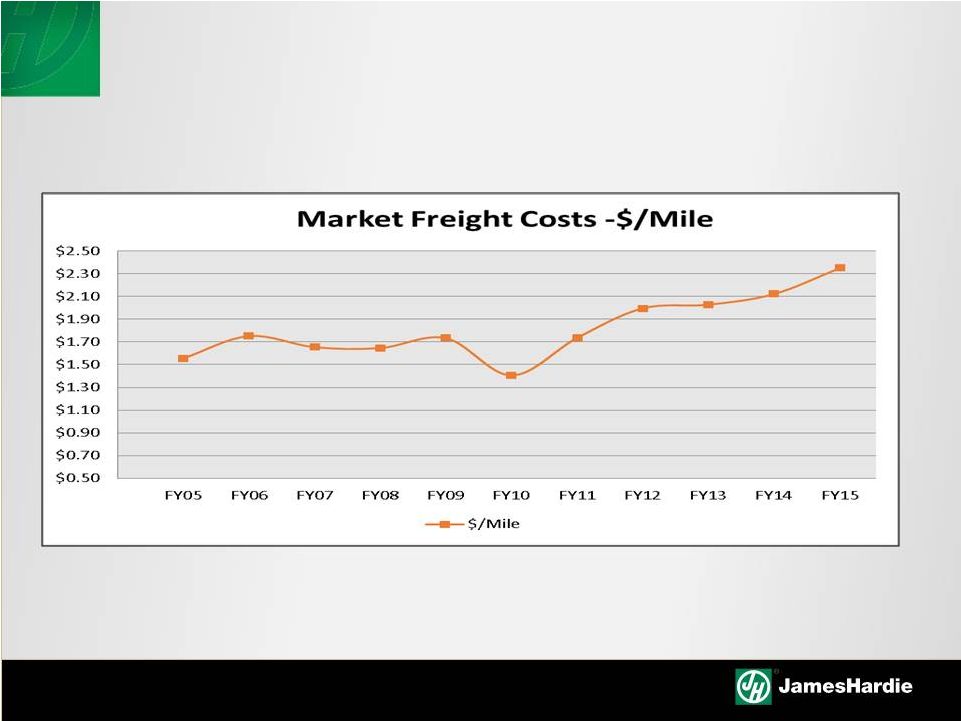 EXTERNAL TRANSPORTATION COST
Market rates* have rebounded dramatically from recession-levels
External factors are driving freight costs to historic highs
*Source: KeyBanc Capital Markets Truckload Spot Index
23 |
 HEADWINDS IN THE FREIGHT MARKET
Fundamental shifts in the demand/supply equation driving cost
The result of this shift will be a higher cost market than historical reference
points –
We do not expect a return to pre-recession costs
Demand Drivers
Supply Constraints
Post-recession economic recovery
Increasingly congested rail system
Recent regulatory changes that
reduce driver capacity
Demographic shifts = an annual net
loss of drivers in the workforce
More difficult credit environment
limiting capacity investments
24
•
Aging infrastructure = less efficient
•
Growing US petro industry that is
becoming rail reliant |
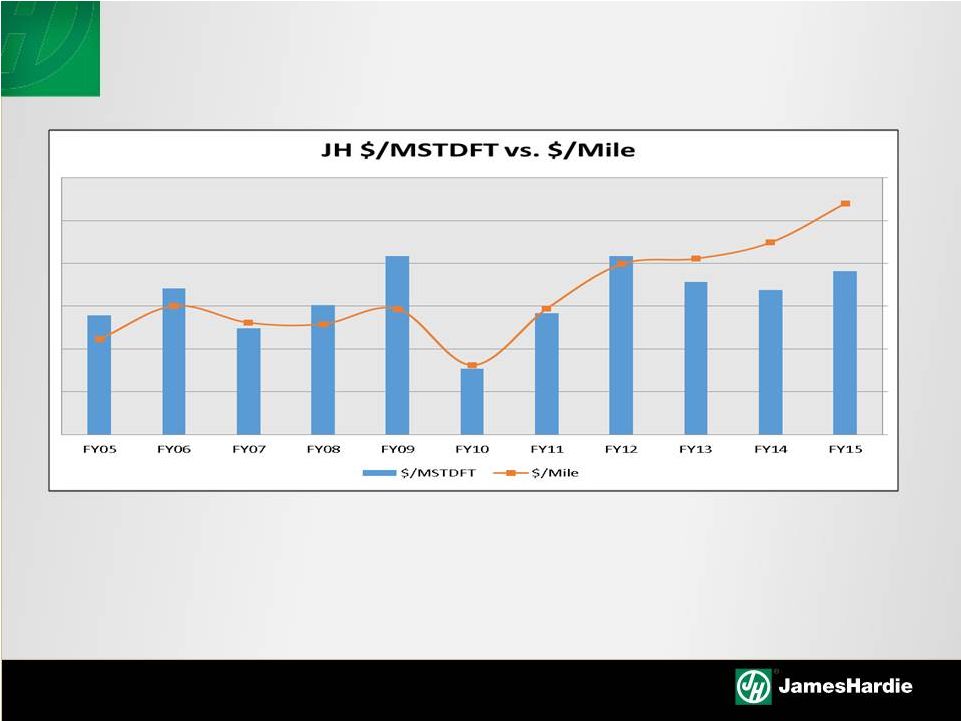 JH
NETWORK AND MARKET FREIGHT COSTS FY05
–
FY12
JH
freight
cost
trended
inline
with
market
rates
FY13
–
FY15
JH
freight
costs
separate
from
the
market
trend
as
a
result
of multiple initiatives to improve our network efficiency
25 |
 PROGRESS DRIVING THE RECENT SEPARATION
Result
How
it
was
Achieved
14% reduction in average length
of truckload haul
5% more fiber cement on every
truckload shipped
7% improvement in purchasing
performance vs the market
•
Significantly higher utilization of rail
•
Plant-to-plant
and
ColorPlus®
product
network rail
•
VMI-enabled sourcing improvements
•
Automated LTL truckload building capability
•
VMI-enabled weight maximization program
•
Product weight logic optimization
•
26% increase in JHBP brokerage volume
•
Pick-up window increase by improved
planning
•
Targeted lane purchasing program
26 |
 JH
TRANSPORTATION SUMMARY •
There are significant headwinds in the external freight
market
•
Network efficiencies have largely offset these costs
•
Our ability to continue to off-set this cost pressure will
become more reliant on closer partnerships with Customers
and Carriers
•
JH Supply Chain must continue its hard push to optimize
freight costs in our network
27 |
 SUPPLY CHAIN SUMMARY
28 |
 SUPPLY CHAIN SUMMARY
•
JH Supply Chain is focused on delivering customer value while
optimizing financial returns
•
Our expanding network enables us to maximize both of these
objectives –
while requiring improved organizational and process
capabilities
•
FY15 YTD we are delivering on our commitment of Customer
Focus
•
We expect strong headwinds in the freight market to continue,
and we are focused on offsetting the impact on JH financials
29 |
 QUESTIONS |