 Q4
FY15 MANAGEMENT PRESENTATION 21 May 2015
Exhibit 99.4 |
| Q4
FY15 MANAGEMENT PRESENTATION 21 May 2015
Exhibit 99.4 |
 PAGE
DISCLAIMER
Examples of forward-looking statements include:
2
•
statements about the company’s future performance; •
projections of the company’s results of operations or financial condition; •
statements regarding the company’s plans, objectives or goals, including those relating to
strategies, initiatives, competition, acquisitions, dispositions and/or its products;
•
expectations concerning the costs associated with the suspension or closure of operations at any of
the company’s plants and future plans with respect to any such plants;
•
expectations concerning the costs associated with the significant capital expenditure projects at any
of the company’s plants and future plans with respect to any such projects;
•
expectations regarding the extension or renewal of the company’s credit facilities including
changes to terms, covenants or ratios;
•
expectations concerning dividend payments and share buy-backs; •
statements concerning the company’s corporate and tax domiciles and structures and potential
changes to them, including potential tax charges;
•
statements regarding tax liabilities and related audits, reviews and proceedings; •
expectations about the timing and amount of contributions to Asbestos Injuries Compensation Fund
(AICF), a special purpose fund for the compensation of proven Australian asbestos-related
personal injury and death claims;
•
expectations concerning indemnification obligations; •
expectations concerning the adequacy of the company’s warranty provisions and estimates for
future warranty-related costs;
•
statements regarding the company’s ability to manage legal and regulatory matters (including but
not limited to product liability, environmental, intellectual property and competition law
matters) and to resolve any such pending legal and regulatory matters within current estimates and in anticipation of certain third-party recoveries; and •
statements about economic conditions, such as changes in the US economic or housing recovery or
changes in the market conditions in the Asia Pacific region, the levels of new home
construction and home renovations, unemployment levels, changes in consumer income, changes or stability in housing values, the availability of mortgages and other
financing, mortgage and other interest rates, housing affordability and supply, the levels of
foreclosures and home resales, currency exchange rates, and builder and consumer confidence. This Management Presentation
contains forward-looking statements. James Hardie Industries plc (the “company”) may from time to time make forward-looking statements in its periodic
reports filed with or furnished to the Securities and Exchange Commission, on Forms 20-F and
6-K, in its annual reports to shareholders, in offering circulars, invitation memoranda and
prospectuses, in media releases and other written materials and in oral statements made by the
company’s officers, directors or employees to analysts, institutional investors, existing and
potential lenders, representatives of the media and others. Statements that are not historical facts
are forward-looking statements and such forward-looking statements are statements made
pursuant to the Safe Harbor Provisions of the Private Securities Litigation Reform Act of 1995.
|
 PAGE
DISCLAIMER (continued)
3
Forward-looking statements are based on the company’s current expectations, estimates and
assumptions and because forward-looking statements address future results, events and
conditions, they, by their very nature, involve inherent risks and uncertainties, many of which are
unforeseeable and beyond the company’s control. Such known and unknown risks,
uncertainties and other factors may cause actual results, performance or other achievements to differ
materially from the anticipated results, performance or achievements expressed, projected or
implied by these forward-looking statements. These factors, some of which are discussed under “Risk Factors” in Section 3 of the Form 20-F filed with the Securities and
Exchange Commission on 26 June 2014, include, but are not limited to: all matters relating to or
arising out of the prior manufacture of products that contained asbestos by current and former
company subsidiaries; required contributions to AICF, any shortfall in AICF and the effect of currency exchange rate movements on the amount recorded in the company’s financial
statements as an asbestos liability; governmental loan facility to AICF; compliance with and changes
in tax laws and treatments; competition and product pricing in the markets in which the company
operates; the consequences of product failures or defects; exposure to environmental, asbestos, putative consumer class action or other legal proceedings; general economic
and market conditions; the supply and cost of raw materials; possible increases in competition and the
potential that competitors could copy the company’s products; reliance on a small number
of customers; a customer’s inability to pay; compliance with and changes in environmental and health and safety laws; risks of conducting business internationally; compliance with
and changes in laws and regulations; the effect of the transfer of the company’s corporate
domicile from the Netherlands to Ireland, including changes in corporate governance and any
potential tax benefits related thereto; currency exchange risks; dependence on customer preference and
the concentration of the company’s customer base on large format retail customers,
distributors and dealers; dependence on residential and commercial construction markets; the effect of
adverse changes in climate or weather patterns; possible inability to renew credit facilities
on terms favorable to the company, or at all; acquisition or sale of businesses and business segments; changes in the company’s key management personnel; inherent limitations
on internal controls; use of accounting estimates; and all other risks identified in the
company’s reports filed with Australian, Irish and US securities regulatory agencies and exchanges (as
appropriate). The company cautions you that the foregoing list of factors is not exhaustive and that
other risks and uncertainties may cause actual results to differ materially from those
referenced in the company’s forward-looking statements. Forward-looking statements speak
only as of the date they are made and are statements of the company’s current expectations
concerning future results, events and conditions. The company assumes no obligation to update any
forward-looking statements or information except as required by law. Words such as “believe,” “anticipate,” “plan,” “expect,”
“intend,” “target,” “estimate,” “project,” “predict,” “forecast,” “guideline,” “aim,” “will,” “should,” “likely,” “continue,”
“may,” “objective,” “outlook” and similar expressions are
intended to identify forward-looking statements but are not the exclusive means of identifying such statements. Readers are
cautioned not to place undue reliance on these forward-looking statements and all such
forward-looking statements are qualified in their entirety by reference to the following
cautionary statements.
|
 PAGE
AGENDA
•
Overview
and
Operating
Review
–
Louis
Gries,
CEO
•
Financial
Review
–
Matt
Marsh,
CFO
•
Questions and Answers
4
In this Management Presentation, James Hardie may present financial measures, sales volume terms,
financial ratios, and Non-US GAAP financial measures included in the Definitions and other
terms section of this document. The company presents financial measures that it believes are customarily used by its Australian
investors. Specifically, these financial measures, which are equivalent to or derived from certain US
GAAP measures as explained in the definitions, include “EBIT”, “EBIT
margin”, “Operating profit before income taxes” and “Net operating profit”. The company may also present other terms for measuring its sales volume (“million
square feet” or “mmsf” and “thousand square feet” or “msf”);
financial ratios (“Gearing ratio”, “Net interest expense cover”, “Net interest paid cover”, “Net debt
payback”, “Net debt (cash)”); and Non-US GAAP financial measures (“Adjusted
EBIT”, “Adjusted EBIT margin”, “Adjusted net operating profit”, “Adjusted diluted
earnings per share”, “Adjusted operating profit before income taxes”, “Adjusted
effective tax rate on earnings”, “Adjusted EBITDA”, and “Adjusted selling, general and
administrative expenses”. Unless otherwise stated, results and comparisons are of the fourth
quarter and full year of the current fiscal year versus the fourth quarter and full year of the
prior fiscal year.
|
 OVERVIEW AND OPERATING REVIEW
Louis Gries, CEO |
 PAGE
•
Group
net
sales
increased
9%
and
11%
for
the
quarter
and
full
year,
respectively,
compared
to
pcp
1
•
Group
adjusted
net
operating
profit
increased
US$12.0
million
to
US$57.3
million
for
the
quarter
and
US$24.2
million
to
US$221.4
million
for
the
full
year,
when
compared
to
pcp
1
•
Announced
dividends
of
a
second
half
ordinary
for
US27.0
cents
per
security
and
a
fiscal
year
2015
special
dividend of US22.0 cents per security
•
Higher
volumes
and
average
net
sales
price
across
our
USA
and
Europe
and
Asia
Pacific
Fiber
Cement
segments
•
Results
driven
by
strong
primary
demand
growth
and
the
continued
focus
across
our
plants
on
operational
management and cost management across the Company
•
Our full year USA and Europe Fiber Cement segment EBIT margin came in at 22.4% compared to 21.0% in
the pcp, within our target range of 20% to 25%
•
Continuing to invest in high-return organic growth by:
•
Investing in capacity expansion across our US and Australian businesses
•
Investing in primary demand growth programs and organizational capability
KEY THEMES
6
1
Prior corresponding period(s) |
 PAGE
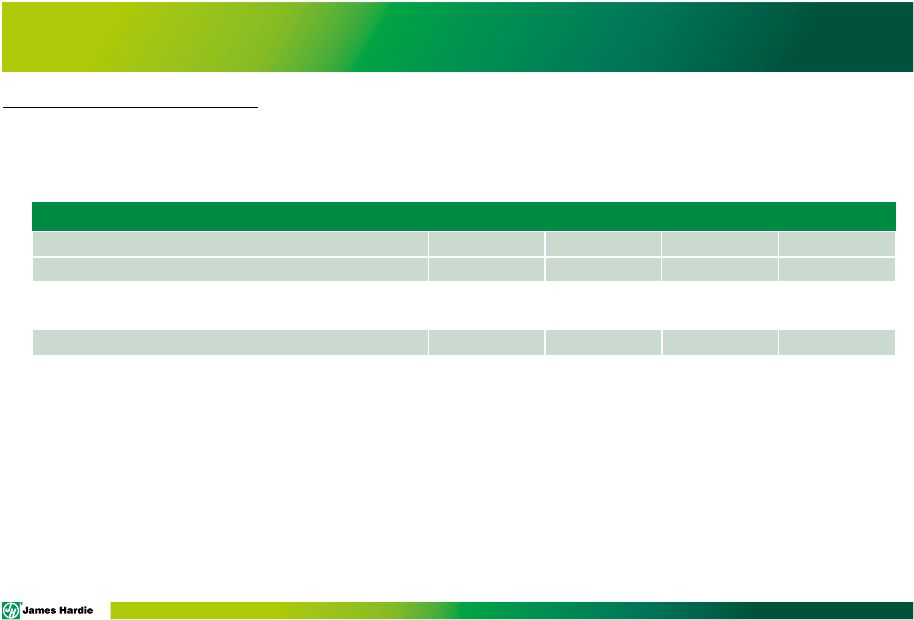
GROUP OVERVIEW
7
1
Dividends declared per share
Q4'15
Q4'14
Change
FY15
FY14
Change
Adjusted EBIT (US$ millions)
80.8
57.4
41%
304.0
252.8
20%
Adjusted EBIT Margin %
19.6
15.3
4.3 pts
18.3
16.9
1.4 pts
Adjusted Net Operating Profit (US$ millions)
57.3
45.3
26%
221.4
197.2
12%
Net operating cash flow (US$ million)
179.5
322.8
(44)%
Adjusted Diluted EPS (US cents)
13
10
50
44
Ordinary dividends per share¹
(US cents)
40
21
Three Months and Full Year Ended 31 March |
 PAGE
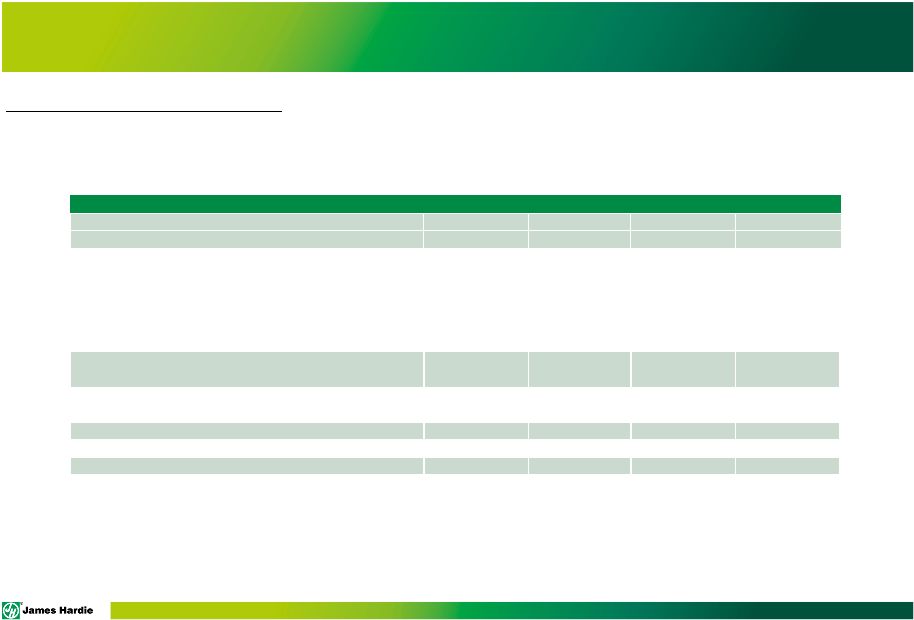
USA AND EUROPE FIBER CEMENT 4
th
QUARTER AND FULL YEAR SUMMARY
8
•
Higher volume driven by market penetration and modest
market growth
•
Higher average net sales price reflects favorable product
mix and execution of our pricing strategies
•
Improved plant performance and economies of scale,
partially offset by higher input costs
•
Higher volume driven by market penetration and modest
market growth
•
Higher average net sales price reflects favorable product
mix and execution of our pricing strategies
•
Higher input costs driven by market prices, and costs
incurred with starting up our Fontana plant in FY15
4
th
Quarter Results
Net Sales
Up
13% to US$325.1 million
Sales
Volume
Up
9% to 474.1 mmsf
Average
Price
Up
3% to US$670 per msf
EBIT
Up
39% to US$79.6 million
EBIT Margin
Up
470 bps to 24.5%
Full Year Result
Net Sales
Up
13% to US$1,276.5 million
Sales
Volume
Up
9% to 1,849.7 mmsf
Average
Price
Up
4% to US$675 per msf
EBIT
Up
21% to US$285.9 million
EBIT Margin
Up
140 bps to 22.4% |
 PAGE
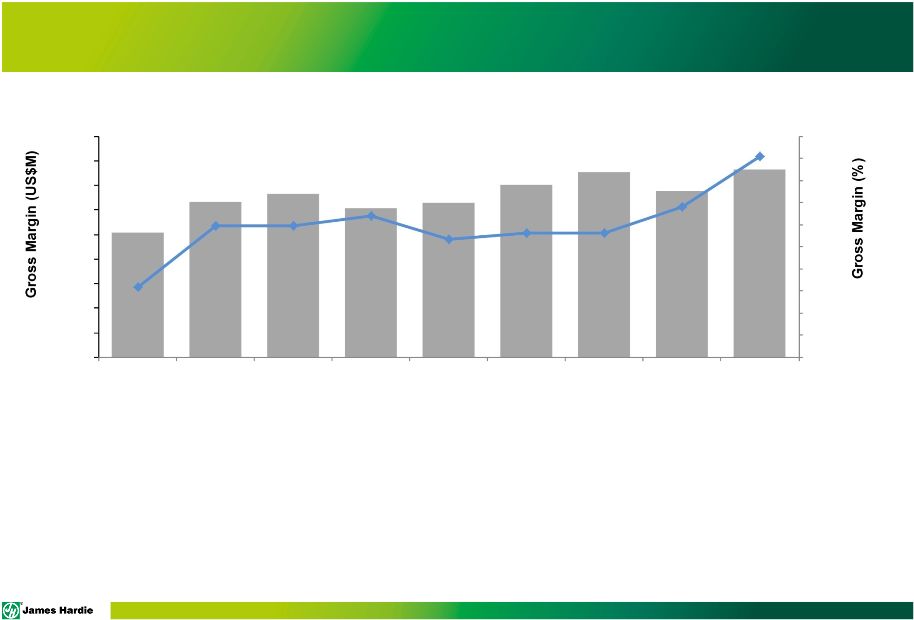
1
Excludes asset impairment charges of US$14.3 million in 4
th
quarter FY12, US$5.8 million in 3
rd
quarter FY13 and US$11.1 million in 4
th
quarter FY13
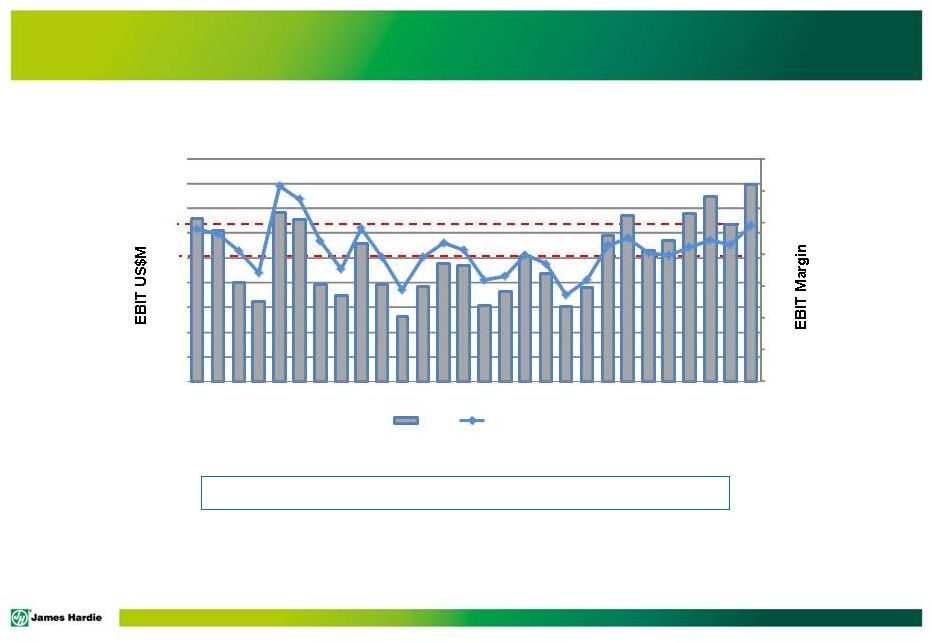
USA AND EUROPE FIBER CEMENT
9
EBIT Margins remain within our 20% to 25% target range
0
5
10
15
20
25
30
35
0
10
20
30
40
50
60
70
80
90
FY09
FY10
FY11
FY12
FY13
FY14
FY15
Quarterly EBIT and EBIT Margin
1
EBIT
EBIT Margin |
 PAGE
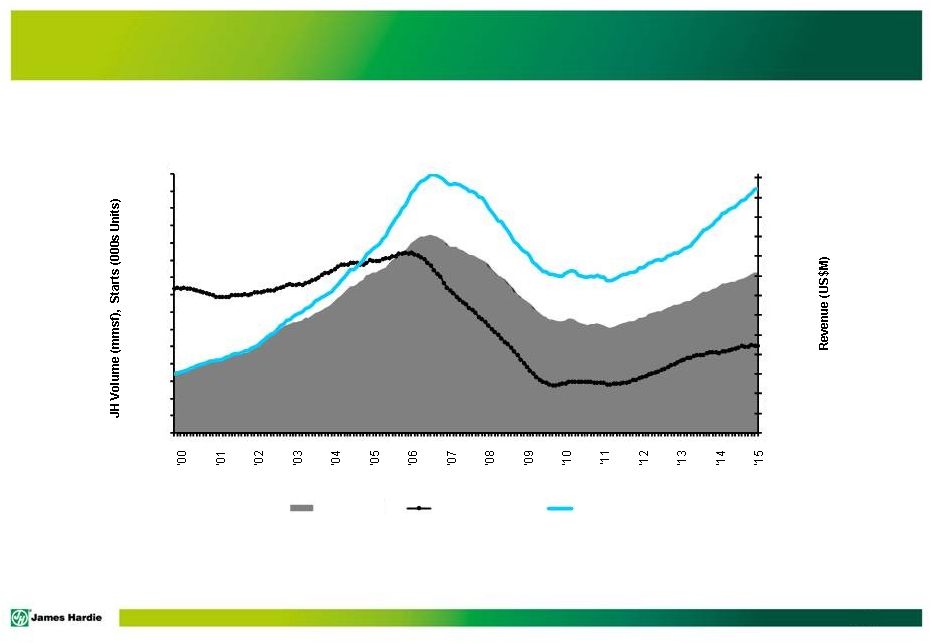
Rolling 12 month average of seasonally adjusted estimate of housing starts by US
Census Bureau USA FIBER CEMENT
10
$0
$100
$200
$300
$400
$500
$600
$700
$800
$900
$1,000
$1,100
$1,200
$1,300
0
200
400
600
800
1,000
1,200
1,400
1,600
1,800
2,000
2,200
2,400
2,600
2,800
3,000
Top Line Growth
JH Volume
Housing Starts
JH Revenue |
 PAGE
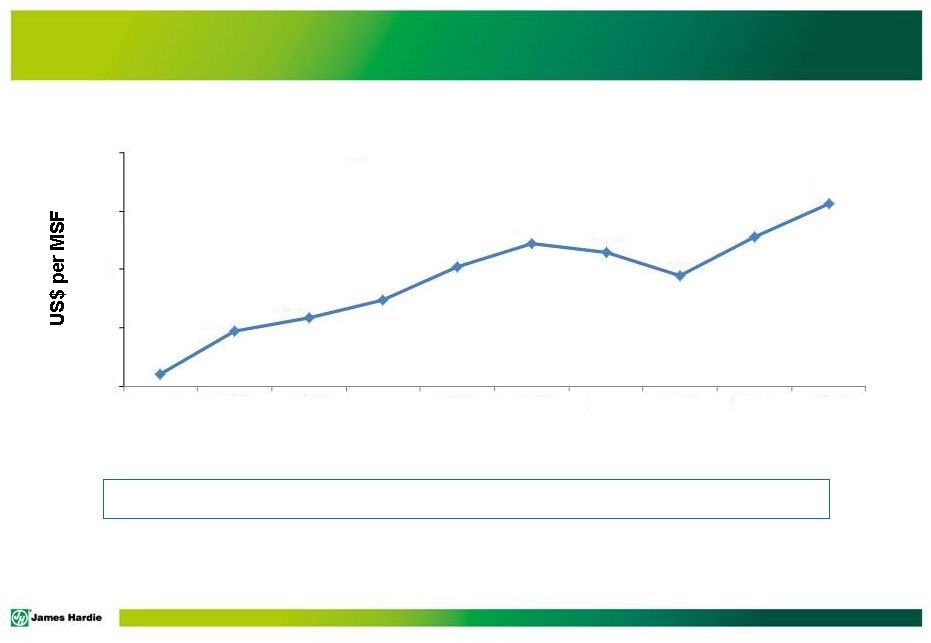
USA AND EUROPE FIBER CEMENT
11
Executing on pricing strategy …
~4% increase realized in FY15
558
588
597
609
632
648
642
626
652
675
550
590
630
670
710
FY06
FY07
FY08
FY09
FY10
FY11
FY12
FY13
FY14
FY15
Average Net Sales Price |
 PAGE
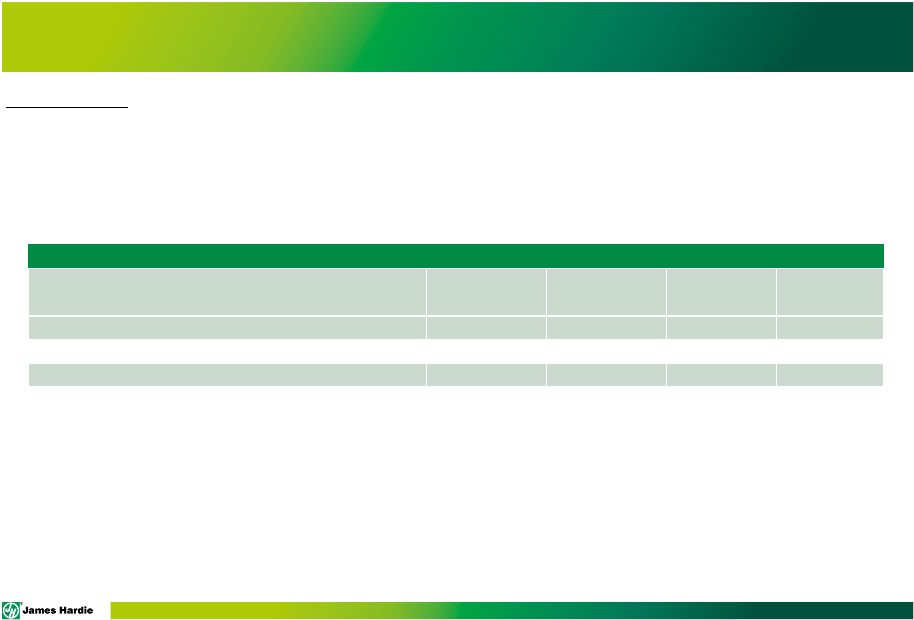
12
•
Favorable conditions in addressable markets
•
Higher volume and sales in AUS, NZ, and Philippines
•
Higher average net sales price driven by favorable product
mix and annual price increases
•
Lower production costs driven by economies of scale,
partially offset by higher input costs, driven by the impact of
the depreciating Australian dollar on the price of pulp
4
Quarter Results
Net Sales
Up
11% to A$109.2 million
Sales Volume
Up
7% to 114.0 mmsf
Average Price
Up
4% to A$946 per msf
US$ EBIT
Up
8% to US$19.9 million
A$ EBIT
Up
22% to A$25.2 million
US$ EBIT Margin
Up
220 bps to 23.1%
Full Year Result
Net Sales
Up
11% to A$434.5 million
Sales Volume
Up
9% to 456.2 mmsf
Average Price
Up
1% to A$942 per msf
US$ EBIT
Up
8% to US$89.8 million
A$ EBIT
Up
15% to A$102.5 million
US$ EBIT Margin
Up
100 bps to 23.6%
•
Favorable conditions in addressable markets
•
Higher volume and sales in AUS, NZ, and Philippines
•
Higher average net sales price driven by favorable
product mix and annual price increases
•
Production costs were flat when compared to prior year,
driven by higher input costs offset by improved plant
performance and the purchase of our Rosehill site
ASIA PACIFIC FIBER CEMENT 4
QUARTER SUMMARY AND FULL YEAR
1
Excluding New Zealand Weathertightness claims
th
th
1
1
1
1
1
1 |
 PAGE
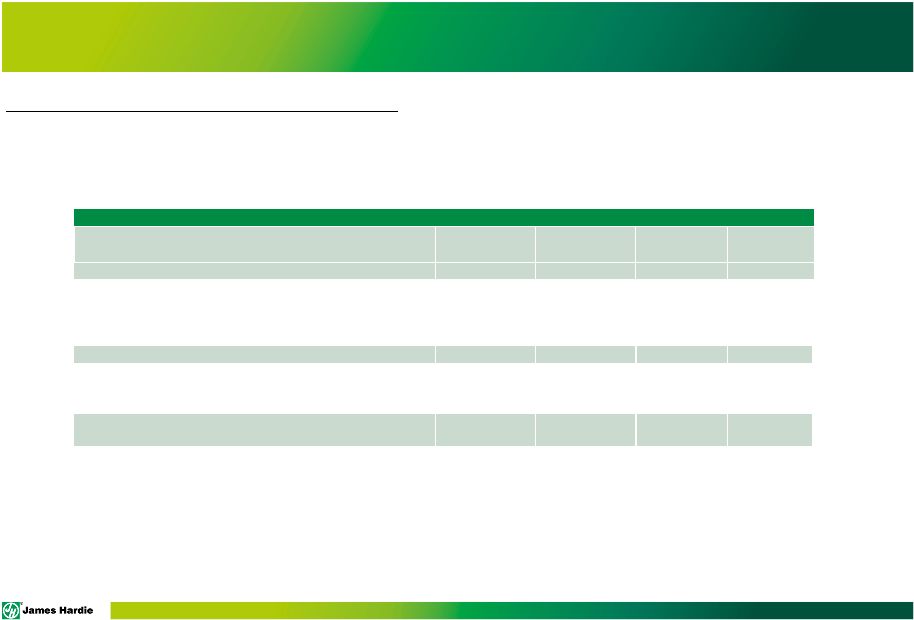
FY15 KEY GLOBAL CAPEX PROJECTS
13
PAGE
Project Description
Full Year FY15
Plant City, Florida
-
4
th
sheet machine and ancillary facilities
US$46.4 million
Cleburne, Texas
-
3
rd
sheet
machine
and
ancillary
facilities
US$24.7 million
Carole Park, Queensland
-
Capacity expansion project
US$36.2 million
Tacoma, Washington
-
Land and buildings
US$28.3 million
Rosehill, New South Wales
-
Land and buildings
US$37.5 million
Total capacity expansion spend
US$173.1 million |
 FINANCIAL REVIEW
Matt Marsh, CFO |
 GROUP
RESULTS •
Earnings impacted by:
•
Higher
sales
volumes
across
all
business
units
•
Higher
average
sales
prices
across
the
USA
and
Europe
and
Asia
Pacific
Fiber
Cement
segments
•
Higher
input
costs
for
both
the
quarter
and
full
year
driven
by
market
prices
for
raw
materials
•
Improved
plant
performance
throughout
the
year
across
our
USA
and
Europe
and
Asia
Pacific
Fiber
Cement segments, partially offset by the start up costs for our Fontana California
location •
Higher
organizational
spend,
primarily
due
to
higher
compensation
expenses,
an
increase
in
discretionary expenses and higher realized losses on foreign currency transactions
caused by the strengthening of the US dollar during the quarter and full
year •
Net
operating
cash
flow
of
US$179.5
million
for
the
full
year
compared
to
US$322.8
million
in
the
prior
year
•
US$276.2
million
of
capital
expenditure
on
key
production
capacity
projects
across
our
business
units
•
Announced
dividends
of
US$120.3
million
for
a
second
half
ordinary
and
US$98.0
million
for
a
FY2015
special dividend
15
PAGE |
 PAGE
•
Higher sales volumes
•
Higher average net sales prices in local currencies in both the USA
and Europe and Asia Pacific Fiber Cement segments
•
Economies of scale through increased volume
•
Improved plant performance
•
Higher average net sales price in the USA and Europe
•
Partially offset by higher input costs
•
Higher compensation and discretionary expenses
•
Higher realized losses on foreign currency transactions caused by
the strengthening of the US dollar
•
Interest expense increased related to our debt position
•
Income tax benefit decreased primarily driven by a reduction in the
unfavorable asbestos adjustments compared to the prior
corresponding quarter
RESULTS
FOR
THE
4
QUARTER
16
US$ Millions
Q4 '15
Q4 '14
% Change
Net sales
411.3
376.4
9
Gross profit
152.5
125.5
22
SG&A expenses
(68.8)
(61.9)
(11)
Research & development expenses
(7.6)
(8.0)
5
Asbestos adjustments
(63.5)
(322.0)
80
EBIT
12.6
(266.4)
Net interest expense
(4.0)
(0.4)
Other (expense) income
(1.0)
1.2
Income tax benefit
20.1
78.8
Net operating profit
27.7
(186.8)
Three Months Ended 31 March
Summary
Net sales increased 9%, favorably impacted by:
Gross profit margin increased 380 bps impacted by:
SG&A expenses increased primarily due to:
Non-operating expenses:
th |
 PAGE
1
Includes AICF SG&A expenses and AICF interest income, net
RESULTS
FOR
THE
4
th
QUARTER
(continued)
17
Summary
Asbestos adjustments reflects:
The New Zealand weathertightness benefit reflects:
•
Favorable claims settlements
•
A higher rate of claim resolution, fewer open claims and a
continued reduction in the number of new claims received
Adjusted net operating profit increased 26%, largely due to:
•
41% increase in operating segment adjusted EBIT
•
An increase in adjusted income tax expense of US$5.7 million
•
Other expense of US$2.2 million and gross interest expense of
US$4.0 million
•
A US$111.3 million unfavorable movement in the underlying
actuarial valuation
•
Offset by a US$47.8 million favorable exchange rate difference as
the AUD/USD exchange rate decreased 7% compared to a 3%
increase in the pcp
US$ Millions
Q4 '15
Q4 '14
% Change
Net operating profit (loss)
27.7
(186.8)
Asbestos:
Asbestos adjustments
63.5
322.0
80
Other asbestos
1
0.2
0.2
-
New Zealand weathertightness claims
(0.1)
1.1
Non-recurring stamp duty
4.2
-
Asbestos and other tax adjustments
(38.2)
(91.2)
Adjusted net operating profit
57.3
45.3
26
Three Months Ended 31 March |
 PAGE
RESULTS –
FULL YEAR
18
US$ Millions
FY15
FY14
% Change
Net sales
1,656.9
1,493.8
11
Gross profit
578.8
506.4
14
SG&A expenses
(245.5)
(224.4)
(9)
Research & development expenses
(31.7)
(33.1)
4
Asbestos adjustments
33.4
(195.8)
EBIT
335.0
53.1
Net interest expense
(7.5)
(1.1)
Other (expense) income
(4.9)
2.6
Income tax (expense) benefit
(31.3)
44.9
Net operating profit
291.3
99.5
Full Year Ended 31 March
Summary
Net sales increased 11%, favorably impacted by:
•
Higher sales volumes; and
•
Higher average net sales prices in the USA and Europe and
Asia Pacific Fiber Cement segments
Gross profit margin increased 100 bps impacted by:
•
Higher volumes and average net sales prices
•
Partially offset by higher input cots
SG&A expenses increased primarily due to:
•
Higher compensation and discretionary expenses
•
Higher realized losses on foreign currency transactions caused
by the strengthening of the US dollar
Non-operating expenses:
•
Interest expense increased due to the use of our debt facilities
•
Other expenses reflect the impact of unrealized foreign
exchange and interest rate swap losses
•
Income tax expense increased primarily due to a reduction in the
unfavorable asbestos adjustments and a non-recurring favorable
tax adjustment in the prior period. |
 PAGE
1
Includes AICF SG&A expenses and AICF interest income, net
RESULTS
–
FULL
YEAR
(continued)
19
Summary
Asbestos adjustments reflect:
•
New Zealand weathertightness moved from an expense to a benefit
due to:
•
•
Adjusted net operating profit increased 12%, largely due to:
•
•
•
US$ Millions
FY15
FY14
% Change
Net operating profit
291.3
99.5
Asbestos:
Asbestos adjustments
(33.4)
195.8
Other asbestos
1
1.1
(0.8)
New Zealand weathertightness claims
(4.3)
1.8
Non-recurring stamp duty
4.2
-
Asbestos and other tax adjustments
(37.5)
(99.1)
62
Adjusted net operating profit
221.4
197.2
12
Full Year Ended 31 March
•
A US$144.7 million favorable exchange rate difference as the
AUD/USD exchange rate decreased 17% compared to a 12%
decrease in the pcp.
A US$111.3 million unfavorable movement in the underlying
actuarial valuation
Favorable claims settlements
Higher rate of claim resolution, fewer open claims and a
continued reduction in the number of new claims received
20% increase in operating segment adjusted EBIT
US$14.6 million increase in adjusted tax expense
Other expense of US$7.5 million and gross interest expense of
US$5.8 million |
 PAGE
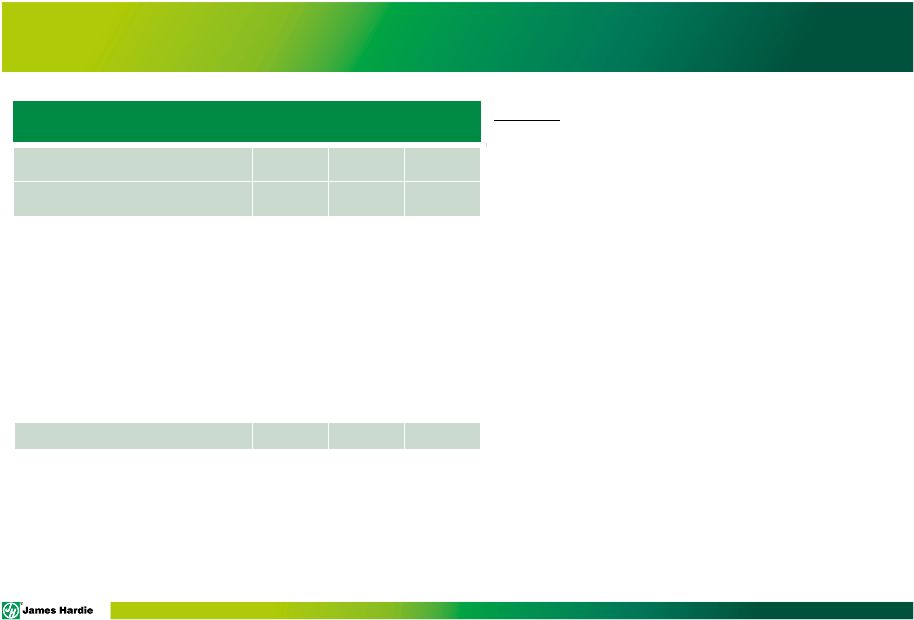
GROSS
PROFIT
-
GROUP
20
•
Gross profit margins remain strong, expanding above primary demand growth
rates •
Price improvements continue as we execute on pricing strategies and reduce pricing
inefficiencies •
Production costs are higher as a result of the higher market prices for pulp, gas
and silica raw materials, however, as we continue to focus on cost
management and operational excellence, plant performance remains on a
positive trend line $101.8
$152.5
31.2%
37.1%
Q4 FY13
Q4 FY14
Q4 FY15
-
20.0
40.0
60.0
80.0
100.0
120.0
140.0
160.0
180.0
28.0
29.0
30.0
31.0
32.0
33.0
34.0
35.0
36.0
37.0
38.0 |
 PAGE
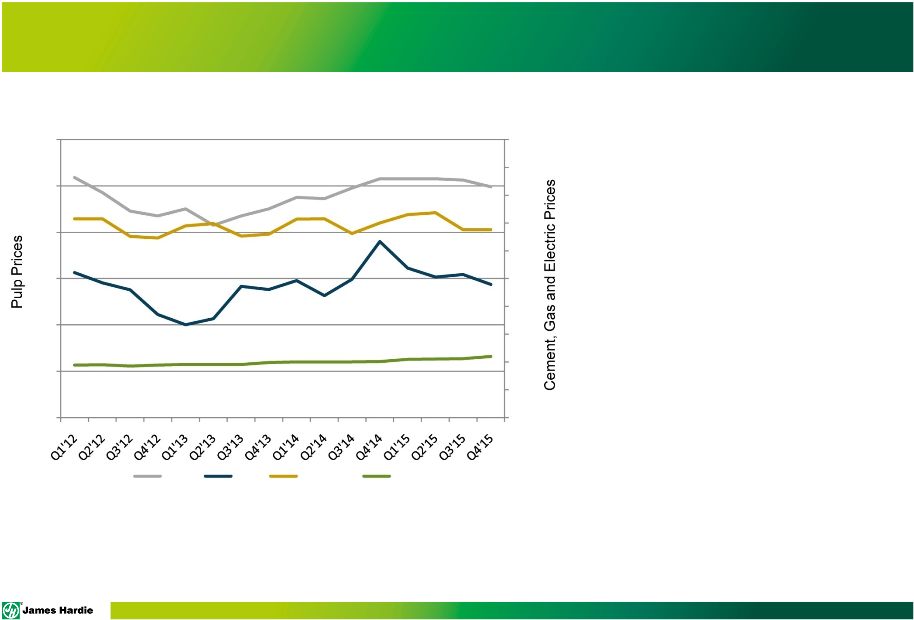
US INPUT COSTS
Discussion:
•
•
•
•
21
•
•
•
•
0
200
600
800
1,000
1,200
0
1
2
3
4
5
6
7
8
9
10
PULP
GAS
ELECTRIC
CEMENT
Quarterly US Input Costs
Input costs have generally trended higher than
the prior year
The price of NBSK pulp reached its peak during
the year, but has trended down slightly during
the fourth quarter
The cost of gas and electric for industrial users
increased above their historical four year
average in the current year
We are engaged in effective sourcing strategies
to reduce the impact of increasing market prices
The information underlying the table above is sourced as follows:
400
Pulp –
Cost per ton –
from RISI
Gas – Cost per thousand cubic feet for industrial users – from US Energy Information
Administration
Electric – Cost per thousand kilowatt hour for industrial users – from US Energy Information
Administration
Cement –
Relative index from the Bureau of Labor Statistics |
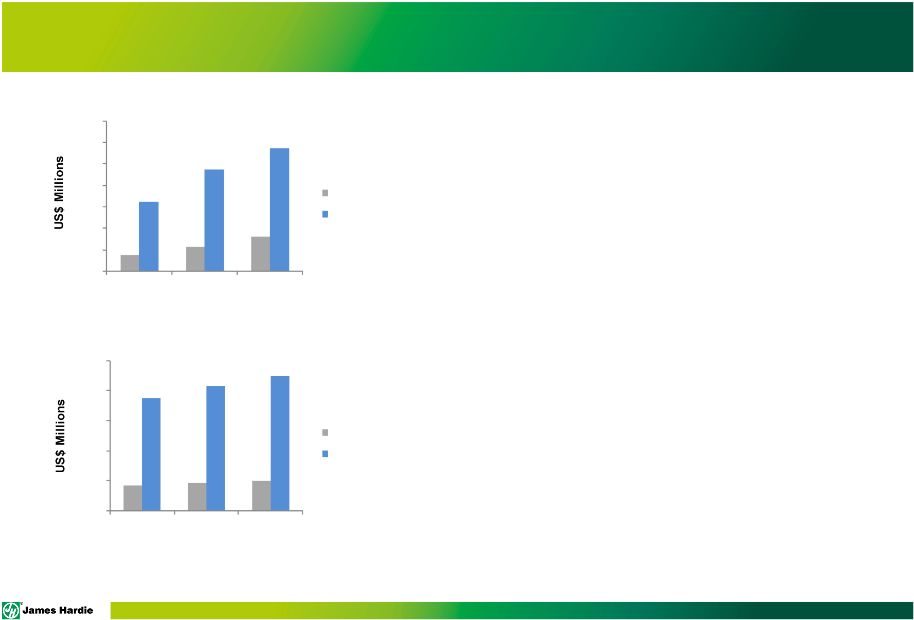 1
USA Fiber Cement EBIT excludes asset impairments in Q4 FY13 and Full year 2013
2
Asia Pacific Fiber Cement EBIT excludes New Zealand weathertightness claims
SEGMENT
EBIT
–
4
th
QUARTER
and
FULL
YEAR
22
PAGE
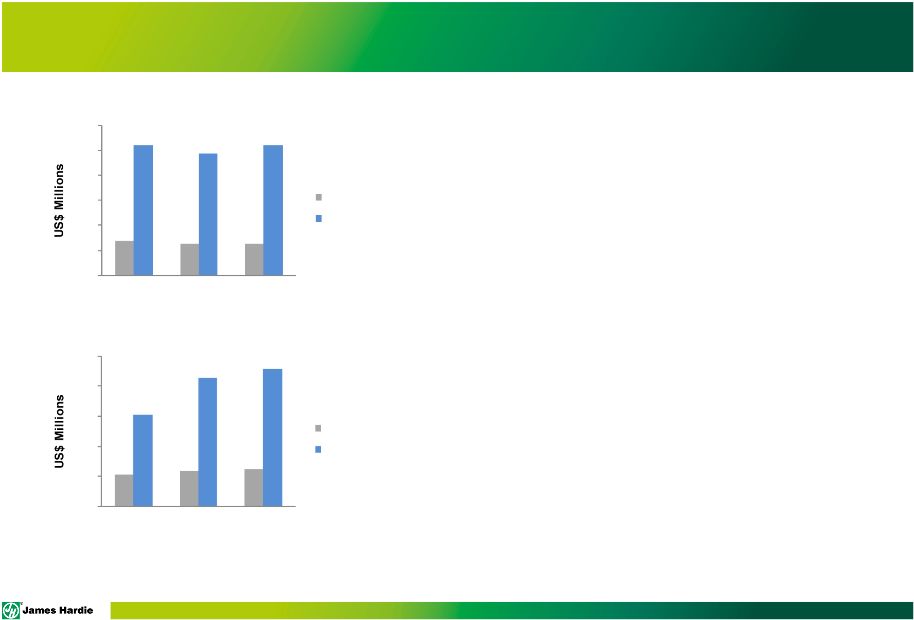
USA and Europe Fiber Cement EBIT summary:
•
Quarter and full year EBIT increased by 39% and 21%,
respectively, when compared to pcp
•
The increase for the quarter was driven by favorable volume,
price and plant performance; partially offset by higher SG&A
•
The increase for the full year was driven by volume and price;
partially offset by higher production costs and SG&A
Asia Pacific Fiber Cement EBIT summary:
•
For both the quarter and full year EBIT increased 8% compared
to pcp
•
EBIT in local currency for the quarter and full year increased
22% and 15%, respectively, compared to pcp
162.5
237.0
285.9
100
150
200
250
300
350
FY13
FY14
FY15
Q4 EBIT
Full Year
50
0
37.8
57.2
79.6
USA and Europe Fiber Cement
1
16.7
18.4
19.9
74.9
82.9
89.8
0
40
60
80
100
FY13
FY14
FY15
Q4 EBIT
Full Year
20
Asia Pacific Fiber Cement
2 |
 PAGE
1
Excludes Asbestos related expenses and adjustments, ASIC expenses and
non-recurring stamp duty SEGMENT
EBIT
–
4
QUARTER
and
FULL
YEAR
23
th
R&D summary:
General corporate costs:
(6.9)
(6.4)
(6.3)
(26.0)
(24.4)
(26.0)
(30)
(25)
(20)
(15)
(10)
(5)
0
FY13
FY14
FY15
Research and Development
Q4 EBIT
Full Year
(10.6)
(11.8)
(12.4)
(30.4)
(42.7)
(45.7)
(50)
(40)
(30)
(20)
(10)
0
FY13
FY14
FY15
General Corporate Costs
1
Q4 EBIT
Full Year
•
Results
for
both
the
quarter
and
full
year
results
increased
due
to
higher :
•
Continued broadly in line with historic trend
•
Fluctuations reflect normal variation and timing in number of R&D
projects in process in any given period
•
Compensation related expenses
•
Discretionary expenses
•
Foreign exchange losses |
 PAGE
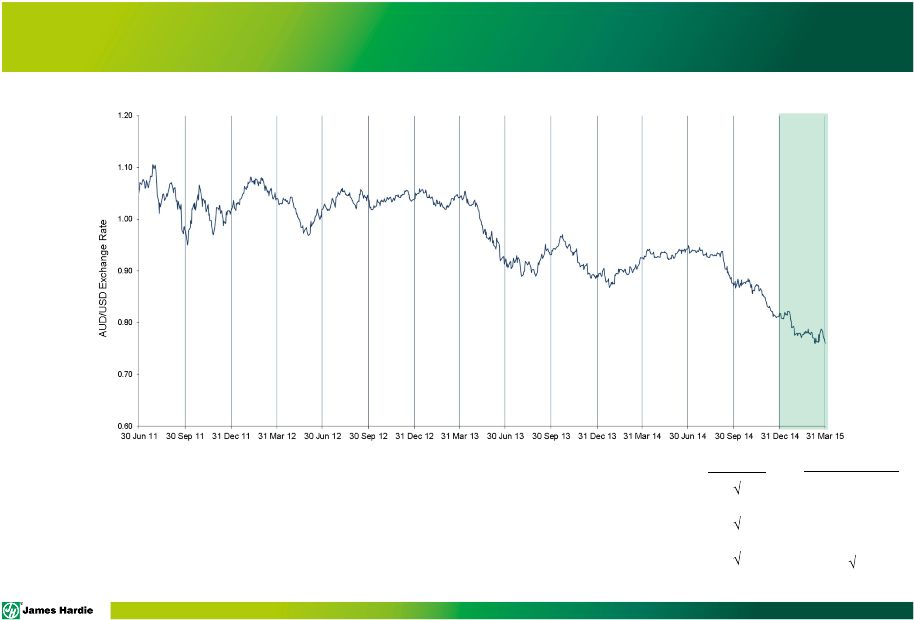
CHANGES IN AUD vs. USD
•
Unfavorable impact from translation of Asia Pacific results
•
Favorable impact on corporate costs incurred in Australian dollars
•
Favorable impact from translation of asbestos liability balance
24
Earnings
Balance
Sheet
N/A
N/A |
 PAGE
1
Includes Asbestos adjustments, AICF SG&A expenses and AICF interest expense,
net 2
Excludes tax effects of Asbestos and other tax adjustments
•
23.7% adjusted effective tax rate (ETR) for the year
•
Adjusted income tax expense and adjusted ETR increased
due to a higher proportion of taxable earnings in jurisdiction
with higher tax rates
•
The difference between adjusted income tax expense and
income tax expense decreased primarily due to lower
asbestos and other tax adjustments
•
Income taxes are paid and payable in Ireland, the US,
Canada, New Zealand and the Philippines
•
Income taxes are not currently paid or payable in Europe
(excluding Ireland) or Australia due to tax losses. Australian
tax losses primarily result from deductions relating to
contributions to AICF
INCOME TAX
25
Q4’15
Q4’14
FY15
FY14
Operating profit (loss) before taxes
7.6
(265.6)
322.6
54.6
Asbestos:
Asbestos adjustments
1
63.7
322.2
(32.3)
195.0
NZ weathertightness claims
(0.1)
1.1
(4.3)
1.8
Non-recurring stamp duty
4.2
-
4.2
-
Adjusted net operating profit
before taxes
75.4
57.7
290.2
251.4
Adjusted income tax expense
2
(18.1)
(12.4)
(68.8)
(54.2)
Adjusted effective tax rate
24.0%
23.7%
21.6%
Income tax benefit (expense)
20.1
78.8
(31.3)
44.9
Income taxes paid
35.6
11.6
Income taxes payable
1.8
5.4
Three Months and Full Year Ended 31 March
21.5% |
 PAGE
1
CASHFLOW
26
•
Net income increased US$191.8 million compared
to prior year
•
Cash flow from operations includes US$113.0
million contribution to AICF paid in Q2’15
•
Higher use of working capital primarily driven by
accounts payable and inventory:
•
Interest payable on senior unsecured notes
•
Inventory as the result of:
•
FY15 Fontana plant commissioning
•
Inventory build for the anticipated
demand in FY16
•
Capital expenditures include plant capacity
expansions and land and building purchases at
Tacoma and Rosehill facilities
•
US$397.5 million gross debt position as of Q4’15
1
Includes Asbestos Adjustments and changes in asbestos-related assets and
liabilities 2
Includes capitalized interest and proceeds from sale of property, plant and
equipment (US$ Millions)
FY 2015
FY 2014
Change (%)
Net Income
291.3
99.5
Asbestos related
1
(33.0)
194.1
Annual AICF contribution
(113.0)
-
Depreciation & Amortization
70.9
61.4
15
Working Capital
(12.8)
31.3
Other non-cash items
(23.9)
(63.5)
(62)
Cash Flow from Operations
179.5
322.8
(44)
Capital Expenditures
2
(277.9)
(114.7)
Acquisition of a business
-
(4.1)
Free Cash Flow
(98.4)
204.0
Dividends Paid
(390.1)
(199.1)
(96)
Net proceeds from long-term debt
389.1
-
Share related activities
(3.6)
12.8
Free Cash Flow after Financing Activities
(103.0)
17.7 |
 PAGE
CAPEX
27
•
Continuing to invest in capacity expansion in
the US and Australia
•
Construction on brownfield capacity projects
nearing completion:
•
Plant City, FL
•
Cleburne, TX
•
Carole Park, Australia
•
Opportunistic land purchases completed at
Tacoma (US) and Rosehill (Australia) sites
•
Maintenance and other CAPEX consistent
with historical trend
CAPEX Spend -
Full Year FY15
$65.8
$107.3
$103.1
Land and Buildings
Capacity
Maintenance & Other |
 PAGE
FINANCIAL MANAGEMENT SUPPORTING GROWTH
28
1
2
Strong Financial
Management
Disciplined Capital
Allocation
Strong margins and
operating cash flows
Strong governance and
transparency
Investment-grade financial
management
Investing in R&D and capacity
expansion to support organic
growth
Maintain ordinary dividends within
the defined payout ratio
Flexibility for:
•
Accretive and strategic
inorganic opportunities
•
Withstand market cycles
•
Consider further
shareholder returns when
appropriate
3
Liquidity and
Funding
~$590 million of bank
facilities, 64% liquidity as of
Q4’15
2.4 year weighted average
maturity of bank facilities
Completed the sale of US$325
million 8 year 5.875% senior
unsecured notes
Conservative leveraging of
balance sheet within 1-2
times adjusted EBITDA target
Financial management consistent with an investment grade credit.
Ability to withstand market cycles and other unanticipated events.
|
 PAGE
LIQUIDITY PROFILE
29
•
Strong balance sheet position:
•
US$67.0 million of cash
•
US$590 million of bank debt facilities
•
US$325
million
8
year
unsecured
notes
•
64% liquidity as of Q4’15
•
As of Q4’15, we had net debt of US$330.5 million
compared to net cash of US$167.5 million at Q4’14
•
In Q4’15 we completed the sale of US$325 million
senior unsecured notes in the U.S. high yield market
•
8 year maturity, interest at 5.875% p.a.
•
Net Debt within target range of 1-2 times EBITDA
excluding asbestos
•
We remain in compliance with all debt covenants
1
Debt maturities as at Q4’15 were as follows: US$50 million in Q4’16,
US$150 million in Q1’17, US$100 million in Q1’18, US$125 million Q3’18, US$40 million in
Q4’19, US$125 million in Q1’20 and US$325 million in Q4’23
2
Callable from February 2018
Liquidity Profile
Full Year FY15
Cash
US$67.0 million
Total Combined Bank Facilities
US$590.0 million
Drawn Bank Facilities
US$75.0 million
Undrawn Bank Facilities
US$515.0 million
Weighted Average Interest Rate of drawn Bank Facilities
1.4%
Fixed / Floating Interest Ratio
106% fixed
Weighted Average Term (Bank Facilities)
2.4 years
Weighted Average Term (Total Facilities)
6.8 years
$50
$150
$225
$40
$125
$325
FY'16
FY'17
FY'18
FY'19
FY'20
FY'23
Debt
Maturity
Profile
1
2 |
 PAGE
•
For the full year, New Zealand weathertightness moved from an expense of US$1.8
million to a benefit of US$4.3 million. The benefit was largely due
to: •
Favorable claims settlements
•
Fewer open claims at the end of the period
•
Higher rate of claim resolution
•
A continued reduction in the number of new claims received
•
At 31 March 2015 and 31 March 2014, the provision for NZ weathertightness, net of
anticipated third-party recoveries was US$2.0 million and US$12.7
million, respectively 30
5.0
15.0
20.0
25.0
Q2'13
Q3'13
Q4'13
Q1'14
Q2'14
Q3'14
Q4'14
Q1'15
Q2'15
Q3'15
Q4'15
NZ Weathertightness Provision
10.0
NEW ZEALAND WEATHERTIGHTNESS CLAIMS
- |
 PAGE
ASBESTOS COMPENSATION
SUMMARY
31
Updated actuarial report completed as at 31 March 2015
Undiscounted and uninflated central estimate increased to US$1.566 billion from
US$1.547 billion Total
contributions
of
US$113.0
million
were
made
to
AICF
during
FY2015
from
our
FY2014
free
cash
flow
From the time AICF was established in February 2007, we have contributed A$718.1
million to the fund We
anticipate
we
will
make
a
further
contribution
of
approximately
US$62.8
million
to
AICF
on
1
July
2015.
This
amounts
represents
35%
of
our
free
cash
flow
for
financial
year
2015,
as
defined
by
the
AFFA |
 PAGE
FUNDING ARRANGEMENTS
32
FY15
FY14
Central Estimate – Undiscounted and Uninflated
1,565.9
1,546.6
Provision for claims handling costs of AICF
33.7
35.2
Other US GAAP adjustments
28.3
23.3
Net assets of AICF
(11.1)
(15.4)
Contributions for asbestos research and education
2.1
1.8
Effect of tax
(555.8)
(529.5)
Net post-tax unfunded liability in A$
1,063.1
1,062.0
Exchange rate US$ per A$1.00
0.7636
0.9220
Net post-tax unfunded liability in US$ millions
811.7
979.2
A$ millions (except where stated)
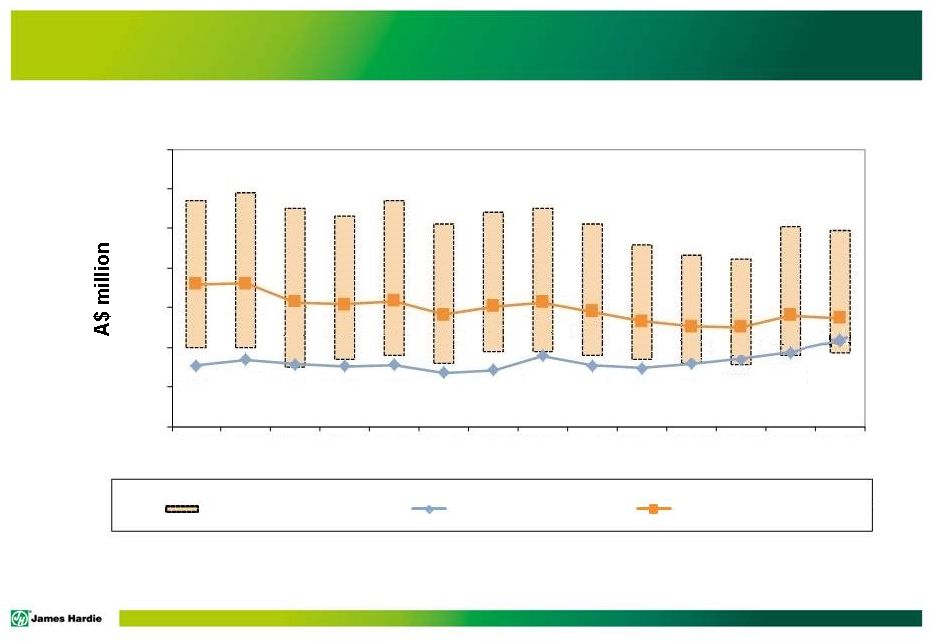
Change in estimate –
NPV is now A$2,143 million.
Increased from A$1,870 million at 31 March 2014
The A$273 million increase reflects A$205 million
increase due to lower discount rates and A$68
million arising from actuarial valuation assumption
changes
Claims reporting for mesothelioma –
11% higher
than previous year, 11% higher than actuarial
estimates. Other disease types in line with
actuarial expectations in aggregate
Average claim settlement sizes are lower than
actuarial estimates across all disease types
Large mesothelioma claims are lower in number
and average claim size than actuarial estimates |
 PAGE
UPDATED ACTUARIAL ESTIMATE
33
1,536
1,685
1,568
1,517
1,555
1,355
1,426
1,782
1,537
1,478
1,580
1,694
1,870
2,143
3,586
3,604
3,131
3,079
3,169
2,811
3,027
3,124
2,906
2,661
2,525
2,513
2,805
2,743
0
1,000
2,000
3,000
4,000
5,000
6,000
7,000
30 Jun
2004
31 Mar
2005
30 June
2005
31 Mar
2006
30 Sept
2006
31 Mar
2007
31 Mar
2008
31 Mar
2009
31 Mar
2010
31 Mar
2011
31 Mar
2012
31 Mar
2013
31 Mar
2014
31 Mar
2015
Sensitivity Range (net, undiscounted)
Discounted central estimate (net)
Undiscounted central estimate (net) |
 ASBESTOS
FUND
–
PRO
FORMA
34
Claims Data
For the quarter and full year ended 31 March 2015,
we note the following related to asbestos claims:
•
Claims received during the full year were 9%
above actuarial estimates and the prior period
corresponding period
•
The higher reported mesothelioma claims
experience noted during FY’14 has continued for
the current full year
•
Average claim settlement is flat for the full year,
compared to the prior corresponding period
•
Actual dollars paid in compensation was 4%
above the full year actuarial estimate
1 Average claim settlement is derived as the
total amount paid divided by the number of non-nil claim
2 This actuarial estimate is a function of the
assumed experience by disease type and the relative mix of settlements assumed by disease type. Any variances in the assumed mix of
settlements by disease type will have an impact on the average claim settlement
experience. FY15
FY14
% Change
Claims received
665
608
(9)
Actuarial estimate for the period
610
540
(13)
Difference in claims received to actuarial
estimate
(55)
(68)
19
Average claim settlement
1
(A$)
254,000
253,000
Actuarial estimate for the period
2
(A$)
289,000
262,000
(10)
Difference in claims paid to actuarial estimate
35,000
9,000
Full Year Ended 31 March
PAGE |
 PAGE
US
&
Europe
Fiber
Cement
•
Fiscal
year
2016
addressable
markets
broadly
in
line
with
fiscal
year
2015
growth
rates,
with
some
improvement
in
the
US
new
construction
compared
to
fiscal
year
2015
1
•
McGraw
Hill
Construction
US
Residential
Starts
forecasted
to
be
between
1.1
million
and
1.2
million
2
•
Repair
and
Remodel
Market
continues
to
grow
between
3%
and
4%
compared
to
prior
corresponding
period
•
Input
costs
expected
to
be
broadly
flat
in
fiscal
year
2016,
though
commodity
prices
remain
highly
variable
•
Average
sales
price
expected
to
rise
between
2%
and
3%,
subject
to
changes
in
product
mix
•
Segment
EBIT
margins
within
target
range
of
20%
to
25%
Asia
Pacific
Fiber
Cement
•
Asia
Pacific
businesses
will
continue
to
deliver
improved
results
in
line
with
growth
in
the
local
housing
and
alterations
and
additions
markets
of
the
regions
in
which
we
operate
Balance
Sheet
•
Conservative
leveraging
of
balance
sheet.
Gearing
to
be
within
1-2
times
adjusted
EBITDA,
with
corresponding
interest
expense
FY2016 KEY PLANNING ASSUMPTIONS
35
1
Addressable
starts
reflect
multi-family
low
and
single
family
homes.
It
excludes
multi-family
high.
2
FY15
new
construction
starts
were
1.0
million. |
 PAGE
•
Group
net
sales
increased
9%
and
11%
for
the
quarter
and
full
year
respectively,
when
compared
to
the
prior
corresponding
periods
•
Group
adjusted
net
operating
profit
increased
26%
for
the
quarter
and
12%
for
the
full
year
when
compared
to
the
prior
corresponding
periods
•
Results
driven
by
strong
primary
demand
growth
and
the
continued
focus
across
our
plants
on
operational
management
and
cost
management
across
the
Company
•
Strong
financial
management
and
disciplined
capital
allocation
driven
by:
•
Investing
in
high
return
organic
growth
including
organizational
capability
•
Investing
in
our
manufacturing
network
and
capacity
expansion
across
our
US
and
Australian
businesses
•
Declared
a
second
half
ordinary
and
a
FY2015
special
dividend
SUMMARY
36 |
 QUESTIONS |
 APPENDIX |
 PAGE
FINANCIAL SUMMARY
1
Asia
Pacific
Fiber
Cement
EBIT
excludes
New
Zealand
weathertightness
claims
benefit
of
US$0.1
million
and
US$1.1
million
in
expense
in
Q4
‘15
and
Q4’14,
respectively
and
US$4.3
million
benefit
and
US$1.8
million
in
expense,
in
FY15
and
FY14,
respectively
2
Excludes
Asbestos
related
expenses
and
adjustments
and
non-recurring
stamp
duty
39
US$ Millions
Q4 '15
Q4 '14
% Change
FY15
FY14
% Change
Net Sales
USA and Europe Fiber Cement
325.1
$
288.2
$
13
1,276.5
$
1,127.6
$
13
Asia Pacific Fiber Cement
86.2
88.2
(2)
380.4
366.2
4
Total Net Sales
411.3
$
376.4
$
9
1,656.9
$
1,493.8
$
11
EBIT -
US$ Millions
USA and Europe Fiber Cement
79.6
$
57.2
$
39
285.9
$
237.0
$
21
Asia Pacific Fiber Cement
1
19.9
18.4
8
89.8
82.9
8
Research & Development
(6.3)
(6.4)
2
(26.0)
(24.4)
(7)
General Corporate
2
(12.4)
(11.8)
(5)
(45.7)
(42.7)
(7)
Adjusted EBIT
80.8
$
57.4
$
41
304.0
$
252.8
$
20
Net interest expense excluding AICF interest income
(4.4)
(0.9)
(8.9)
(4.0)
Other (expense) income
(1.0)
1.2
(4.9)
2.6
Adjusted income tax expense
(18.1)
(12.4)
(46)
(68.8)
(54.2)
(27)
Adjusted net operating profit
57.3
$
45.3
$
26
221.4
$
197.2
$
12
Three Months and Full Year Ended 31 March |
 PAGE
1
Excludes
asbestos
adjustments,
AICF
SG&A
expenses,
AICF
interest
income,
New
Zealand
weathertightness
claims,
tax
adjustments
and
non-recurring
stamp
duty
2
Excludes
asbestos
adjustments,
AICF
SG&A
expenses,
New
Zealand
weathertightness
claims
and
non-recurring
stamp
duty
KEY RATIOS
40
2015
2014
2013
EPS (Diluted)
1
(US Cents)
50c
44c
32c
Dividend Paid per share
88c
45c
43c
Return on Shareholders’
Funds
1
14.6%
48.1%
34.9%
Return on Capital Employed
2
28.6%
23.8%
17.2%
EBIT/ Sales (Adjusted EBIT margin)
2
18.3%
16.9%
13.7%
Gearing Ratio
1
20.5%
(19.4%)
(12.9%)
Net Interest Expense Cover
2
34.2x
63.2x
39.3x
Net Interest Paid Cover
2
66.1x
-
-
Net Debt Payback
1.0x
-
-
Full Year Ended 31 March |
 PAGE
EBITDA –
FULL YEAR
41
1
Asia Pacific Fibre Cement EBIT excludes New Zealand weathertightness benefit of
US$4.3 million in fiscal year 2015 and expense of US$1.8 million in fiscal year 2014.
2
EBITDA excluding Asbestos Adjustments, New Zealand weathertightness and
non-recurring stamp duty US$ Millions
FY15
FY14
% Change
EBIT
USA and Europe Fiber Cement
$ 285.9
$
237.0 21
Asia Pacific Fiber Cement
1
89.8
82.9
8
Research & Development
(26.0)
(24.4)
(7)
General Corporate excluding asbestos and non-recurring stamp duty
(45.7)
(42.7)
(7)
Depreciation and Amortisation
USA and Europe Fiber Cement
60.9
53.1
15
Asia Pacific Fiber Cement
10.0
8.3
20
EBITDA
2
374.9
314.2
19
Asbestos adjustments
33.4
(195.8)
AICF SG&A expenses
(2.5)
(2.1)
(19)
New Zealand weathertightness claims
4.3
(1.8)
Non-recurring stamp duty
(4.2)
-
Total EBITDA
$ 405.9
$
114.5 Full Year Ended 31 March |
 PAGE
NET INTEREST EXPENSE
42
US$ Millions
Q4 FY15
Q4 FY14
FY15
FY14
Gross interest expense
(4.9)
(0.9)
(9.7)
(3.9)
Capitalized interest
1.1
-
1.7
-
Interest income
-
0.1
0.4
0.5
Realized loss on interest rate swaps
(0.6)
(0.1)
(1.3)
(0.6)
Net interest expense excluding AICF interest
income
(4.4)
(0.9)
(8.9)
(4.0)
AICF net interest income
0.4
0.5
1.4
2.9
Net interest expense
(4.0)
(0.4)
(7.5)
(1.1)
Three Months and Full Year Ended 31 March |
 PAGE
ASBESTOS CASH MOVEMENTS FOR FULL YEAR ENDED 31 MARCH
43
A$ millions
AICF cash and investments - 31 March 2014
65.5
Contribution to AFFA by James Hardie
119.9
Insurance recoveries
33.2
Loan Drawdowns
17.7
Loan Repayments
(51.0)
Interest income, net
1.6
Claims paid
(154.3)
Operating costs
(4.7)
Other
1.0
AICF cash and investments - 31 March 2015
28.9 |
 PAGE
DEFINITIONS AND OTHER TERMS
This
Management
Presentation
forms
part
of
a
package
of
information
about
the
company’s
results.
It
should
be
read
in
conjunction
with
the
other
parts
of
this
package,
including
the
Management’s
Analysis
of
Results,
Media
Release
and
Consolidated
Financial
Statements
Definitions
Non-financial Terms
AFFA
–
Amended and Restated Final Funding Agreement
AICF
–
Asbestos Injuries Compensation Fund Ltd
NBSK –
Northern Bleached Soft Kraft; the company's benchmark grade of pulp
Legacy
New
Zealand
weathertightness
claims
(“New
Zealand
weathertightness
claims”)
–
Expenses
arising
from
defending
and
resolving
claims
in
New
Zealand
that
allege
poor
building
design,
inadequate
certification
of
plans,
inadequate
construction
review
and
compliance
certification
and
deficient
work
by
sub-contractors
44 |
 PAGE
DEFINITIONS AND OTHER TERMS
Financial Measures –
US GAAP equivalents
This
document
contains
financial
statement
line
item
descriptions
that
are
considered
to
be
non-US
GAAP,
but
are
consistent
with
those
used
by
Australian
companies.
Because
the
company
prepares
its
Consolidated
Financial
Statements
under
US
GAAP,
the
following
table
cross-references
each
non-US
GAAP
line
item
description,
as
used
in
Management’s
Analysis
of
Results
and
Media
Release,
to
the
equivalent
US
GAAP
financial
statement
line
item
description
used
in
the
company’s
Condensed
Consolidated
Financial
Statements:
45
Management's Discussion and Analysis of Results
and Media Release
Consolidated Statements of Operations and Other
Comprehensive Income (Loss) (US GAAP)
Net sales
Net sales
Cost of goods sold
Cost of goods sold
Gross profit
Gross profit
Selling, general and administrative expenses
Selling, general and administrative expenses
Research and development expenses
Research and development expenses
Asbestos adjustments
Asbestos adjustments
EBIT*
Operating income (loss)
Net interest income (expense)*
Sum of interest expense and interest income
Other income (expense)
Other income (expense)
Operating profit (loss) before income taxes*
Income (loss) before income taxes
Income tax (expense) benefit
Income tax (expense) benefit
Net operating profit (loss)*
Net income (loss)
*- Represents non-US GAAP descriptions used by Australian companies
|
 PAGE
DEFINITIONS AND OTHER TERMS
EBIT
margin
–
EBIT
margin
is
defined
as
EBIT
as
a
percentage
of
net
sales
Sales Volumes
mmsf
–
million
square
feet,
where
a
square
foot
is
defined
as
a
standard
square
foot
of
5/16”
thickness
msf
–
thousand
square
feet,
where
a
square
foot
is
defined
as
a
standard
square
foot
of
5/16”
thickness
Financial Ratios
Gearing
Ratio
–
Net
debt
(cash)
divided
by
net
debt
(cash)
plus
shareholders’
equity
Net
interest
expense
cover
–
EBIT
divided
by
net
interest
expense
(excluding
loan
establishment
fees)
Net
interest
paid
cover
–
EBIT
divided
by
cash
paid
during
the
period
for
interest,
net
of
amounts
capitalised
Net
debt
payback
–
Net
debt
(cash)
divided
by
cash
flow
from
operations
Net
debt
(cash)
–
Short-term
and
long-term
debt
less
cash
and
cash
equivalents
Return
on
capital
employed
–
EBIT
divided
by
gross
capital
employed
46 |
 PAGE
Adjusted
EBIT
and
Adjusted
EBIT
margin
–
Adjusted
EBIT
and
Adjusted
EBIT
margin
are
not
measures
of
financial
performance
under
US
GAAP
and
should
not
be
considered
to
be
more
meaningful
than
EBIT
and
EBIT
margin.
Management
has
included
these
financial
measures
to
provide
investors
with
an
alternative
method
for
assessing
its
operating
results
in
a
manner
that
is
focused
on
the
performance
of
its
ongoing
operations
and
provides
useful
information
regarding
its
financial
condition
and
results
of
operations.
Management
uses
these
non-US
GAAP
measures
for
the
same
purposes.
NON-US GAAP FINANCIAL MEASURES
47
US$ Millions
Q4 FY15
Q4 FY14
FY15
FY14
EBIT
12.6
$
(266.4)
$
335.0
$
53.1
$
Asbestos:
Asbestos adjustments
63.5
322.0
(33.4)
195.8
AICF SG&A expenses
0.6
0.7
2.5
2.1
New Zealand weathertightness claims
(0.1)
1.1
(4.3)
1.8
Non-recurring stamp duty
4.2
-
4.2
-
Adjusted EBIT
80.8
57.4
304.0
252.8
Net sales
411.3
$
376.4
$
1,656.9
$
1,493.8
$
Adjusted EBIT margin
19.6%
15.3%
18.3%
16.9%
Three Months and Full Year Ended 31 March |
 PAGE
Adjusted
net
operating
profit
–
Adjusted
net
operating
profit
is
not
a
measure
of
financial
performance
under
US
GAAP
and
should
not
be
considered
to
be
more
meaningful
than
net
operating
profit.
Management
has
included
this
financial
measure
to
provide
investors
with
an
alternative
method
for
assessing
its
operating
results
in
a
manner
that
is
focused
on
the
performance
of
its
ongoing
operations.
Management
uses
this
non-US
GAAP
measure
for
the
same
purposes.
NON-US GAAP FINANCIAL MEASURES
48
US$ Millions
Q4 FY15
Q4 FY14
FY15
FY14
Net operating profit
27.7
$
(186.8)
$
291.3
$
99.5
$
Asbestos:
Asbestos adjustments
63.5
322.0
(33.4)
195.8
AICF SG&A expenses
0.6
0.7
2.5
2.1
AICF interest income, net
(0.4)
(0.5)
(1.4)
(2.9)
New Zealand weathertightness claims
(0.1)
1.1
(4.3)
1.8
Non-recurring stamp duty
4.2
-
4.2
-
Asbestos and other tax adjustments
(38.2)
(91.2)
(37.5)
(99.1)
Adjusted net operating profit
57.3
$
45.3
$
221.4
$
197.2
$
Three Months and Full Year Ended 31 March |
 PAGE
Adjusted
diluted
earnings
per
share
–
Adjusted
diluted
earnings
per
share
is
not
a
measure
of
financial
performance
under
US
GAAP
and
should
not
be
considered
to
be
more
meaningful
than
diluted
earnings
per
share.
Management
has
included
this
financial
measure
to
provide
investors
with
an
alternative
method
for
assessing
its
operating
results
in
a
manner
that
is
focused
on
the
performance
of
its
ongoing
operations.
Management
uses
this
non-US
GAAP
measure
for
the
same
purposes.
49
NON-US GAAP FINANCIAL MEASURES
Q4 FY15
Q4 FY14
FY15
FY14
Adjusted net operating profit (US$ millions)
57.3
$
45.3
$
221.4
$
197.2
$
Weighted average common shares outstanding -
Diluted (millions)
446.4
445.8
446.4
444.6
Adjusted diluted earnings per share (US cents)
13
10
50
44
Three Months and Full Year Ended 31 March |
 PAGE
Adjusted
effective
tax
rate
on
earnings
–
Adjusted
effective
tax
rate
on
earnings
is
not
a
measure
of
financial
performance
under
US
GAAP
and
should
not
be
considered
to
be
more
meaningful
than
effective
tax
rate.
Management
has
included
this
financial
measure
to
provide
investors
with
an
alternative
method
for
assessing
its
operating
results
in
a
manner
that
is
focused
on
the
performance
of
its
ongoing
operations.
Management
uses
this
non-US
GAAP
measure
for
the
same
purposes.
50
NON-US GAAP FINANCIAL MEASURES
US$ Millions
Q4 FY15
Q4 FY14
FY15
FY14
Operating profit before income taxes
7.6
$
(265.6)
$
322.6
$
54.6
$
Asbestos:
Asbestos adjustments
63.5
322.0
(33.4)
195.8
AICF SG&A expenses
0.6
0.7
2.5
2.1
AICF interest expense, net
(0.4)
(0.5)
(1.4)
(2.9)
New Zealand weathertightness claims
(0.1)
1.1
(4.3)
1.8
Non-recurring stamp duty
4.2
-
4.2
-
Adjusted operating profit before income taxes
75.4
$
57.7
$
290.2
$
251.4
$
Income tax benefit (expense)
20.1
$
78.8
$
(31.3)
$
44.9
$
Asbestos-related and other tax adjustments
(38.2)
(91.2)
(37.5)
(99.1)
Adjusted income tax (expense)
(18.1)
$
(12.4)
$
(68.8)
$
(54.2)
$
Effective tax rate
(264.5%)
29.7%
9.7%
(82.2%)
Adjusted effective tax rate
24.0%
21.5%
23.7%
21.6%
Three Months and Full Year Ended March |
 PAGE
Adjusted
EBITDA
–
is
not
a
measure
of
financial
performance
under
US
GAAP
and
should
not
be
considered
an
alternative
to,
or
more
meaningful
than,
income
from
operations,
net
income
or
cash
flows
as
defined
by
US
GAAP
or
as
a
measure
of
profitability
or
liquidity.
Not
all
companies
calculate
Adjusted
EBITDA
in
the
same
manner
as
James
Hardie
has
and,
accordingly,
Adjusted
EBITDA
may
not
be
comparable
with
other
companies.
Management
has
included
information
concerning
Adjusted
EBITDA
because
it
believes
that
this
data
is
commonly
used
by
investors
to
evaluate
the
ability
of
a
company’s
earnings
from
its
core
business
operations
to
satisfy
its
debt,
capital
expenditure
and
working
capital
requirements
NON-US GAAP FINANCIAL MEASURES
51
US$ Millions
Q4 FY15
Q4 FY14
FY15
FY14
EBIT
12.6
$
(266.4)
$
335.0
$
53.1
$
Depreciation and amortization
18.9
15.2
70.9
61.4
Adjusted EBITDA
31.5
$
(251.2)
$
405.9
$
114.5
$
Three Months and Full Year Ended 31 March |
 PAGE
Adjusted
selling,
general
and
administrative
expenses
–
Adjusted
selling,
general
and
administrative
expenses
is
not
a
measure
of
financial
performance
under
US
GAAP
and
should
not
be
considered
to
be
more
meaningful
than
selling,
general
and
administrative
expenses.
Management
has
included
these
financial
measures
to
provide
investors
with
an
alternative
method
for
assessing
its
operating
results
in
a
manner
that
is
focused
on
the
performance
of
its
ongoing
operations
and
provides
useful
information
regarding
its
financial
condition
and
results
of
operations.
Management
uses
these
non-US
GAAP
measures
for
the
same
purposes.
NON-US GAAP FINANCIAL MEASURES
52
US$ Millions
Q4 FY15
Q4 FY14
FY15
FY14
Selling, general and administrative expenses
68.8
$
61.9
$
245.5
$
224.4
$
Excluding:
New Zealand weathertightness claims benefit (expense)
0.1
(1.1)
4.3
(1.8)
AICF SG&A expenses
(0.6)
(0.7)
(2.5)
(2.1)
Non-recurring stamp duty
(4.2)
-
(4.2)
-
Adjusted selling, general and administrative expenses
64.1
$
60.1
$
243.1
$
220.5
$
Net Sales
411.3
$
376.4
$
1,656.9
$
1,493.8
$
Selling, general and administrative expenses as a percentage
of net sales
16.7%
16.4%
14.8%
15.0%
Adjusted selling, general and administrative expenses
as a percentage of net sales
15.6%
16.0%
14.7%
14.8%
Three Months and Full Year Ended 31 March |
 Q4
FY15 MANAGEMENT PRESENTATION 21 May 2015 |