Exhibit 99.3
JH James Hardie
BUILDING
FOR GROWTH
2015 ANNUAL REVIEW
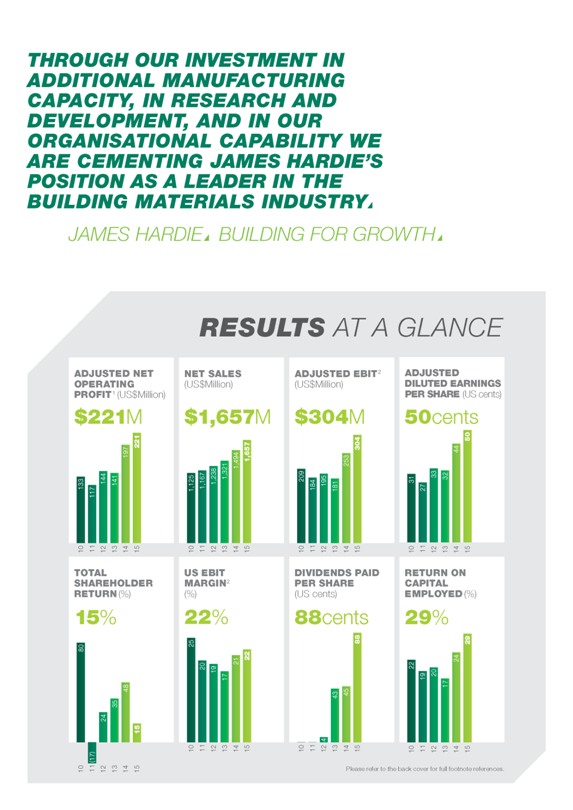
THROUGH OUR INVESTMENT IN ADDITIONAL MANUFACTURING CAPACITY, IN RESEARCH AND DEVELOPMENT, AND IN OUR ORGANISATIONAL CAPABILITY WE ARE CEMENTING
JAMES HARDIE’S POSITION AS A LEADER IN THE BUILDING MATERIALS INDUSTRY
JAMES HARDIE BUILDING FOR GROWTH
RESULTS AT A GLANCE ADJUSTED NET OPERATING PROFIT1 (US$Million) $221M 221 197 133 144 141 117 10 11 12 13 14 15 NET SALES (US$Million) (US$Million) $1,657M 1,494 1,657 1,321 1,125 1,167
1,238 10 11 12 13 14 15 ADJUSTED EBIT2 $304M 304 253 209 184 195 181 10 11 12 13 14 15 ADJUSTED DILUTED EARNINGS PER SHARE (US cents) 50cents 44 50 33 32 31 27 10 11 12 13 14 15
TOTAL SHAREHOLDER RETURN (%) 15% 80 48 35 24 15 (17) 10 11 12 13 14 15 US EBIT MARGIN2 (%) (US cents) 22% 25 21 22 20 19 17 10 11 12 13 14 15 DIVIDENDS PAID PER SHARE 88cents 88 43 45 4 10
11 12 13 14 15 RETURN ON CAPITAL EMPLOYED (%) 29% 29 24 22 19 20 17 10 11 12 13 14 15
Please refer to the back cover for full footnote references.
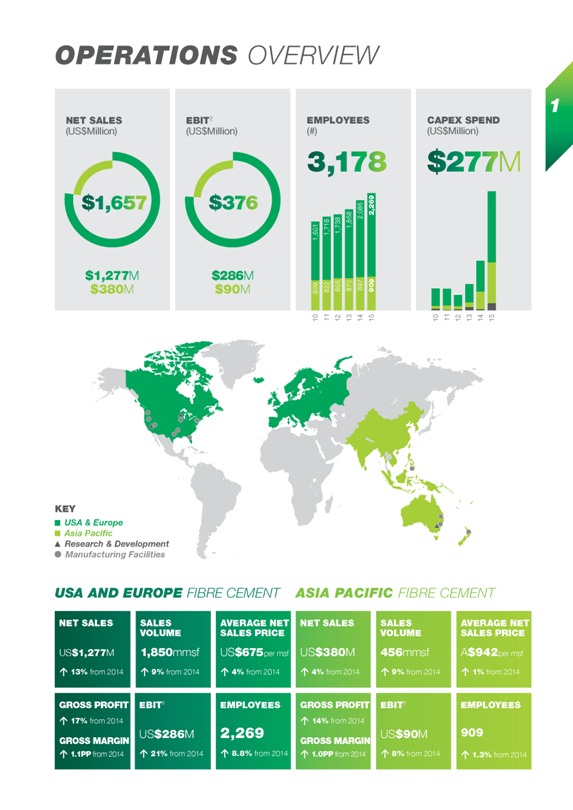
OPERATIONS OVERVIEW
1
NET SALES
(US$Million)
$1,657
$1,277M
$380M
EBIT2
(US$Million)
$376
$286M
$90M
EMPLOYEES
(#)
3,178
1,601
809
10
1,718
822
11
1,738
866
12
1,868
870
13
2,086
897
14
(US$Million)
2,269
909
15
CAPEX SPEND
$277M
10
11 12 13 14 15
KEY
USA & Europe
Asia Pacific
Research & Development
Manufacturing Facilities
USA AND EUROPE FIBRE CEMENT ASIA PACIFIC FIBRE CEMENT
NET SALES
US$1,277M
13% from 2014
GROSS PROFIT
17% from 2014
GROSS MARGIN
1.1PP from 2014
SALES
VOLUME
1,850mmsf
9% from 2014
EBIT2
US$286M
21% from 2014
AVERAGE NET SALES PRICE
US$675per msf
4% from 2014
EMPLOYEES
2,269
8.8% from 2014
NET SALES
US$380M
4% from 2014
GROSS PROFIT
14% from 2014
GROSS MARGIN
1.0PP from 2014
SALES VOLUME
456mmsf
9% from 2014
EBIT2
US$90M
8% from 2014
AVERAGE NET SALES PRICE
A$942per msf
1% from 2014
EMPLOYEES
909
1.3% from 2014
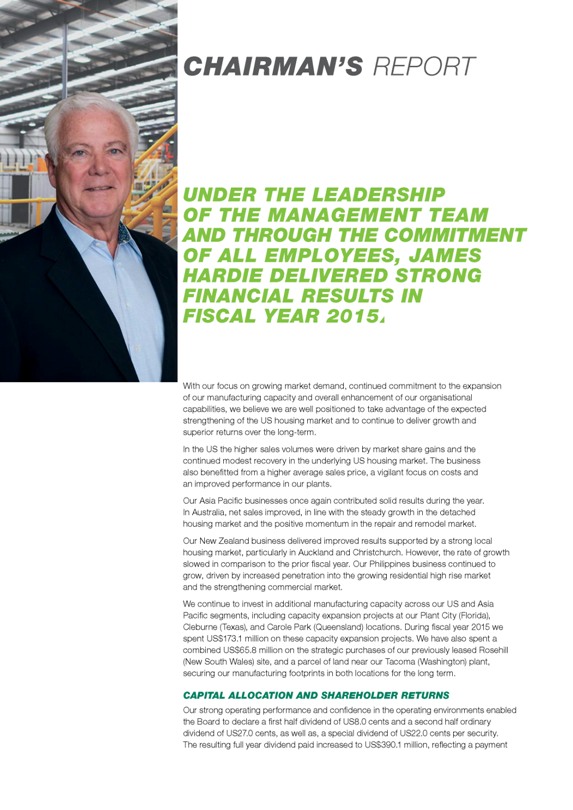
CHAIRMAN’S REPORT
UNDER THE LEADERSHIP OF THE MANAGEMENT TEAM AND
THROUGH THE COMMITMENT OF ALL EMPLOYEES, JAMES HARDIE DELIVERED STRONG FINANCIAL RESULTS IN FISCAL YEAR 2015
With our focus on growing market demand, continued commitment to
the expansion of our manufacturing capacity and overall enhancement of our organisational capabilities, we believe we are well positioned to take advantage of the expected strengthening of the US housing market and to continue to deliver growth and
superior returns over the long-term.
In the US the higher sales volumes were driven by market share gains and the continued modest recovery in the underlying US housing
market. The business also benefitted from a higher average sales price, a vigilant focus on costs and an improved performance in our plants.
Our Asia Pacific businesses once
again contributed solid results during the year. In Australia, net sales improved, in line with the steady growth in the detached housing market and the positive momentum in the repair and remodel market.
Our New Zealand business delivered improved results supported by a strong local housing market, particularly in Auckland and Christchurch. However, the rate of growth slowed in comparison to
the prior fiscal year. Our Philippines business continued to grow, driven by increased penetration into the growing residential high rise market and the strengthening commercial market.
We continue to invest in additional manufacturing capacity across our US and Asia Pacific segments, including capacity expansion projects at our Plant City (Florida), Cleburne (Texas), and
Carole Park (Queensland) locations. During fiscal year 2015 we spent US$173.1 million on these capacity expansion projects. We have also spent a combined US$65.8 million on the strategic purchases of our previously leased Rosehill (New South Wales)
site, and a parcel of land near our Tacoma (Washington) plant, securing our manufacturing footprints in both locations for the long term.
CAPITAL ALLOCATION AND SHAREHOLDER
RETURNS
Our strong operating performance and confidence in the operating environments enabled the Board to declare a first half dividend of US8.0 cents and a second half
ordinary dividend of US27.0 cents, as well as, a special dividend of US22.0 cents per security. The resulting full year dividend paid increased to US$390.1 million, reflecting a payment
3
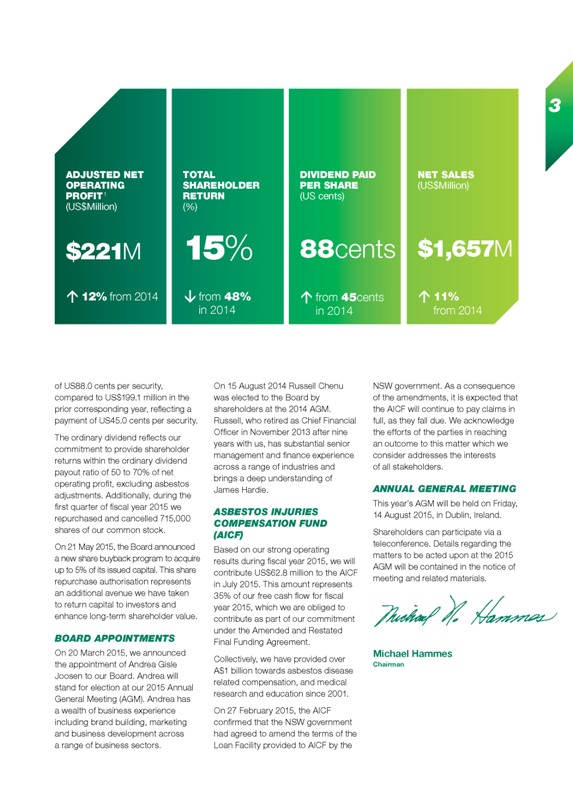
ADJUSTED NET OPERATING PROFIT1 (US$Million) $221M 12% from 2014
TOTAL SHAREHOLDER RETURN (%) 15% from 48% in 2014
DIVIDEND PAID PER SHARE (US cents) 88cents from
45cents in 2014
NET SALES (US$Million) $1,657M 11% from 2014
of US88.0 cents per security,
compared to US$199.1 million in the prior corresponding year, reflecting a payment of US45.0 cents per security. The ordinary dividend reflects our commitment to provide shareholder returns within the ordinary dividend payout ratio of 50 to 70% of
net operating profit, excluding asbestos adjustments. Additionally, during the first quarter of fiscal year 2015 we repurchased and cancelled 715,000 shares of our common stock.
On 21 May 2015, the Board announced a new share buyback program to acquire up to 5% of its issued capital. This share repurchase authorisation represents an additional avenue we have taken
to return capital to investors and enhance long-term shareholder value.
BOARD APPOINTMENTS
On 20
March 2015, we announced the appointment of Andrea Gisle Joosen to our Board. Andrea will stand for election at our 2015 Annual General Meeting (AGM). Andrea has a wealth of business experience including brand building, marketing and business
development across a range of business sectors.
On 15 August 2014 Russell Chenu was elected to the Board by shareholders at the 2014 AGM. Russell, who retired as Chief
Financial Officer in November 2013 after nine years with us, has substantial senior management and finance experience across a range of industries and brings a deep understanding of James Hardie.
ASBESTOS INJURIES COMPENSATION FUND (AICF)
Based on our strong operating results during fiscal year 2015, we will
contribute US$62.8 million to the AICF in July 2015. This amount represents 35% of our free cash flow for fiscal year 2015, which we are obliged to contribute as part of our commitment under the Amended and Restated Final Funding Agreement.
Collectively, we have provided over A$1 billion towards asbestos disease related compensation, and medical research and education since 2001. On 27 February 2015, the AICF
confirmed that the NSW government had agreed to amend the terms of the Loan Facility provided to AICF by the NSW government. As a consequence of the amendments, it is expected that the AICF will continue to pay claims in full, as they fall due. We
acknowledge the efforts of the parties in reaching an outcome to this matter which we consider addresses the interests of all stakeholders.
ANNUAL GENERAL MEETING
This year’s AGM will be held on Friday,
14 August 2015, in Dublin, Ireland.
Shareholders can participate via a teleconference. Details regarding the matters to be acted upon at the 2015 AGM will be contained in the notice of meeting and related materials.
Michael Hammes
Chairman
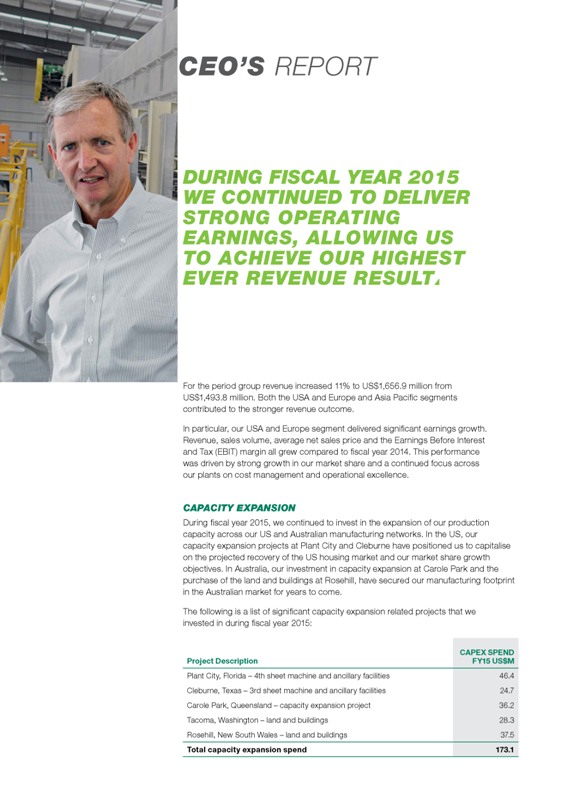
CEO’S REPORT
DURING FISCAL YEAR 2015 WE CONTINUED TO DELIVER
STRONG OPERATING EARNINGS, ALLOWING US TO ACHIEVE OUR HIGHEST EVER REVENUE RESULT
For the period group revenue increased 11% to US$1,656.9 million from US$1,493.8 million.
Both the USA and Europe and Asia Pacific segments contributed to the stronger revenue outcome.
In particular, our USA and Europe segment delivered significant earnings
growth. Revenue, sales volume, average net sales price and the Earnings Before Interest and Tax (EBIT) margin all grew compared to fiscal year 2014. This performance was driven by strong growth in our market share and a continued focus across our
plants on cost management and operational excellence.
CAPACITY EXPANSION
During fiscal year 2015,
we continued to invest in the expansion of our production capacity across our US and Australian manufacturing networks. In the US, our capacity expansion projects at Plant City and Cleburne have positioned us to capitalise on the projected recovery
of the US housing market and our market share growth objectives. In Australia, our investment in capacity expansion at Carole Park and the purchase of the land and buildings at Rosehill, have secured our manufacturing footprint in the Australian
market for years to come.
The following is a list of significant capacity expansion related projects that we invested in during fiscal year 2015:
Project Description
CAPEX SPEND FY15 US$M
Plant City, Florida – 4th sheet machine and ancillary facilities 46.4
Cleburne, Texas – 3rd sheet
machine and ancillary facilities 24.7
Carole Park, Queensland – capacity expansion project 36.2
Tacoma, Washington – land and buildings 28.3
Rosehill, New South Wales – land and buildings 37.5
Total capacity expansion spend 173.1
5
USA AND EUROPE FIBRE CEMENT
For fiscal year 2015, revenue for our USA and Europe segment increased 13% to US$1,276.5 million from US$1,127.6 million, reflecting higher sales volumes and a higher average net sales
price. The increase in sales volume compared to the prior year was primarily driven by increased market penetration and modest growth in the repair and remodel segment and new construction market. The increase in the average net sales price reflects
the ongoing execution of our pricing strategies, favourable product mix and the reduction of pricing inefficiencies, when compared to the prior year.
Production costs for
fiscal year 2015, compared to the prior year, were higher predominantly due to higher input costs, which were driven by an increase in market prices for pulp, silica and natural gas, as well as, higher costs associated with starting up our Fontana,
California facility. The higher input costs were partially offset by improved performance of our plants and economies of scale achieved across the network.
EBIT increased
21% to US$285.9 million from US$237.0 million in the prior year, which reflected higher volumes, a higher average net sales price and higher gross margins compared to the prior year. Our 22.4% EBIT margin for the segment was 1.4 percentage points
higher than the prior year and within our target range of 20% to 25%.
ASIA PACIFIC FIBRE CEMENT
For fiscal year 2015, our Asia Pacific segment contributed higher operating earnings. In US dollars, revenue increased 4% to US$380.4 million, compared with US$366.2 million
in the prior year, despite being unfavourably impacted by the depreciation in the Australian dollar/US dollar average exchange rate. In Australian dollars, the Asia Pacific revenue increased 11% over the prior year to A$434.5 million, largely due to
an increase in sales volume and a higher average net sales price.
In our Australian business, the key drivers of revenue growth were favourable conditions in our target
markets and a favourable product mix. In New Zealand, volume grew across all regions; however, revenue growth was partially offset by a lower average selling price due to product mix. In our Philippines business, revenue was driven higher, compared
to the prior year, by growth in our underlying operating environment and continued market penetration. EBIT1, in US dollars, increased 8% from US$82.9 million to US$89.8 million in the Asia Pacific segment. In Australian dollars, EBIT1 increased 15%
compared to the prior year, due to an increase in the Australian dollar average net sales price, and flat production costs, driven by higher input costs offset by improved plant performance.
Our 23.6% EBIT1 margin for the segment was 1.0 percentage points higher than the prior year.
OUTLOOK
In fiscal year 2016, we expect to continue to grow our market position and see an increase in the EBIT of our USA and Europe segment as the US housing market continues to recover and we
pursue our market share growth strategies.
Operating earnings from our Australian business are expected to increase in line with expected growth in new detached dwellings
and an improving repair and remodel market. The New Zealand business is expected to deliver improved results although at a more moderate rate of growth than the prior year. The Philippines business is also expected to grow, driven by further primary
demand growth in the region.
On behalf of our management team, I want to express my appreciation to all of our employees and business partners for helping us achieve strong
operating results in fiscal year 2015. While we are pleased with these results, our strategic focus continues to be on the future.
Looking to fiscal year 2016, I am
confident that our management team will continue to take the steps necessary to successfully execute our business strategy and drive profitable growth.
Louis Gries
CEO
1 Excludes New Zealand weathertightness claims.
6
SUSTAINABILITY REPORT
MANUFACTURING
James Hardie recognises the importance of minimising our impact on the environment. Sustainable,
efficient manufacturing remains critical to our success and we take pride in continuing to develop new initiatives and sustainable practices to improve our manufacturing efficiency while also reducing our impact on the environment.
In the United States, our Peru (Illinois), Reno (Nevada), and Pulaski (Virginia) manufacturing facilities are ISO 14001 certified. ISO 14001 is a voluntary certification issued by a third
party certified auditor attesting that we have established the environmental management best practices as documented in the ISO 14001 requirements framework. These best practices include a standardised approach to environmental training, internal
auditing, record keeping and documentation, as well as continuous improvement processes from a resource conservation and energy reduction perspective.
A key aspect driving
our manufacturing efficiency is the recycling of input materials. For instance, we re-introduce sludge and dust back into our manufacturing process. Water usage forms a critical part of the fibre cement manufacturing process and is reused at least
four times before it is treated and released. We continue to research new water optimisation technologies as part of a continuous effort to reduce both the amount of fresh water used and discharged. Additionally, our plants reuse reject product as
raw materials for packaging and pallets to transport our products.
Our recent capacity expansion at Plant City (Florida), Cleburne (Texas) and Carole Park (Queensland) has
provided many benefits from a manufacturing efficiency stand point and, importantly, the newly installed machines are state of the art in terms of sustainability and reducing waste. Another benefit arising from the recent capacity expansion at
Carole Park is that the plant can now manufacture, at this site, a wider range of products including the Scyon™ advanced cement composite building product range. By significantly reducing the distance required to transport our product to
distributors it minimises shipping distances and consequently fuel consumption.
PRODUCTS
While
sustainable, efficient manufacturing processes are an integral part of James Hardie’s story, the development of industry leading, innovative, durable products and building solutions is also of critical importance.
James Hardie is the first and only Australian fibre cement manufacturer to have internal lining products certified by Good Environmental Choice Australia (GECA). GECA’s scheme, which
provides consumers with confidence that the products they choose have a lower impact on the environment and human health, is recognised by the Green Building Council of Australia.
HardieWrap™ weather barrier has also been launched in Australia following the strong sales achieved in the US. HardieWrap™ weather barrier sits behind the cladding and delivers a
triple shield of protection to help against external weather penetration, internal condensation build-up and external heat penetration.
In the United States, the use of
James Hardie products can contribute points towards the United States Green Building Council (USGBC) Leadership in Energy & Environmental Design (LEED) project certification, the National Association of Home Builders (NAHB) National Green
Building Standard (NGBS) project certification, and many other green building rating systems. Factors contributing to the points awarded to projects using James Hardie products include regionally-sourced raw materials, multiple manufacturing
facilities spread across the country, recycled content, and low-toxicity raw materials. The NGBS also recognises the benefits of ColorPlus® technology for removing the need for site applied finishing.
HardieBacker® board manufactured in the United States is certified by Underwriters Laboratories (UL) Environment to comply with both GREENGUARD and GREENGUARD Gold certifications.
GREENGUARD Certification is achieved when a product or material meets stringent emissions standards. GREENGUARD Gold Certification is achieved when a product or material meets even more stringent emissions standards than for GREENGUARD Certification
and is specifically designed to ensure safe environments in schools and healthcare facilities.
In April 2015, James Hardie was awarded the Greenest Siding Products
Readers’ Choice Award from Green Builder Magazine. The magazine stated, “Progressive builders look to James Hardie® siding and trim for authentic design and uncompromising performance.”
COMMUNITIES
We continue to invest heavily in our plants, people and processes. Over the past 5 years we have
invested over US$500 million across our global manufacturing network. We are continuing to expand our manufacturing presence and employ many local people in the areas in which we operate as well as being strong supporters of local businesses and
suppliers.
7
DIVERSITY REPORT
DIVERSITY
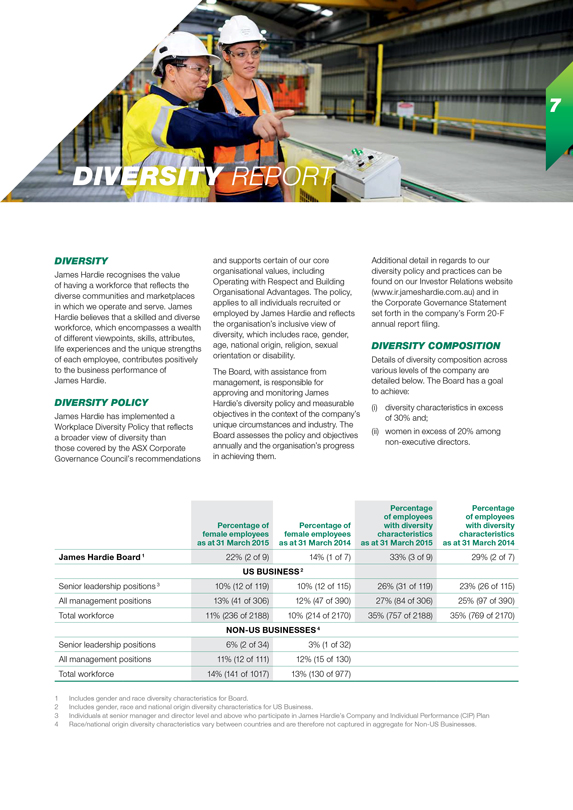
James Hardie recognises the value of having a workforce that reflects the diverse communities and
marketplaces in which we operate and serve. James Hardie believes that a skilled and diverse workforce, which encompasses a wealth of different viewpoints, skills, attributes, life experiences and the unique strengths of each employee, contributes
positively to the business performance of James Hardie.
DIVERSITY POLICY
James Hardie has
implemented a Workplace Diversity Policy that reflects a broader view of diversity than those covered by the ASX Corporate Governance Council’s recommendations and supports certain of our core organisational values, including Operating with
Respect and Building Organisational Advantages. The policy, applies to all individuals recruited or employed by James Hardie and reflects the organisation’s inclusive view of diversity, which includes race, gender, age, national origin,
religion, sexual orientation or disability.
The Board, with assistance from management, is responsible for approving and monitoring James Hardie’s diversity policy and
measurable objectives in the context of the company’s unique circumstances and industry. The Board assesses the policy and objectives annually and the organisation’s progress in achieving them.
Additional detail in regards to our diversity policy and practices can be found on our Investor Relations website (www.ir.jameshardie.com.au) and in the Corporate Governance Statement set
forth in the company’s Form 20-F annual report filing.
DIVERSITY COMPOSITION
Details of
diversity composition across various levels of the company are detailed below. The Board has a goal to achieve:
(i) diversity characteristics in excess of 30% and;
(ii) women in excess of 20% among non-executive directors.
of employees Percentage of female
employees as at 31 March 2015 Percentage of female employees as at 31 March 2014 Percentage with diversity characteristics as at 31 March 2015 Percentage of employees with diversity characteristics as at 31 March 2014
James Hardie Board 1 22% (2 of 9) 14% (1 of 7) 33% (3 of 9) 29% (2 of 7)
US BUSINESS 2
Senior leadership positions 3 10% (12 of 119) 10% (12 of 115) 26% (31 of 119) 23% (26 of 115)
All management
positions 13% (41 of 306) 12% (47 of 390) 27% (84 of 306) 25% (97 of 390)
Total workforce 11% (236 of 2188) 10% (214 of 2170) 35% (757 of 2188) 35% (769 of 2170)
NON-US BUSINESSES 4
Senior leadership positions 6% (2 of 34) 3% (1 of 32)
All management positions 11% (12 of 111) 12% (15 of 130)
Total workforce 14% (141 of 1017) 13% (130 of 977)
1 Includes gender and race diversity characteristics for Board.
2 Includes gender, race and
national origin diversity characteristics for US Business.
3 Individuals at senior manager and director level and above who participate in James Hardie’s Company and
Individual Performance (CIP) Plan
4 Race/national origin diversity characteristics vary between countries and are therefore not captured in aggregate for Non-US Businesses.
8
WORKPLACE SAFETY
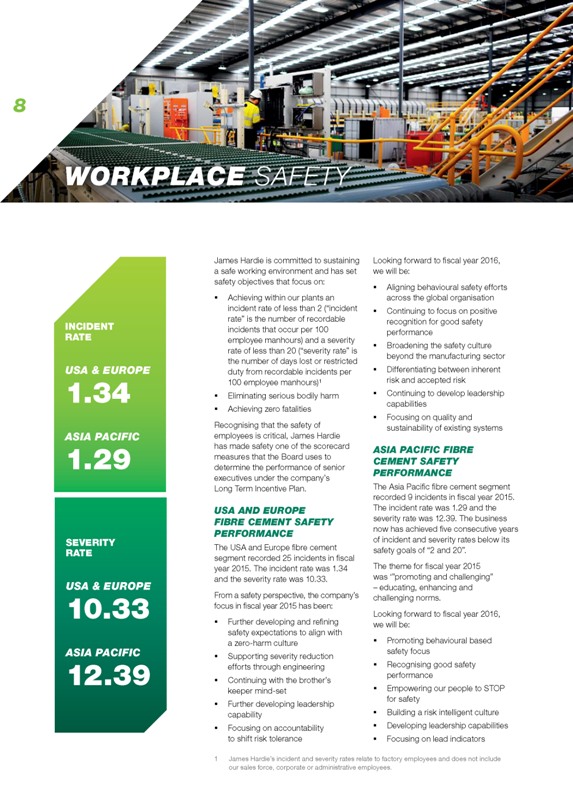
INCIDENT
RATE
USA & EUROPE
1.34
ASIA PACIFIC
1.29
SEVERITY RATE
USA & EUROPE
10.33
ASIA PACIFIC
12 .39
James Hardie is committed to sustaining a safe working environment and has set safety objectives that focus on:
Achieving within our plants an incident rate of less than 2 (“incident rate” is the number of recordable incidents that occur per 100 employee manhours) and a severity rate of less
than 20 (“severity rate” is the number of days lost or restricted duty from recordable incidents per 100 employee manhours)¹
Eliminating serious bodily harm
Achieving zero fatalities Recognising that the safety of employees is critical, James Hardie has made safety one of the scorecard measures that the Board uses to determine
the performance of senior executives under the company’s Long Term Incentive Plan.
USA AND EUROPE FIBRE CEMENT SAFETY PERFORMANCE
The USA and Europe fibre cement segment recorded 25 incidents in fiscal year 2015. The incident rate was 1.34 and the severity rate was 10.33. From a safety perspective, the company’s
focus in fiscal year 2015 has been:
Further developing and refining safety expectations to align with a zero-harm culture
Supporting severity reduction efforts through engineering
Continuing with the brother’s keeper mind-set
Further developing leadership capability
Focusing on accountability to shift risk tolerance
Looking forward to fiscal year 2016, we will be:
Aligning behavioural safety efforts across the
global organisation
Continuing to focus on positive recognition for good safety performance
Broadening the safety culture beyond the manufacturing sector
Differentiating between inherent
risk and accepted risk
Continuing to develop leadership capabilities
Focusing on quality and
sustainability of existing systems
ASIA PACIFIC FIBRE CEMENT SAFETY PERFORMANCE
The Asia Pacific
fibre cement segment recorded 9 incidents in fiscal year 2015. The incident rate was 1.29 and the severity rate was 12.39. The business now has achieved five consecutive years of incident and severity rates below its safety goals of “2 and
20”.
The theme for fiscal year 2015 was ‘“promoting and challenging” – educating, enhancing and challenging norms.
Looking forward to fiscal year 2016, we will be:
Promoting behavioural based safety focus
Recognising good safety performance
Empowering our people to STOP for safety
Building a risk intelligent culture
Developing leadership capabilities
Focusing on lead indicators
1 James Hardie’s incident and severity rates relate to factory employees and does
not include our sales force, corporate or administrative employees.
9
ASBESTOS FUNDING
DURING JULY 2015, JAMES HARDIE WILL CONTRIBUTE US$62.8 MILLION TO THE ASBESTOS INJURIES COMPENSATION FUND (AICF)
This amount represents 35% of James Hardie’s free cash flow for fiscal year 2015, which the company is obliged to contribute as part of its commitment under the Amended
and Restated Final Funding Agreement (AFFA). As of 31 March 2015, AICF had net cash and investments of A$28.8 million. In July 2014, James Hardie contributed US$113.0 million to the AICF.
Including its July 2015 contribution, James Hardie has provided over A$1 billion towards asbestos compensation since 2001. James Hardie continues to contribute to medical research into the
prevention, treatment and cure of asbestos related diseases, and has more recently provided additional amounts to support clinical trials to develop a new treatment for mesothelioma. Additionally James Hardie is the primary supporter (and only
commercial supporter) of Australia’s largest education campaign regarding the dangers of asbestos. The education campaign is aimed at educating home renovators about the risk of asbestos in the built environment. An example of the
committee’s work can be found at the website (www.asbestosawareness.com.au).
ANNUAL ACTUARIAL ASSESSMENT
KPMG Actuarial conducts an annual actuarial assessment of the liabilities of the AICF to enable projections to be regularly updated in line with actual claims experience and the claims
outlook.
James Hardie received an updated actuarial report from KPMG Actuarial at 31 March 2015, which showed the undiscounted and uninflated central estimate net of
insurance recoveries increased from A$1.547 billion at 31 March 2014 to A$1.566 billion at 31 March 2015.
James Hardie discloses summary information on claims numbers as
part of its quarterly results releases. For additional information, please see the full 2015 actuarial report of KPMG Actuarial, which is available on our Investor Relations website (www.ir.jameshardie.com.au).
JH James Hardie
CORPORATE HEADQUARTERS
Second Floor, Europa House
Harcourt Centre
Harcourt Street, Dublin 2, Ireland
Telephone +353 1 411 6924
Facsimile +353 1 479 1128
KEY DATES
31
MARCH
End of James Hardie Industries plc Fiscal Year 2015
21 MAY
FY15 4th Quarter and Full Year results and management presentation
21 MAY
Annual Review released
12 AUGUST
Voting Instruction Forms close 7:00pm Sydney time for Annual General Meeting
14 AUGUST
Annual General Meeting, Dublin
14 AUGUST
FY16 Quarter 1 results announcement and management presentation
19 NOVEMBER
FY16 Quarter 2 and Half Year results and management presentation
ANNUAL GENERAL MEETING
The 2015 Annual General Meeting of James Hardie Industries plc will be held in Dublin, Ireland, at 7:00am Dublin time, on Friday,
14 August 2015. The AGM will be broadcast via a teleconference at 4:00pm AEST. Further details will be set out in the Notice of Annual General Meeting 2015.
SHARE/CUFS REGISTRY
James Hardie Industries plc’s registry is managed by Computershare. All enquiries and
correspondence regarding holdings should be directed to:
Computershare Investor Services Pty Ltd
Level 5, 115 Grenfell Street
Adelaide SA 5000
Or
GPO Box 2975
Melbourne VIC 3001
Telephone within Australia: 1300 855 080
Telephone outside Australia: +61 (03) 9415 4000
US Toll Free: 1855 298 3404
Website: www.computershare.com
James Hardie Industries plc
(ARBN 097 829 895)
Incorporated in Ireland with its registered office at Second Floor, Harcourt Centre, Harcourt Street, Dublin 2, Ireland and registered number 485719. The liability of its members is limited.
™ or ® denotes a trademark or Registered mark owned by James Hardie Technology Ltd.
©2015. James Hardie Industries plc.
FORWARD-LOOKING STATEMENTS
Certain statements in this Annual Review may constitute “forward-looking statements” as defined in the Private Securities Litigation Reform Act of 1995. James Hardie uses such
words as “believe”, “anticipate”, “plan”, “expect”, “intend”, “target”, “estimate”, “project”, “predict”, “forecast”, “guideline”,
“aim”, “will”, “should”, “likely”, “continue”, “may”, “objective”, “outlook”, and similar expressions are intended to identify forward-looking statements but are not the
exclusive means of identifying such statements. Readers are cautioned not to place undue reliance on these forward-looking statements and all such forward-looking statements are qualified in their entirety by reference to the following cautionary
statements.
Forward-looking statements are based on the company’s current expectations, estimates and assumptions and because forward-looking statements address future
results, events and conditions, they, by their very nature, involve inherent risks and uncertainties, many of which are unforeseeable and beyond the company’s control. Many factors could cause the actual results, performance or achievements of
James Hardie to be materially different from those expressed or implied in this Annual Review, including, among others, the risks and uncertainties set forth in Section 3 “Risk Factors” in James Hardie’s Annual Report on Form
20-F for the year ended 31 March 2015; changes in general economic, political, governmental and business conditions globally and in the countries in which James Hardie does business; changes in interest rates, changes in inflation rates;
changes in exchange rates; the level of construction generally; changes in cement demand and prices; changes in raw material and energy prices; changes in business strategy and various other factors. Should one or more of these risks or
uncertainties materialise, or should underlying assumptions prove incorrect, actual results may vary materially from those described herein. These forward-looking statements are made as of the date of this Annual Review and James Hardie does not
assume any obligation to update them, except as required by law. Investors are encouraged to review James Hardie’s Annual Report on Form 20-F, and specifically the risk factors discussed therein, as it contains important disclosures regarding
the risks attendant to investing in our securities.
NON-GAAP FINANCIAL INFORMATION
This Annual
Review contains financial measures that are not considered a measure of financial performance under US GAAP and should not be considered to be more meaningful than the equivalent US GAAP measure. Management has included such measures to
provide investors with an alternative method for assessing its operating results in a manner that is focused on the performance of its ongoing operations. Additionally, management uses such non-GAAP financial measures for the same purposes. However,
these non-GAAP financial measures are not prepared in accordance with US GAAP, may not be reported by all of James Hardie’s competitors and may not be directly comparable to similarly titled measures of James Hardie’s competitors due
to potential differences in the exact method of calculation. For additional information regarding the non-GAAP financial measures presented in this Annual Review, including a reconciliation of each non-GAAP financial measure to the equivalent
US GAAP measure, see the sections titled “Definition and Other Terms” and “Non-US GAAP Financial Measures” included in the company’s Management’s Analysis of Results for the fourth quarter and twelve months
ended 31 March 2015.
FINANCIAL FOOTNOTES
1 Unless otherwise stated for fiscal years 2015,
2014, 2013, 2012, 2011 and 2010 Adjusted Net Operating Profit graphs and editorial comments throughout this report refer to results from operations that may exclude asbestos, asset impairments, ASIC expenses, New Zealand weathertightness claims,
non-recurring stamp duty or tax adjustments.
2 Unless otherwise stated for fiscal years 2015, 2014, 2013, 2012, 2011 and 2010 Adjusted EBIT graphs and editorial comments
throughout this report refer to EBIT that may exclude asbestos, asset impairments, ASIC expenses, non-recurring stamp duty and/or New Zealand weathertightness claims.
3
Includes restricted cash set aside for AFFA.