Exhibit 99.2
This Remuneration Report describes the executive remuneration philosophy and objectives of the Remuneration
Committee and the Board of Directors, as well as the executive remuneration plans and programs implemented by James Hardie Industries plc. For purposes of this discussion, references to “James Hardie”, the “Company”,
“we”, “our” and “us” all refer to James Hardie Industries plc.
We are not required to produce a remuneration report under
applicable Irish, Australian or US rules or regulations. However, taking into consideration our Australian shareholder base and primary listing on the Australian Securities Exchange (“ASX”), we have voluntarily produced a
remuneration report consistent with those provided by similarly situated Australian-domiciled companies for non-binding shareholder approval since 2005. This Remuneration Report outlines the key remuneration plans and programs and share ownership
information for our Board of Directors and certain of our senior executive officers (chief executive officer, chief financial officer and the other three highest paid executive officers based on total compensation that was earned or accrued for
fiscal year 2015) (“Senior Executive Officers”) in fiscal year 2015, and also includes an outline of the key changes for fiscal year 2016. Further details of these changes are set out in the 2015 Notice of Annual General Meeting.
This Remuneration Report has been adopted by our Board of Directors on the recommendation of the Remuneration Committee.
FORWARD-LOOKING STATEMENTS
Certain statements in this Remuneration Report may constitute “forward-looking statements” as defined in the Private Securities Litigation Reform Act of
1995. James Hardie Industries plc (James Hardie or the company) uses such words as “believe”, “anticipate”, “plan”, “expect”, “intend”, “target”, “estimate”,
“project”, “predict”, “forecast”, “guideline”, “aim”, “will”, “should”, “likely”, “continue”, “may”, “objective”, “outlook”, and
similar expressions are intended to identify forward-looking statements but are not the exclusive means of identifying such statements. Readers are cautioned not to place undue reliance on these forward-looking statements and all such
forward-looking statements are qualified in their entirety by reference to the following cautionary statements.
Forward-looking statements are based on James
Hardie’s current expectations, estimates and assumptions and because forward-looking statement address future results, events and conditions, they, by their very nature, involve inherent risks and uncertainties, many of which are unforeseeable
and beyond the company’s control. Many factors could cause the actual results, performance or achievements of James Hardie to be materially different from those expressed or implied in this Remuneration Report, including, among others, the
risks and uncertainties set forth in Section 3 “Risk Factors” in James Hardie’s Annual Report on Form 20-F for the year ended 31 March 2015; changes in general economic, political, governmental and business conditions
globally and in the countries in which James Hardie does business; changes in interest rates, changes in inflation rates; changes in exchange rates; the level of construction generally; changes in cement demand and prices; changes in raw material
and energy prices; changes in business strategy and various other factors. Should one or more of these risks or uncertainties materialize, or should underlying assumptions prove incorrect, actual results may vary materially from those described
herein. These forward-looking statements are made as of the date of this Remuneration Report and James Hardie does not assume any obligation to update them, except as required by law. Investors are encouraged to review James Hardie’s Annual
Report on Form 20-F, and specifically the risk factors discussed therein, as it contains important disclosures regarding the risks attendant to investing in our securities.
NON-GAAP FINANCIAL INFORMATION
This Remuneration Reports contains financial measures that are not considered a measure of financial performance under United States generally accepted accounting
principles (US GAAP) and should not be considered to be more meaningful than the equivalent US GAAP measure. Management has included such measures to provide investors with an alternative method for assessing its operating results in a
manner that is focused on the performance of its ongoing operations. Additionally, management uses such non-GAAP financial measures for the same purposes. However, these non-GAAP financial measures are not prepared in accordance with US GAAP,
may not be reported by all of James Hardie’s competitors and may not be directly comparable to similarly titled measures of James Hardies’s competitors due to potential differences in the exact method of calculation. For additional
information regarding the Non-GAAP financial measures presented in this Remuneration Report, including a reconciliation of each non-GAAP financial measure to the equivalent US GAAP measure, see the sections titled “Definition and Other
Terms” and “Non-US GAAP Financial Measures” included in James Hardie’s Management’s Analysis of Results for the fourth quarter and twelve months ended 31 March 2015.
APPROACH TO SENIOR EXECUTIVE REMUNERATION
Remuneration Philosophy
As our main business and all of our
Senior Executive Officers are located in the United States (US), our remuneration philosophy is to provide our Senior Executive Officers with an overall package that is competitive with Peer Group companies (defined herein) exposed to the US
housing market. Within this philosophy, the executive remuneration framework emphasises operational excellence and shareholder value creation through incentives which link executive remuneration with the interests of shareholders. Our remuneration
plans and programs are structured to enable us to: (i) attract and retain talented executives; (ii) reward outstanding individual and corporate performance; and (iii) align the interest of our executives to the interests of our
shareholders, with the ultimate goal of improving long-term value for our stakeholders. The pay-for-performance system continues to serve as the framework for executive remuneration, aligning the remuneration received with the performance achieved.
Composition of Remuneration Packages
Remuneration
packages for Senior Executive Officers reflect our remuneration philosophy and comprise a mixture of fixed base salary and benefits and variable performance-based incentive remuneration, which is dependent upon the achievement of both short- and
long-term goals.
Our philosophy is to position Senior Executive Officer fixed base salary and benefits at the median and total target direct remuneration
(comprising fixed and target variable remuneration) at the 75th percentile of our Peer Group, if stretch short- and long-term target performance goals are met.
Performance goals for target variable performance-based incentive remuneration are set with the expectation that we will deliver results in the top quartile of our
Peer Group. Performance below this level will result in variable remuneration payments below target (and potentially zero for poor performance). Performance above this level will result in variable remuneration payments above target.
The executive remuneration framework described in this Remuneration Report applies to all members of our executive team, who work to manage our business. Our five
most highly compensated Senior Executive Officers in fiscal year 2015 were:
| ¡ |
|
Louis Gries, Chief Executive Officer |
| ¡ |
|
Matthew Marsh, Chief Financial Officer |
| ¡ |
|
Mark Fisher, Executive General Manager – International |
| ¡ |
|
Ryan Sullivan, Executive General Manager – Southern Division |
| ¡ |
|
Sean Gadd, Executive General Manager – Northern Division |
Setting Remuneration Packages
Remuneration decisions are based on the executive remuneration framework described in this Remuneration Report. The Remuneration Committee reviews and the Board of
Directors approves this framework each year.
Remuneration packages for Senior Executive Officers are evaluated each year to make sure that they continue to
align with our compensation philosophy, are competitive with our Peer Group and developments in the market, and continue to support our business structure and objectives. In making decisions regarding individual Senior Executive Officers, the
Remuneration Committee takes into account the results of an annual remuneration positioning review provided by the Remuneration Committee’s independent advisor, as well as the Senior Executive Officer’s responsibilities and performance.
All aspects of the remuneration package for our chief executive officer (CEO) and chief financial officer (CFO) are determined by the
Remuneration Committee and ratified by the Board of Directors. All aspects of the remuneration package for the remaining Senior Executive Officers are determined by the Remuneration Committee on the recommendation of the CEO.
2
Remuneration Committee Governance
The remuneration program for our Senior Executive Officers is overseen by our Remuneration Committee, the members of which are appointed by the Board of Directors.
As prescribed by the Remuneration Committee Charter, the duties of the Remuneration Committee include, among other things: (i) administering and making recommendations on our incentive compensation and equity-based remuneration plans;
(ii) reviewing the remuneration of directors; (iii) reviewing the remuneration framework for the Company; and (iv) making recommendations to the Board of Directors on our recruitment, retention and termination policies and procedures
for senior management. The current members of the Remuneration Committee are David Harrison (Chairman), Brian Anderson, Russell Chenu, Michael Hammes and Alison Littley, the majority of whom are independent non-executive directors. A more complete
description of these and other Remuneration Committee functions is contained in the Remuneration Committee’s Charter, a copy of which is available in the Corporate Governance section of our investor relations website
(www.ir.jameshardie.com.au).
Remuneration Advisers
As
permitted by the Remuneration Committee Charter, the Remuneration Committee retained Aon Hewitt (in the US) and Guerdon Associates (in Australia) as its independent advisers for matters regarding remuneration for fiscal year 2015. The Remuneration
Committee reviews the appointment of its advisors each year. Both Aon Hewitt and Guerdon Associates provided the Remuneration Committee with written certification during fiscal year 2015 to support their re-appointment. In those certifications, the
advisors: (i) confirmed that their pay recommendations were made without undue influence from any member of our management; and (ii) provided detailed responses to the six independence factors a Remuneration Committee should consider under
relevant New York Stock Exchange rules, and confirmed their independence based on these factors.
The Remuneration Committee reviewed these certifications before re-appointing each advisor for fiscal year 2016.
Peer Group Analysis
To assist the Remuneration Committee
in making remuneration decisions, the Remuneration Committee evaluates the remuneration of our Senior Executive Officers against a designated set of companies (the Peer Group). The Peer Group, which is reviewed by the Remuneration Committee
on an annual basis, consists of companies that are generally similar to us in terms of certain factors, including size, industry, and exposure to the US housing market. For fiscal year 2015, the Peer Group remained unchanged from fiscal year 2014,
with the exception of the removal of Texas Industries Inc., which was acquired by Martin Marietta Materials Inc., consolidating two of our peers. The Remuneration Committee believes that US market focused companies are a more appropriate peer group
than ASX-listed companies, as they are exposed to the same macroeconomic factors in the US housing market as those we face. The names of the 24 companies comprising the Peer Group are set forth below.
|
|
|
| Acuity Brands, Inc |
|
Mueller Water Products, Inc |
| American Woodmark Corp |
|
NCI Building Systems, Inc |
| Apogee Enterprises, Inc |
|
Owens Corning |
| Armstrong World Indus, Inc |
|
Quanex Building Products Corp |
| Eagle Materials, Inc |
|
Sherwin Williams Co |
| Fortune Brands Home & Security |
|
Simpson Manufacturing Co., Inc |
| Headwaters, Inc |
|
Trex Co., Inc |
| Lennox International, Inc |
|
USG Corp |
| Louisiana-Pacific Corp |
|
Valmont Industries, Inc |
| Martin Marietta Materials Inc |
|
Vulcan Materials Co |
| Masco Corporation |
|
Valspar Corporation |
| Mohawk Industries, Inc |
|
Watsco, Inc |
FISCAL YEAR 2015
COMPANY PERFORMANCE AND LINK WITH REMUNERATION POLICY
Actual Performance
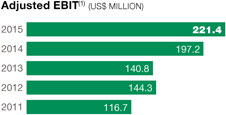
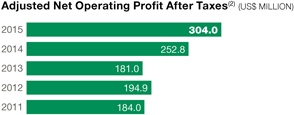
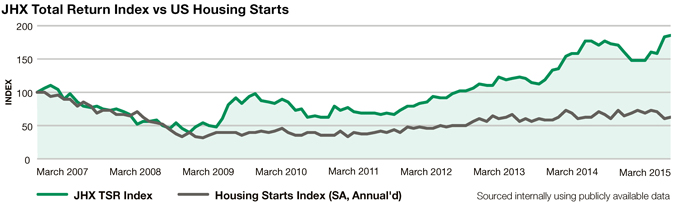
Our five-year adjusted Earnings Before Interest and Taxes (“EBIT”) and adjusted Net Operating Profit After Taxes, and five-year A$ total
shareholder return (including dividends and capital returns) compared against changes in US housing starts are shown in the graphs below:
| |
(1) |
Excludes asbestos, asset impairments, ASIC expenses, New Zealand product liability expenses and non-recurring stamp duty.
|
| |
(2) |
Excludes asbestos, asset impairments, ASIC expenses, New Zealand product liability expenses, tax adjustments and non-recurring stamp duty.
|
|
|
|
| JAMES HARDIE
REMUNERATION REPORT 2015 |
|
3 |
Market Conditions and Company Performance
Operating conditions in the US residential housing market improved during fiscal year 2015. According to the US Census Bureau, single family housing starts, which
are one of the key drivers of our performance, were 638,800 for fiscal year 2015, 3% above the prior year. In addition, industry data indicates low single digit growth in both single-family and multi-family production compared to the prior year.
Overall group operating earnings for fiscal year 2015 increased significantly compared to the prior year, reflecting stronger performance by our US and Europe
Fiber Cement segment and our Asia Pacific Fiber Cement segment in local currencies. The improvement in the US and Europe Fiber Cement segment was largely due to higher sales volumes and higher average net sales price, partially offset by higher
production costs and selling, general and administrative (“SG&A”) expenses. The Asia Pacific Fiber Cement segment improvement was largely due to higher volumes and increased average net sales price, partially offset by
depreciation in the exchange rates. We expect that the improvement in the US operating environment reflects a sustainable recovery in the US housing market, although the recovery is expected to occur over a protracted period. In anticipation of the
ongoing recovery, during the year we funded capacity expansions and initiatives to capitalize on the anticipated continued recovery of the US housing market and our market penetration objectives. In Australia, the investments in capacity expansion
and land and building purchases have secured our manufacturing footprint in the Australian market.
Performance Linkage with Remuneration Policy
Performance goals and variable remuneration are set with the expectation that we will perform at or above a level equivalent to the 75th percentile of our Peer
Group. This approach supports our growth aspirations and provides appropriate alignment with shareholders.
During its annual review, the Remuneration
Committee assessed our performance in fiscal year 2015 against the background of the continued gradual recovery in the US and Asia Pacific markets. This review included reviewing fiscal year 2015 performance against:
| ¡ |
|
our historical performance; |
| ¡ |
|
the goals in our Short Term Incentive (“STI”) and Long Term Incentive (“LTI”) variable remuneration plans; and |
| ¡ |
|
the key objectives and measures the Board of Directors expects to see achieved, which are referred to as the “Scorecard”. |
Based on that review, the Board of Directors and the Remuneration Committee concluded that management’s performance in fiscal year 2015 was: (i) above
target on earnings and growth measures, resulting in STI variable remuneration outcomes being substantially above target for fiscal year 2015; and (ii) superior to the 75th percentile of our Peer Group on long-term measures (when taken together
with performance in fiscal years 2013 and 2014), such as those set out in the Scorecard, resulting in LTI variable remuneration being above target for fiscal years 2013–2015.
More details about this assessment, including the percentage of the maximum variable remuneration awarded to or
forfeited by Senior Executive Officers is set out on pages 6 and 8 through 10 of this Remuneration Report.
DESCRIPTION OF
REMUNERATION ARRANGEMENTS
This section describes our remuneration arrangements applicable during fiscal year 2015.
Fixed Remuneration
Fixed remuneration consists of base
salaries, other fixed benefits and participation in a defined contribution retirement plan.
Base Salaries
Base salary provides a guaranteed level of income that recognises the market value of the position, internal equities between roles, and the individual’s
capability, experience and performance. Base salaries for Senior Executive Officers were positioned around the market median for positions of similar responsibility. Base salaries are reviewed by the Remuneration Committee each year, although
increases are not automatic.
Retirement Plan
In
every country in which we operate, we offer employees access to pension, superannuation or individual retirement savings plans consistent with the laws of the respective country.
In the US, we sponsor a defined contribution plan, the James Hardie Retirement and Profit Sharing Plan (the “401(k) Plan”). The 401(k) Plan is a
tax-qualified retirement and savings plan covering all US employees, including our Senior Executive Officers, subject to certain eligibility requirements. Participating employees may elect to reduce their current annual compensation by up to
US$17,500 in calendar year 2014 and have the amount of such reduction contributed to the 401(k) Plan, with a maximum eligible compensation limit of US$260,000. In addition, we match employee contributions dollar for dollar up to a maximum of the
first 6% of an employee’s eligible compensation.
Other Benefits
Our Senior Executive Officers may receive certain other limited fixed benefits, such as medical and life insurance benefits, car allowances, participation in
executive wellness programs and an annual financial planning allowance.
Variable Remuneration
Our variable incentive plans for Senior Executive Officers in fiscal year 2015 were:
|
|
|
|
|
|
|
| DURATION |
|
PLAN NAME |
|
AMOUNT |
|
FORM INCENTIVE PAID |
| STI (1 year) |
|
Individual Performance Plan (“IP Plan”) |
|
20% of STI Target |
|
Cash |
| |
|
Company Performance Plan (“CP Plan”) |
|
80% of STI Target |
|
Cash |
| LTI (3–4.5 years) |
|
Long Term Incentive Plan (“LTIP”) |
|
40% of LTI Target |
|
Return on Capital Employed (“ROCE”) |
|
|
|
|
|
|
Restricted Stock Units (“RSUs”) |
|
|
|
|
30% of LTI Target |
|
Relative Total Shareholder Return
(“TSR”) RSUs |
| |
|
|
|
30% of LTI Target |
|
Cash (Scorecard LTI) |
4
STI Variable Remuneration
On an annual basis, the Remuneration Committee approves a STI target for all Senior Executive Officers, expressed as a percentage of base salary, which is
allocated between individual goals and Company goals under the IP and CP Plans, respectively. For fiscal year 2015, the STI target percentage for Mr Gries was 125% of base salary and 60% of base salary for Messrs Marsh, Fisher, Gadd and Sullivan,
with 80% allocated to the CP Plan and 20% allocated to the IP Plan for all Senior Executive Officers.
From fiscal year 2014, the Remuneration Committee
approved the introduction of a ‘circuit breaker’ which, for Senior Executive Officers, will prevent payment of any STI under the CP and IP Plans unless our performance exceeds a level approved by the Remuneration Committee each year. For
fiscal year 2015, the ‘circuit breaker’ was set at 60% of our fiscal year 2015 plan EBIT (indexed to housing starts) and is calculated after, and therefore excludes, all of the items we customarily exclude from our STI calculations,
including costs relating to legacy issues such as Australian Securities and Investment Commission (“ASIC”) proceedings, New Zealand weathertightness proceedings and changes to the asbestos liability valuation, as well as impairment
costs the Remuneration Committee determines should be disregarded.
CP Plan
The CP Plan is based on a series of payout matrices for the US and Asia Pacific businesses, which provide a range of possible payouts depending on our performance
against performance hurdles which assess volume growth relative to, and above, market (“Growth Measure”) and earnings (“Return Measure”). Each Senior Executive Officer can receive between 0% and 300% of their STI
target allocated to the CP Plan based on the results of the payout matrix the Senior Executive Officer is tied to. All Senior Executive Officers are tied to either the US payout matrix or a composite multiple derived from the payout matrices for the
US and Asia Pacific businesses. We use two performance hurdles in the payout matrices to ensure that as management increases its top line market growth focus, it does not do so at the expense of short- to medium-term earnings. Management is
encouraged to balance market growth and earnings returns since achievement of strong rewards requires management to generate both strong earnings and growth relative to and above market. Higher returns on one measure at the expense of the other
measure may result in a lower reward or no reward at all.
The Remuneration Committee believes that the payout matrices are appropriate because they:
| ¡ |
|
provide management with an incentive to achieve overall corporate goals; |
| ¡ |
|
balance growth with returns; |
| ¡ |
|
recognise the need to flexibly respond to strategic opportunities; |
| ¡ |
|
incorporate indexing relative to market growth to account for factors beyond management’s control; and |
| ¡ |
|
incorporate Remuneration Committee discretion to ensure appropriate outcomes. |
We do not disclose the volume Growth
Measure and earnings Return Measure targets since these are commercial in confidence. However, achieving a target payment for fiscal year 2015 would have required performance equal to the average of the performance for the previous three years for
the Return Measure. Achieving a target payout for the Growth Measure requires growth substantially above market growth.
Payout
Matrices
To ensure that the Payout Matrices represent genuinely challenging targets aligned with our executive remuneration philosophy,
particularly in light of the gradual recovery in the
US housing market, the Growth Measure is indexed to take into account changes in the US and Australian new housing starts and the US repair and remodel market and the Return Measure is indexed to
take into account changes in pulp prices. The targets for the Return Measure exclude costs related to legacy issues (including the impact of asbestos, ASIC proceedings, certain asset impairment charges and expenses associated with New Zealand
weathertightness proceedings) as well as the impact of exchange rate movements on the translation of earnings. The Remuneration Committee has reserved for itself discretion to change the STI paid on the basis of the Payout Matrices. Examples of
instances when the Remuneration Committee would consider exercising this discretion include external factors outside of management’s control, and for the US CP Plan only, if the general shift toward smaller homes at each segment of the US
market is considered sufficiently material. The Remuneration Committee will disclose the reasons for any such exercise of discretion.
Wood-Aesthetic Market Index
From fiscal year 2013, the Remuneration Committee determined that the US payout would be adjusted based on our performance against market tracking data from the
largest participants in the “wood-look” products market (collectively, the “Wood-Aesthetic Market Index” or “WMI”). In fiscal year 2013, the WMI adjustment was added to or subtracted from the Growth Measure. The
performance requirements for the WMI adjustment remained consistent between fiscal years 2013 and 2015. However from fiscal year 2014, the Remuneration Committee determined the WMI adjustment should instead be added to or subtracted from the US
multiple as determined by the US payout matrix. The WMI adjustment is made as follows:
| ¡ |
|
If we meet or exceed the performance of all three WMI participants, 0.2 will be added to the US multiple as determined by the US payout matrix; |
| ¡ |
|
If we meet or exceed the performance of two of the three WMI participants, there will be no change to the US multiple as determined by the US payout matrix; or |
| ¡ |
|
If we fail to meet or exceed the performance of more than one of the three WMI participants, then 0.2 will be subtracted from the US multiple as determined by the US payout matrix. |
The purpose of this WMI adjustment is to further focus management on increasing our share of the exterior cladding market at the expense of “wood-look”
competitors, which is one of our key strategies and, if successfully implemented, will create substantial value for shareholders.
Interior Products Business
Beginning in fiscal year 2014, the Remuneration Committee also reserved for itself discretion to increase or decrease the US multiple as determined by the US
payout matrix by an additional 0.2 based on the Remuneration Committee’s assessment of management’s development and implementation of specific plans for our interior products business.
IP Plan
Under the IP Plan, each
year the Remuneration Committee approves a series of one-year individual performance goals which, along with personal growth and development goals, are used to assess the performance of our Senior Executive Officers. These one-year individual
performance goals are expressed as a one-year achievement towards the three-year goals included in the Scorecard used in the fiscal year 2015 LTI Plan.
The
Remuneration Committee believes that the IP Plan is appropriate because it links financial rewards to the Senior Executive Officer’s achievement of specific objectives that have benefited us and contributed to shareholder value, but are not
captured directly by the financial measures in the CP Plan. Each Senior Executive Officer can receive between 0% and 150% of their STI target allocated to the IP Plan based on achievement of individual performance and personal growth and development
goals.
|
|
|
| JAMES HARDIE
REMUNERATION REPORT 2015 |
|
5 |
Board of Directors and Remuneration Committee Assessment of Management Performance under
STI Plans for Fiscal Year 2015
The Company’s results and the subsequent STI payouts for fiscal year 2015 were above STI target as a result of:
| ¡ |
|
the US business performing significantly above target on the Growth Measure (which requires performance well above market) due to strong market share growth; |
| ¡ |
|
the US business performing substantially above target on the Return Measure due to higher volumes, higher average net sales price, and lower organisational costs as a percentage of revenue; |
| ¡ |
|
Asia Pacific performing slightly below target on the Growth Measure due to the Australia, New Zealand and Philippines businesses achieving growth below their respective targets; and |
| ¡ |
|
Asia Pacific performing above target on the Return Measure due to higher returns in Australia and New Zealand. |
The
Senior Executive Officers’ performance and the subsequent STI payouts for fiscal year 2015 were generally above target based on each Senior Executive Officer’s achievement of fiscal year 2015 one-year individual performance and personal
growth and development goals.
For fiscal year 2015, the total amount payable to each of our Senior Executive Officers under the IP and CP Plans is provided in
the Bonus column of the Remuneration Table located on page 11. The percentage of the maximum STI Variable Remuneration awarded to or forfeited by each Senior Executive Officer for (individual and company) performance in fiscal year 2015 compared to
fiscal year 2014 was:
|
|
|
|
|
|
|
|
|
| |
|
CASH
STI(1) |
|
| |
|
AWARDED % |
|
|
FORFEITED % |
|
| L Gries |
|
|
|
|
|
|
|
|
| Fiscal Year 2015 |
|
|
100 |
|
|
|
– |
|
| Fiscal Year 2014 |
|
|
88 |
|
|
|
12 |
|
| M Marsh |
|
|
|
|
|
|
|
|
| Fiscal Year 2015 |
|
|
100 |
|
|
|
– |
|
| Fiscal Year 2014 |
|
|
88 |
|
|
|
12 |
|
| M Fisher |
|
|
|
|
|
|
|
|
| Fiscal Year 2015 |
|
|
98 |
|
|
|
2 |
|
| Fiscal Year 2014 |
|
|
87 |
|
|
|
13 |
|
| R Sullivan |
|
|
|
|
|
|
|
|
| Fiscal Year 2015 |
|
|
100 |
|
|
|
– |
|
| Fiscal Year 2014 |
|
|
99 |
|
|
|
1 |
|
| S Gadd |
|
|
|
|
|
|
|
|
| Fiscal Year 2015 |
|
|
96 |
|
|
|
4 |
|
| Fiscal Year 2014 |
|
|
95 |
|
|
|
5 |
|
| (1) |
Awarded = % of Cash STI maximum actually paid. Forfeited = % of Cash STI maximum foregone. STI amounts were paid in cash under the CP and IP Plans. |
LTI Variable Remuneration
Each year, the Remuneration
Committee approves a LTI target for all Senior Executive Officers. The approved target is allocated between three separate components to ensure that each Senior Executive Officer’s performance is assessed across factors considered important for
sustainable long-term value creation:
| ¡ |
|
ROCE RSUs are used as they are an indicator of high capital efficiency required over time; |
| ¡ |
|
Relative TSR RSUs are used as they are an indicator of our performance relative to our Peer Group; and |
| ¡ |
|
Scorecard LTI is considered an indicator of each Senior Executive Officer’s contribution to achieving our long-term strategic goals.
|
For fiscal year 2015, the LTI target amount for Mr Gries was US$3.5 million and US$500,000 for Messrs Marsh, Fisher,
Gadd and Sullivan, respectively.
As a company incorporated under the laws of Ireland, we have listed our securities for trading on the ASX, through the use of
the Clearing House Electronic Subregister System (“CHESS”), via CHESS Units of Foreign Securities (“CUFS”). CUFS are a form of depositary security that represents a beneficial ownership interest in the securities of
a non-Australian corporation. Each of our CUFS represents the beneficial ownership of one share of common stock, the legal ownership of which is held by CHESS Depositary Nominees Pty Ltd. RSUs issued under our LTI programs will be settled upon
vesting in CUFS on a 1-to-1 basis. Unless the context indicates otherwise, in this Remuneration Report when we refer to our common stock, we are referring to the shares of our common stock that are represented by CUFS.
ROCE RSUs (40% of target LTI)
The
Remuneration Committee introduced ROCE RSUs in fiscal year 2013 because the US housing market had stabilised to an extent which permitted the setting of multi-year financial metrics. The Remuneration Committee believes ROCE RSUs remain an
appropriate component of the LTI Plan because they:
| ¡ |
|
allow the Remuneration Committee to replace the interim one-year metrics previously used during the US housing downturn with three-year financial metrics; |
| ¡ |
|
tie the reward’s value to share price which provides alignment with shareholder interests; |
| ¡ |
|
ensure that we earn appropriate returns on the additional capital invested in response to the improvement in the US housing market; |
| ¡ |
|
reward performance that is under management’s direct influence and control; and |
| ¡ |
|
focus management on capital efficiency as the necessary precondition for the creation of additional shareholder value. |
Consistent with fiscal years 2013 and 2014, the maximum payout for the ROCE RSUs is 200% of target LTI. ROCE is determined by dividing EBIT by Capital Employed (as
defined below).
EBIT will be as reported in our financial results, adjusted by:
| ¡ |
|
deducting the earnings impact of legacy issues (such as asbestos adjustments and ASIC expenses); |
| ¡ |
|
deducting leasehold expenses, since potential upcoming changes in international accounting standards could cause significant volatility in this component; and |
| ¡ |
|
adding back asset impairment charges in the relevant period, unless otherwise determined by the Remuneration Committee. Since management’s performance will be assessed on the pre-impairment value of the
Company’s assets, the Remuneration Committee would not normally deduct the impact of any asset impairments from our EBIT for the purposes of measuring ROCE performance. |
“Capital Employed” will start with net working capital and fixed assets (net of accumulated depreciation), which already excludes legacy
issue-related items such as asbestos-related assets and liabilities, as reported in our financial results, adjusted by:
| ¡ |
|
adding back asset impairment charges in the relevant period, unless otherwise determined by the Remuneration Committee, in order to align the Capital Employed with the determination of EBIT; |
| ¡ |
|
adding back leasehold assets for manufacturing facilities and other material leased assets, which the Remuneration Committee believes give a more complete measure of our capital base employed in income generation; and
|
6
| ¡ |
|
deducting all greenfield construction-in-progress, and any brownfield construction-in-progress projects involving capacity expansion that are individually greater than US$20 million, until such assets reach commercial
production and are transferred to the fixed asset register, in order to encourage management to invest in capital expenditure projects that are aligned with our long-term interests. |
The resulting Capital Employed for each quarter of any fiscal year will be averaged to better refiect Capital Employed through a year rather than at a certain
point in time.
ROCE goals for the ROCE RSUs are based on historical results and take into account the expected and forecasted impact of the recovery in the US
housing market on EBIT and Capital Employed. The ROCE goals will be indexed for changes to US and Australian addressable housing starts. In order to receive awards at LTI target (i.e., 50% vesting), we will need to achieve improvement on the
average of our performance for fiscal years 2012 to 2014 (after indexing for market improvements). The three-year average ROCE for fiscal years 2013, 2014 and 2015 was 22.9%.
The goals for ROCE RSUs granted in fiscal year 2015 (for performance in fiscal years 2015 to 2017) were increased from those granted in fiscal year 2014 as
follows:
|
|
|
|
|
|
|
| FISCAL
YEARS 2015–2017
ROCE |
|
FISCAL YEARS
2014–2016 ROCE |
|
% OF ROCE
RSUs TO VEST |
|
| < 22.0% |
|
< 19.5% |
|
|
0% |
|
|
³ 22.0%, but <
24.5% |
|
³ 19.5%, but < 21.0% |
|
|
25% |
|
|
³ 24.5%, but <
27.0% |
|
³ 21.0%, but < 22.5% |
|
|
50% |
|
|
³ 27.0%, but <
28.5% |
|
³ 22.5%, but < 24.0% |
|
|
75% |
|
| ³ 28.5% |
|
³ 24.0%
|
|
|
100% |
|
At the conclusion of this three-year performance period, the Remuneration Committee will review management’s performance
based on the quality of the returns balanced against management’s delivery of market share growth and performance against the Scorecard. Following this review, the Remuneration Committee can exercise negative discretion to reduce the number of
shares received following vesting of the ROCE RSUs. This discretion can only be applied to reduce the number of shares which will vest.
Relative TSR RSUs (30% of target LTI)
The Remuneration Committee believes that Relative TSR RSUs continue to be an appropriate component of the LTI Plan because they provide alignment with
shareholders. Even if macro-economic conditions create substantial shareholder value, Senior Executive Officers will only receive payouts if the TSR of our shares exceeds a specified percentage of our Peer Group over a performance period.
We have used Relative TSR RSUs in our LTI Plan since fiscal year 2009. The Remuneration Committee decreased the number of re-tests from three to two in fiscal year
2015 to bring this component of the LTI Plan more in-line with typical plans seen in Australia.
Relative TSR measures changes in our share price and the share
prices of our Peer Group and assumes all dividends and capital returns are reinvested when paid.
Our relative TSR performance will be measured against the
Peer Group over a 36 to 54 month period from grant date, with testing at the 36th month, 48th month and at the end of the 54 month period. To eliminate the impact of short-term share price changes, the starting point and each test date are measured
using a 20 trading-day average closing price.
Relative TSR RSUs will vest based on the following straight-line schedule:
|
|
|
|
|
| PERFORMANCE AGAINST
PEER GROUP |
|
% OF RELATIVE TSR
RSUs VESTED |
|
| <40th Percentile |
|
|
0% |
|
| 40th Percentile |
|
|
25% |
|
| >40th Percentile – <60th Percentile |
|
|
Sliding Scale |
|
| 60th Percentile |
|
|
50% |
|
| >60th Percentile – <80th Percentile |
|
|
Sliding Scale |
|
| ³80th Percentile |
|
|
100% |
|
The Remuneration Committee will continue to monitor the design of the Relative TSR RSU component of the LTI Plan for Senior
Executive Officers with the aim of balancing investor preferences with the ability to motivate and retain Senior Executive Officers.
Scorecard LTI (30% of target LTI)
The Remuneration Committee believes that the Scorecard LTI continues to be an appropriate component of its LTI Plan because it:
| ¡ |
|
allows the Remuneration Committee to set targets for and reward executives on a balance of longer-term financial, strategic, business, customer and organisational development goals which it believes are important
contributors to long-term creation of shareholder value; |
| ¡ |
|
ties the reward’s value to our share price over the medium-term; and |
| ¡ |
|
allows flexibility to apply rewards across different countries, while providing Senior Executive Officers with liquidity to pay tax or other material commitments at a time that coincides with vesting of shares (via the
other components of the LTI Plan) as payment is in cash. |
We have used Scorecard LTI in our LTI Plan since fiscal year 2010. Each year, the
Remuneration Committee approves a number of key management objectives and the measures it expects to see achieved in relation to these objectives. These objectives are incorporated into that year’s grant of Scorecard LTI. At the end of the
three-year performance period, the Remuneration Committee assesses our Senior Executive Officers’ collective performance on each key objective and each individual Senior Executive Officer’s contribution to those achievements (with scores
between 0 and 100) and the Board of Directors reviews this assessment. Senior Executive Officers may receive different ratings depending on the contribution they have made during the three-year performance period. Although most of the objectives in
the Scorecard have quantitative targets, we consider some of the targets to be commercial-in-confidence.
No specific weighting is applied to any single
objective and the final Scorecard assessment reflects an element of judgment by the Board of Directors. The Board of Directors may only exercise negative discretion (i.e., to reduce the amount of Scorecard LTI that will ultimately
vest). It cannot enhance the maximum reward that can be received.
The amount received by Senior Executive Officers is based on both our share price
performance over the three years from the grant date and the Senior Executive Officer’s Scorecard rating. At the start of the three-year performance period, we calculate the number of shares each Senior Executive Officer could have acquired if
they received a maximum payout on the Scorecard LTI at that time (based on a 20 trading-day average closing price). Depending on the Senior Executive Officer’s rating (between 0 and 100), between 0% and 100% of the Senior Executive
Officer’s Scorecard LTI awards will vest at the end of the three-year performance period. Each Senior Executive Officer will receive a cash payment based on our share price at the end of the period (based on a 20 trading-day average closing
price) multiplied by the number of shares they could have acquired at the start of the performance period, adjusted downward in accordance with their Scorecard rating.
|
|
|
| JAMES HARDIE
REMUNERATION REPORT 2015 |
|
7 |
Further details related to the Scorecard for fiscal year 2015, including the method of measurement, historical
performance against the proposed measures and the Board of Director’s expectations, were previously set out in the Remuneration Report in our Annual Report on Form 20-F for the fiscal year ended 31 March 2014. An assessment of our
Scorecard performance for fiscal years 2013–2015 is set out below. We will provide an explanation of the final assessment of performance under the Scorecard for fiscal years 2015–2017 at the conclusion of fiscal year 2017.
Clawback Provisions
For fiscal
year 2015, all LTI grants made to Messrs Gries, Fisher, Sullivan, and Gadd were subject to a specific clawback provision for violation of a limited non-compete provision that specifically prohibits executives from working for designated competitors
or for any company that may enter the fiber cement market within two years of departure from the Company.
Board of Directors and
Remuneration Committee Assessment of Management Performance under Scorecard LTI for Fiscal Years 2013–2015
The Remuneration Committee’s
review of our performance over fiscal years 2013-2015 against the Scorecard objectives, and the contribution of individual Senior Executive Officers, resulted in Senior Executive Officers receiving an average Scorecard rating of 61% (with a range of
55% to 66%).
The Remuneration Committee’s assessment of our performance over the fiscal years 2013-2015 based on the Scorecard objectives as determined
in mid-2012 is provided below:
|
|
|
|
|
|
|
|
|
| MEASURE |
|
PERFORMANCE
OVER PERIOD |
|
REQUIREMENT |
|
REASONS |
|
ASSESSMENT OF
MANAGEMENT’S
PERFORMANCE |
| US
Primary
Demand Growth
(“PDG”) &
“Wood-Look”
Market
Tracking Data |
|
FY15: 8.0%
FY14: 9.6%
FY13: 6.8%
Performance data of “wood-look” competitors is commercial in confidence. |
|
Minimum: Maintain relative to
market. Stretch: Primary demand growth relative to market. |
|
A key strategy for the Company is to
maximise its market share growth and/or retention of the exterior cladding market for new housing starts and for repair & remodel market, which it does by growing fiber cement’s share of the exterior cladding market (especially in relation
to the vinyl and engineered wood categories) and by maintaining the Company’s share of the fiber cement category. |
|
Performance exceeded
expectations. PDG averaged 8.1% over three year period. Growth above stretch target
for “wood-look” market tracking data. |
| US Product Mix
Shift |
|
Attachment rate increases for
differentiated products have been relatively flat over the three-year period. |
|
Minimum: 2% annual
improvement in penetration of differentiated, value-added products. Stretch: 4%
annual improvement in penetration of differentiated, value-added products. |
|
The Company aims to maintain its
leadership position across the fiber cement category of the exterior cladding market by developing new products and new marketing and manufacturing approaches that will result in an improved mix of our products and gross margins. |
|
Performance below expectations.
Significant improvement in gross margins while improvement in attachment rates
was relatively flat. |
| Manufacturing
Reset |
|
Product and process efficiency
improvement over the three-year period, material yield remained flat. |
|
Process efficiency and material
yield metrics will be reviewed to confirm manufacturing performance and progress is effectively supporting the Company’s product leadership strategy. |
|
As our differentiated product
position continues to increase, this initiative will be critical to delivering future growth and optimising returns. |
|
Performance far exceeded
expectations. The organisation has successfully shifted the business back to an effective
“high utilisation” model. |
|
Safety |
|
IR SR
FY15: 1.3 11.0
FY14: 1.3 23.4
FY13: 1.6 28.9
|
|
No fatalities
Stretch: 2.0 Incident Rate (“IR”) and 20 Severity Rate
(“SR”)(1) |
|
The safety of Company employees
is an essential Environmental, Social & Governance measure. |
|
Performance at expected
level. Organisation progressing towards “zero harm”. Results below 2
IR and 20 SR are now expected. |
| (1) |
We consider only the hours of manufacturing facility employees to determine the IR as these employees have the highest safety risk within the organisation. This methodology yields a higher IR than if we included all of
our employees in the calculation in a manner similar to that of other manufacturing companies. In addition, we do not consider the employee to have returned to work until s/he has returned to their original position and is not on a restricted work
basis. This methodology yields a higher SR than if we considered the employee to have returned to work when they were brought back on restricted work basis. |
8
|
|
|
|
|
|
|
|
|
| MEASURE |
|
PERFORMANCE
OVER PERIOD |
|
REQUIREMENT |
|
REASONS |
|
ASSESSMENT OF
MANAGEMENT’S
PERFORMANCE |
|
Strategic Positioning |
|
Very good progress with windows
business performance and non-fiber cement R&D initiatives. Growth in Europe continues, however not at the desired rate. |
|
It is difficult to set a specific
goal for this measure. However, the Board of Directors expects management to continue to diversify to provide more balance and greater profit growth opportunities. |
|
Developing and, as appropriate,
implementing, alternative strategic actions for sustainable growth beyond the Company’s traditional markets will create shareholder value through increased profits and diversification for lower risk. |
|
Performance exceeded
expectations. Fiberglass windows continues to evolve with manufacturing operations
running and market work continuing. |
|
Positioning the Company for
Potential Recovery |
|
Conservative leveraging of balance
sheet within 1-2 times adjusted EBITDA target by completing the sale of US$325 million, 8 year, 5.875% senior unsecured notes to lock in long term rates going forward while maintaining $590 million of short term bank facilities (2.7 year
weighted average debt maturity) with 87% liquidity as of 31 March 2015. Strategic planning
for manufacturing capacity readily available to capture future growth opportunities to meet anticipated increases in market demand. |
|
Move to a net debt position without
increasing risk to the Company. Anticipate need to re-commission idled capacity to enable
modifications in time to satisfy increased demand on production capacity, as well as further expansion via both greenfield and brownfield development in both the US and Asia Pacific. |
|
With the US building materials
industry experiencing an unprecedented downturn in the past 60 years, managing the Company through this time so it can emerge at the end of this period in as strong or stronger competitive position in the overall industry is crucial. |
|
Performance exceeded
expectations. Successful public bond offering and management of short-term bank facilities
balanced with well managed strategic planning to ensure sufficient manufacturing capacity. |
|
Talent Management/
Development |
|
The Company continues to have a
strong management team. The business has benefitted from recruiting programs, career development and mentoring and leadership programs that are part of the talent management and development initiatives.
|
|
It is not possible to
set a specific goal for this measure
beyond requiring that management
capability be retained and grown. |
|
Improving management development
and capability is important to the Company’s future growth. |
|
Performance exceeded
expectations. Significant improvements made in each fiscal year. |
Board of Directors and Remuneration Committee Assessment of ROCE and Management Performance under ROCE
RSUs for Fiscal Years 2013-2015
As a component of the fiscal year 2013 LTI Plan, we granted ROCE RSUs in September 2012. The ROCE RSUs comprised
40% of each executive’s LTI target and were granted assuming maximum performance (200% of target). Vesting of the ROCE RSUs is dependent on the average ROCE performance for fiscal years 2013-2015 and is subject to the Remuneration
Committee’s negative discretion based on its judgment regarding the quality of returns balanced against management’s delivery of market share growth.
|
|
|
| JAMES HARDIE
REMUNERATION REPORT 2015 |
|
9 |
The ROCE performance hurdles for this grant were approved as follows:
|
|
|
| |
|
% OF ROCE RSUs |
| ROCE PERFORMANCE LEVEL |
|
VESTED |
| <18.5% |
|
0% |
| ³18.5%
but < 19.5% |
|
25% |
| ³19.5% but
<20.5% |
|
50% |
| ³20.5%
but <21.5% |
|
75% |
|
³21.5% |
|
100% |
The average ROCE result for fiscal years 2013-2015 was 22.9%. Based solely on this result, 100% of the ROCE RSUs granted would
vest. However, based on the Remuneration Committee’s assessment of the quality of returns balanced against management’s delivery of market share growth, the Remuneration Committee determined that it would apply negative discretion in the
amount of 20%. As such, 80% of the outstanding fiscal year 2013 ROCE RSUs will vest in September 2015.
Performance of Relative TSR
RSUs during Fiscal Year 2015
As part of the fiscal year 2010 LTI Plan, in September 2009 and December 2009 we granted Relative TSR RSUs to senior
executives. Vesting of these Relative TSR RSUs was dependent on our TSR performance relative to a set peer group, based on the following schedule:
|
|
|
| PERFORMANCE AGAINST |
|
% OF RELATIVE TSR |
| PEER GROUP |
|
RSUs VESTED |
| <50th Percentile |
|
0% |
| 50th Percentile |
|
33% |
| 51st –
74th Percentile |
|
Sliding Scale |
| ³75th Percentile |
|
100% |
In September 2014, the final test of relative TSR performance was completed, resulting in our TSR performance at the 60th
percentile of the peer group (bringing the total vesting percentage for these grants over the five-year performance period to 59.8%). Unvested relative TSR RSUs were forfeited.
As part of the fiscal year 2011 LTI Plan, in September 2010 we granted Relative TSR RSUs to senior executives. Vesting of these Relative TSR RSUs was dependent on
our TSR performance relative to a set peer group, based on the same schedule as noted above for the fiscal year 2010 grants. Performance testing for these grants during fiscal year 2015 (in September 2014 and March 2015) did not result in any
additional vesting for the extended performance periods over what was achieved in March 2014 (77.8% vesting based on our TSR performance at the 66.7th percentile of the peer group).
As part of the fiscal year 2012 LTI Plan, in September 2011 we granted Relative TSR RSUs to senior executives. Vesting of these Relative TSR RSUs was dependent on
our TSR performance relative to a set peer group, based on the same schedule as noted above for the fiscal year 2010 grants. In March 2015, the second test of relative TSR performance was completed, resulting in 33% vesting for these grants based on
our TSR performance at the 50th percentile of the peer group. The first performance test (in September 2014) for these grants did not result in vesting.
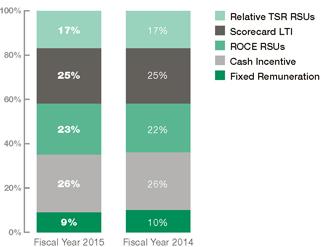
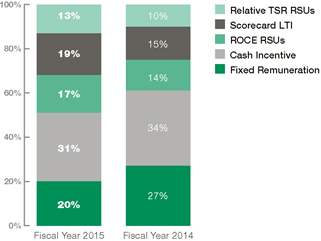
Relative Weightings of Fixed and Variable Remuneration in 2015
The charts below detail the relative weightings of fixed versus variable remuneration for the CEO and other Senior Executive Officers for fiscal years 2015 and
2014. Fixed remuneration includes base salary and other fixed benefits. Cash Incentive (STI awards) and the three LTI components comprise variable remuneration, Cash Incentive includes amounts incurred under the CP and IP Plan for each fiscal year,
paid in June of the following fiscal year, and LTI components are shown at total granted value.
CEO
Other Senior Executive Officers
Variable Remuneration Payable in Future Years
Details of the accounting cost of the variable remuneration for fiscal year 2015 that may be paid to Senior Executive Officers in future years are set out below.
The minimum amount payable is nil in all cases. The maximum amount payable will depend on the share price at time of vesting, and is therefore not possible to determine. The table below is based on the fair value of the RSUs and Scorecard LTI
according to US generally accepted accounting standards and our estimate of the rating to be applied to Scorecard LTI.
10
|
|
|
|
|
|
|
|
|
|
|
|
|
|
|
|
|
|
|
|
|
|
|
|
|
|
|
|
|
|
|
|
|
|
|
|
|
|
|
|
|
|
|
|
|
|
|
|
|
| |
|
SCORECARD
LTI(1)
(US$) |
|
|
ROCE RSUs(2)
(US$) |
|
|
RELATIVE TSR
RSUs(3)
(US$) |
|
| |
|
FY2014 |
|
|
FY2015 |
|
|
FY2016 |
|
|
FY2017 |
|
|
FY2014 |
|
|
FY2015 |
|
|
FY2016 |
|
|
FY2017 |
|
|
FY2014 |
|
|
FY2015 |
|
|
FY2016 |
|
|
FY2017 |
|
| L Gries |
|
|
364,122 |
|
|
|
679,942 |
|
|
|
678,084 |
|
|
|
313,962 |
|
|
|
242,969 |
|
|
|
453,708 |
|
|
|
452,468 |
|
|
|
208,259 |
|
|
|
337,194 |
|
|
|
629,658 |
|
|
|
627,937 |
|
|
|
289,023 |
|
| M Marsh |
|
|
52,017 |
|
|
|
97,134 |
|
|
|
96,868 |
|
|
|
44,851 |
|
|
|
34,711 |
|
|
|
64,818 |
|
|
|
64,641 |
|
|
|
29,752 |
|
|
|
50,236 |
|
|
|
93,808 |
|
|
|
93,552 |
|
|
|
43,059 |
|
| M Fisher |
|
|
52,017 |
|
|
|
97,134 |
|
|
|
96,868 |
|
|
|
44,851 |
|
|
|
34,711 |
|
|
|
64,818 |
|
|
|
64,641 |
|
|
|
29,752 |
|
|
|
50,236 |
|
|
|
93,808 |
|
|
|
93,552 |
|
|
|
43,059 |
|
| R Sullivan |
|
|
52,017 |
|
|
|
97,134 |
|
|
|
96,868 |
|
|
|
44,851 |
|
|
|
34,711 |
|
|
|
64,818 |
|
|
|
64,641 |
|
|
|
29,752 |
|
|
|
50,236 |
|
|
|
93,808 |
|
|
|
93,552 |
|
|
|
43,059 |
|
| S Gadd |
|
|
52,017 |
|
|
|
97,134 |
|
|
|
96,868 |
|
|
|
44,851 |
|
|
|
34,711 |
|
|
|
64,818 |
|
|
|
64,641 |
|
|
|
29,752 |
|
|
|
50,236 |
|
|
|
93,808 |
|
|
|
93,552 |
|
|
|
43,059 |
|
| |
|
|
572,190 |
|
|
|
1,068,478 |
|
|
|
1,065,556 |
|
|
|
493,366 |
|
|
|
381,813 |
|
|
|
712,980 |
|
|
|
711,032 |
|
|
|
327,267 |
|
|
|
538,138 |
|
|
|
1,004,889 |
|
|
|
1,002,144 |
|
|
|
461,261 |
|
| (1) |
Represents annual SG&A expense for Scorecard LTI granted in September 2014. The fair value of each award is adjusted for changes in our common stock price at each balance sheet date until the final Scorecard rating
is applied in September 2017, at which time the final value is based on our share price and the Senior Executive Officers Scorecard rating at the time of vesting. |
| (2) |
Represents annual SG&A expense for the ROCE RSUs granted in September 2014. The fair value of each RSU is adjusted for changes in our common stock price at each balance sheet date until September 2017 when ROCE
results are known and the Remuneration Committee makes a determination on the amount of negative discretion to be applied and some, all or none of the awards become vested. |
| (3) |
Represents annual SG&A expense for the relative TSR RSUs granted in September 2014 with fair market value estimated using the Monte Carlo option-pricing method. |
REMUNERATION PAID TO SENIOR EXECUTIVE OFFICERS
Total Remuneration for Senior Executive Officers
Details of the
remuneration for Senior Executive Officers in fiscal years 2015 and 2014 are set out below:
|
|
|
|
|
|
|
|
|
|
|
|
|
|
|
|
|
|
|
|
|
|
|
|
|
|
|
|
|
|
|
|
|
| (US$) |
|
PRIMARY |
|
|
POST-
EMPLOYMENT |
|
|
EQUITY AWARDS |
|
|
OTHER |
|
|
|
|
| NAME |
|
BASE PAY |
|
|
BONUSES(2) |
|
|
OTHER
BENEFITS(3) |
|
|
401(K) |
|
|
ONGOING
VESTING(4) |
|
|
MARK-TO
MARKET(5) |
|
|
OTHER
NON-
RECURRING |
|
|
TOTAL |
|
| L Gries(1) |
|
|
|
|
|
|
|
|
|
|
|
|
|
|
|
|
|
|
|
|
|
|
|
|
|
|
|
|
|
|
|
|
| Fiscal Year 2015 |
|
|
950,000 |
|
|
|
3,206,250 |
|
|
|
156,059 |
|
|
|
15,440 |
|
|
|
8,319,665 |
|
|
|
(908,777) |
|
|
|
– |
|
|
|
11,738,637 |
|
| Fiscal Year 2014 |
|
|
951,743 |
|
|
|
2,835,750 |
|
|
|
112,564 |
|
|
|
15,228 |
|
|
|
6,272,763 |
|
|
|
1,461,408 |
|
|
|
– |
|
|
|
11,649,456 |
|
| M Marsh(6) |
|
|
|
|
|
|
|
|
|
|
|
|
|
|
|
|
|
|
|
|
|
|
|
|
|
|
|
|
|
|
|
|
| Fiscal Year 2015 |
|
|
493,846 |
|
|
|
810,000 |
|
|
|
47,903 |
|
|
|
15,877 |
|
|
|
619,567 |
|
|
|
(48,658) |
|
|
|
– |
|
|
|
1,938,535 |
|
| Fiscal Year 2014 |
|
|
350,769 |
|
|
|
687,744 |
|
|
|
30,564 |
|
|
|
19,938 |
|
|
|
196,070 |
|
|
|
24,004 |
|
|
|
288,666 |
|
|
|
1,597,755 |
|
| M Fisher |
|
|
|
|
|
|
|
|
|
|
|
|
|
|
|
|
|
|
|
|
|
|
|
|
|
|
|
|
|
|
|
|
| Fiscal Year 2015 |
|
|
486,923 |
|
|
|
779,100 |
|
|
|
39,887 |
|
|
|
15,738 |
|
|
|
835,874 |
|
|
|
(106,421) |
|
|
|
– |
|
|
|
2,051,101 |
|
| Fiscal Year 2014 |
|
|
473,061 |
|
|
|
673,344 |
|
|
|
43,505 |
|
|
|
15,612 |
|
|
|
712,419 |
|
|
|
158,794 |
|
|
|
– |
|
|
|
2,076,735 |
|
| R Sullivan |
|
|
|
|
|
|
|
|
|
|
|
|
|
|
|
|
|
|
|
|
|
|
|
|
|
|
|
|
|
|
|
|
| Fiscal Year 2015 |
|
|
392,308 |
|
|
|
680,400 |
|
|
|
54,687 |
|
|
|
16,846 |
|
|
|
475,721 |
|
|
|
(50,189) |
|
|
|
– |
|
|
|
1,569,773 |
|
| Fiscal Year 2014 |
|
|
311,539 |
|
|
|
529,848 |
|
|
|
81,054 |
|
|
|
15,508 |
|
|
|
209,217 |
|
|
|
66,392 |
|
|
|
– |
|
|
|
1,213,558 |
|
| S Gadd |
|
|
|
|
|
|
|
|
|
|
|
|
|
|
|
|
|
|
|
|
|
|
|
|
|
|
|
|
|
|
|
|
| Fiscal Year 2015 |
|
|
362,308 |
|
|
|
608,400 |
|
|
|
39,475 |
|
|
|
16,846 |
|
|
|
456,513 |
|
|
|
(50,632) |
|
|
|
– |
|
|
|
1,432,910 |
|
| Fiscal Year 2014 |
|
|
281,538 |
|
|
|
463,680 |
|
|
|
36,753 |
|
|
|
16,131 |
|
|
|
220,293 |
|
|
|
47,816 |
|
|
|
– |
|
|
|
1,066,211 |
|
| TOTAL |
|
|
|
|
|
|
|
|
|
|
|
|
|
|
|
|
|
|
|
|
|
|
|
|
|
|
|
|
|
|
|
|
| Fiscal Year 2015 |
|
|
2,685,385 |
|
|
|
6,084,150 |
|
|
|
338,011 |
|
|
|
80,747 |
|
|
|
10,707,340 |
|
|
|
(1,164,677) |
|
|
|
– |
|
|
|
18,730,956 |
|
| Fiscal Year 2014 |
|
|
2,368,650 |
|
|
|
5,190,366 |
|
|
|
304,440 |
|
|
|
82,417 |
|
|
|
7,610,762 |
|
|
|
1,758,414 |
|
|
|
288,666 |
|
|
|
17,603,715 |
|
| (1) |
L Gries base pay includes US$161,449 and US$155,818 in fiscal years 2015 and 2014, respectively, which is allocated for tax purposes to his services on the Company’s Board of Directors. |
| (2) |
For further details on bonuses paid for fiscal years 2015 and 2014, see page 6 of this Remuneration Report. Amounts reflect actual bonuses to be paid in June 2015 and paid in June 2014, for fiscal years 2015 and 2014,
respectively. |
| (3) |
Includes the aggregate amount of all other benefits received in the year indicated. Examples of benefits that may be received include medical and life insurance benefits, car allowances, membership in executive wellness
programs, and financial planning and tax services. |
| (4) |
Includes equity award expense for grants of Scorecard LTI awards, relative TSR RSUs, ROCE RSUs and Hybrid RSUs. As part of the fiscal year 2012 LTI plan, the Company granted Hybrid RSUs to senior executives on the basis
of management’s attainment of certain EBIT goals in fiscal year 2012. During June 2014, these Hybrid RSUs vested. Relative TSR RSUs are valued using a Monte Carlo simulation method. Hybrid RSUs, ROCE RSUs and Scorecard LTI awards are valued
based on the Company’s share price at each balance date as well as the Remuneration Committee’s current expectation of the percentage of the RSUs or awards which will vest. The fair value of equity awards granted are included in
compensation during the period in which the equity awards vest. For Hybrid RSUs, ROCE RSUs and Scorecard LTI awards, this amount excludes the equity award expense in fiscal years 2015 and 2014 resulting from changes in the Company’s share
price, which is disclosed separately in the Equity Awards “Mark-to-Market” column. |
| (5) |
The amount included in this column is the equity award expense in relation to Hybrid RSUs, ROCE RSUs and Scorecard LTI awards resulting solely from changes in the US dollar share price during fiscal years 2015 and 2014.
During fiscal year 2015, there was an 11.8% depreciation in our share price from US$13.21 to US$11.65, as a result of changes in the AUD/USD exchange rate. During fiscal year 2014, there was a 29.5% appreciation in our share price from US$10.20 to
US$13.21. |
| (6) |
Commenced employment 24 June 2013. Upon hire and reflected in his fiscal 2014 compensation, Mr Marsh received cash in the amount of US$288,666 which is included in the “Other” compensation column as well
as a one-time grant of time-vested RSUs as compensation for foregone compensation and benefits at his prior employer. These RSUs were granted 16 September 2013 and are scheduled to cliff vest on the third anniversary of the grant date. The
equity award expense for these time-vested RSUs is included in the “Ongoing Vesting” column. |
|
|
|
| JAMES HARDIE
REMUNERATION REPORT 2015 |
|
11 |
CHANGES TO REMUNERATION FOR FISCAL YEAR 2016
Remuneration for Fiscal Year 2016
During May 2015, the Board of
Directors, with the assistance of the Remuneration Committee and its independent remuneration advisers, undertook its annual review of our existing remuneration policies, programs and arrangements and determined to implement certain changes for
fiscal year 2016.
CEO Compensation
For fiscal year
2016, there will be no increase in the CEO’s base salary or target STI. The CEO’s target LTI will increase by US$500,000 to US$4.0 million in fiscal year 2016. The Board of Directors believes this adjustment is required to bring the
CEO’s total compensation package more in line with the total compensation packages of CEO’s in our Peer Group.
Other Senior Executive
Officer Compensation
Base pay and target LTI increases in fiscal year 2016 for other Senior Executive Officers are as follows:
|
|
|
|
|
|
|
|
|
|
|
|
|
|
|
|
|
| |
|
BASE SALARY |
|
|
TARGET LTI |
|
| |
|
FISCAL YEAR 2015 |
|
|
FISCAL YEAR 2016 |
|
|
FISCAL YEAR 2015 |
|
|
FISCAL YEAR 2016 |
|
| NAME |
|
(US$) |
|
|
(US$) |
|
|
(US$) |
|
|
(US$) |
|
| M Marsh |
|
|
500,000 |
|
|
|
520,000 |
|
|
|
500,000 |
|
|
|
900,000 |
|
| M Fisher |
|
|
490,000 |
|
|
|
500,000 |
|
|
|
500,000 |
|
|
|
650,000 |
|
| R Sullivan |
|
|
420,000 |
|
|
|
520,000 |
|
|
|
500,000 |
|
|
|
900,000 |
|
| S Gadd |
|
|
390,000 |
|
|
|
400,000 |
|
|
|
500,000 |
|
|
|
650,000 |
|
Base salary increases for Messrs Marsh, Fisher and Gadd were made in line with our annual compensation review guidelines and were
adjusted as required to maintain positioning relative to market merit increase levels. The base pay increase for Mr Sullivan was made to properly align his base salary with the increase in scope and accountability of his position which occurred
during fiscal year 2015.
Target LTI for fiscal year 2016 increased for all other Senior Executive Officers to better align LTI target values with (i) our
CEO succession plan; (ii) our need to retain key senior executives through the eventual CEO transition process; (iii) our lean management structure; and (iv) the 75th percentile of our Peer Group LTI values, consistent with our
remuneration philosophy.
There were no changes in target STI for other Senior Executive Officers.
STI Plan
To better align and motivate management’s
performance on initiatives that are key to our success, the Remuneration Committee has approved changes to the performance hurdles for the US business under the CP Plan. There are no changes to the other components of the CP Plan (performance
hurdles for the Asia Pacific business, maximum payout levels and Remuneration Committee discretion on STI paid) or to the IP Plan.
CP Plan – US Performance Hurdles
The Remuneration Committee continues to believe the US payout matrix motivates management to balance growth and earnings; however, it also recognizes that there
are other key initiatives that are important to our future success which need to be more significantly weighted in the calculation of determining STI paid. As a result, the US payout multiple for fiscal year 2016 will be determined by performance
against the matrix multiple (Growth and Return measures for 70% of the STI opportunity), the interiors product business multiple (for 10% of STI opportunity), and the “Wood-look” PDG multiple (for 20% of STI opportunity). The overarching
formula for the US payout multiple is:
|
|
|
|
|
|
|
|
|
|
|
|
|
| US Payout Multiple = |
|
(70% * Matrix Multiple) |
|
+ |
|
(10% * Interiors Multiple) |
|
+ |
|
(20% * “Wood-look” PDG Multiple) |
|
|
|
|
|
|
|
|
|
| |
|

Matrix Factor |
|
|
|

Interiors Factor |
|
|
|

“Wood-look” PDG Factor |
|
|
Each payout factor (Matrix Factor, Interiors Factor, and “Wood-look” PDG Factor) will be capped as follows to properly
balance management’s motivation across volume growth, returns and key initiatives:
| ¡ |
|
Matrix Factor = capped at 2.0x |
| ¡ |
|
Matrix Factor plus Interiors Factor = capped at 2.3x |
| ¡ |
|
“Wood-look” PDG Factor = capped at 1.25x |
Consistent with fiscal year 2015, the overall US payout
multiple will continue to be capped at 3.0x.
LTI Plan
The Board of Directors and Remuneration Committee feel the current LTI Plan is having the desired effect of balancing the short-term focus of base salaries and STI
program by tying equity-based rewards to performance achieved over multi-year periods and aligning equity incentives with long-term shareholder interests. Additionally, management understands the current plan and continues to be motivated by it. As
such, the fiscal year 2016 LTI Plan is materially consistent with the plan for fiscal year 2015, with only minor updates to ROCE RSU hurdles and Scorecard objectives.
The 2015 AGM Notice of Meeting contains further details on the relative TSR RSU and ROCE RSU grants for fiscal year 2016. Changes to ROCE performance hurdles and
Scorecard objectives for fiscal year 2016 are set forth in the following section.
12
Changes to LTI Variable Compensation for Fiscal Year 2016
ROCE RSUs
The goals for
ROCE RSUs to be granted in fiscal year 2016 (for performance in fiscal years 2016 to 2018) were increased from the goals for ROCE RSUs granted in fiscal year 2015 as follows:
|
|
|
|
|
|
|
| FISCAL YEARS |
|
FISCAL YEARS |
|
|
|
% OF ROCE |
| 2016–2018 ROCE |
|
2015–2017 ROCE |
|
|
|
RSUS TO VEST |
| < 23.0% |
|
< 22.0% |
|
|
|
0% |
| ³ 23.0%, but
< 25.0% |
|
³ 22.0%, but < 24.5% |
|
|
|
25% |
| ³ 25.0%, but < 27.5% |
|
³ 24.5%, but < 27.0% |
|
|
|
50% |
| ³ 27.5%, but
< 28.5% |
|
³ 27.0%, but < 28.5% |
|
|
|
75% |
|
³ 28.5% |
|
³ 28.5% |
|
|
|
100% |
For fiscal year 2016, the Board of Directors has increased the threshold ROCE performance level at which vesting commences,
increased the ROCE performance levels for 25% and 50% vesting, and narrowed the intervals for 25% and 75% vesting, thereby making it more difficult to achieve at target and above target vesting. The Board of Directors believes this increase in
performance hurdles is appropriate given the recovering housing market in the US and better optimisation of manufacturing plants.
Scorecard LTI
The
Remuneration Committee uses the Scorecard to set strategic objectives for which performance can only be assessed over a period of time. These objectives change from year-to-year in line with our strategic priorities. For fiscal year 2016, the
Scorecard objectives remain the same as the Scorecard objectives for fiscal year 2015, with the exception that the Remuneration Committee added one new goal related to growing our interiors business.
The goals included in the scorecard for fiscal year 2016 are set forth below:
|
|
|
|
|
|
|
| GOAL |
|
IMPORTANCE |
|
MEASUREMENT |
|
EXPECTATION |
| Grow exterior
cladding market share and maintain category share in the US business |
|
A key strategy for the Company is to
maximise its market share growth/ retention of the exterior cladding market for new housing starts and for repair and remodel markets. |
|
PDG performance of the
Company’s exterior cladding compared to the underlying market (in square feet) and outperformance of key competition. |
|
PDG growth above market and
outperformance against key competition. |
| Build US
organisational and leadership capability in support of the 35/90(1) growth target |
|
The amount of growth that 35/90
entails requires lower turnover levels and an increase in management depth and organisational capability. |
|
A range of factors including the
rate of salaried voluntary turnover, survey results of overall satisfaction, execution of programs to build organisational capability and bench strength for key roles and measure of readiness.
|
|
Satisfactory progress on turnover,
engagement initiatives and programs to build organisational capability demonstrated by greater bench strength of high performing managers. |
| Manufacturing
effectiveness and sourcing efficiency |
|
The Company operates a national US
network of manufacturing facilities. |
|
First pass quality(2) and service, as well as sheet machine product and process efficiency metrics.
Manufacturing performance data is commercial in confidence. |
|
Commercial in confidence targets
will be reviewed to confirm progress is supporting the Company’s product leadership strategy. |
|
Safety |
|
The safety of all employees is an
essential objective of the Company. |
|
Incident Rate (IR):
Recordable incidents per 200,000 hours worked.
Severity Rate (SR):
Days lost per 200,000 hours worked.
|
|
Zero fatalities.
IR: 2.0 or below.
SR: 20.0 or below. |
| Maintain
market position on core products in Australian and New Zealand markets and grow Scyon to greater proportion of Australian business |
|
Value creating opportunity. |
|
Category share and primary demand
growth. Scyon growth will be based on % net sales revenue against total for Australia.
Current market position is commercial in confidence.
|
|
Grow category share on core
Australian and New Zealand products. Grow PDG in Australia and New Zealand.
Achieve growth in Scyon percentage of Australian business. |
| (1) |
35/90 growth target is defined as 35% fiber cement market share and 90% fiber cement category share. |
| (2) |
First pass quality measures the percentage of products that pass a quality test on first pass. |
|
|
|
| JAMES HARDIE
REMUNERATION REPORT 2015 |
|
13 |
|
|
|
|
|
|
|
| GOAL |
|
IMPORTANCE |
|
MEASUREMENT |
|
EXPECTATION |
| Global capacity
expansion |
|
Expansion to support expected growth
over the next 20 years. |
|
Approval, construction and start-up
of capacity adds. |
|
Completion of building construction,
equipment installation and start up at identified sites. |
| Strategic
positioning |
|
Developing sustainable growth beyond
the Company’s traditional markets may create shareholder value through increased profits and lower risk through diversification. |
|
This measure is subjective and
achievement can take many different forms, including developing new technologies, expanding into new product categories, or expanding geographically. |
|
Progress against this goal will be
reviewed to ensure any progress is supporting the Company’s position in the marketplace. |
| Customer
experience |
|
Necessary to support the
Company’s 35/90 strategy. |
|
Mapped the current customer
experience. Continue to identify needs and barriers throughout the experience (for different customer types). Develop strategies to address gaps identified. |
|
Demonstrated improvement in the
customer experience based on measures set up in FY16. |
|
Defend market share position
against key “wood-look” competitor |
|
Necessary to support the
Company’s 35/90 strategy. |
|
The Company’s exterior
performance relative to key “wood-look” competitor in specific markets. Current
market position is commercial in confidence. |
|
Outgrow key “wood-look”
competitor in the aggregate measured on a calendar year basis. |
| Trim market
strategy implementation |
|
Developing sustainable growth beyond
the Company’s traditional products. |
|
This measure is subjective and
achievement can take many different forms, including developing new technologies, expanding into new product categories, or expanding geographically. |
|
Commercial in confidence targets
will be reviewed to confirm progress is supporting the Company’s trim market strategy. |
| Interiors market
strategy implementation |
|
Necessary to sustain interiors
business revenue and EBIT, and grow beyond the Company’s current market position. |
|
PDG together with the entry into
adjacent markets. The latter achievement can include developing new technologies, expanding into new product categories, etc. |
|
PDG growth above market and
technology and/or product adjacent to existing markets identified and in process of development. |
OUTSTANDING EQUITY AWARDS HELD BY SENIOR EXECUTIVE OFFICERS
The following tables set forth information regarding outstanding equity awards held by our Senior Executive Officers as of 30 April 2015.
Options
As at 30 April 2015, no Senior Executive Officers
held stock options.
14
Restricted Stock Units
|
|
|
|
|
|
|
|
|
|
|
|
|
|
|
|
|
|
|
|
|
|
|
|
|
|
|
|
|
|
|
|
|
|
|
| NAME |
|
GRANT
DATE |
|
|
RELEASE
DATE |
|
|
HOLDING
AND
UNVESTED
AT
1 APRIL
2014 |
|
|
GRANTED |
|
|
TOTAL
VALUE AT
GRANT(1)
(US$) |
|
|
VESTED |
|
|
LAPSED |
|
|
HOLDING
AND
UNVESTED
AT 30
APRIL 2015 |
|
|
FAIR
VALUE
PER
RSU(2)
(US$) |
| L Gries |
|
|
15-Sep-09 |
(3) |
|
|
15-Sep-12 |
|
|
|
112,056 |
|
|
|
234,900 |
|
|
|
$1,176,849 |
|
|
|
(17,626) |
|
|
|
(94,430) |
|
|
|
– |
|
|
$5.0100 |
|
|
|
11-Dec-09 |
(3) |
|
|
15-Sep-12 |
|
|
|
38,997 |
|
|
|
81,746 |
|
|
|
$564,865 |
|
|
|
(6,135) |
|
|
|
(32,862) |
|
|
|
– |
|
|
$6.9100 |
|
|
|
15-Sep-10 |
(3) |
|
|
15-Sep-13 |
|
|
|
128,405 |
|
|
|
577,255 |
|
|
|
$2,595,627 |
|
|
|
– |
|
|
|
– |
|
|
|
128,405 |
|
|
$4.4965 |
|
|
|
15-Sep-11 |
(3) |
|
|
15-Sep-14 |
|
|
|
606,852 |
|
|
|
606,852 |
|
|
|
$2,500,291 |
|
|
|
(200,261) |
|
|
|
– |
|
|
|
406,591 |
|
|
$4.1201 |
|
|
|
7-Jun-12 |
(4) |
|
|
7-Jun-14 |
|
|
|
166,459 |
|
|
|
166,459 |
|
|
|
$1,199,137 |
|
|
|
(166,459) |
|
|
|
– |
|
|
|
– |
|
|
$7.2038 |
|
|
|
14-Sep-12 |
(3) |
|
|
14-Sep-15 |
|
|
|
273,732 |
|
|
|
273,732 |
|
|
|
$2,041,356 |
|
|
|
– |
|
|
|
– |
|
|
|
273,732 |
|
|
$7.4575 |
|
|
|
14-Sep-12 |
(5) |
|
|
14-Sep-15 |
|
|
|
284,916 |
|
|
|
284,916 |
|
|
|
$2,697,385 |
|
|
|
– |
|
|
|
– |
|
|
|
284,916 |
|
|
$9.4673 |
|
|
|
16-Sep-13 |
(3) |
|
|
16-Sep-16 |
|
|
|
295,824 |
|
|
|
295,824 |
|
|
|
$1,994,593 |
|
|
|
– |
|
|
|
– |
|
|
|
295,824 |
|
|
$6.7425 |
|
|
|
16-Sep-13 |
(5) |
|
|
16-Sep-16 |
|
|
|
278,393 |
|
|
|
278,393 |
|
|
|
$2,640,140 |
|
|
|
– |
|
|
|
– |
|
|
|
278,393 |
|
|
$9.4835 |
|
|
|
16-Sep-14 |
(3,6) |
|
|
16-Sep-17 |
|
|
|
– |
|
|
|
260,346 |
|
|
|
$1,883,812 |
|
|
|
– |
|
|
|
– |
|
|
|
260,346 |
|
|
$7.2358 |
| |
|
|
16-Sep-14 |
(5) |
|
|
16-Sep-17 |
|
|
|
– |
|
|
|
232,980 |
|
|
|
$2,607,442 |
|
|
|
– |
|
|
|
– |
|
|
|
232,980 |
|
|
$11.1917 |
| M Marsh |
|
|
16-Sep-13 |
(3) |
|
|
16-Sep-16 |
|
|
|
33,400 |
|
|
|
33,400 |
|
|
|
$225,200 |
|
|
|
– |
|
|
|
– |
|
|
|
33,400 |
|
|
$6.7425 |
|
|
|
16-Sep-13 |
(5) |
|
|
16-Sep-16 |
|
|
|
31,431 |
|
|
|
31,431 |
|
|
|
$298,076 |
|
|
|
– |
|
|
|
– |
|
|
|
31,431 |
|
|
$9.4835 |
|
|
|
16-Sep-13 |
(7) |
|
|
16-Sep-16 |
|
|
|
56,128 |
|
|
|
56,128 |
|
|
|
$482,734 |
|
|
|
– |
|
|
|
– |
|
|
|
56,128 |
|
|
$8.6006 |
|
|
|
16-Sep-14 |
(3) |
|
|
16-Sep-17 |
|
|
|
– |
|
|
|
38,787 |
|
|
|
$280,655 |
|
|
|
– |
|
|
|
– |
|
|
|
38,787 |
|
|
$7.2358 |
| |
|
|
16-Sep-14 |
(5) |
|
|
16-Sep-17 |
|
|
|
– |
|
|
|
33,283 |
|
|
|
$372,493 |
|
|
|
– |
|
|
|
– |
|
|
|
33,283 |
|
|
$11.1917 |
| M Fisher |
|
|
15-Sep-09 |
(3) |
|
|
15-Sep-12 |
|
|
|
18,676 |
|
|
|
39,150 |
|
|
|
$196,142 |
|
|
|
(2,937) |
|
|
|
(15,739) |
|
|
|
– |
|
|
$5.0100 |
|
|
|
11-Dec-09 |
(3) |
|
|
15-Sep-12 |
|
|
|
6,500 |
|
|
|
13,624 |
|
|
|
$94,142 |
|
|
|
(1,023) |
|
|
|
(5,477) |
|
|
|
– |
|
|
$6.9100 |
|
|
|
15-Sep-10 |
(3) |
|
|
15-Sep-13 |
|
|
|
14,905 |
|
|
|
67,003 |
|
|
|
$301,279 |
|
|
|
– |
|
|
|
– |
|
|
|
14,905 |
|
|
$4.4965 |
|
|
|
15-Sep-11 |
(3) |
|
|
15-Sep-14 |
|
|
|
68,516 |
|
|
|
68,516 |
|
|
|
$282,293 |
|
|
|
(22,610) |
|
|
|
– |
|
|
|
45,906 |
|
|
$4.1201 |
|
|
|
7-Jun-12 |
(4) |
|
|
7-Jun-14 |
|
|
|
18,794 |
|
|
|
18,794 |
|
|
|
$135,388 |
|
|
|
(18,794) |
|
|
|
– |
|
|
|
– |
|
|
$7.2038 |
|
|
|
14-Sep-12 |
(3) |
|
|
14-Sep-15 |
|
|
|
30,905 |
|
|
|
30,905 |
|
|
|
$230,474 |
|
|
|
– |
|
|
|
– |
|
|
|
30,905 |
|
|
$7.4575 |
|
|
|
14-Sep-12 |
(5) |
|
|
14-Sep-15 |
|
|
|
32,168 |
|
|
|
32,168 |
|
|
|
$304,544 |
|
|
|
– |
|
|
|
– |
|
|
|
32,168 |
|
|
$9.4673 |
|
|
|
16-Sep-13 |
(3) |
|
|
16-Sep-16 |
|
|
|
33,400 |
|
|
|
33,400 |
|
|
|
$225,200 |
|
|
|
– |
|
|
|
– |
|
|
|
33,400 |
|
|
$6.7425 |
|
|
|
16-Sep-13 |
(5) |
|
|
16-Sep-16 |
|
|
|
31,431 |
|
|
|
31,431 |
|
|
|
$298,076 |
|
|
|
– |
|
|
|
– |
|
|
|
31,431 |
|
|
$9.4835 |
|
|
|
16-Sep-14 |
(3) |
|
|
16-Sep-17 |
|
|
|
– |
|
|
|
38,787 |
|
|
|
$280,655 |
|
|
|
– |
|
|
|
– |
|
|
|
38,787 |
|
|
$7.2358 |
| |
|
|
16-Sep-14 |
(5) |
|
|
16-Sep-17 |
|
|
|
– |
|
|
|
33,283 |
|
|
|
$372,493 |
|
|
|
– |
|
|
|
– |
|
|
|
33,283 |
|
|
$11.1917 |
| R Sullivan |
|
|
15-Sep-11 |
(3) |
|
|
15-Sep-14 |
|
|
|
17,227 |
|
|
|
17,227 |
|
|
|
$70,977 |
|
|
|
(5,684) |
|
|
|
– |
|
|
|
11,543 |
|
|
$4.1201 |
|
|
|
7-Jun-12 |
(4) |
|
|
7-Jun-14 |
|
|
|
5,400 |
|
|
|
5,400 |
|
|
|
$38,901 |
|
|
|
(5,400) |
|
|
|
– |
|
|
|
– |
|
|
$7.2038 |
|
|
|
14-Sep-12 |
(3) |
|
|
14-Sep-15 |
|
|
|
7,064 |
|
|
|
7,064 |
|
|
|
$52,680 |
|
|
|
– |
|
|
|
– |
|
|
|
7,064 |
|
|
$7.4575 |
|
|
|
14-Sep-12 |
(5) |
|
|
14-Sep-15 |
|
|
|
7,353 |
|
|
|
7,353 |
|
|
|
$69,613 |
|
|
|
– |
|
|
|
– |
|
|
|
7,353 |
|
|
$9.4673 |
|
|
|
16-Sep-13 |
(3) |
|
|
16-Sep-16 |
|
|
|
23,857 |
|
|
|
23,857 |
|
|
|
$160,856 |
|
|
|
– |
|
|
|
– |
|
|
|
23,857 |
|
|
$6.7425 |
|
|
|
16-Sep-13 |
(5) |
|
|
16-Sep-16 |
|
|
|
22,451 |
|
|
|
22,451 |
|
|
|
$212,914 |
|
|
|
– |
|
|
|
– |
|
|
|
22,451 |
|
|
$9.4835 |
|
|
|
16-Sep-14 |
(3) |
|
|
16-Sep-17 |
|
|
|
– |
|
|
|
38,787 |
|
|
|
$280,655 |
|
|
|
– |
|
|
|
– |
|
|
|
38,787 |
|
|
$7.2358 |
| |
|
|
16-Sep-14 |
(5) |
|
|
16-Sep-17 |
|
|
|
– |
|
|
|
33,283 |
|
|
|
$372,493 |
|
|
|
– |
|
|
|
– |
|
|
|
33,283 |
|
|
$11.1917 |
| S Gadd |
|
|
15-Sep-10 |
(3) |
|
|
15-Sep-13 |
|
|
|
3,669 |
|
|
|
16,493 |
|
|
|
$74,161 |
|
|
|
– |
|
|
|
– |
|
|
|
3,669 |
|
|
$4.4965 |
|
|
|
15-Sep-11 |
(3) |
|
|
15-Sep-14 |
|
|
|
15,661 |
|
|
|
15,661 |
|
|
|
$64,525 |
|
|
|
(5,168) |
|
|
|
– |
|
|
|
10,493 |
|
|
$4.1201 |
|
|
|
7-Jun-12 |
(4) |
|
|
7-Jun-14 |
|
|
|
4,909 |
|
|
|
4,909 |
|
|
|
$35,363 |
|
|
|
(4,909) |
|
|
|
– |
|
|
|
– |
|
|
$7.2038 |
|
|
|
14-Sep-12 |
(3) |
|
|
14-Sep-15 |
|
|
|
7,064 |
|
|
|
7,064 |
|
|
|
$52,680 |
|
|
|
– |
|
|
|
– |
|
|
|
7,064 |
|
|
$7.4575 |
|
|
|
14-Sep-12 |
(5) |
|
|
14-Sep-15 |
|
|
|
7,353 |
|
|
|
7,353 |
|
|
|
$69,613 |
|
|
|
– |
|
|
|
– |
|
|
|
7,353 |
|
|
$9.4673 |
|
|
|
16-Sep-13 |
(3) |
|
|
16-Sep-16 |
|
|
|
23,857 |
|
|
|
23,857 |
|
|
|
$160,856 |
|
|
|
– |
|
|
|
– |
|
|
|
23,857 |
|
|
$6.7425 |
|
|
|
16-Sep-13 |
(5) |
|
|
16-Sep-16 |
|
|
|
22,451 |
|
|
|
22,451 |
|
|
|
$212,914 |
|
|
|
– |
|
|
|
– |
|
|
|
22,451 |
|
|
$9.4835 |
|
|
|
16-Sep-14 |
(3) |
|
|
16-Sep-17 |
|
|
|
– |
|
|
|
38,787 |
|
|
|
$280,655 |
|
|
|
– |
|
|
|
– |
|
|
|
38,787 |
|
|
$7.2358 |
| |
|
|
16-Sep-14 |
(5) |
|
|
16-Sep-17 |
|
|
|
– |
|
|
|
33,283 |
|
|
|
$372,493 |
|
|
|
– |
|
|
|
– |
|
|
|
33,283 |
|
|
$11.1917 |
| (1) |
Total Value at Grant = Fair Value per RSU multiplied by number of units granted. |
| (2) |
Fair Value per RSU is estimated on the date of grant using a binomial lattice model that incorporates a Monte Carlo simulation for Relative TSR RSUs. For Hybrid and ROCE RSUs, the grant date fair value is our stock
price on the date of grant. For service vesting RSUs, the fair value is our stock price on the date of grant, adjusted for the fair value of estimated dividends as the RSU holder is not entitled to dividends over the vesting period.
|
| (3) |
Relative TSR RSUs granted under the LTIP. These RSUs are subject to performance hurdles and/or application of negative discretion. |
| (4) |
Hybrid RSUs (formerly Executive Incentive Plan RSUs) granted under the LTIP. These RSUs were subject to application of negative discretion; however the Board of Directors did not exercise negative discretion on vesting.
|
| (5) |
ROCE RSUs granted under the LTIP. These RSUs are subject to performance hurdles and/or application of negative discretion. |
| (6) |
Mr Gries was also granted a cash-settled award (equivalent to 11,164 units) on 16 September 2014. This cash-settled award may vest based on the same vesting criteria as his relative TSR RSU grant and may only vest
in the event that his relative TSR RSU grant vests in full. Upon vesting, the award will be settled in cash based on the number of units vested and the fair market value of our shares of common stock as of the relevant vesting date.
|
| (7) |
Time vested RSUs granted under the 2001 JHI plc Equity Incentive Plan (“2001 Equity Incentive Plan”). |
|
|
|
| JAMES HARDIE
REMUNERATION REPORT 2015 |
|
15 |
Scorecard LTI
|
|
|
|
|
|
|
|
|
|
|
|
|
|
|
|
|
|
|
|
|
|
|
|
|
|
|
|
|
| NAME |
|
GRANT
DATE |
|
|
RELEASE
DATE |
|
|
HOLDING AT
1 APRIL 2014 |
|
|
GRANTED |
|
|
VESTED(1)
|
|
|
LAPSED |
|
|
HOLDING AT
30 APRIL 2015 |
|
| L Gries |
|
|
7-Jun-11 |
(2) |
|
|
7-Jun-14 |
|
|
|
455,239 |
|
|
|
455,239 |
|
|
|
(341,429) |
|
|
|
(113,810) |
|
|
|
– |
|
|
|
|
14-Sep-12 |
|
|
|
14-Sep-15 |
|
|
|
320,531 |
|
|
|
320,531 |
|
|
|
– |
|
|
|
– |
|
|
|
320,531 |
|
|
|
|
16-Sep-13 |
|
|
|
16-Sep-16 |
|
|
|
313,192 |
|
|
|
313,192 |
|
|
|
– |
|
|
|
– |
|
|
|
313,192 |
|
| |
|
|
16-Sep-14 |
|
|
|
16-Sep-17 |
|
|
|
– |
|
|
|
262,103 |
|
|
|
– |
|
|
|
– |
|
|
|
262,103 |
|
| M Marsh |
|
|
16-Sep-13 |
|
|
|
16-Sep-16 |
|
|
|
35,360 |
|
|
|
35,360 |
|
|
|
– |
|
|
|
– |
|
|
|
35,360 |
|
| |
|
|
16-Sep-14 |
|
|
|
16-Sep-17 |
|
|
|
– |
|
|
|
37,443 |
|
|
|
– |
|
|
|
– |
|
|
|
37,443 |
|
| M Fisher |
|
|
7-Jun-11 |
(2) |
|
|
7-Jun-14 |
|
|
|
51,398 |
|
|
|
51,398 |
|
|
|
(28,268) |
|
|
|
(23,130) |
|
|
|
– |
|
|
|
|
14-Sep-12 |
|
|
|
14-Sep-15 |
|
|
|
36,189 |
|
|
|
36,189 |
|
|
|
– |
|
|
|
– |
|
|
|
36,189 |
|
|
|
|
16-Sep-13 |
|
|
|
16-Sep-16 |
|
|
|
35,360 |
|
|
|
35,360 |
|
|
|
– |
|
|
|
– |
|
|
|
35,360 |
|
| |
|
|
16-Sep-14 |
|
|
|
16-Sep-17 |
|
|
|
– |
|
|
|
37,443 |
|
|
|
– |
|
|
|
– |
|
|
|
37,443 |
|
| R Sullivan |
|
|
7-Jun-11 |
(2) |
|
|
7-Jun-14 |
|
|
|
12,923 |
|
|
|
12,923 |
|
|
|
(8,529) |
|
|
|
(4,394) |
|
|
|
– |
|
|
|
|
14-Sep-12 |
|
|
|
14-Sep-15 |
|
|
|
8,272 |
|
|
|
8,272 |
|
|
|
– |
|
|
|
– |
|
|
|
8,272 |
|
|
|
|
16-Sep-13 |
|
|
|
16-Sep-16 |
|
|
|
25,257 |
|
|
|
25,257 |
|
|
|
– |
|
|
|
– |
|
|
|
25,257 |
|
| |
|
|
16-Sep-14 |
|
|
|
16-Sep-17 |
|
|
|
– |
|
|
|
37,443 |
|
|
|
– |
|
|
|
– |
|
|
|
37,443 |
|
| S Gadd |
|
|
7-Jun-11 |
(2) |
|
|
7-Jun-14 |
|
|
|
11,748 |
|
|
|
11,748 |
|
|
|
(6,461) |
|
|
|
(5,287) |
|
|
|
– |
|
|
|
|
14-Sep-12 |
|
|
|
14-Sep-15 |
|
|
|
8,272 |
|
|
|
8,272 |
|
|
|
– |
|
|
|
– |
|
|
|
8,272 |
|
|
|
|
16-Sep-13 |
|
|
|
16-Sep-16 |
|
|
|
25,257 |
|
|
|
25,257 |
|
|
|
– |
|
|
|
– |
|
|
|
25,257 |
|
| |
|
|
16-Sep-14 |
|
|
|
16-Sep-17 |
|
|
|
– |
|
|
|
37,443 |
|
|
|
– |
|
|
|
– |
|
|
|
37,443 |
|
| (1) |
Represents the number of Scorecard LTI awards vesting after the Remuneration Committee’s application of the scorecard in respect of fiscal years 2012-2014. A detailed assessment of the reasons for the scorecard
ratings was set out in the fiscal year 2014 Remuneration Report. |
| (2) |
Scorecard LTI awards in respect of fiscal years 2013-2015 will vest on 14 September 2015. A detailed assessment of the Remuneration Committee’s assessment of management’s performance is set out on page 8
of this Remuneration Report. |
Relevant Interests in James Hardie Held by Senior Executive Officers
Our LTI Plans and stock ownership guidelines (described below) provide a strong level of alignment between Senior Executive Officers and shareholders. Changes in
relevant interests of Senior Executive Officers in our securities between 30 April 2015 and 30 April 2014 are set out below:
|
|
|
|
|
|
|
|
|
|
|
|
|
|
|
|
|
| NAME |
|
CUFS AT
30 APRIL 2015 |
|
|
CUFS AT
30 APRIL 2014 |
|
|
RSUS AT
30 APRIL 2015 |
|
|
RSUS AT
30 APRIL 2014 |
|
| L Gries |
|
|
522,278 |
|
|
|
471,501 |
|
|
|
2,161,187 |
|
|
|
2,185,634 |
|
| M Marsh |
|
|
– |
|
|
|
– |
|
|
|
193,029 |
|
|
|
120,959 |
|
| M Fisher |
|
|
149,689 |
|
|
|
204,464 |
|
|
|
260,785 |
|
|
|
255,295 |
|
| R Sullivan |
|
|
7,427 |
|
|
|
– |
|
|
|
144,338 |
|
|
|
83,352 |
|
| S Gadd |
|
|
26,049 |
|
|
|
26,049 |
|
|
|
146,957 |
|
|
|
84,964 |
|
Based on 445,680,673 shares of common stock outstanding at 30 April 2015 (all of which are subject to CUFS), no Senior
Executive Officer beneficially owned 1% or more of our outstanding shares of common stock of the Company at 30 April 2015. None of the shares held by Senior Executive Officers have any special voting rights.
Stock Ownership Guidelines
The Remuneration Committee believes
that Senior Executive Officers should hold a meaningful level of James Hardie stock to further align their interests with those of our shareholders. We have adopted stock ownership guidelines for the CEO and other Senior Executive Officers,
respectively, which require them to accumulate holdings of three times and one times their base salary in James Hardie stock over a period of five years from the effective date of the guidelines (1 April 2009) or the date the Senior Executive
Officer first becomes subject to the applicable guideline.
Until the stock ownership guidelines have been met, Senior Executive Officers are required to
retain at least 75% of shares obtained under our LTI Plans (net of taxes and other costs). Once Senior Executive Officers have met or exceeded their stock ownership guidelines, they are required to retain at least 25% of shares issued under our LTI
Plans through the vesting of RSUs (net of taxes and other costs) for a period of two years (by way of a holding lock), after which time those shares can be sold (provided the Senior Executive Officer remains at or above the stock ownership
guideline).
The CEO’s holdings have exceeded the stock ownership guidelines for some years.
Details of our policy regarding employees hedging James Hardie shares or grants under various equity incentive plans are set out in the “Insider Trading”
section of the Corporate Governance Report in our 2015 Annual Report.
Loans
We did not grant loans to Senior Executive Officers during fiscal year 2015. There are no loans outstanding to Senior Executive Officers.
16
EMPLOYMENT AND SEVERANCE ARRANGEMENTS
Other than the employment agreements for Messrs Gries and Fisher and the severance arrangement with Mr Marsh discussed below, we do not maintain employment or
severance arrangements with members of our executive team. All executive team members are at-will employees and may be terminated at any time and for any reason. Other than for Messrs Gries, Marsh and Fisher, no other termination payments are
payable, except as required under the terms of the applicable STI or LTI Plans.
Employment Agreement with Louis Gries
Below is a summary of the key terms of Mr Gries’ current employment agreement:
| ¡ |
|
Executive Employment Agreement renewed effective as of 14 October 2010 providing for service as Chief Executive Officer. |
| ¡ |
|
Mr Gries is an employee-at-will and either he or the Company may terminate his employment at any time for any reason. |
| ¡ |
|
Base salary at an initial annual rate of US$950,000, subject to annual review and approval by Remuneration Committee. |
| ¡ |
|
Participation in the Company’s annual STI and LTI Plans, with a minimum STI target of 100% of his annual base salary, as established by the Company’s Board of Directors. |
| ¡ |
|
Participation in the Company’s benefit, health and welfare plans and certain fringe benefits made generally available to Senior Executive Officers in accordance with his agreement and Company policies.
|
| ¡ |
|
Provisions concerning consequences of termination of employment under specified circumstances, including: (i) termination by the Company for cause; (ii) termination by reason of death or disability;
(iii) retirement; (iv) termination by the Company without cause or by Mr Gries with good reason; or (v) termination by Mr Gries without good reason. |
| ¡ |
|
In the event that Mr Gries’ employment is terminated by the Company for any reason other than for cause, or if Mr Gries voluntarily terminates his employment for good reason, the Company shall pay to Mr Gries, in
addition to any compensation or reimbursements he would otherwise be entitled to up to the date of termination: (i) an amount equal to 150% of his then current base salary; (ii) an amount equal to 150% of his average annual STI bonus
actually paid, calculated based on the three full fiscal years immediately preceding the year of termination; (iii) his prorated bonus; (iv) no pro rata forfeiture of his unvested RSUs/Scorecard LTI – these will vest in accordance
with the terms and timing of the specific grants; and (v) continuation of health and medical benefits at the Company’s expense for the duration of the consultation agreement referenced below, provided that Mr Gries signs the Company’s
release of claims without revocation and has been and continues to remain in compliance with his confidentiality and non-compete obligations as set forth in his agreement. |
| ¡ |
|
In the event of Mr Gries’ retirement after the age of 65, or prior to age 65 with the approval of the Board of Directors, his then unvested RSUs and awards will not be forfeited and will be held through the
applicable testing periods. |
| ¡ |
|
In the event that Mr Gries’ employment is terminated for any reason other than by the Company for cause or due to his death, in addition to any severance payment he may be entitled to as set forth above, the
Company and Mr Gries each agree to enter into a consulting arrangement for a minimum of two years, as long as Mr Gries adheres to certain non-competition and confidentiality provisions and executes a release of claims without revocation following
the effective date of termination. Under the consulting agreement, Mr Gries will receive his annual target STI bonus and annual base salary in exchange for his consulting services and non-compete.
|
Employment Agreement with Mark Fisher
Below is a summary of the key terms of Mr Fisher’s current employment agreement:
| ¡ |
|
Executive Employment Agreement effective as of 31 March 2006. |
| ¡ |
|
Mr Fisher is an employee-at-will and either he or the Company may terminate his employment at any time or for any reason. |
| ¡ |
|
Base salary subject to annual review and approval by Remuneration Committee. |
| ¡ |
|
Participation in the Company’s annual STI and LTI Plans, as established by the Company’s Board of Directors. |
| ¡ |
|
Participation in the Company’s benefit, health and welfare plans and certain fringe benefits made generally available to Senior Executive Officers in accordance with Company policies. |
| ¡ |
|
Provisions concerning consequences of termination of employment under specified circumstances, including: (i) termination by the Company for cause; (ii) termination by reason of death or disability;
(iii) termination by the Company without cause or by Mr Fisher with good reason; or (iv) termination by Mr Fisher without good reason. |
| ¡ |
|
In the event that Mr Fisher’s employment is terminated by the Company for any reason other than for cause or due to his death, or if Mr Fisher voluntarily terminates his employment for good reason, in addition to
any compensation or reimbursements he would otherwise be entitled to up to the date of termination, the Company and Mr Fisher each agree to enter into a consulting arrangement for a minimum of two years, as long as Mr Fisher adheres to certain
non-competition and confidentiality provisions and executes a release of claims following the effective date of termination. Under the consulting agreement, Mr Fisher will receive his annual base salary as of the termination date for each year in
exchange for his consulting services and non-compete. |
Severance Arrangement with Matt Marsh
In connection with his retention as Chief Financial Officer in June 2013, we agreed that in the event the Company terminates Mr Marsh during his first two years of
employment (24 June 2013 through 24 June 2015) for any reason other than for cause, or if Mr Marsh terminates his employment for good reason, the Company agrees to pay Mr Marsh his then annual base salary and annual target STI bonus, provided
that he signs and complies with (i) a resignation letter resigning from all office and director positions held at the time; and (ii) a general release of claims following the effective date of termination.
REMUNERATION FOR NON-EXECUTIVE DIRECTORS
Fees paid to non-executive directors are determined by the Board of Directors, with the advice of the Remuneration Committee’s independent remuneration
advisers, within the maximum total amount of base and committee fees pool approved by shareholders from time-to-time. Shareholders at the 2014 AGM approved the current maximum aggregate base and committee fee pool of US$2.3 million per annum. No
additional Board fees are paid to executive directors.
Remuneration Structure
Non-executive directors are paid a base fee for service on the Board of Directors. Additional fees are paid to the person occupying the positions of Chairman,
Deputy Chairman and Board Committee Chairman, as well as for attendance at ad-hoc sub-committee meetings.
During fiscal year 2015, the Remuneration Committee
reviewed non-executive directors’ fees, using market data and taking into consideration the level of fees paid to chairmen and directors
|
|
|
| JAMES HARDIE
REMUNERATION REPORT 2015 |
|
17 |
of companies with similar size, complexity of operations and responsibilities and workload requirements. In addition,
an allowance is considered for the reduction in net of tax remuneration for US domiciled directors as a result of the Company’s re-domicile from the Netherlands to Ireland. The Remuneration Committee recommended an increase in non-executive
director fees for calendar year 2015 and fee increases are effective from the start of the calendar year. The annual fee adjustments when calculated on a fiscal year basis include a 1.9% increase in base fees, and a tax equalization adjustment
allowance for the US domiciled chairman, audit committee chair and remuneration committee chair of 6.7%, collectively.
|
|
|
|
|
|
|
|
|
| POSITION |
|
FISCAL YEAR
2015 (US$) |
|
|
FISCAL YEAR
2016 (US$) |
|
| Chairman |
|
|
459,754 |
|
|
|
485,837 |
|
| Deputy Chairman |
|
|
217,335 |
|
|
|
221,385 |
|
| Board member |
|
|
161,449 |
|
|
|
164,457 |
|
| Audit Committee Chair |
|
|
73,750 |
|
|
|
85,000 |
|
| Remuneration Committee Chair |
|
|
73,750 |
|
|
|
85,000 |
|
| N&GC Committee Chair |
|
|
20,000 |
|
|
|
20,000 |
|
| Ad-hoc Board sub-committee
attendance(1) |
|
|
3,000 |
|
|
|
3,000 |
|
| (1) |
Fee is payable in respect of each ad-hoc Board sub-committee attended. |
As the focus of the Board of Directors is
on maintaining the Company’s long-term direction and well-being, there is no direct link between non-executive directors’ remuneration and the Company’s short-term results.
Board Accumulation Policy
Non-executive directors are expected
to accumulate a minimum of 1.5 times (and two times for the Chairman) their total base remuneration (excluding Board Committee fees) in James Hardie shares of common stock (either personally, in the name of their spouse, or through a personal
superannuation or pension plan) over a reasonable time following their appointment. The Remuneration Committee monitors non-executive directors’ progress against this policy on a periodic basis.
Director Retirement Benefits
We do not provide any benefits for
non-executive directors upon termination of their service on the Board.
Total Remuneration for Non-Executive Directors for the Years Ended 31 March
2015 and 2014
The table below sets out the remuneration for those non-executive directors who served on the Board of Directors during the fiscal years
ended 31 March 2015 and 31 March 2014:
|
|
|
|
|
|
|
|
|
|
|
|
|
|
|
|
|
| (US$) |
|
PRIMARY |
|
|
|
|
|
|
|
|
|
|
| NAME |
|
DIRECTORS’
FEES(1) |
|
|
OTHER
PAYMENTS(2) |
|
|
OTHER
BENEFITS(3) |
|
|
TOTAL |
|
| M Hammes |
|
|
|
|
|
|
|
|
|
|
|
|
|
|
|
|
| Fiscal Year 2015 |
|
|
468,754 |
|
|
|
– |
|
|
|
15,715 |
|
|
|
484,469 |
|
| Fiscal Year 2014 |
|
|
394,779 |
|
|
|
122,958 |
|
|
|
24,761 |
|
|
|
542,498 |
|
| D McGauchie |
|
|
|
|
|
|
|
|
|
|
|
|
|
|
|
|
| Fiscal Year 2015 |
|
|
237,335 |
|
|
|
– |
|
|
|
23,444 |
|
|
|
260,779 |
|
| Fiscal Year 2014 |
|
|
222,255 |
|
|
|
– |
|
|
|
18,711 |
|
|
|
240,966 |
|
| B Anderson |
|
|
|
|
|
|
|
|
|
|
|
|
|
|
|
|
| Fiscal Year 2015 |
|
|
238,199 |
|
|
|
– |
|
|
|
– |
|
|
|
238,199 |
|
| Fiscal Year 2014 |
|
|
195,818 |
|
|
|
79,770 |
|
|
|
– |
|
|
|
275,588 |
|
| D Harrison |
|
|
|
|
|
|
|
|
|
|
|
|
|
|
|
|
| Fiscal Year 2015 |
|
|
235,199 |
|
|
|
– |
|
|
|
11,991 |
|
|
|
247,190 |
|
| Fiscal Year 2014 |
|
|
188,318 |
|
|
|
81,821 |
|
|
|
– |
|
|
|
270,139 |
|
| A Littley |
|
|
|
|
|
|
|
|
|
|
|
|
|
|
|
|
| Fiscal Year 2015 |
|
|
167,449 |
|
|
|
– |
|
|
|
– |
|
|
|
167,449 |
|
| Fiscal Year 2014 |
|
|
155,818 |
|
|
|
– |
|
|
|
547 |
|
|
|
156,365 |
|
| J Osborne |
|
|
|
|
|
|
|
|
|
|
|
|
|
|
|
|
| Fiscal Year 2015 |
|
|
170,449 |
|
|
|
– |
|
|
|
– |
|
|
|
170,449 |
|
| Fiscal Year 2014 |
|
|
155,818 |
|
|
|
– |
|
|
|
– |
|
|
|
155,818 |
|
| R Van Der Meer |
|
|
|
|
|
|
|
|
|
|
|
|
|
|
|
|
| Fiscal Year 2015 |
|
|
161,449 |
|
|
|
– |
|
|
|
– |
|
|
|
161,449 |
|
| Fiscal Year 2014 |
|
|
155,818 |
|
|
|
– |
|
|
|
– |
|
|
|
155,818 |
|
| R Chenu(4) |
|
|
|
|
|
|
|
|
|
|
|
|
|
|
|
|
| Fiscal Year 2015 |
|
|
101,717 |
|
|
|
– |
|
|
|
22,879 |
|
|
|
124,596 |
|
| Fiscal Year 2014 |
|
|
N/A |
|
|
|
N/A |
|
|
|
N/A |
|
|
|
N/A |
|
| A Gisle Joosen(5) |
|
|
|
|
|
|
|
|
|
|
|
|
|
|
|
|
| Fiscal Year 2015 |
|
|
5,363 |
|
|
|
– |
|
|
|
– |
|
|
|
5,363 |
|
| Fiscal Year 2014 |
|
|
N/A |
|
|
|
N/A |
|
|
|
N/A |
|
|
|
N/A |
|
| TOTAL COMPENSATION FOR NON-EXECUTIVE DIRECTORS |
|
|
|
|
|
|
|
|
|
|
|
|
|
|
|
|
| Fiscal Year 2015 |
|
|
1,785,914 |
|
|
|
– |
|
|
|
74,029 |
|
|
|
1,859,943 |
|
| Fiscal Year 2014 |
|
|
1,468,624 |
|
|
|
284,549 |
|
|
|
44,019 |
|
|
|
1,797,192 |
|
18
| (1) |
Amount includes base, Chairman, Deputy Chairman, Committee Chairman fees, as well as fees for attendance at ad-hoc Board sub-committee meetings. |
| (2) |
Amount relates to a one-off payment to partially compensate non-executive directors who have received a reduction in net compensation following the Company’s re-domicile from the Netherlands to Ireland. The impact
of the re-domicile meant that US based non-executive directors incurred an increased income tax burden since the Irish tax rate is significantly higher than the US tax rate. The Board deferred consideration of a ‘tax equalization measure’
for the affected non-executive directors until (i) it fully understood the tax implications for the affected directors, and (ii) there was a clear improvement in the US housing market and business results began to improve.
|
| (3) |
Amount includes the cost of non-executive directors’ fiscal compliance in Ireland and other costs connected with Board-related events paid by the Company. In addition to these costs, travel and subsistence expenses
incurred by non-executive directors in attending board meetings held in Ireland which are paid or reimbursed by the Company have, pursuant to a direction from the Irish Revenue Commissioners effective from February 2014, been grossed up and
subjected to Irish income taxes. The aggregate cost to the Company including income taxes, for these costs in fiscal year 2015 was US$447,355. |
| (4) |
Elected to the Board on 15 August 2014. In addition to the compensation set forth above, Mr Chenu continues to receive certain financial planning and tax services from the Company, and remains eligible for certain
tax equalization benefits relative to the vesting of previously granted equity awards, stemming from his prior service as an executive officer of the Company. |
| (5) |
Appointed to the Board on 20 March 2015. |
Director Remuneration for the years ended 31 March 2015
and 2014
For Irish reporting purposes, the breakdown of director’s remuneration between managerial services (which only relate to Mr Gries) and
director services is:
|
|
|
|
|
|
|
|
|
| |
|
YEARS ENDED 31 MARCH |
|
| |
|
2015
(US$) |
|
|
2014
(US$) |
|
| Managerial Services(1) |
|
|
11,577,188 |
|
|
|
11,491,771 |
|
| Director Services(2) |
|
|
2,468,747 |
|
|
|
2,021,215 |
|
| |
|
|
14,045,935 |
|
|
|
13,512,986 |
|
| (1) |
Includes cash payments, non-cash benefits (examples include medical and life insurance benefits, car allowances, membership in executive wellness programs, financial planning and tax services), 401(k) benefits, and
amounts expensed for outstanding equity awards for L Gries. |
| (2) |
Includes compensation for all non-executive directors, which includes base, Chairman, Deputy Chairman, Committee Chairman and cost of non-employee directors’ fiscal compliance in Ireland, other costs connected with
Board-related events paid for by the Company, travel and subsistence expenses incurred by non-executive directors in attending board meetings held in Ireland paid or reimbursed by the Company which have, pursuant to a direction from the Irish
Revenue Commissioners effective from February 2014, been grossed up and subjected to Irish income taxes and a proportion of the CEO’s remuneration paid as fees for his service on the JHI plc Board in fiscal years 2015 and 2014.
|
Non-Executive Directors’ Interests in James Hardie
Non-executive directors’ relevant interests in our securities at 30 April 2015 and 30 April 2014 were:
|
|
|
|
|
|
|
|
|
| |
|
CUFS AT
30 APRIL 2015 |
|
|
CUFS AT
30 APRIL 2014 |
|
| M Hammes(1) |
|
|
40,462 |
|
|
|
38,444 |
|
| D McGauchie(2) |
|
|
20,372 |
|
|
|
20,372 |
|
| B Anderson(3) |
|
|
16,995 |
|
|
|
15,195 |
|
| R Chenu(4) |
|
|
156,306 |
|
|
|
– |
|
| A Gisle Joosen(5) |
|
|
– |
|
|
|
– |
|
| D Harrison(6) |
|
|
17,184 |
|
|
|
14,934 |
|
| A Littley |
|
|
– |
|
|
|
– |
|
| J Osborne(7) |
|
|
11,951 |
|
|
|
2,551 |
|
| R Van Der Meer |
|
|
17,290 |
|
|
|
17,290 |
|
| (1) |
31,462 CUFS held in the name of Mr and Mrs Hammes and 9,000 CUFS held as American Depositary Shares (“ADSs”) in the name of Mr and Mrs Hammes. |
| (2) |
6,000 CUFS held for the McGauchie Superannuation Fund for which Mr McGauchie is a trustee and beneficiary. |
| (3) |
7,635 CUFS held in the name of Mr Anderson, 390 CUFS held as ADSs in the name of Mr Anderson and 8,970 CUFS held as ADSs in the name of Mr and Mrs Anderson. |
| (4) |
Elected to the Board on 15 August 2014. In addition, Mr Chenu holds 91,767 RSUs as of 30 April 2015, over which he has no voting or investment control. These RSUs were previously granted to Mr Chenu during the
term of his prior service as an executive officer of the Company. The vesting of these RSUs remains subject to the achievement of applicable performance criteria, as set forth under the terms of the applicable award agreement. |
| (5) |
Joined the Board on 20 March 2015. |
| (6) |
2,384 CUFS held in the name of Mr Harrison, 1,000 CUFS held as ADSs in the name of Mr Harrison and 13,800 CUFS held in the name of Mr and Mrs Harrison. |
| (7) |
2,551 CUFS held in the name of Mr Osborne and 9,400 CUFS held in the name of Aurum Nominees Limited and held on behalf of Mr Osborne as beneficial owner. |
Based on 445,680,673 shares of common stock outstanding at 30 April 2015 (all of which are subject to CUFS), no director beneficially owned 1% or more of the
outstanding shares of the Company at 30 April 2015. None of the shares held by directors have any special voting rights.
MORE
DETAILED INFORMATION ABOUT EQUITY GRANTS
More detailed information about our equity grants and equity plans can be found in our 2015 Annual Report
in both the Remuneration section as well as Note 16 to our consolidated financial statements.
|
|
|
| JAMES HARDIE
REMUNERATION REPORT 2015 |
|
19 |