 INVESTOR
PRESENTATION SEPTEMBER 2015
Exhibit 99.3 |
| INVESTOR
PRESENTATION SEPTEMBER 2015
Exhibit 99.3 |
 PAGE DISCLAIMER FORWARD-LOOKING STATEMENTS This Investor Presentation contains forward-looking statements. James Hardie Industries plc (the “company”) may from time to time
make forward-looking statements in its periodic reports filed with or
furnished to the Securities and Exchange Commission, on Forms 20-F and 6-K, in its annual reports to shareholders, in offering circulars, invitation memoranda and prospectuses, in media releases and other written materials and in oral statements made by the company’s officers, directors or employees to
analysts, institutional investors, existing and potential lenders,
representatives of the media and others. Statements that are not historical facts are forward-looking statements and such forward-looking statements are statements made pursuant to the Safe Harbor Provisions of the Private Securities Litigation Reform Act of 1995.
Examples of forward-looking statements include:
• statements about the company’s future performance; • projections of the company’s results of operations or financial condition; • statements regarding the company’s plans, objectives or goals, including those relating to strategies, initiatives, competition, acquisitions, dispositions and/or its products; • expectations concerning the costs associated with the suspension or closure of operations at any of the company’s plants and future plans
with respect to any such plants; •
expectations concerning the costs associated with the significant capital expenditure projects at any of the company’s plants and future plans with respect to any such projects; • expectations regarding the extension or renewal of the company’s credit facilities including changes to terms, covenants or
ratios; •
expectations concerning dividend payments and share buy-backs;
• statements concerning the company’s corporate and tax domiciles and structures and potential changes to them, including potential tax
charges; •
statements regarding tax liabilities and related audits, reviews and
proceedings; •
expectations about the timing and amount of contributions to Asbestos Injuries
Compensation Fund (AICF), a special purpose fund for the compensation of proven Australian asbestos-related personal injury and death claims; • expectations concerning indemnification obligations; • expectations concerning the adequacy of the company’s warranty provisions and estimates for future warranty-related costs;
• statements regarding the company’s ability to manage legal and regulatory matters (including but not limited to product liability,
environmental, intellectual property and competition law matters) and to
resolve any such pending legal and regulatory matters within current estimates and in anticipation of certain third-party recoveries; and • statements about economic conditions, such as changes in the US economic or housing recovery or changes in the market conditions in the Asia Pacific region, the levels of new home construction and home renovations, unemployment levels, changes in consumer income, changes or stability in housing values, the availability of mortgages and other financing, mortgage and other interest rates, housing affordability and supply, the levels of foreclosures and home resales, currency exchange rates, and builder and consumer confidence. 2 |
 PAGE DISCLAIMER (continued) Words such as “believe,” “anticipate,” “plan,” “expect,” “intend,” “target,”
“estimate,” “project,” “predict,” “forecast,” “guideline,” “aim,” “will,” “should,” “likely,” “continue,” “may,” “objective,”
“outlook” and similar expressions are intended to identify
forward-looking statements but are not the exclusive means of identifying such statements. Readers are cautioned not to place undue reliance on these forward-looking statements and all such forward-looking statements are qualified in their entirety by reference
to the following cautionary statements. Forward-looking
statements are based on the company’s current expectations, estimates and assumptions and because forward-looking statements address future results, events and conditions, they, by their very nature, involve inherent risks and uncertainties, many of which are unforeseeable and beyond the company’s control. Such known and unknown risks, uncertainties and other factors may cause actual results, performance or other achievements to differ materially from the anticipated results, performance or achievements expressed, projected or implied by these forward-looking statements. These factors, some of which are discussed under “Risk Factors” in Section 3 of the Form 20-F filed with the Securities and Exchange Commission on 21 May 2015, include, but are not limited to: all matters relating to or arising out of the prior manufacture of products that contained asbestos by current and former company subsidiaries; required contributions to AICF, any shortfall in AICF and the effect of currency exchange rate movements on the amount recorded in the company’s financial statements as an asbestos liability; governmental loan facility to AICF; compliance with and changes in tax laws and treatments; competition and product pricing in the markets in which the company operates; the consequences of product failures or defects; exposure to environmental, asbestos, putative consumer class action or other legal proceedings; general economic and market conditions; the supply and cost of raw materials; possible increases in competition and the potential that competitors could copy the company’s products; reliance on a small number of customers; a customer’s inability to pay; compliance with and changes in environmental and health and safety laws; risks of conducting business internationally; compliance with and changes in laws and regulations; the effect of the transfer of the company’s corporate domicile from the Netherlands to Ireland, including changes in corporate governance and any potential tax benefits related thereto; currency exchange risks; dependence on customer preference and the concentration of the company’s customer base on large format retail customers, distributors and dealers; dependence on residential and commercial construction markets; the effect of adverse changes in climate or weather patterns; possible inability to renew credit facilities on terms favorable to the company, or at all; acquisition or sale of businesses and business segments; changes in the company’s key management personnel; inherent limitations on internal controls; use of accounting estimates; and all other risks identified in the company’s reports filed with Australian, Irish and US securities regulatory agencies and exchanges (as appropriate). The company cautions you that the foregoing list of factors is not exhaustive and that other risks and uncertainties may cause actual results to differ materially from those referenced in the company’s forward-looking statements. Forward-looking statements speak only as of the date they are made and are statements of the company’s current expectations concerning future results, events and conditions. The company assumes no obligation to update any forward-looking statements or information except as required by law. 3 |
 PAGE AGENDA • Global Strategy and Business Overview • USA & Europe Fiber Cement • Asia Pacific Fiber Cement • Capital Management Framework • Guidance • Appendix 4 In this Investor Presentation, the company may present financial measures, sales volume terms, financial ratios, and Non-US GAAP financial measures included in the Definitions and other terms section of this document. The company presents financial measures that it believes are customarily used by its Australian investors. Specifically, these financial measures, which are equivalent to or derived from certain US GAAP measures as explained in the definitions, include “EBIT”, “EBIT margin”, “Operating profit before income taxes” and “Net operating profit”. The company may also present other terms for measuring its sales volume (“million square feet” or “mmsf” and “thousand square feet” or “msf”); financial ratios (“Gearing ratio”, “Net interest expense cover”, “Net interest paid cover”, “Net debt payback”, “Net debt (cash)”); and Non-US GAAP financial measures (“Adjusted EBIT”, “Adjusted EBIT margin”, “Adjusted net operating profit”, “Adjusted diluted earnings per share”, “Adjusted operating profit before income taxes”, “Adjusted effective tax rate on earnings”, “Adjusted EBITDA”, and “Adjusted selling, general and administrative expenses”. Unless otherwise stated, results and comparisons are of the first quarter of the current fiscal year versus the first quarter of the prior fiscal year |
 PAGE Industry Leadership and Profitable Growth • Introduce differentiated products to deliver a sustainable competitive advantage • Aggressively grow demand for our products in targeted market segments 5 GLOBAL STRATEGY |
 PAGE • Annual net sales US$1.7b • Total assets US$2.1b • Strong cash generation • Operations in North America, Asia Pacific and Europe • 3,208 employees • Market cap US$5.9b (approx) • S&P/ASX 100 company • NYSE ADR listing Market capitalization as at 20 August 2015. Total assets as at 30 June 2015 and employees as at 31 March 2015. Annual net sales for three months
to 30 June 2015 annualised. Total assets exclude asbestos
compensation A GROWTH FOCUSED COMPANY
6 |
 PAGE GROUP OVERVIEW – 1 ST QUARTER FY16 RESULTS 7 Q1'16 Q1'15 Change Adjusted EBIT (US$ millions) 89.7 71.2 26% Adjusted EBIT Margin % 20.9% 17.1% 3.8 pts Adjusted Net Operating Profit (US$ millions) 63.5 50.1 27% Net operating cash flow (US$ million) 55.1 42.5 30% Adjusted Diluted EPS (US cents) 14 11 27% Three Months Ended 30 June |
 PAGE • Group net sales increased 3% for the quarter compared to pcp 1 • Group adjusted net operating profit increased 27% to US$63.5 million for the quarter, compared to pcp 1 • Higher volumes and average net sales price across our USA and Europe and Asia Pacific Fiber Cement segments • Results are largely driven by lower production costs due to the continued focus on operating performance and lower input costs of our USA and European Fiber Cement segment • Our current quarter USA and Europe Fiber Cement segment EBIT margin is 26.6% compared to 21.2% in the pcp, above our target range of 20% to 25% • Subsequent to period end, approximately 1.7 million shares were repurchased, at an aggregate cost of US$22.5 million, under the previously announced share buyback program • We started up our sheet machine as part of the previously announced Carole Park capacity expansion project in the quarter, and that project remains on track KEY THEMES – 1 ST QUARTER FY16 RESULTS 8 1 Prior corresponding period |
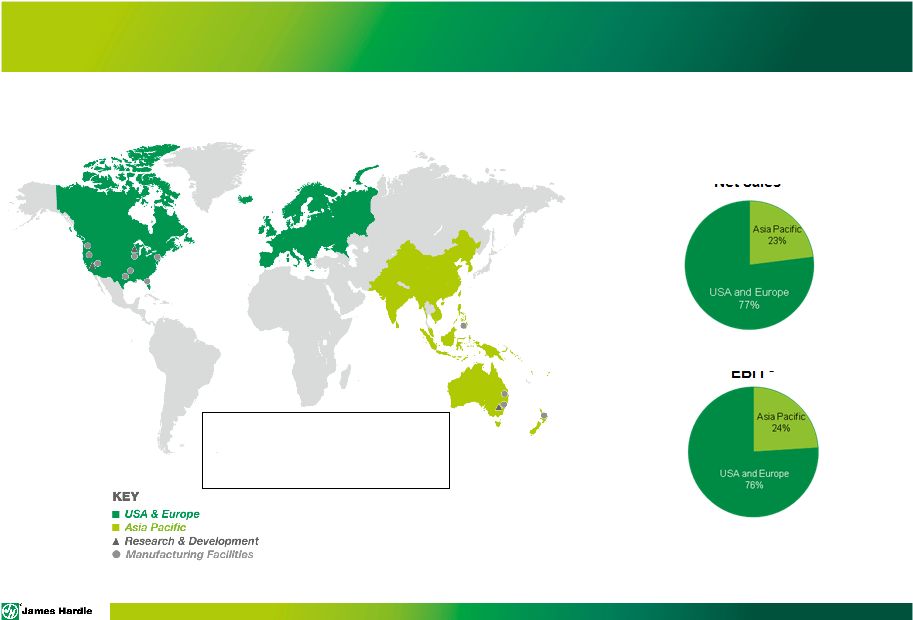 PAGE 9 WORLD LEADER IN FIBER CEMENT Geographic Mix¹ Net Sales EBIT ² 1 All percentages and numbers are for the full year ended 31 March 2015 ² EBIT – excludes research and development, asbestos-related expenses and adjustments and New Zealand weathertightness claims
USA and Europe 76% Employees¹ • 2,267 in USA and Europe • 941 in Asia Pacific |
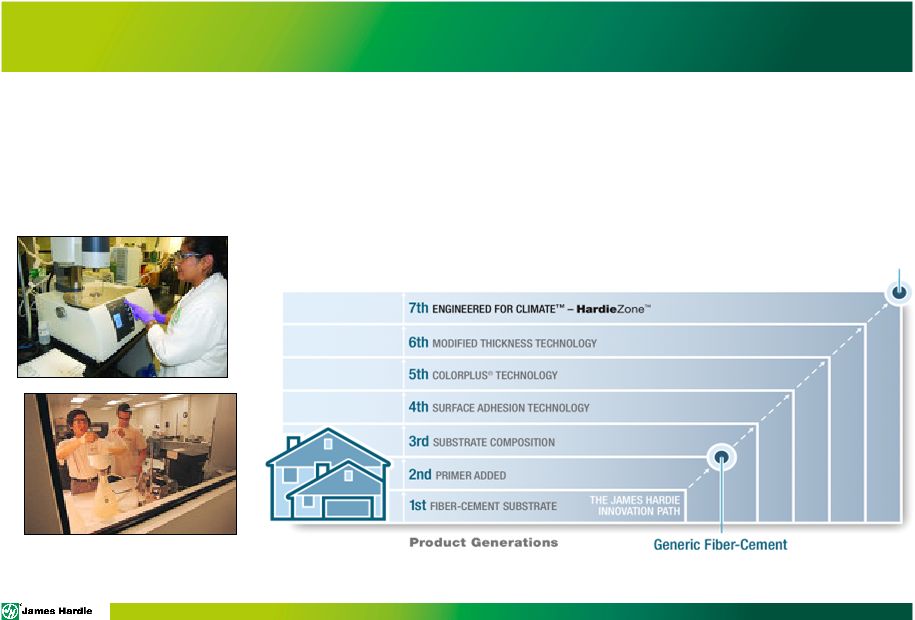 PAGE Research & Development: Significant and consistent investment
• US$31.7m spent on Research & Development in FY15 • US$394.8m spent on Research & Development since 2000 10 CREATING A SUSTAINABLE AND DIFFERENTIATED ADVANTAGE History of Fiber Cement Substrate Development James Hardie Siding Products |
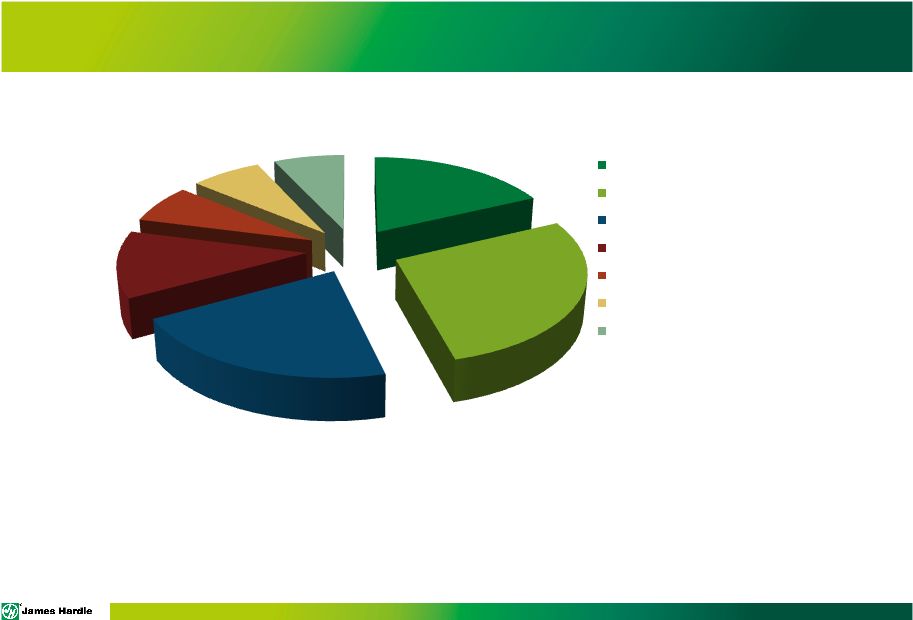 PAGE 18% 28% 21% 12% 7% 7% 7% Fiber Cement Vinyl Wood (including engineered wood) Stucco Brick Stone Other (aluminium etc) 35/90 Plan • Grow fiber cement share to 35% of the exterior cladding market against other wood-looking siding alternatives
• Maintain JHX’s category share at 90% Currently: • JHX wins ~90% of the fiber cement category, while fiber cement used in ~18% of the total market
• Current estimate is wood-look siding (Wood, Vinyl and Fiber Cement) is 60-65% of total
market. ¹Source: Internal
estimates based on NAHB product usage data adjusted for regional market intelligence DRIVING CATEGORY AND MARKET SHARE GAINS 11 North America External Cladding Share¹ |
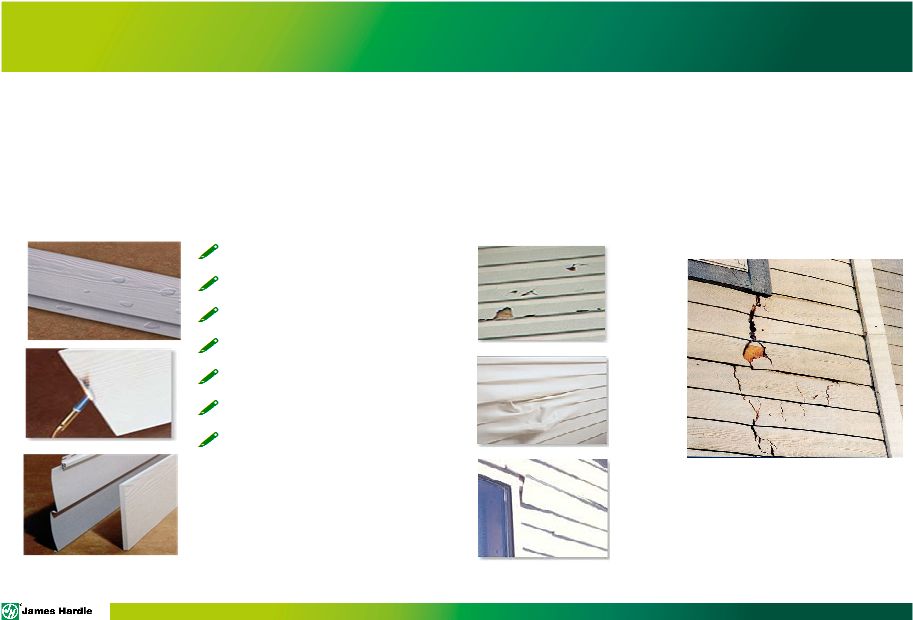 PAGE Fiber cement is more durable than wood and engineered wood, looks and performs better than vinyl, and is more cost effective and quicker to build with than brick
Fiber Cement Vinyl Engineered Wood Fire resistant Hail resistant Resists warping Resists buckling Lasting color Dimensional stability Can be repainted ? ? ? ? ? ? ? ? ? ? ? ? ? ? 12 DELIVERING SUPERIOR PRODUCT PERFORMANCE |
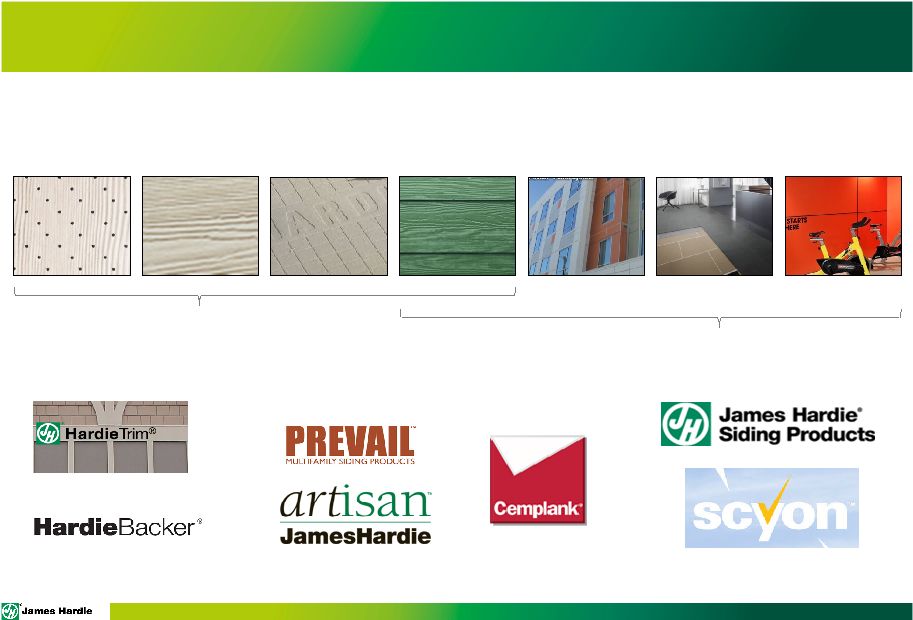 PAGE Siding Primary Products Soffit Trim / Fascia Backerboard Commercial Exteriors Flooring Interior Walls / Ceilings Brand Portfolio U.S. & Europe Asia Pacific BUILDING A PORTFOLIO OF PRODUCTS AND BRANDS 13 |
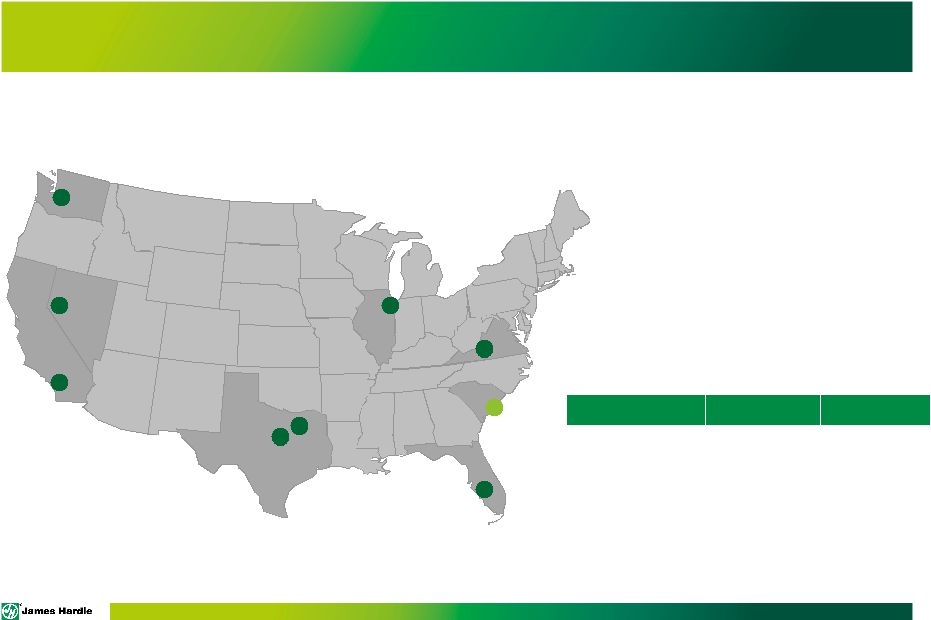 PAGE ¹ Production was suspended at the Summerville plant in November 2008 USA Plant Locations USA AND EUROPE FIBER CEMENT SEGMENT Tacoma, WA Reno, NV Fontana, CA Waxahachie, TX Cleburne, TX Summerville, SC Plant City, FL Pulaski, VA Peru, IL 14 • Largest fiber cement producer in North America • 2,267 employees • 9 manufacturing plants¹ • 2 research and development facilities Q1 FY16 Q1 FY15 Net Sales US$337.0m US$321.5m EBIT US$89.5m US$68.0m EBIT Margin (US$) 26.6% 21.2% |
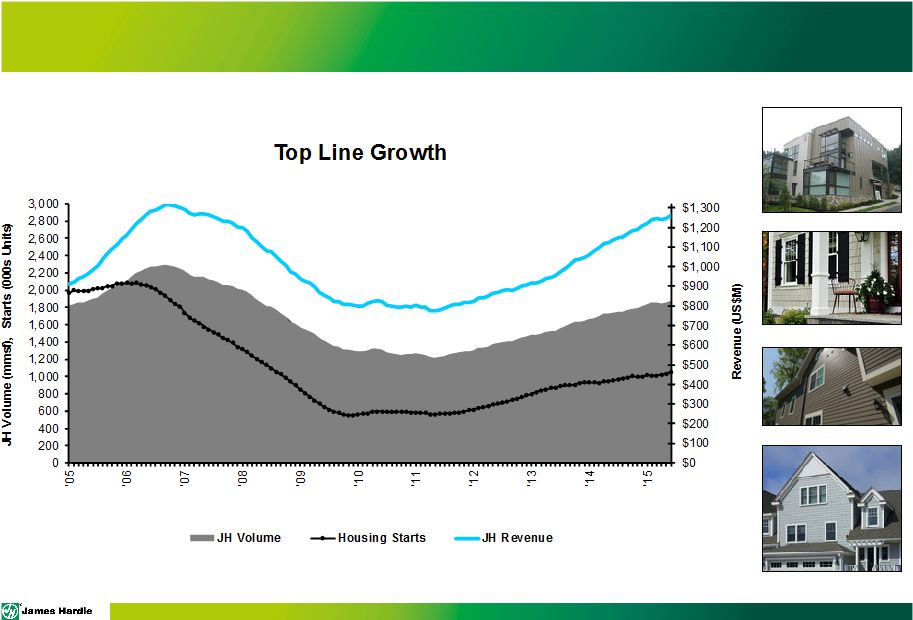 PAGE Rolling 12 month average of seasonally adjusted estimate of housing starts by US Census Bureau
AGGRESSIVELY GROWING DEMAND FOR OUR PRODUCTS
15 USA Fiber Cement |
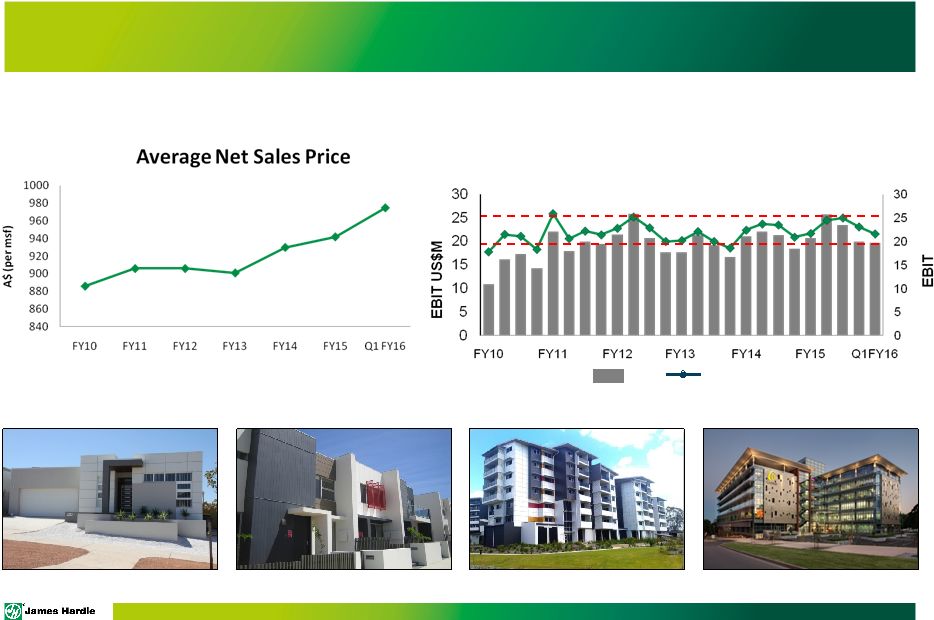
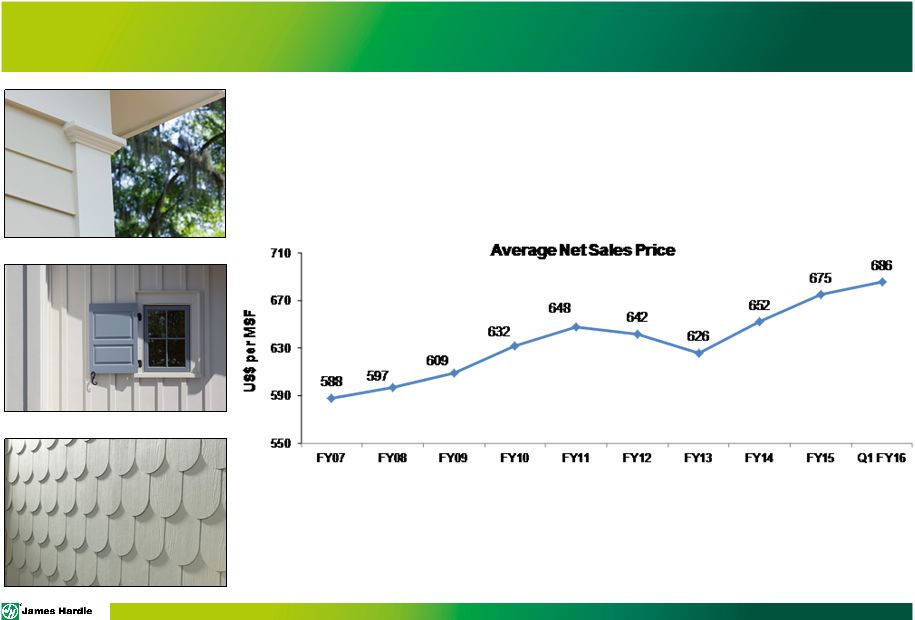 PAGE USA and Europe Fiber Cement ACHIEVING THE RIGHT VALUE FOR OUR PRODUCTS 16 |
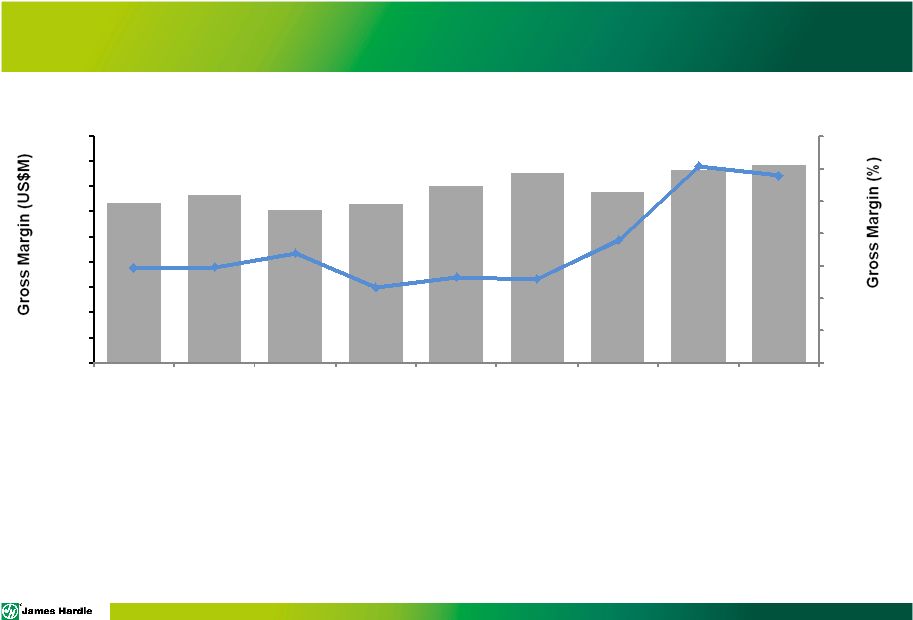
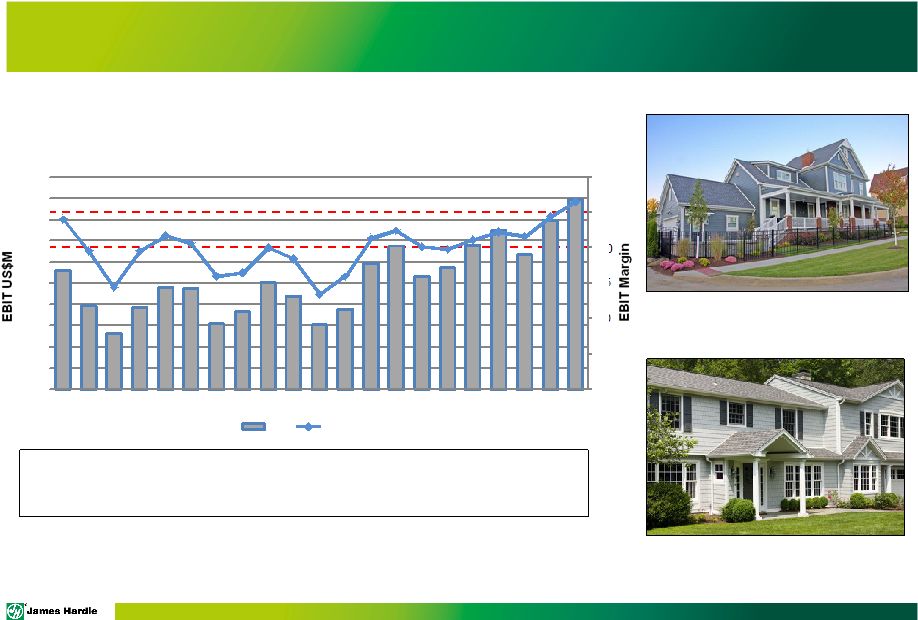 PAGE USA AND EUROPE: DELIVERING STRONG RETURNS 17 1 Excludes asset impairment charges of US$14.3 million in 4 th quarter FY12, US$5.8 million in 3 rd quarter FY13 and US$11.1 million in 4 th quarter FY13 We expect EBIT margins for fiscal year 2016 to be towards the higher end of, and may exceed our stated target range of 20% to 25% 0 5 10 15 20 25 30 0 10 20 30 40 50 60 70 80 90 100 FY11 FY12 FY13 FY14 FY15 FY16 Quarterly EBIT and EBIT Margin 1 EBIT EBIT MARGIN |
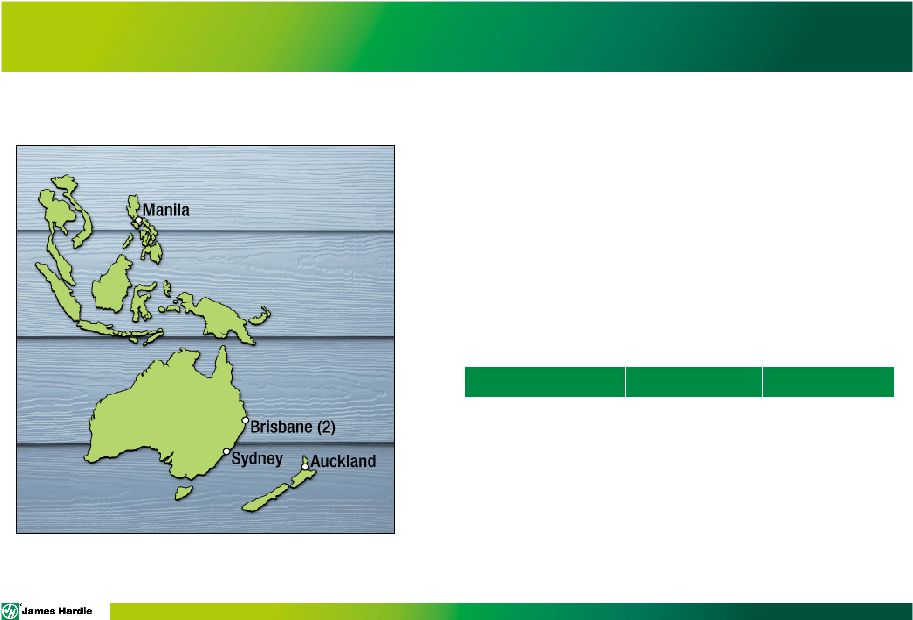 PAGE • 941 employees • 5 manufacturing plants across Australia, New Zealand and the Philippines • 1 research and development facility EBIT and EBIT margin excludes New Zealand weathertightness claims 18 ASIA PACIFIC FIBER CEMENT SEGMENT Q1 FY16 Q1 FY15 Net Sales A$117.4m A$102.2m EBIT A$25.4m A$22.1m EBIT Margin (A$) 21.6% 21.6% Asia Pacific Plant Locations |
 PAGE 1 EBIT and EBIT margin excludes New Zealand weathertightness claims Quarterly EBIT and EBIT Margin 1 EBIT EBIT Margin ASIA PACIFIC: DELIVERING STRONG RETURNS 19 Asia Pacific Fiber Cement Segment A$975 |
 PAGE Ceilings and partitions Philippines Exterior cladding Australia General purpose flooring Australia New Zealand Interior walls 20 TARGETTING THE RIGHT PRODUCT INTO THE RIGHT MARKET Asia Pacific Core Markets |
 PAGE FINANCIAL MANAGEMENT SUPPORTING GROWTH 21 1 2 3 Strong Financial Management Disciplined Capital Allocation Liquidity and Funding Strong margins and operating cash flows Strong governance and transparency Investment-grade financial management Investing in R&D and capacity expansion to support organic growth Maintain ordinary dividends within the defined payout ratio Flexibility for: • Accretive and strategic inorganic opportunities • Withstand market cycles • Consider further shareholder returns when appropriate ~$590 million of bank facilities, 68% liquidity as of Q’16 2.2 year weighted average maturity of bank facilities Completed the sale of US$325 million 8 year 5.875% senior unsecured notes Conservative leveraging of balance sheet within 1-2 times adjusted EBITDA target Financial management consistent with an investment grade credit. Ability to withstand market cycles and other unanticipated events. |
 PAGE • Management notes the range of analysts’ forecasts for net operating profit excluding asbestos for the year
ending 31 March 2016 is between US$244 million and US$286 million
• Management expects full year Adjusted net operating profit to be between US$240 million and US$270 million
assuming, among other things, housing conditions in the United States continuing to
improve in line with our assumed forecasted new construction starts,
input prices and production efficiencies remaining consistent and an
average exchange rate at or near current levels is applicable for the remainder of the year • Management cautions that although US housing activity has been improving, market conditions remain
somewhat uncertain and some input costs remain volatile
• Management is unable to forecast the comparable US GAAP financial measure due to uncertainty regarding the
impact of actuarial estimates on asbestos-related assets and liabilities in future
periods FY2016 GUIDANCE
22 |
 APPENDIX |
 PAGE FINANCIAL SUMMARY 1 Asia Pacific Fiber Cement EBIT excludes New Zealand weathertightness expense of US$0.2 million in Q1’FY16 and benefit of US$1.3 million in Q1’FY15 2 Excludes Asbestos related expenses and adjustments 24 US$ Millions Q1 '16 Q1 '15 % Change Net Sales USA and Europe Fiber Cement 337.0 $
321.5 $
5 Asia Pacific Fiber Cement 91.3 95.3 (4) Total Net Sales 428.3 $
416.8 $
3 EBIT - US$ Millions USA and Europe Fiber Cement 89.5 $
68.0 $
32 Asia Pacific Fiber Cement 1 19.7 20.7 (5) Research & Development (6.0) (6.8) 12 General Corporate 2 (13.5) (10.7) (26) Adjusted EBIT 89.7 $
71.2 $
26 Net interest expense excluding AICF interest income (6.0) (0.9) Other income (expense) 2.7 (3.7) Adjusted income tax expense (22.9) (16.5) (39) Adjusted net operating profit 63.5 $
50.1 $
27 Three Months Ended 30 June |
 PAGE 1 Excludes asbestos adjustments, AICF SG&A expenses, AICF interest income, New Zealand weathertightness claims, tax adjustments
2 Excludes asbestos adjustments, AICF SG&A expenses, New Zealand weathertightness claims
KEY RATIOS 25 3 Months FY16 3 Months FY15 3 Months FY14 EPS (Diluted) 1 (US Cents) 14c 11c 12c EBIT/ Sales (EBIT margin) 2 20.9% 17.1% 18.1% Gearing Ratio 1 20.4% (3.3)% (16.5)% Net Interest Expense Cover 2 15.0x 79.1x 84.4x Net Interest Paid Cover 2 108.5x 89.0x 67.5x Net Debt Payback 1.4yrs - - Three Months Ended 30 June |
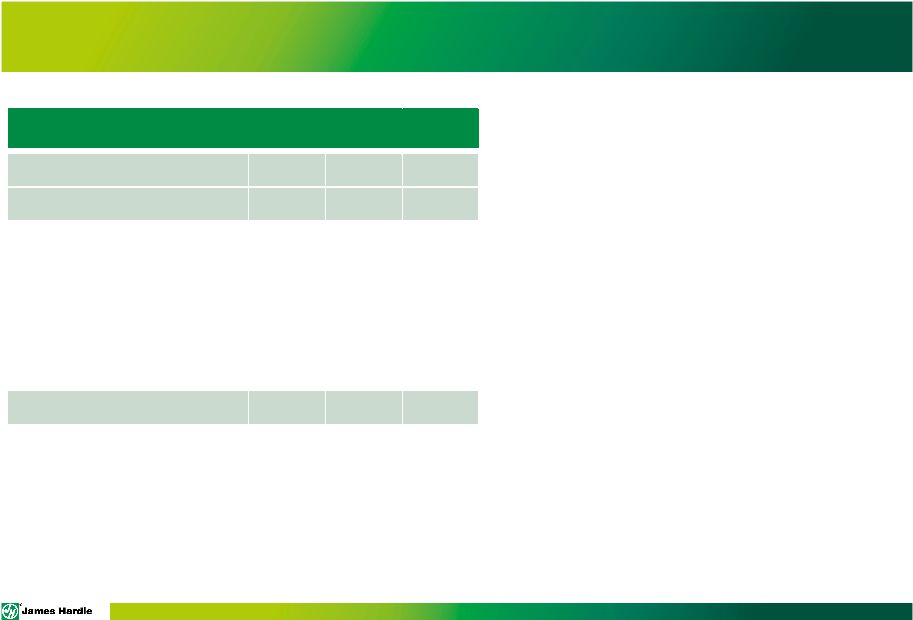
 PAGE FY11 FY12 FY13 FY14 FY15 Net Sales US$m 814 862 951 1,128 1,277 Sales Volume mmsf 1,248 1,332 1,489 1,697 1,850 Average Price US$ per msf ² 648 642 626 652 675 EBIT US$m¹ 160 163 163 237 286 EBIT Margin %¹ 20 19 17 21 22 26 1 Excludes asset impairment charges of US$14.3 million and US$16.9 million in FY12 and FY13, respectively
2 During the second quarter of FY14, the company refined its methodology for calculating average net sales price in both the USA and Europe and Asia Pacific Fiber Cement segments to exclude ancillary products that have no impact on fiber cement sales volume, which is measured and reported in mmsf. As the revenue contribution of these ancillary products has been increasing, the company believes the refined methodology provides an improved disclosure of average net sales price, in line with the company’s primary fibre cement business, which is a key segment performance indicator. The company has restated average net sales price in the prior periods to conform with the current calculation of average net sales price. USA AND EUROPE FIBER CEMENT – 5 YEAR RESULTS OVERVIEW |
 PAGE 1 During the second quarter of FY14, the company refined its methodology for calculating average net sales price in both the USA and Europe and
Asia Pacific Fiber Cement segments to exclude ancillary products that
have no impact on fiber cement sales volume, which is measured and reported in mmsf. As the revenue contribution of these ancillary products has been increasing, the company believes the refined methodology provides an improved disclosure of average net sales price, in line with the company’s primary fiber cement business, which is a key segment performance indicator. The company has restated average net sales price in the prior periods to conform with the current calculation of average net sales price. 2 Excludes New Zealand weathertightness claims of US$5.4 million , US$13.2 million , US$1.8 million and US$4.3 million in FY12, FY13, FY14 and FY15, respectively FY11 FY12 FY13 FY14 FY15 Net Sales US$m 353 376 370 366 380 Sales Volume mmsf 408 392 394 417 456 Average Price A$ per msf 1 906 906 901 930 942 EBIT US$m 2 79 86 75 83 90 EBIT Margin % 2 23 23 20 23 24 27 ASIA PACIFIC FIBER CEMENT – 5 YEAR RESULTS OVERVIEW |
 PAGE Net sales increased 3% • Higher sales volumes • Higher average net sales prices in local currencies Gross profit margin increased 320 bps • Continued performance improvement across our US plants • Lower input costs in the USA and Europe Fiber Cement segment • Higher average net sales price SG&A expenses increased • Higher stock compensation expenses due to a 14% appreciation in our stock price • Higher discretionary expenses and realized losses on foreign currency transactions caused by the strengthening of the US dollar • Partially offset by lower SG&A expenses in the business units Non-operating expenses • Interest expense increased related to our debt position • Other income (expense) includes: gain on the sale of the Australian pipes business and favorable unrealized foreign exchange gains and interest rate swaps • Income tax expense increased primarily driven by the increase in operating income RESULTS FOR THE 1 st FY16 QUARTER 28 US$ Millions Q1 '16 Q1 '15 % Change Net sales 428.3 416.8 3 Gross profit 157.6 140.2 12 SG&A expenses (61.5) (59.9) (3) Research & development expenses (7.1) (8.4) 15 Asbestos adjustments (4.5) (21.5) 79 EBIT 84.5 50.4 68 Net interest expense (5.9) (1.1) Other income (expense) 2.7 (3.7) Income tax expense (21.3) (16.7) (28) Net operating profit 60.0 28.9 Three Months Ended 30 June |
 PAGE US$ Millions Q1 '16 Q1 '15 % Change Net operating profit 60.0 28.9 Asbestos: Asbestos adjustments 4.5 21.5 (79) Other asbestos 1 0.4 0.8 (50) New Zealand weathertightness claims 0.2 (1.3) Asbestos and other tax adjustments (1.6) 0.2 Adjusted net operating profit 63.5 50.1 27 Three Months Ended 30 June 1 Includes AICF SG&A expenses and AICF interest income, net RESULTS FOR THE 1 st FY16 QUARTER (continued) 29 Asbestos adjustments • 1% change in the AUD / USD exchange rate from beginning to ending balance sheet date for the period compared to a 2% change in spot rates in the prior corresponding period Adjusted net operating profit increased 27% • 26% increase in Adjusted EBIT • A US$6.4 million increase in Adjusted income tax expense • Favorable movement in other income (expense) of US$6.4 million • Gross interest expense of US$5.7 million |
 PAGE GROSS PROFIT - GROUP 30 • Gross profit margins remain strong • Price improvements continue as we execute on pricing strategies and reduce pricing inefficiencies • Input costs for pulp and utilities are lower and plant performance remains on a positive trend line as we continue to focus on cost management and operational excellence 126.3 140.2 157.6 33.9 33.6 36.8 31.0 32.0 33.0 34.0 35.0 36.0 37.0 38.0 - 20.0 40.0 60.0 80.0 100.0 120.0 140.0 160.0 180.0 Q1 FY14 Q1 FY15 Q1 FY16 |
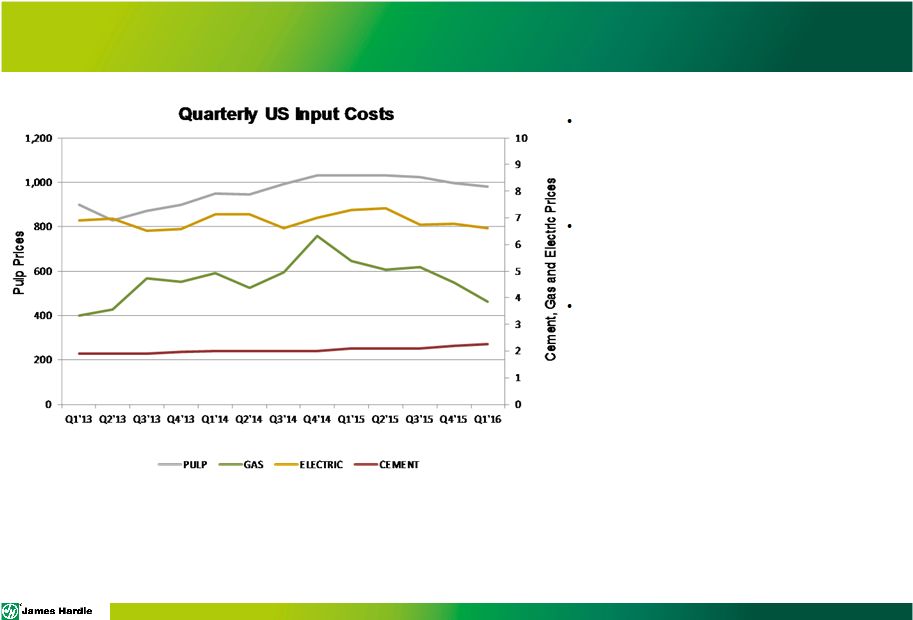 PAGE US INPUT COSTS • The price of NBSK pulp reduced by ~5% compared to pcp 1 , while cement has increased ~8% over pcp 1 • The cost of electricity for industrial users decreased from prior period • The cost of gas continued to trend down quarter over quarter 31 The information underlying the table above is sourced as follows: • Pulp – Cost per ton – from RISI • Gas – Cost per thousand cubic feet for industrial users – from US Energy Information Administration • Electric – Cost per thousand kilowatt hour for industrial users – from US Energy Information Administration • Cement – Relative index from the Bureau of Labor Statistics 1 Prior corresponding period |
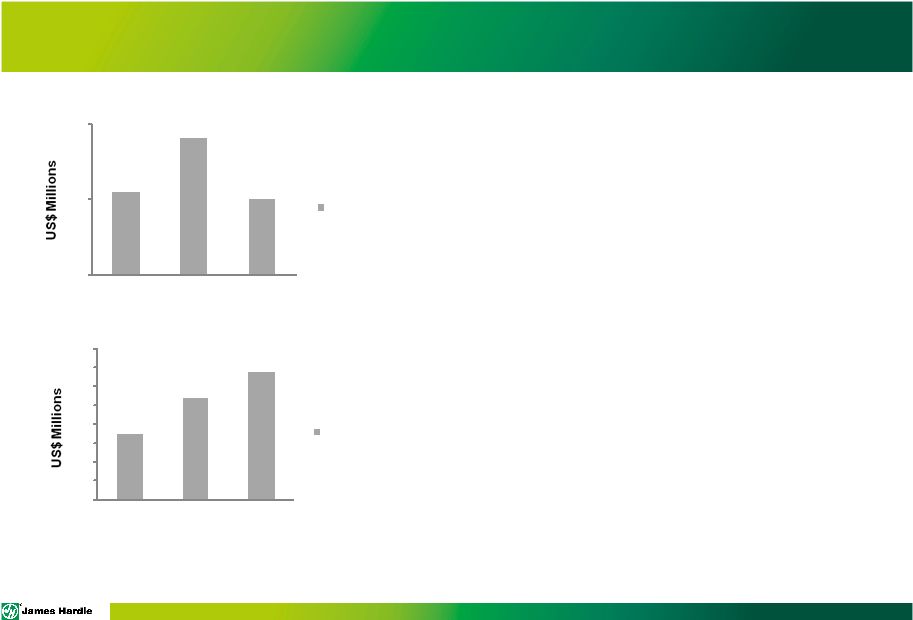
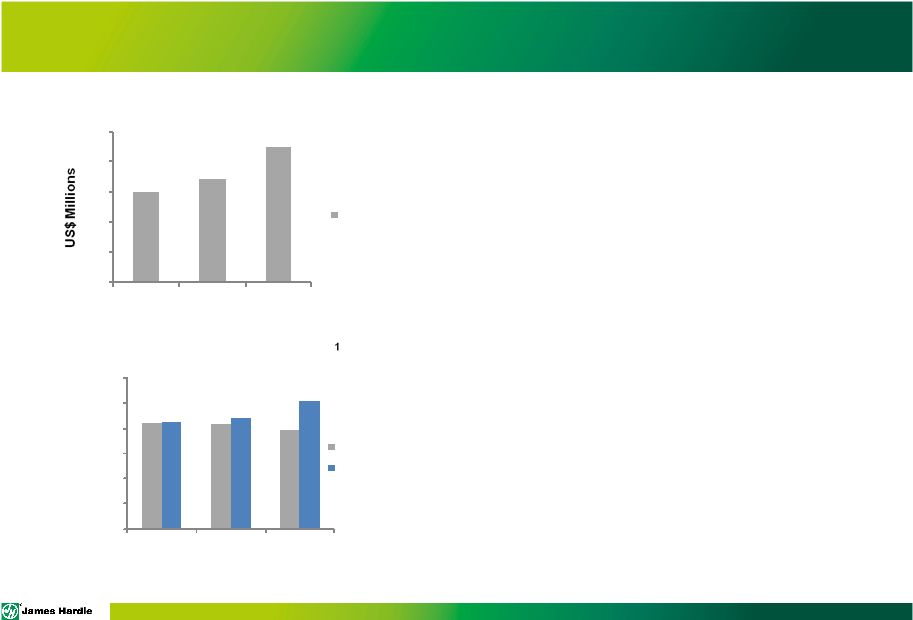 PAGE 1 Excludes New Zealand weathertightness claims USA and Europe Fiber Cement EBIT summary: • EBIT increased by 32% when compared to pcp • The increase for the quarter was driven by improved plant performance, lower input costs, increased volumes and lower segment SG&A expenses Asia Pacific Fiber Cement EBIT summary: • Quarter EBIT 1 decreased 5% compared to pcp. The Asia Pacific Fiber Cement segment results in US dollars were impacted by a 17% unfavorable change in the weighted average period AUD/USD exchange rate relative to the prior corresponding quarter. • EBIT 1 in local currency for the quarter increased 15% compared to pcp SEGMENT EBIT – 1 st QUARTER FY16 32 59.4 68.0 89.5 0 20 40 60 80 100 FY14 FY15 FY16 USA and Europe Fiber Cement Q1 EBIT 21.1 20.7 19.7 21.4 22.1 25.4 0 5 10 15 20 25 30 FY14 FY15 FY16 Asia Pacific Fiber Cement US$ Q1 EBIT A$ Q1 EBIT |
 PAGE 1 Excludes Asbestos related expenses and adjustments and ASIC expenses R&D summary: • Continued broadly in line with historic trend line on a percentage of sales basis • Fluctuations reflect normal variation and timing in number of R&D projects in process in any given period General corporate costs: • Results for the quarter increased due to higher : • Stock compensation related to share price appreciation • Discretionary expenses • Foreign exchange losses SEGMENT EBIT – 1 st QUARTER FY16 33 (6.9) (10.7) (13.5) (16) (14) (12) (10) (8) (6) (4) (2) 0 FY14 FY15 FY16 General Corporate Costs 1 Q1 EBIT (6.1) (6.8) (6.0) (7) (6) (5) FY14 FY15 FY16 Research and Development Q1 EBIT |
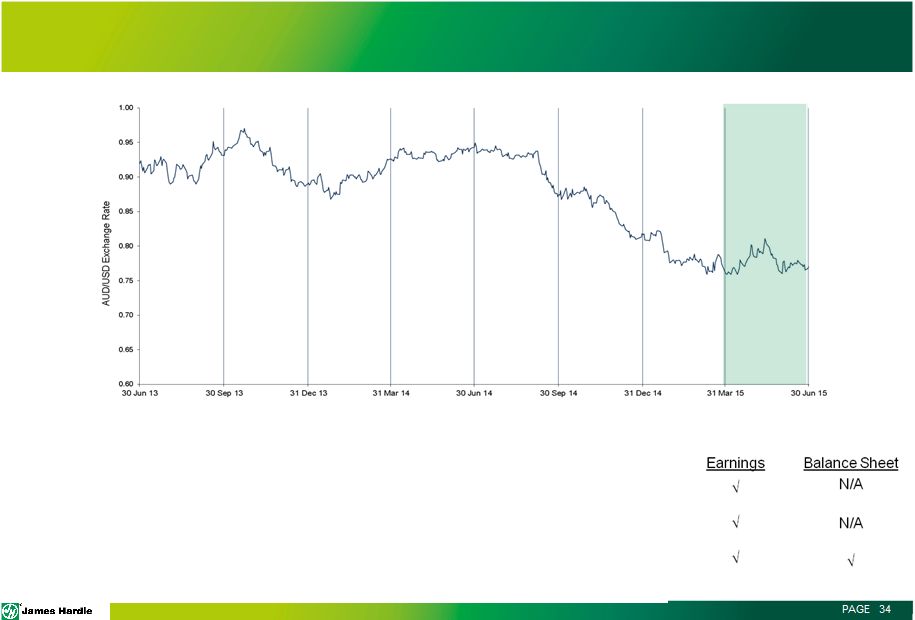 PAGE CHANGES IN AUD vs. USD • Unfavorable impact from translation of Asia Pacific results • Favorable impact on corporate costs incurred in Australian dollars • Unfavorable impact from translation of asbestos liability balance 34 |
 PAGE 1 Includes Asbestos adjustments, AICF SG&A expenses and AICF interest expense, net
2 Excludes tax effects of Asbestos and other tax adjustments 26.5% estimated adjusted effective tax rate (ETR) for the year • Adjusted income tax expense increased due to the increase in operating profit before income taxes, primarily in the US • The difference between adjusted income tax expense and income tax expense increased primarily due to lower asbestos and other tax adjustments • Income taxes are paid and payable in Ireland, the US, Canada, New Zealand and the Philippines • Income taxes are not currently paid or payable in Europe (excluding Ireland) or Australia due to tax losses. Australian tax losses primarily result from deductions relating to contributions to AICF INCOME TAX 35 Q1’16 Q1’15 Operating profit before taxes 81.3 45.6 Asbestos: Asbestos adjustments 1 4.9 22.3 NZ weathertightness claims 0.2 (1.3) Adjusted net operating profit before taxes 86.4 66.6 Adjusted income tax expense 2 (22.9) (16.5) Adjusted effective tax rate 26.5% 24.8% Income tax expense (21.3) (16.7) Income taxes paid 4.3 2.5 Income taxes payable 15.1 6.5 Three Months Ended 30 June |
 PAGE 1 CASHFLOW 36 • Net income increased US$31.1 million compared to prior corresponding period • Improved working capital driven by: • Improved inventory and A/P turns • Partially offset by an unfavorable change in A/R due to the timing of billing and collections • Lower capital expenditures: • Reflecting near completion of our previously announced US and Australian capacity projects • While continuing to invest in maintenance capital expenditure programs • Lower financing activities: • No dividends being paid in the current period, compared to the US$124.6 million payment of the one-time 125 year anniversary special dividend during the first quarter of fiscal year 2015 1 Includes Asbestos Adjustments and changes in asbestos-related assets and liabilities
2 Includes capitalized interest and proceeds from sale of property, plant and equipment
(US$ Millions)
Q1'16 Q1'15 Change (%) Net Income 60.0 28.9 Asbestos related 1 4.6 20.9 (78) Depreciation & amortization 18.2 16.6 10 Working capital 1.4 (0.4) Other non-cash items (29.1) (23.5) (24) Cash Flow from Operations 55.1 42.5 30 Capital expenditures 2 (16.4) (48.6) 66 Acquisition of assets (0.5) - Free Cash Flow 38.2 (6.1) Dividends paid - (124.6) Net payment of long-term debt (15.0) - Share related activities 1.2 (6.6) Free Cash Flow after Financing Activities 24.4 (137.3) |
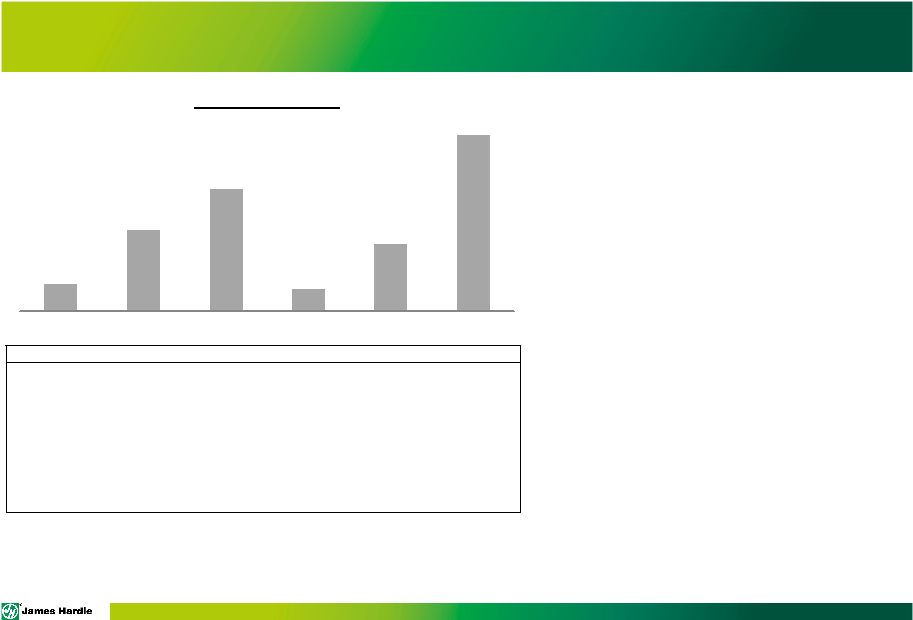 PAGE LIQUIDITY PROFILE 37 • Strong balance sheet position: • US$92.3 million of cash • US$382.6 million of gross debt • US$590 million of bank debt facilities • US$325 million 8 year unsecured notes 2,3 • 68% liquidity as of Q1’16 • At 30 June 2015, net debt of US$290.3 million compared to net debt of US$330.5 million at 31 March 2015 • At 30 June 2015, we have US$325.0 million in senior unsecured notes due 15 February 2023 with an interest of rate 5.875%. Interest is payable semi-annually in arrears on 15 August and 15 February each year. • Net Debt within target range of 1-2 times EBITDA excluding asbestos • We remain in compliance with all debt covenants 1 Debt maturities as at Q1’16 were as follows: US$50 million in Q4’16, US$150 million in Q1’17, US$100 million in
Q1’18, US$125 million Q3’18, US$40 million in Q4’19, US$125 million in
Q1’20 and US$325 million in Q4’23 2
Callable from February 2018
3 Original issue discount (OID) US$2.4 million at 30 June 2015 Liquidity Profile of Bilateral Facilities Three months ended 30 June Cash US$92.3 million Total Combined Bank Facilities US$590.0 million Drawn Bank Facilities US$60.0 million Undrawn Bank Facilities US$530.0 million Weighted Average Interest Rate of drawn Bank Facilities 1.4% Fixed / Floating Interest Ratio 110% fixed Weighted Average Term (Bank Facilities) 2.2 years Weighted Average Term (Total Facilities) 4.1 years $50 $150 $225 $40 $125 $325 FY'16 FY'17 FY'18 FY'19 FY'20 FY'23 Debt Maturity Profile 1 |
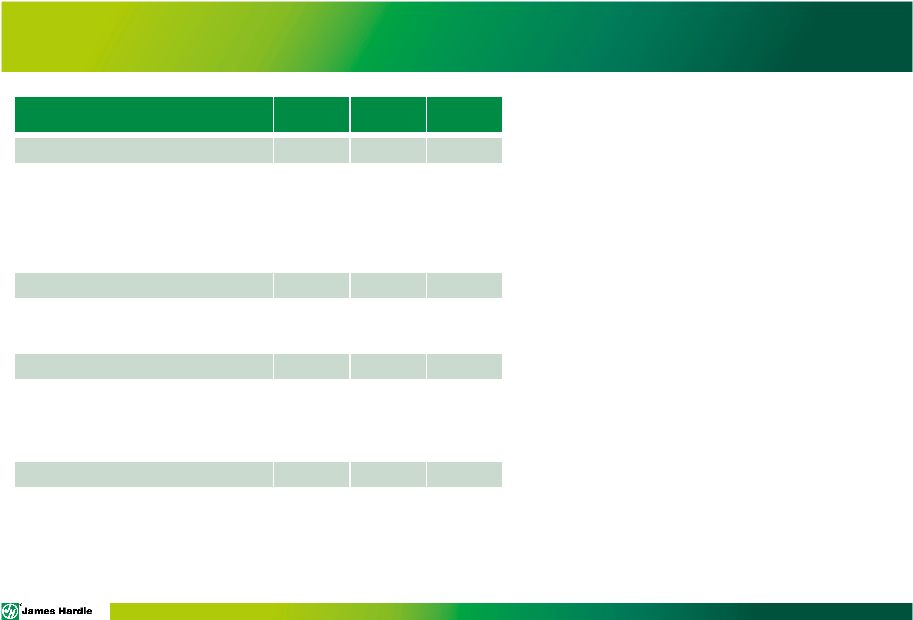
 PAGE Q1 '16 Q1 '15 % Change Claims received 139 156 11 Actuarial estimate for the period 164 153 (7) Difference in claims received to actuarial estimate 25 (3) Average claim settlement 1 (A$) 233,000 223,000 (4) Actuarial estimate for the period 2 (A$) 302,000 289,000 (4) Difference in claims paid to actuarial estimate 69,000 66,000 (5) Three Months Ended 30 June ASBESTOS CLAIMS DATA 38 Claims Data • Claims received during the quarter were 15% below actuarial estimates and 11% lower than the prior corresponding period • Mesothelioma claims reported in the current quarter are 2% above actuarial estimates and are 5% below the prior corresponding period • Average claim settlement sizes are generally lower across all disease types compared to actuarial expectations for fiscal year 2016 • The average claim settlement is 23% below actuarial estimates and 4% higher than the prior corresponding period 1 Average claim settlement is derived as the total amount paid divided by the number of non-nil claim
settlements 2 This actuarial estimate
is a function of the assumed experience by disease type and the relative mix of settlements assumed by disease type. Any variances in the assumed mix of settlements by disease type will have an impact on the average claim settlement experience |
 PAGE DEFINITIONS AND OTHER TERMS This Management Presentation forms part of a package of information about the company’s results. It should be read in conjunction with the other parts of this package, including the Management’s Analysis of Results, Media Release and Consolidated Financial Statements Definitions Non-financial Terms AFFA – Amended and Restated Final Funding Agreement AICF – Asbestos Injuries Compensation Fund Ltd NBSK – Northern Bleached Soft Kraft; the company's benchmark grade of pulp Legacy New Zealand weathertightness claims (“New Zealand weathertightness claims”) – Expenses arising from defending and resolving claims in New Zealand that allege poor building design, inadequate certification of plans, inadequate construction review and compliance certification and deficient work by sub-contractors 39 |
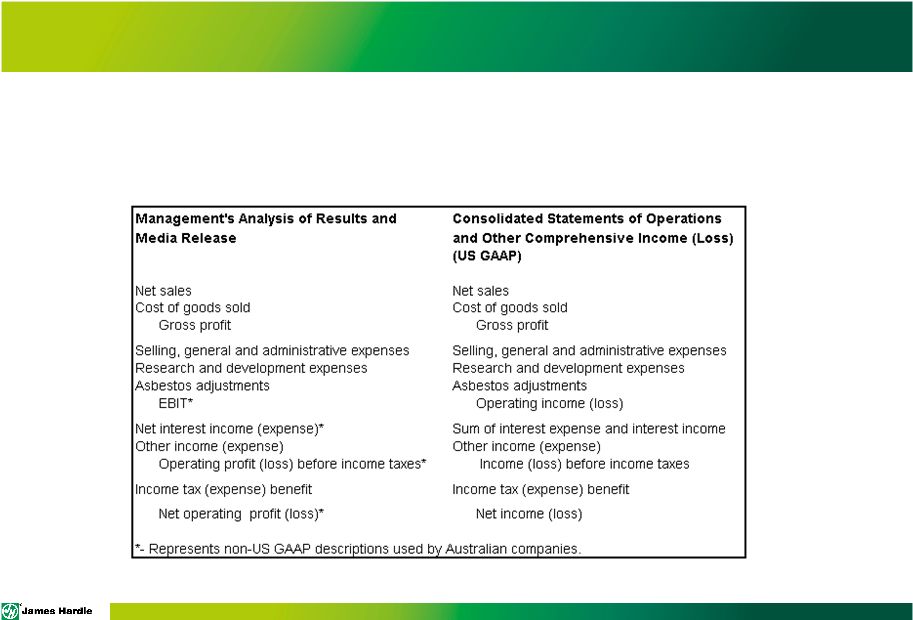 PAGE DEFINITIONS AND OTHER TERMS Financial Measures – US GAAP equivalents This document contains financial statement line item descriptions that are considered to be non-US GAAP, but are consistent with those used by Australian companies. Because the company prepares its Consolidated Financial Statements under US GAAP, the following table cross-references each non-US GAAP line item description, as used in Management’s Analysis of Results and Media Release, to the equivalent US GAAP financial statement line item description used in the company’s Condensed Consolidated Financial Statements: 40 |
 PAGE DEFINITIONS AND OTHER TERMS EBIT margin – EBIT margin is defined as EBIT as a percentage of net sales Sales Volumes mmsf – million square feet, where a square foot is defined as a standard square foot of 5/16” thickness msf – thousand square feet, where a square foot is defined as a standard square foot of 5/16” thickness Financial Ratios Gearing Ratio – Net debt (cash) divided by net debt (cash) plus shareholders’ equity Net interest expense cover – EBIT divided by net interest expense (excluding loan establishment fees) Net interest paid cover – EBIT divided by cash paid during the period for interest, net of amounts capitalised Net debt payback – Net debt (cash) divided by cash flow from operations Net debt (cash) – Short-term and long-term debt less cash and cash equivalents Return on capital employed – EBIT divided by gross capital employed 41 |
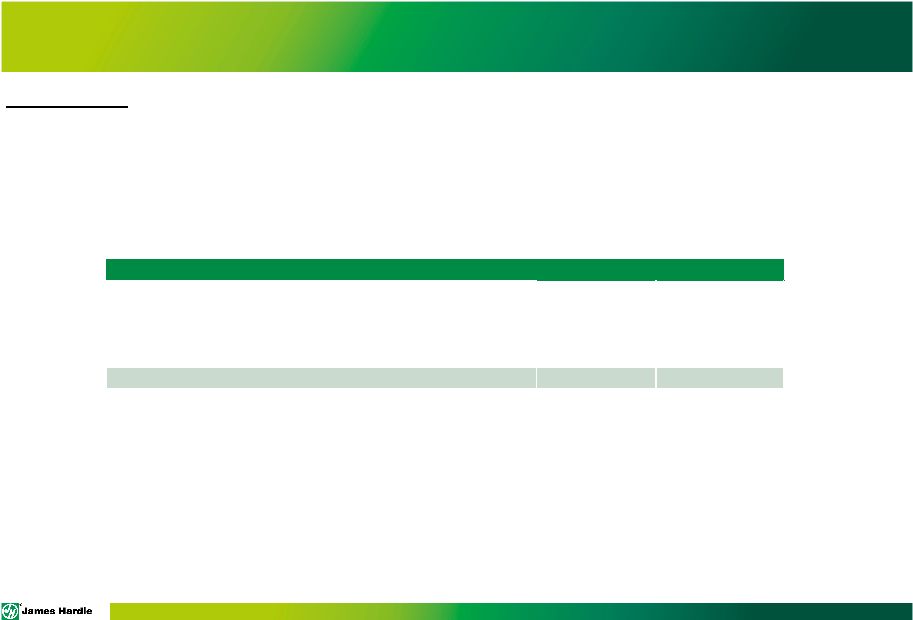
  PAGE Adjusted EBIT and Adjusted EBIT margin – Adjusted EBIT and Adjusted EBIT margin are not measures of financial performance under US GAAP and should not be considered to be more meaningful than EBIT and EBIT margin. Management has included these financial measures to provide investors with an alternative method for assessing its operating results in a manner that is focused on the performance of its ongoing operations and provides useful information regarding its financial condition and results of operations. Management uses these non-US GAAP measures for the same purposes.
NON-US GAAP FINANCIAL MEASURES
42 US$ Millions Three Months Ended 30 June Q1 '16 Q1 '15 EBIT 84.5 $
50.4 $ Asbestos: Asbestos adjustments 4.5 21.5 AICF SG&A expenses 0.5 0.6 New Zealand weathertightness claims 0.2 (1.3) Adjusted EBIT 89.7 71.2 Net sales 428.3 $ 416.8 $ Adjusted EBIT margin 20.9% 17.1% |
  PAGE Adjusted net operating profit – Adjusted net operating profit is not a measure of financial performance under US GAAP and should not be considered to be more meaningful than net operating profit. Management has included this financial measure to provide investors with an alternative method for assessing its operating results in a manner that is focused on the performance of its ongoing operations. Management uses this non-US GAAP measure for the same purposes. NON-US GAAP FINANCIAL MEASURES 43 US$ Millions Three Months Ended 30 June Q1 '16 Q1 '15 Net operating profit 60.0 $ 28.9 $ Asbestos: Asbestos adjustments 4.5 21.5 AICF SG&A expenses 0.5 0.6 AICF interest (income) expense, net (0.1) 0.2 New Zealand weathertightness claims 0.2 (1.3) Asbestos and other tax adjustments (1.6) 0.2 Adjusted net operating profit 63.5 $ 50.1 $ |
  PAGE Adjusted diluted earnings per share – Adjusted diluted earnings per share is not a measure of financial performance under US GAAP and should not be considered to be more meaningful than diluted earnings per share. Management has included this financial measure to provide investors with an alternative method for assessing its operating results in a manner that is focused on the performance of its ongoing operations. Management uses this non-US GAAP measure for the same purposes. 44 NON-US GAAP FINANCIAL MEASURES Three Months Ended 30 June Q1 '16 Q1 '15 Adjusted net operating profit (US$ millions) 63.5 $
50.1 $
Weighted average common shares outstanding -
Diluted (millions)
447.4 446.0 Adjusted diluted earnings per share (US cents) 14 11 |
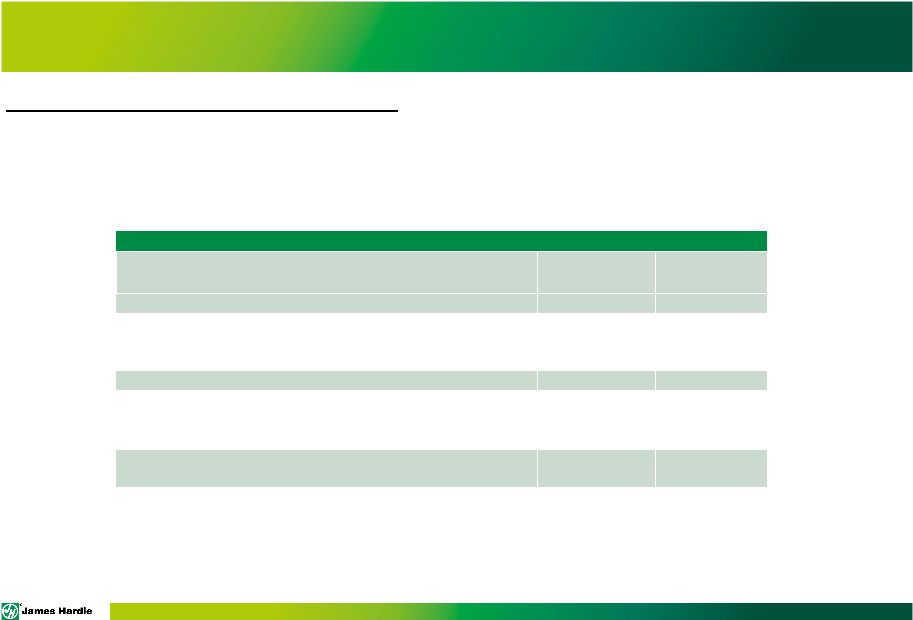
 PAGE Adjusted income tax expense and Adjusted effective tax rate – Adjusted income tax expenses and Adjusted effective tax rate on earnings is not a measure of financial performance under US GAAP and should not be considered to be more meaningful than income tax expense and effective tax rate, respectively. Management has included this financial measure to provide investors with an alternative method for assessing its operating results in a manner that is focused on the performance of its ongoing operations. Management uses this non-US GAAP measure for the same purposes. 45 NON-US GAAP FINANCIAL MEASURES US$ Millions Q1 '16 Q1 '15 Operating profit before income taxes 81.3 $
45.6 $
Asbestos: Asbestos adjustments 4.5 21.5 AICF SG&A expenses 0.5 0.6 AICF interest (income) expense, net (0.1) 0.2 New Zealand weathertightness claims 0.2 (1.3) Adjusted operating profit before income taxes 86.4 $
66.6 $
Income tax expense (21.3) $
(16.7) $
Asbestos and other tax adjustments
(1.6) 0.2 Adjusted income tax expense (22.9) $ (16.5) $ Effective tax rate 26.2% 36.6% Adjusted effective tax rate 26.5% 24.8% Three Months Ended 30 June |
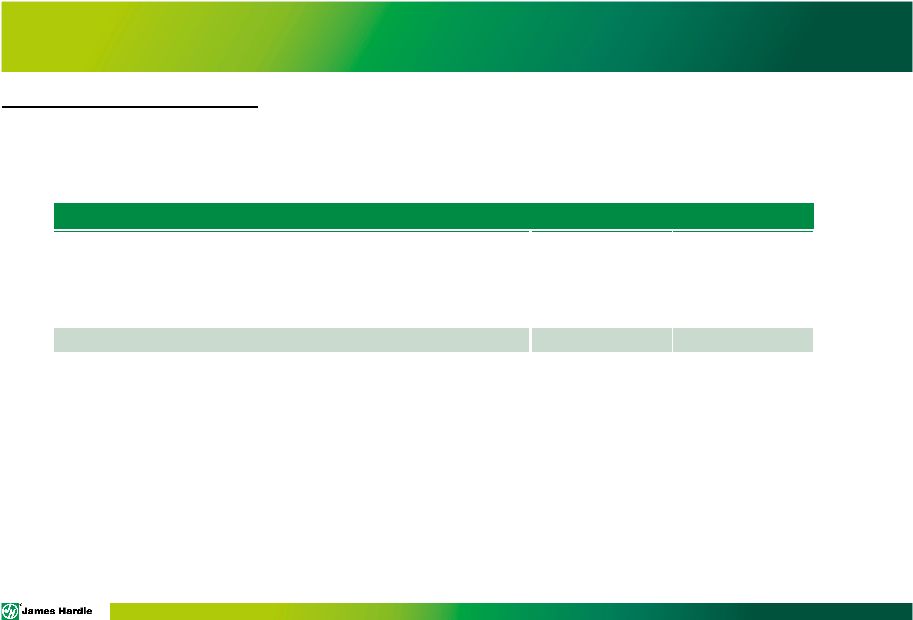
  PAGE Adjusted EBITDA – is not a measure of financial performance under US GAAP and should not be considered an alternative to, or more meaningful than, income from operations, net income or cash flows as defined by US GAAP or as a measure of profitability or liquidity. Not all companies calculate Adjusted EBITDA in the same manner as James Hardie has and, accordingly, Adjusted EBITDA may not be comparable with other companies. Management has included information concerning Adjusted EBITDA because it believes that this data is commonly used by investors to evaluate the ability of a company’s earnings from its core business operations to satisfy its debt, capital expenditure and working capital requirements NON-US GAAP FINANCIAL MEASURES 46 US$ Millions Q1 '16 Q1 '15 EBIT 84.5 $ 50.4 $ Depreciation and amortization 18.2 16.6 Adjusted EBITDA 102.7 $ 67.0 $ Three Months Ended 30 June |
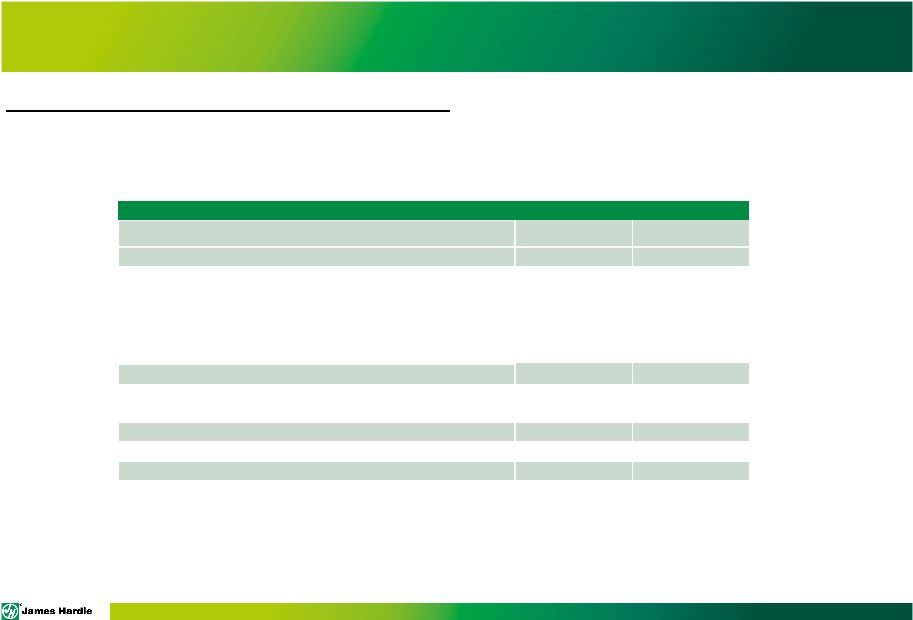
 PAGE Adjusted selling, general and administrative expenses – Adjusted selling, general and administrative expenses is not a measure of financial performance under US GAAP and should not be considered to be more meaningful than selling, general and administrative expenses. Management has included these financial measures to provide investors with an alternative method for assessing its operating results in a manner that is focused on the performance of its ongoing operations and provides useful information regarding its financial condition and results of operations. Management uses these non-US GAAP measures for the same purposes. NON-US GAAP FINANCIAL MEASURES 47 US$ Millions Q1 '16 Q1 '15 Selling, general and administrative expenses 61.5 $
59.9 $ Excluding: New Zealand weathertightness claims (0.2) 1.3 AICF SG&A expenses
(0.5) (0.6) Adjusted selling, general and administrative expenses
60.8 $
60.6 $ Net sales 428.3 $ 416.8 $ Selling, general and administrative expenses as a percentage of net sales 14.4% 14.4% Adjusted selling, general and administrative expenses as a percentage of net sales 14.2% 14.5% Three Months Ended 30 June |
 INVESTOR
PRESENTATION SEPTEMBER 2015 |