 Financial
and Market Dynamics September 2015
Exhibit 99.4 |
| Financial
and Market Dynamics September 2015
Exhibit 99.4 |
 DISCLAIMER FORWARD-LOOKING STATEMENTS This Investor Presentation contains forward-looking statements. James Hardie Industries plc (the “company”) may from time to time
make forward-looking statements in its periodic reports filed with or
furnished to the Securities and Exchange Commission, on Forms 20-F and 6-K, in its annual reports to shareholders, in offering circulars, invitation memoranda and prospectuses, in media releases and other written materials and in oral statements made by the company’s officers, directors or employees to
analysts, institutional investors, existing and potential lenders,
representatives of the media and others. Statements that are not historical facts are forward-looking statements and such forward-looking statements are statements made pursuant to the Safe Harbor Provisions of the Private Securities Litigation Reform Act of 1995.
Examples of forward-looking statements include:
• statements about the company’s future performance; • projections of the company’s results of operations or financial condition; • statements regarding the company’s plans, objectives or goals, including those relating to strategies, initiatives, competition, acquisitions, dispositions and/or its products; • expectations concerning the costs associated with the suspension or closure of operations at any of the company’s plants and future plans
with respect to any such plants; •
expectations concerning the costs associated with the significant capital expenditure projects at any of the company’s plants and future plans with respect to any such projects; • expectations regarding the extension or renewal of the company’s credit facilities including changes to terms, covenants or
ratios; •
expectations concerning dividend payments and share buy-backs;
• statements concerning the company’s corporate and tax domiciles and structures and potential changes to them, including potential tax
charges; •
statements regarding tax liabilities and related audits, reviews and
proceedings; •
expectations about the timing and amount of contributions to Asbestos Injuries
Compensation Fund (AICF), a special purpose fund for the compensation of proven Australian asbestos-related personal injury and death claims; • expectations concerning indemnification obligations; • expectations concerning the adequacy of the company’s warranty provisions and estimates for future warranty-related costs;
• statements regarding the company’s ability to manage legal and regulatory matters (including but not limited to product liability,
environmental, intellectual property and competition law matters) and to
resolve any such pending legal and regulatory matters within current estimates and in anticipation of certain third-party recoveries; and • statements about economic conditions, such as changes in the US economic or housing recovery or changes in the market conditions in the Asia Pacific region, the levels of new home construction and home renovations, unemployment levels, changes in consumer income, changes or stability in housing values, the availability of mortgages and other financing, mortgage and other interest rates, housing affordability and supply, the levels of foreclosures and home resales, currency exchange rates, and builder and consumer confidence. |
 DISCLAIMER
(continued) Words such as “believe,” “anticipate,”
“plan,” “expect,” “intend,” “target,” “estimate,” “project,” “predict,” “forecast,” “guideline,” “aim,” “will,” “should,”
“likely,” “continue,” “may,” “objective,” “outlook” and similar expressions are intended to identify forward-looking statements but are not the exclusive means of
identifying such statements. Readers are cautioned not to place undue
reliance on these forward-looking statements and all such forward-looking statements are qualified in their entirety by reference to the following cautionary statements. Forward-looking statements are based on the company’s current expectations, estimates and assumptions and because forward-looking statements address future results, events and conditions, they, by their very nature, involve inherent risks and uncertainties, many of which are unforeseeable and beyond the company’s control. Such known and unknown risks, uncertainties and other factors may cause actual results, performance or other achievements to differ materially from the anticipated results, performance or achievements expressed, projected or implied by these forward-looking statements. These factors, some of which are discussed under “Risk Factors” in Section 3 of the Form 20-F filed with the Securities and Exchange Commission on 21 May 2015, include, but are not limited to: all matters relating to or arising out of the prior manufacture of products that contained asbestos by current and former company subsidiaries; required contributions to AICF, any shortfall in AICF and the effect of currency exchange rate movements on the amount recorded in the company’s financial statements as an asbestos liability; governmental loan facility to AICF; compliance with and changes in tax laws and treatments; competition and product pricing in the markets in which the company operates; the consequences of product failures or defects; exposure to environmental, asbestos, putative consumer class action or other legal proceedings; general economic and market conditions; the supply and cost of raw materials; possible increases in competition and the potential that competitors could copy the company’s products; reliance on a small number of customers; a customer’s inability to pay; compliance with and changes in environmental and health and safety laws; risks of conducting business internationally; compliance with and changes in laws and regulations; the effect of the transfer of the company’s corporate domicile from the Netherlands to Ireland, including changes in corporate governance and any potential tax benefits related thereto; currency exchange risks; dependence on customer preference and the concentration of the company’s customer base on large format retail customers, distributors and dealers; dependence on residential and commercial construction markets; the effect of adverse changes in climate or weather patterns; possible inability to renew credit facilities on terms favorable to the company, or at all; acquisition or sale of businesses and business segments; changes in the company’s key management personnel; inherent limitations on internal controls; use of accounting estimates; and all other risks identified in the company’s reports filed with Australian, Irish and US securities regulatory agencies and exchanges (as appropriate). The company cautions you that the foregoing list of factors is not exhaustive and that other risks and uncertainties may cause actual results to differ materially from those referenced in the company’s forward-looking statements. Forward-looking statements speak only as of the date they are made and are statements of the company’s current expectations concerning future results, events and conditions. The company assumes no obligation to update any forward-looking statements or information except as required by law. |
 U.S.
MARKETPLACE Page 4 |
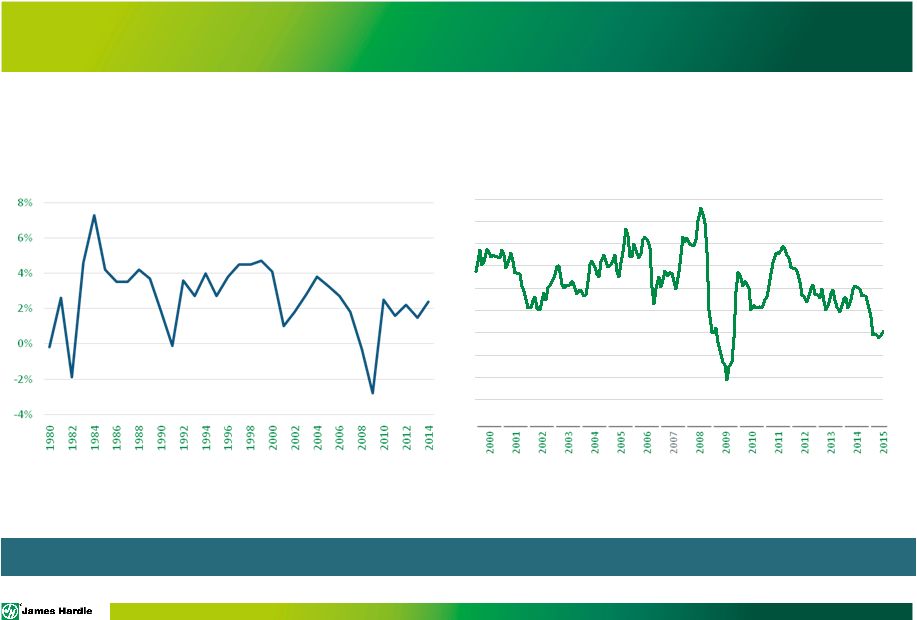 ECONOMY
HAS STABILIZED Source: Bureau of Economic Analysis
Source: U.S. Bureau of Labor Statistics
GDP GROWTH INFLATION Overall economy has stabilized and is in a slow but steady recovery -3% -2% -1% 0% 1% 2% 3% 4% 5% 6% Page 5 |
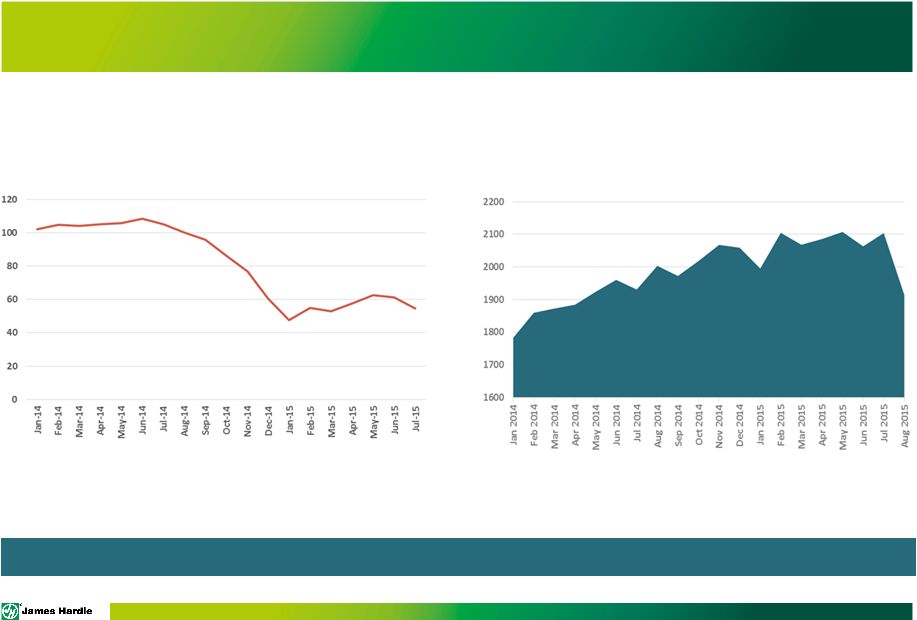 KEY
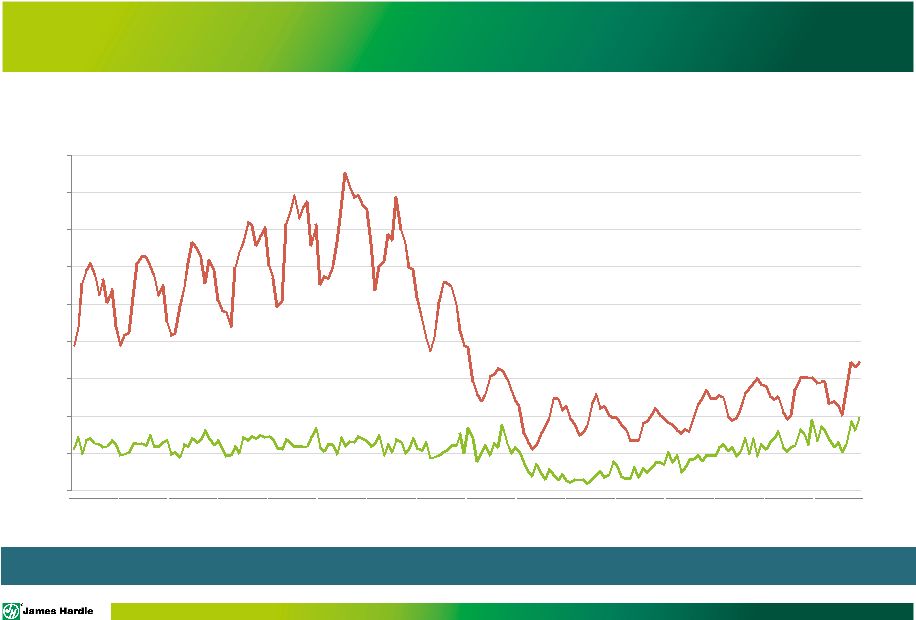
INDICATORS POINT TO SOME VOLATILITY Source: World Bank
Source: Yahoo! Finance
Oil Prices - Price per Barrel ($USD) S&P 500 Oil prices and equity markets have displayed volatility Page 6 |
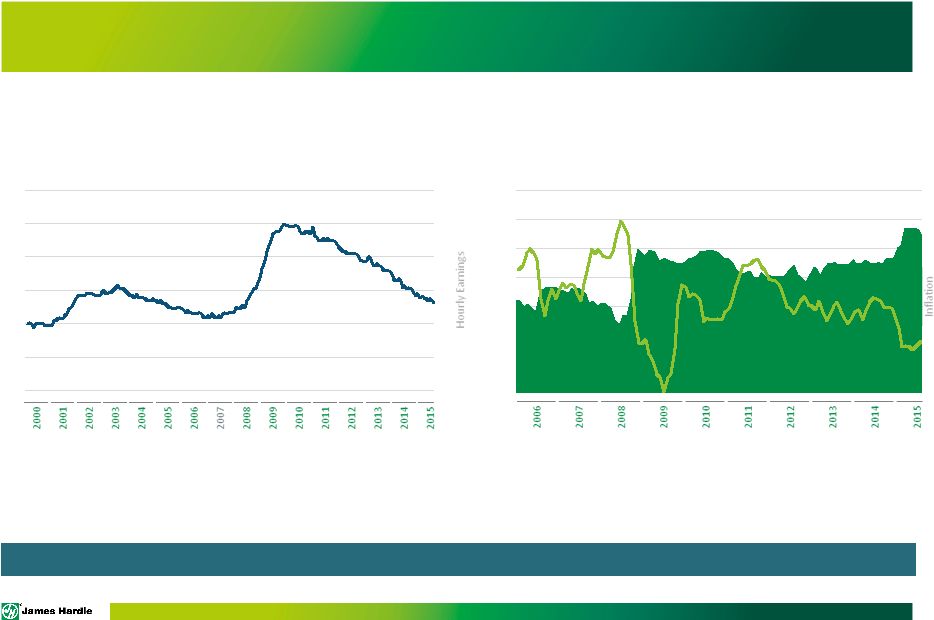 $9.40 $9.60 $9.80 $10.00 $10.20 $10.40 $10.60 $10.80 Real Average Hourly Earnings Unemployment Rate - Seasonally Adjusted EMPLOYMENT SUPPORTS HOMEOWNERSHIP 0% 2% 4% 6% 8% 10% 12% Source: U.S. Bureau of Labor Statistics Unemployment back to pre-recession rates while wage inflation is starting to emerge
Source: U.S. Bureau of Labor Statistics
Inflation Rates
Page 7 |
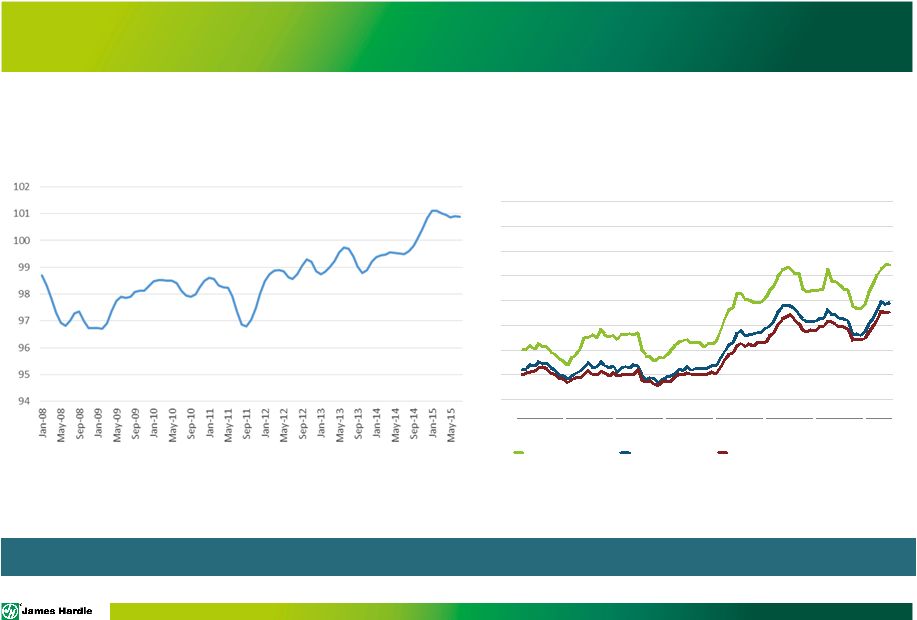 CONFIDENCE Overall consumer confidence and real estate confidence are strong Source: OECD August 2015, Confidence Index Real Estate Confidence Index Current Conditions as of June 2015 (50=“Moderate” Conditions) Single-family Townhome Condominium 0 10 20 30 40 50 60 70 80 2008 2009 2010 2011 2012 2013 2014 2015 73 53 48 Overall Consumer Confidence Source: Report on the June 2015 Survey, National Association of Realtors Page 8 |
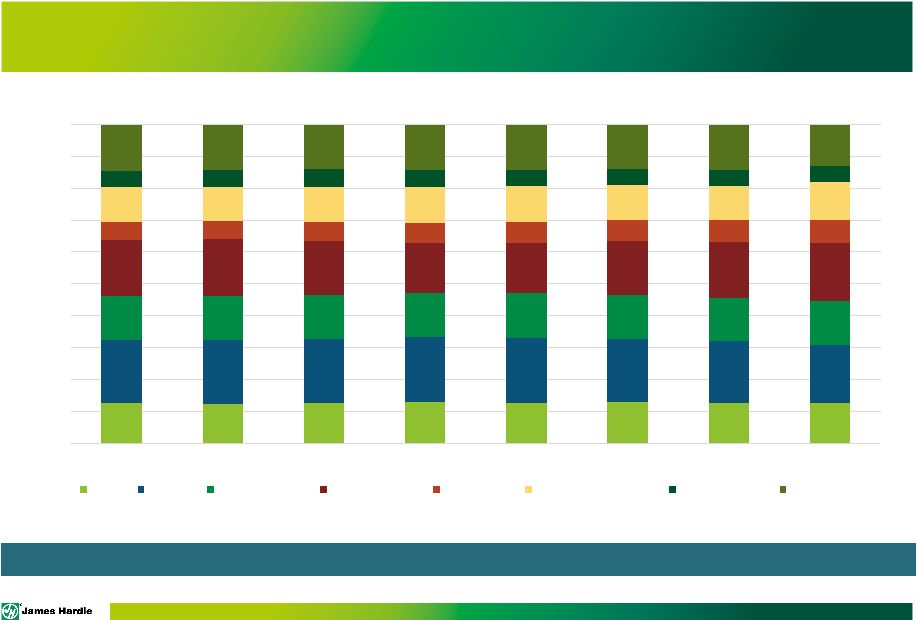 CONSUMER
SPEND Source: U.S. Bureau of Labor Statistics
0% 10% 20% 30% 40% 50% 60% 70% 80% 90% 100% 2006 2007 2008 2009 2010 2011 2012 2013 Food Shelter Other Housing Transportation Healthcare Insurance/Pensions Entertainment All other CONSUMER SPEND Shelter as a % of spend is stable. Total consumer spend is up 5% CAGR since 2006.
Page 9 |
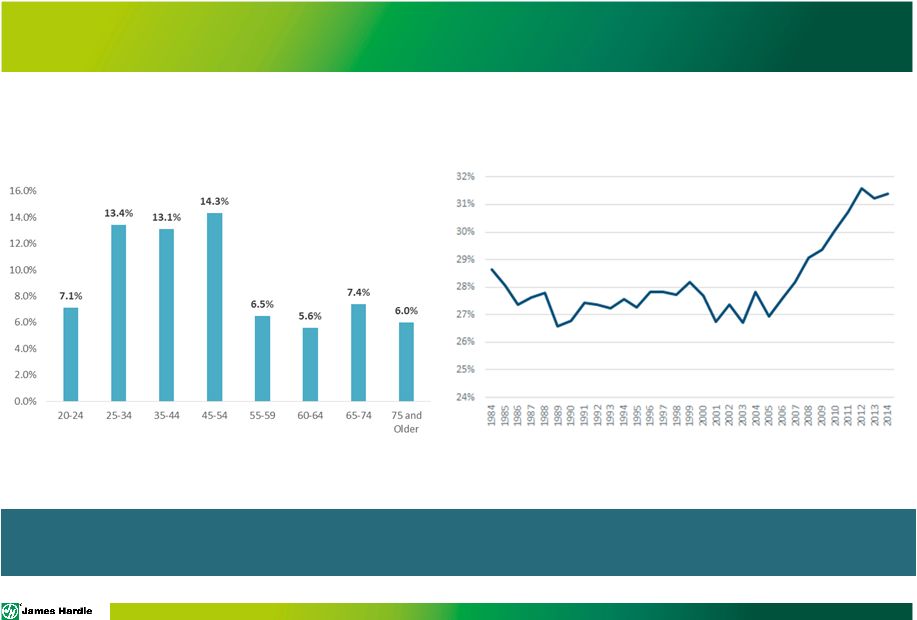 ELIGIBLE
HOME BUYERS EXIST Source: U.S. Census Bureau
Source: U.S. Census Bureau
Pent-up demand continues…
~20% of U.S. population between 20-34. ~30% living at home is historic
high. % of U.S. Population by Age, 2013
Percentage of 18-34 Year-Olds Living with Their Parents
Page 10 |
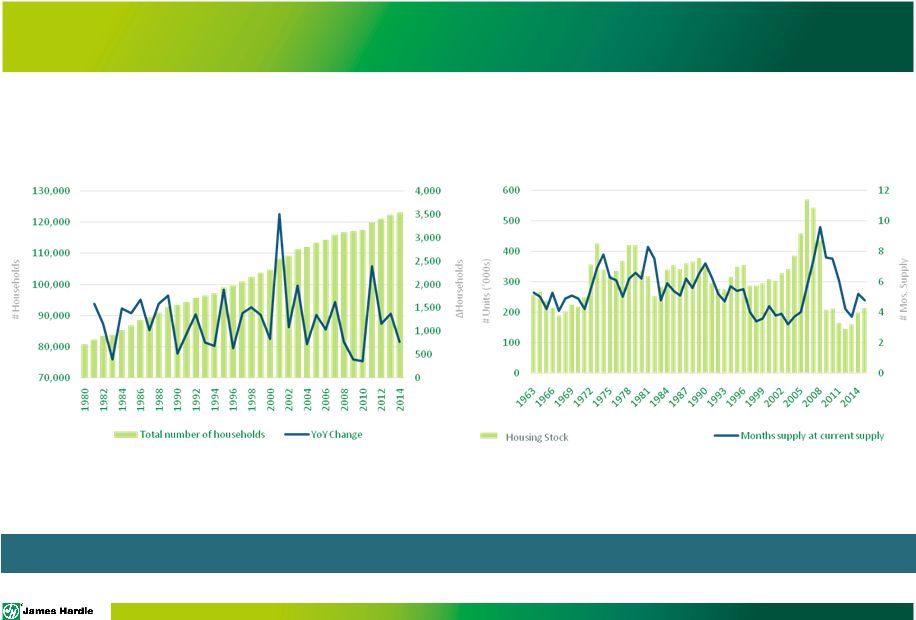 DEMAND
OUTPACING SUPPLY Source: U.S. Census Bureau
Supply is relatively low vs. historical rates
Months of Supply at Current Sales Rate
Total Number of Households
Page 11 |
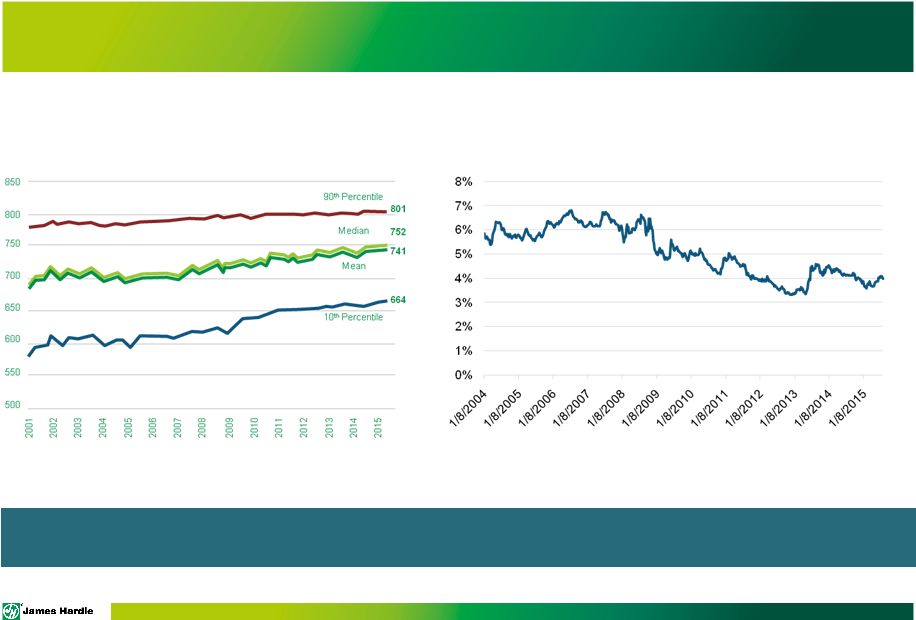 FINANCING Source: Federal Reserve 30-year Mortgage Rate Borrower FICO Score at Origination Sources: CoreLogic Servicing and Urban Institute, April 2015 Note: Purchase-only loans. Minimum FICO score for a mortgage has increased significantly while mortgage rates are low Page 12 |
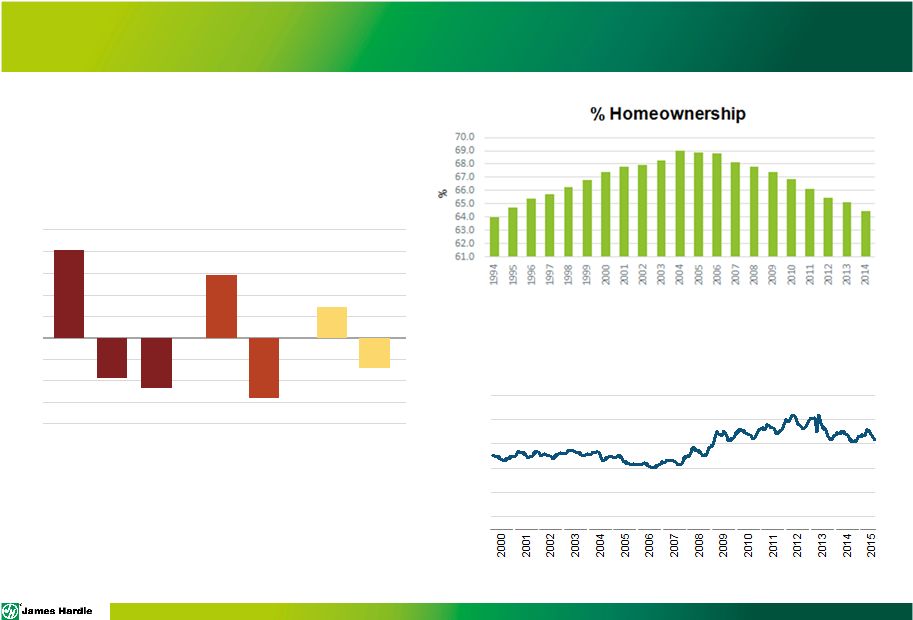
 HOME
OWNERSHIP PROFILE 0
50 100 150 200 250 Source: S&P Dow Jones Indices Source: Zillow Real Estate Research S&P/Case-Shiller 20-City Composite Home Price Index Percent of Owner-Occupied Homes with a Mortgage in Negative Equity (U.S.) Home prices are improving as are owners’ financial positions, which should cause home ownership turnover Page 13 |
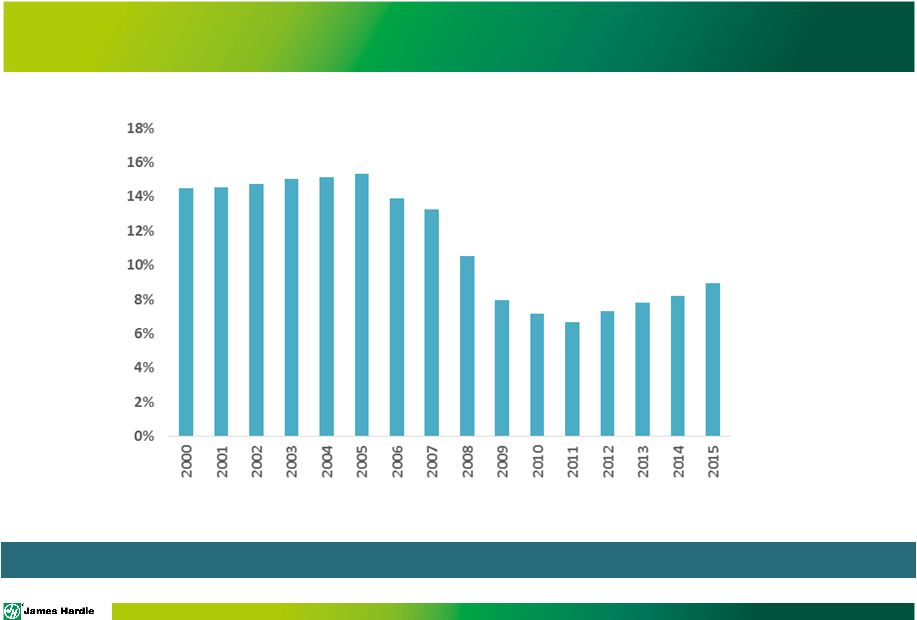 NEW
CONSTRUCTION VS. EXISTING HOME SALES New Construction as a % of Home
Sales Source: National Association of Realtors and U.S. Census
Bureau New construction continues to gain momentum as a percent of total
home sales Page 14 |
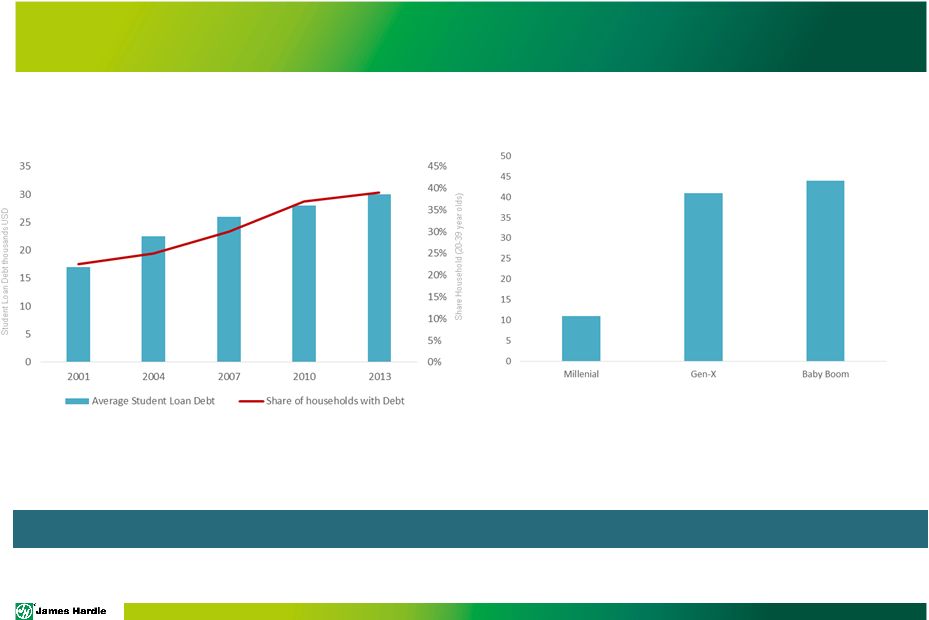 MILLENNIALS Households 2013 in millions Millennials are a source of pent-up demand in the housing sector Student Loan Debt Source: JCHS Tabulation of Federal Reserve Board Source: JCHS Tabulation of U.S. Census Bureau Page 15 |
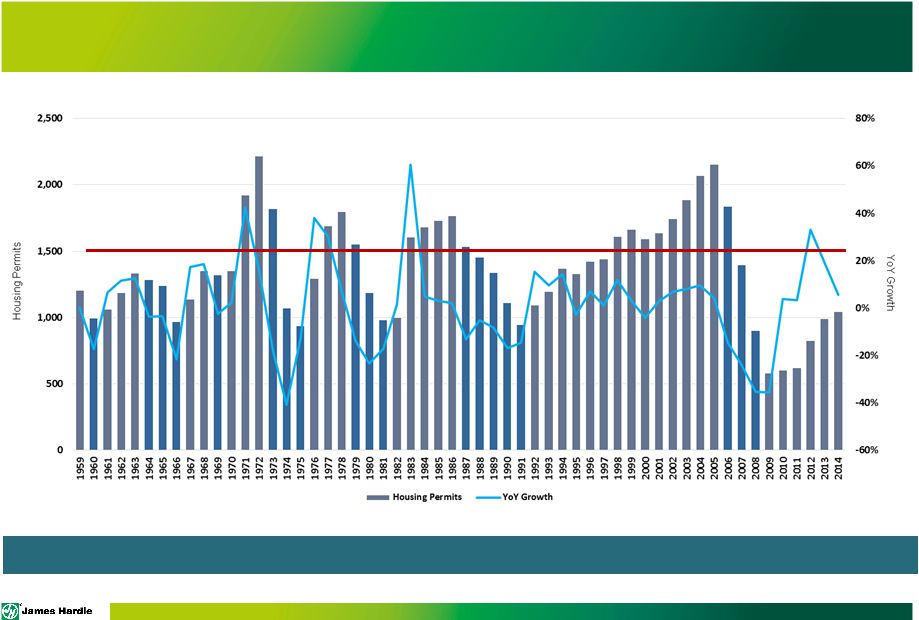 SLOW AND
STEADY RECOVERY HOUSING PERMITS
Source: U.S. Census Bureau
Starts continue to trend below historic average of 1.5M per year
Page 16 |
 STARTS
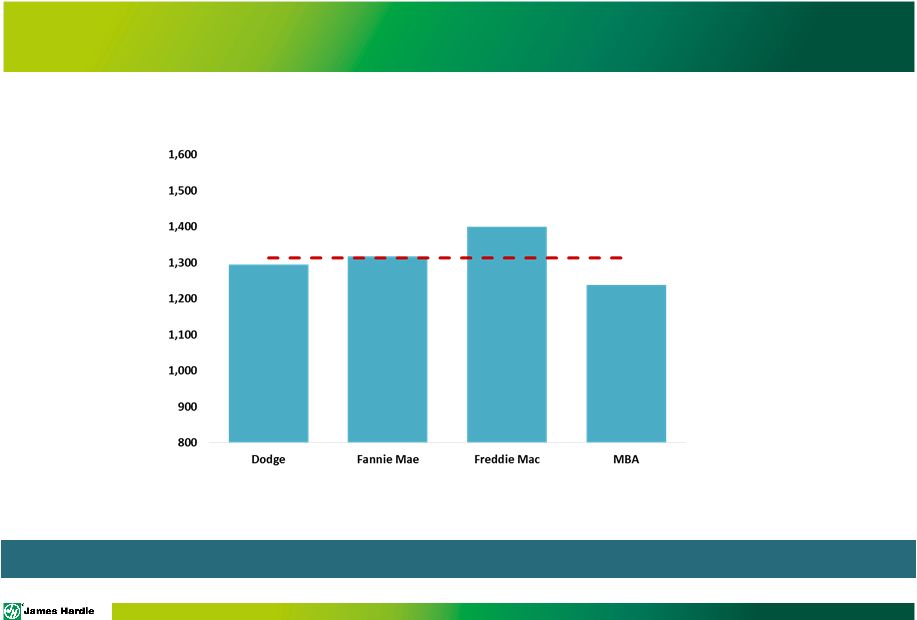
FORECAST 2016 Forecasted Housing Starts
Source: Dodge, Fannie Mae, Freddie Mac and MBA
Starts forecasted to be 1.1M in 2015 and 1.3M in calendar year 2016
Page 17 |
 0 20 40 60 80 100 120 140 160 180 MULTI-FAMILY OUTPACING SINGLE-FAMILY Source: U.S. Census Bureau Housing Starts - 1 unit HOUSING STARTS 000s Homes Housing Starts - 5 or more units 2000 2001 2002 2003 2004 2005 2006 2007 2008 2009 2010 2011 2012 2013 2014 2015 Multi-family starts are growing at a faster rate than single-family starts
Page 18 |
 MULTI-FAMILY TREND LIKELY TO CONTINUE
0 50 100 150 200 250 Housing Affordability Index Source: National Association of Realtors Source: U.S. Census Bureau Today’s younger households are increasingly likely to have characteristics associated with lower homeownership rates Change in share of 25-34 year-old households 2003-13 (percentage points)
Source: JDHS tabulations of U.S. Department of Housing and Urban
Development HUD), American Housing Surveys
Under $30,000 $30,000 -74,999 $75,000 and Over Not Married Married Minority White Income Household Type Race/Ethnicity 10 8 6 4 2 0 -2 -4 -6 -8 Page 19 |
 REPAIR
AND REMODEL MARKET 0
10 20 30 40 50 60 70 Source: National Association of Home Builders Source: U.S. Census Bureau Average Age = 40 Years Remodeling continues to be a strong segment of growth Age of Housing Stock NAHB Remodeling Market Index 7.8% 13.9% 12.2% 16.2% 19.7% 16.0% 14.4% <10 Years 11-20 Years 21-30 Years 31-40 Years 41-50 Years 51-60 Years >61 Years Page 20 |
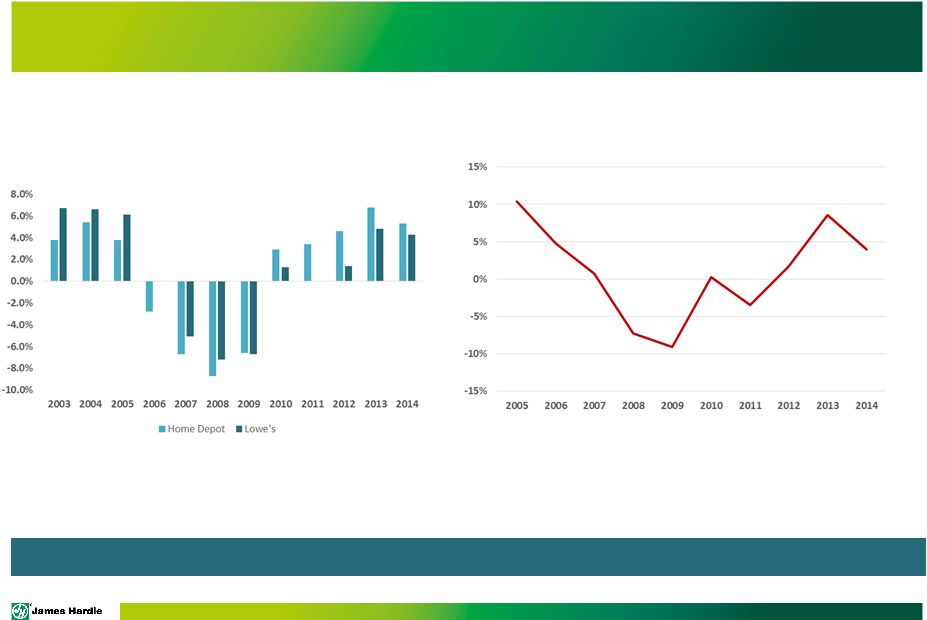 REPAIR
AND REMODEL MARKET Source: Hanley Wood
Repair and Remodel market continues to show strength through the recovery
Hanley Wood R&R Siding Project Growth
Home Depot and Lowe’s
Same Store Comparable Sales
Source: Company Filings
Page 21 |
 JH
PERFORMANCE Page 22 |
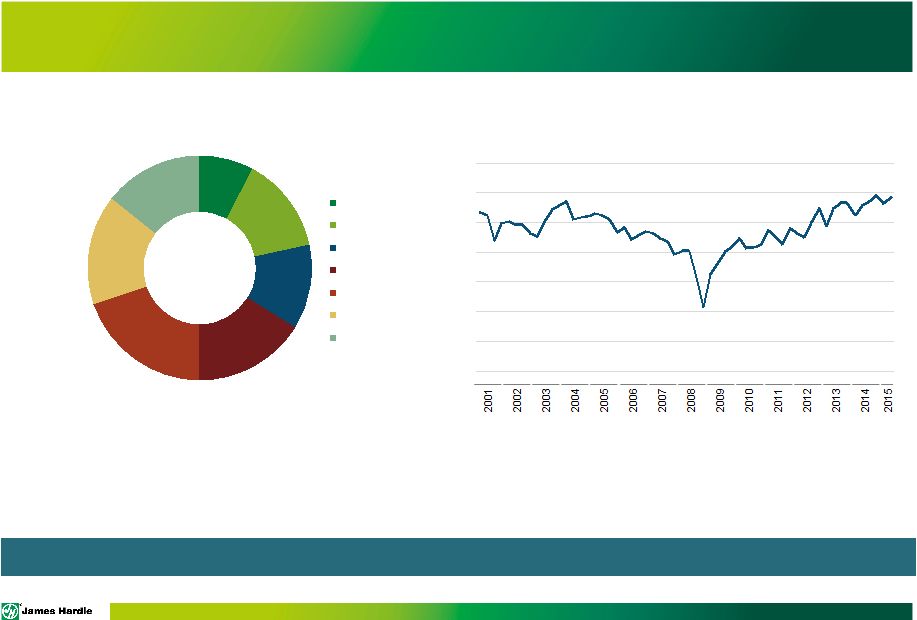
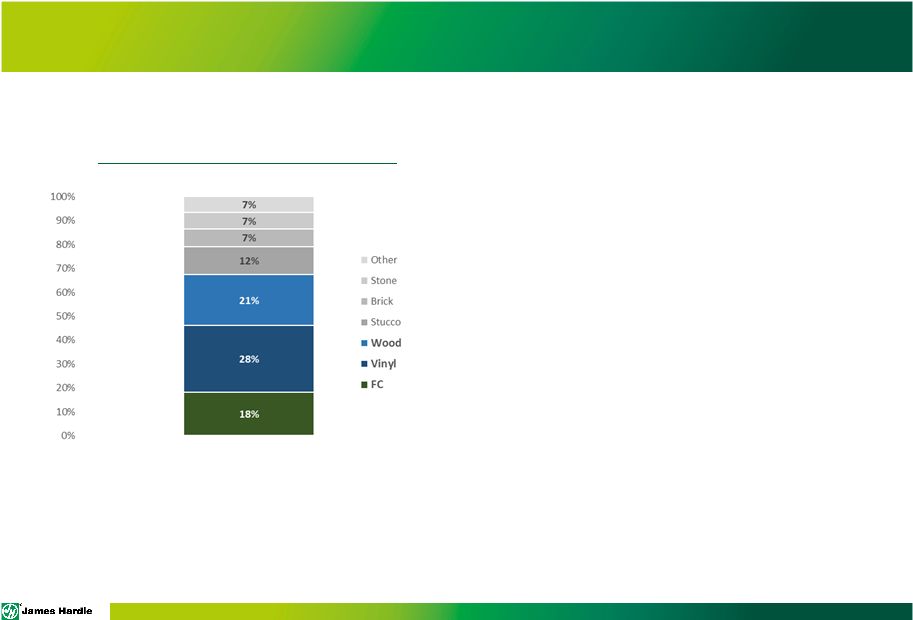 CURRENT
MARKET SHARE LANDSCAPE North America Siding Market Share
Source: Internal estimates based on NAHB product usage data adjusted for regional
market intelligence
National Association of Homebuilders
(NAHB) serves as our main source for
market share measurement as it
provides the following:
• Siding used in residential dwelling applications • Square feet as unit of measurement • Geographic detail allowing alignment to organizational structure • Segmentation between single-family, multi-family and repair & remodel Page 23 |
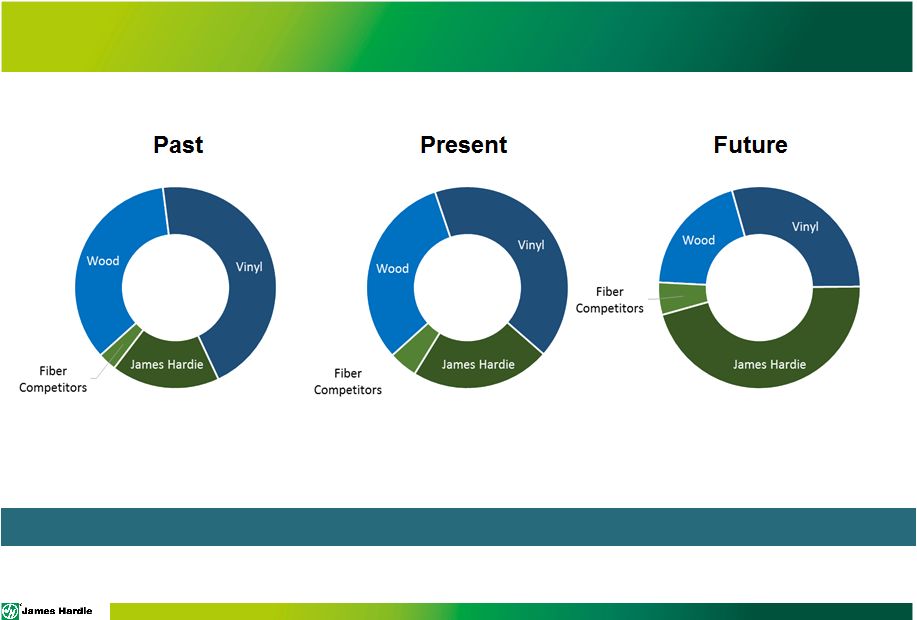 WOOD-LOOK MARKET LANDSCAPE
Past Continued focus on gaining share in the wood-look market Present Future Page 24 Source: Internal estimates based on NAHB product usage data adjusted for regional market intelligence |
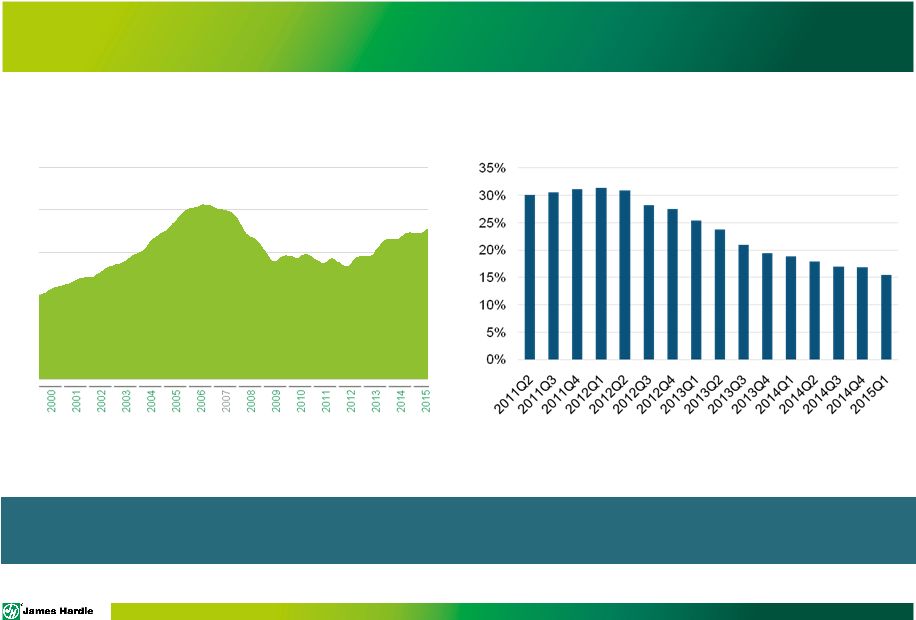
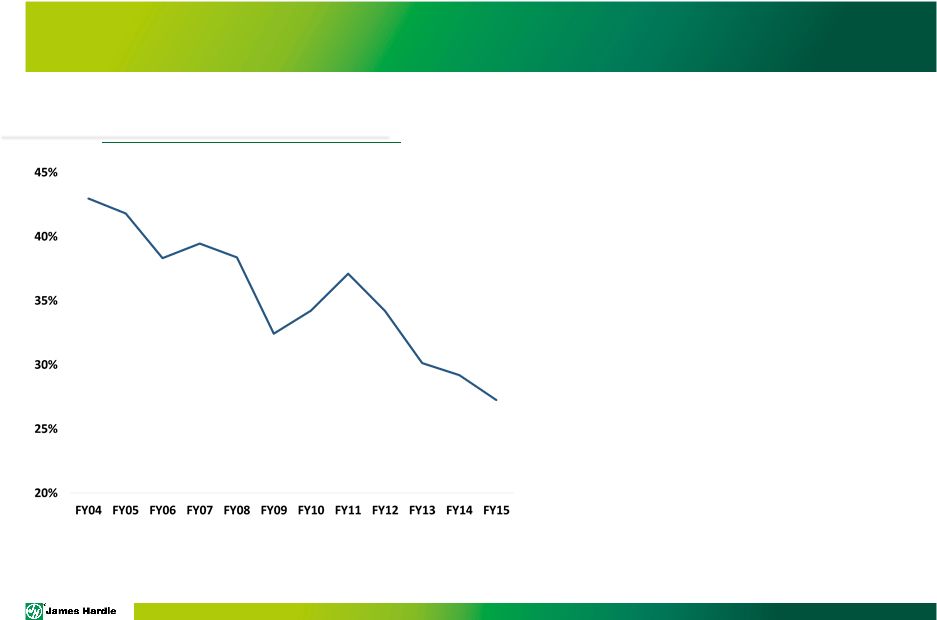 VINYL
SHARE CONTINUES TO DECLINE Source: Internal estimates based on NAHB product
usage data adjusted for regional market intelligence US Vinyl Market
Share Estimate •
While vinyl continues to be the volume-leader in siding, market share has continued to steadily decline. • With the wood-look market maintaining 65-70% market share, vinyl’s decline is the result of gains by fiber cement and wood. Page 25 |
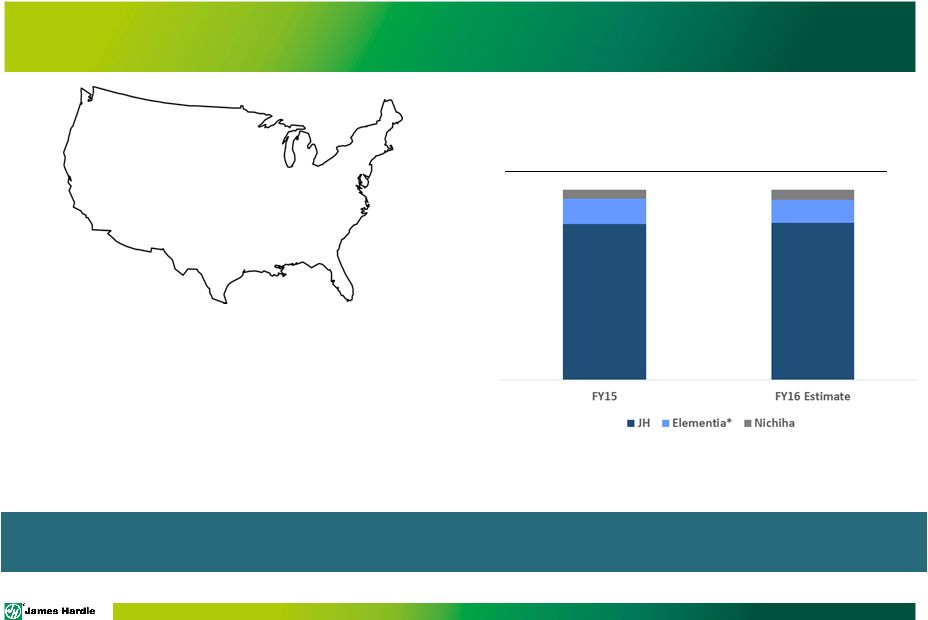 COMPETITIVE FIBER CEMENT
M A A* A N JH JH JH* JH JH JH JH JH JH = James Hardie Plant A = Allura Plant N = Nichiha Plant M = MaxiTile Plant * = Notates Idled Plant Competitive fiber cement plants ran at ~40% capacity in 2014 • Allura / Maxitile estimated capacity at ~35% • Nichiha estimated capacity at ~60% Though competitors have ample capacity to expand in the fiber cement category, James Hardie continues to maintain its category leadership *Allura / Maxitile owned by Elementia Fiber Cement Category Market Share JH Source: Elementia financial filings and internal James Hardie estimates Page 26 |
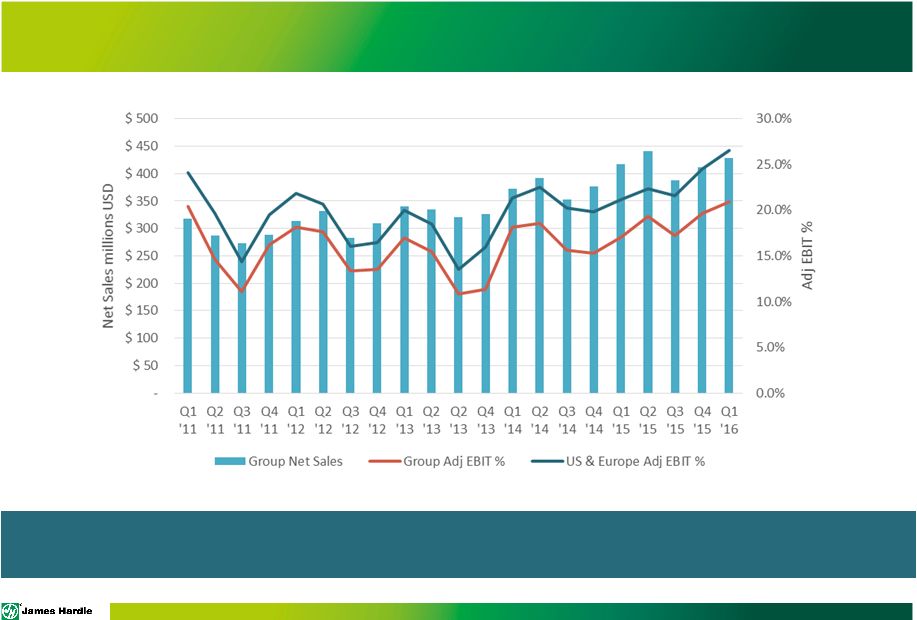 JAMES
HARDIE GROUP AND U.S. & EUROPE SALES AND EBIT PERFORMANCE
Due to strong operational performance, EBIT growth
and margin are in line with expectations
Page 27 |
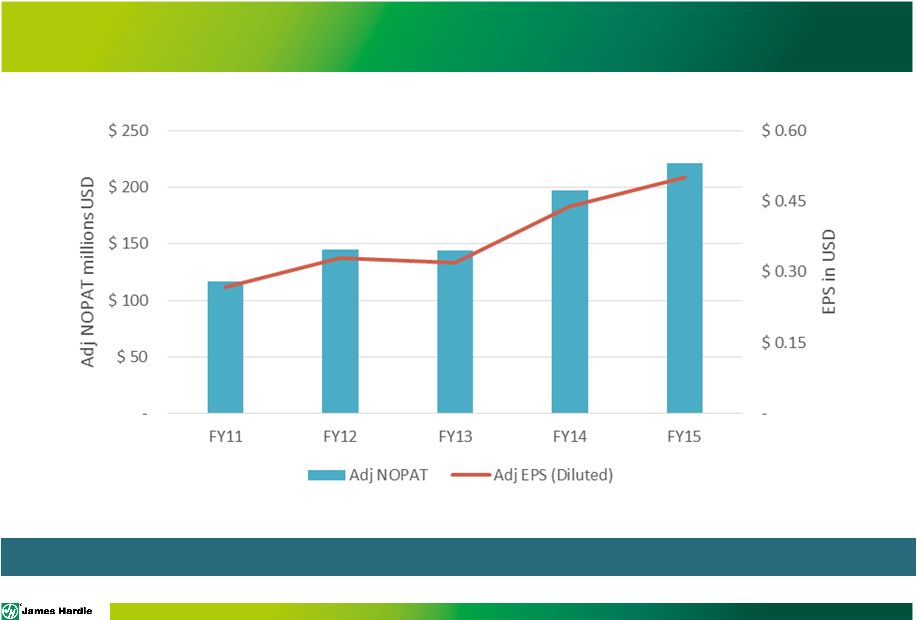 NOPAT AND
EPS PERFORMANCE NOPAT and EPS Growth continue to increase
Page 28 |
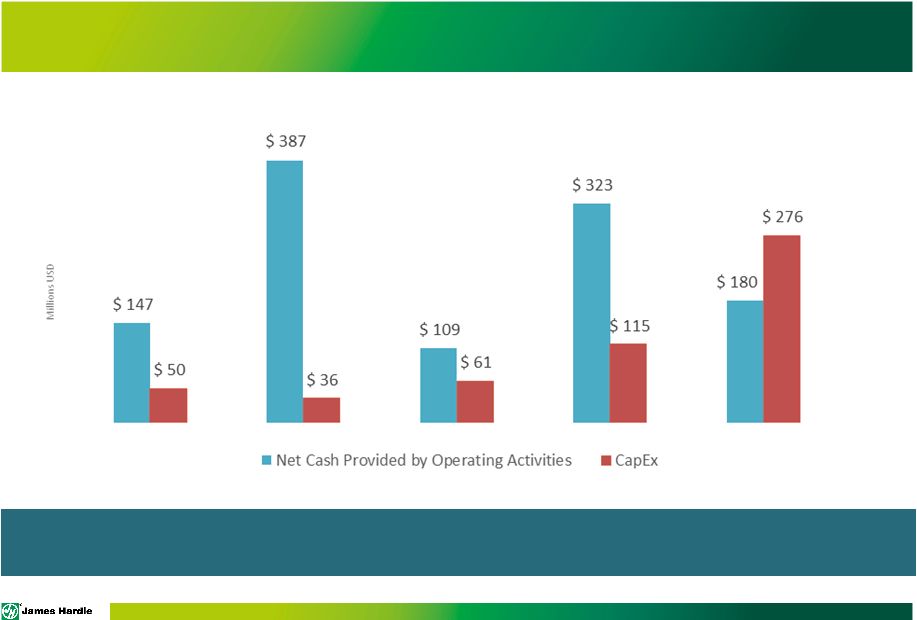 OPERATIONAL CASH FLOW AND CAPEX
Investments in NA and APAC capacity during FY15 largely completed.
CapEx to return to primarily maintenance levels for FY16 and near
term FY11
FY12 FY14 FY15 FY13 Page 29 |
 CAPACITY – ANNUAL DESIGN Historically, our disclosed capacity is based on running a standard 5/16 th inch medium standard product: – No accepted industry standard exists for the calculation of our fiber cement manufacturing facility design and utilization capacities – Based on management’s historical experience with our production process – Good at standardizing capacity additions for comparative purposes – Not reflective of actual capacity based on product mix, which is impacted by product size, thickness, and density Plant Location Owned/Leased Design Capacity (mmsf) Cleburne, Texas Owned 466 Incremental capacity 200 Peru, Illinois Owned 560 Plant City, Florida Owned 300 Incremental capacity 300 Pulaski, Virginia Owned 600 Reno, Nevada Owned 300 Tacoma, Washington Owned 200 Waxahachie, Texas Leased 360 Fontana, California Owned 250 Summerville, South Carolina Owned 190 Total U.S. Network ~3,700 To evaluate capacity, utilization levels, and when incremental capacity will be needed, capacity utilization is determined by using machine hours Page 30 |
 CAPACITY
– GROSS HOURS
Capacity Utilization Determined by Machine
Hours of Active Capacity
Active Capacity % Utilization Cleburne, Texas Peru, Illinois Plant City, Florida Pulaski, Virginia Reno, Nevada Tacoma, Washington Waxahachie, Texas Fontana, California Idle Capacity Cleburne, TX New Plant City, FL New Summerville, SC Idle Actual Machine Hours Total Active Available Hours Capacity Utilization 72% utilization based on gross hours as of 1Q16 72% Page 31 |
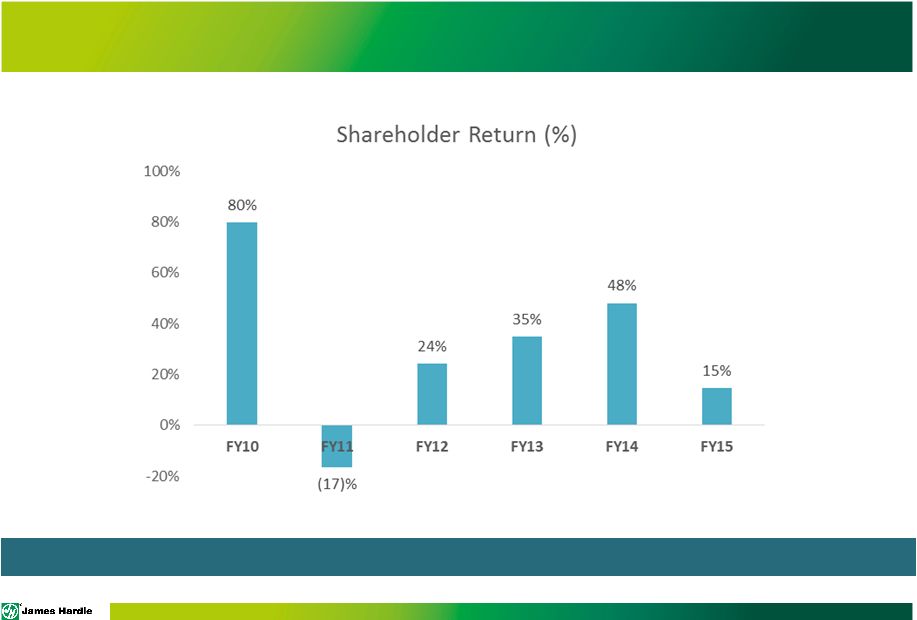 SHAREHOLDER RETURNS 31% average annual Total Shareholder Return since FY10 Page 32 |
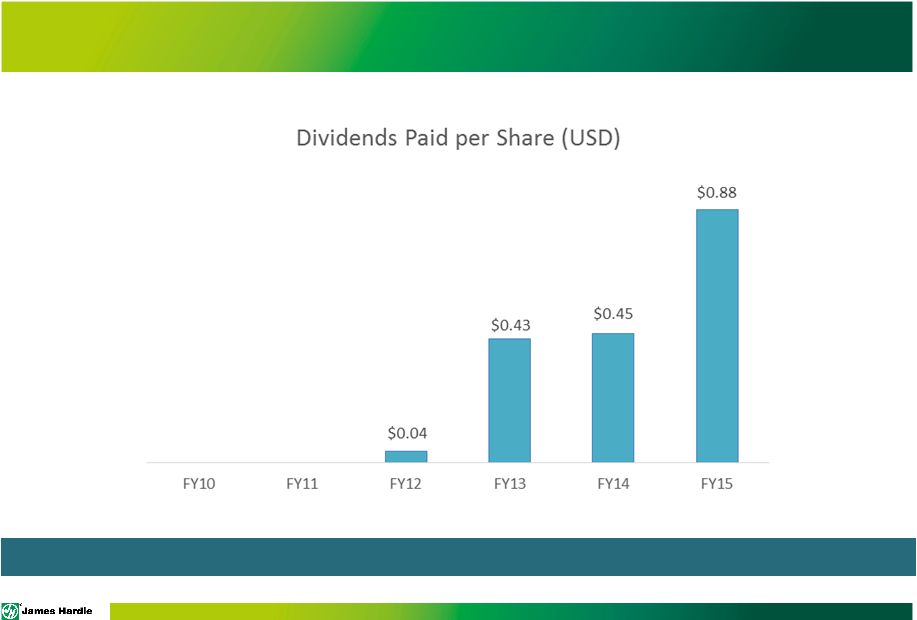 DIVIDENDS
PAID PER SHARE Remain committed to Ordinary Dividend within the Defined
Payout Ratio Page 33 |
 SUMMARY • U.S. housing market continues modest recovery, albeit at a historically slower pace • FY2016 continues to be in line with our guidance provided at the August Q1 FY16 result call, including the assumptions and discussion of: • Volume and PDG • Average Selling Price and Sales • Margins • Balance Sheet and Capital Allocation Page 34 |
 QUESTIONS Page 35 |