 CENTRAL
OPERATIONS September 2015
Exhibit 99.6 |
| CENTRAL
OPERATIONS September 2015
Exhibit 99.6 |
 PAGE DISCLAIMER FORWARD-LOOKING STATEMENTS This Investor Presentation contains forward-looking statements. James Hardie Industries plc (the “company”) may from time to time
make forward-looking statements in its periodic reports filed with or
furnished to the Securities and Exchange Commission, on Forms 20-F and 6-K, in its annual reports to shareholders, in offering circulars, invitation memoranda and prospectuses, in media releases and other written materials and in oral statements made by the company’s officers, directors or employees to
analysts, institutional investors, existing and potential lenders,
representatives of the media and others. Statements that are not historical facts are forward-looking statements and such forward-looking statements are statements made pursuant to the Safe Harbor Provisions of the Private Securities Litigation Reform Act of 1995.
Examples of forward-looking statements include:
• statements about the company’s future performance; • projections of the company’s results of operations or financial condition; • statements regarding the company’s plans, objectives or goals, including those relating to strategies, initiatives, competition, acquisitions, dispositions and/or its products; • expectations concerning the costs associated with the suspension or closure of operations at any of the company’s plants and future plans
with respect to any such plants; •
expectations concerning the costs associated with the significant capital expenditure projects at any of the company’s plants and future plans with respect to any such projects; • expectations regarding the extension or renewal of the company’s credit facilities including changes to terms, covenants or
ratios; •
expectations concerning dividend payments and share buy-backs;
• statements concerning the company’s corporate and tax domiciles and structures and potential changes to them, including potential tax
charges; •
statements regarding tax liabilities and related audits, reviews and
proceedings; •
expectations about the timing and amount of contributions to Asbestos Injuries
Compensation Fund (AICF), a special purpose fund for the compensation of proven Australian asbestos-related personal injury and death claims; • expectations concerning indemnification obligations; • expectations concerning the adequacy of the company’s warranty provisions and estimates for future warranty-related costs;
• statements regarding the company’s ability to manage legal and regulatory matters (including but not limited to product liability,
environmental, intellectual property and competition law matters) and to
resolve any such pending legal and regulatory matters within current estimates and in anticipation of certain third-party recoveries; and • statements about economic conditions, such as changes in the US economic or housing recovery or changes in the market conditions in the Asia Pacific region, the levels of new home construction and home renovations, unemployment levels, changes in consumer income, changes or stability in housing values, the availability of mortgages and other financing, mortgage and other interest rates, housing affordability and supply, the levels of foreclosures and home resales, currency exchange rates, and builder and consumer confidence. |
 PAGE DISCLAIMER (continued) Words such as “believe,” “anticipate,” “plan,” “expect,” “intend,” “target,”
“estimate,” “project,” “predict,” “forecast,” “guideline,” “aim,” “will,” “should,” “likely,” “continue,” “may,” “objective,”
“outlook” and similar expressions are intended to identify
forward-looking statements but are not the exclusive means of identifying such statements. Readers are cautioned not to place undue reliance on these forward-looking statements and all such forward-looking statements are qualified in their entirety by reference
to the following cautionary statements. Forward-looking statements are
based on the company’s current expectations, estimates and assumptions and because forward-looking statements address future results, events and conditions, they, by their very nature, involve inherent risks and uncertainties, many of which are unforeseeable and beyond the company’s control. Such known and unknown risks, uncertainties and other factors may cause actual results, performance or other achievements to differ materially from the anticipated results,
performance or achievements expressed, projected or implied by these
forward-looking statements. These factors, some of which are discussed under “Risk Factors” in Section 3 of the Form 20-F filed with the Securities and Exchange Commission on 21 May 2015, include, but are not limited to: all matters relating to or arising out of the prior manufacture of products
that contained asbestos by current and former company subsidiaries;
required contributions to AICF, any shortfall in AICF and the effect of currency exchange rate movements on the amount recorded in the company’s financial statements as an asbestos liability; governmental loan facility to AICF; compliance with and changes in tax laws and treatments; competition and product pricing in the markets in which the company operates; the consequences of product failures or defects; exposure to environmental, asbestos, putative consumer class action or other
legal proceedings; general economic and market conditions; the supply and
cost of raw materials; possible increases in competition and the potential that competitors could copy the company’s products; reliance on a small number of customers; a customer’s inability to pay; compliance with and changes in environmental and health and safety laws; risks of
conducting business internationally; compliance with and changes in laws
and regulations; the effect of the transfer of the company’s corporate domicile from the Netherlands to Ireland, including changes in corporate governance and any potential tax benefits related thereto; currency exchange risks; dependence on customer preference and the concentration of the company’s
customer base on large format retail customers, distributors and dealers;
dependence on residential and commercial construction markets; the effect of adverse changes in climate or weather patterns; possible inability to renew credit facilities on terms favorable to the company, or at all; acquisition or sale of businesses and business segments; changes in the
company’s key management personnel; inherent limitations on internal
controls; use of accounting estimates; and all other risks identified in the company’s reports filed with Australian, Irish and US securities regulatory agencies and exchanges (as appropriate). The company cautions you that the foregoing list of factors is not exhaustive and that other risks and
uncertainties may cause actual results to differ materially from those
referenced in the company’s forward-looking statements. Forward-looking statements speak only as of the date they are made and are statements of the company’s current expectations concerning future results, events and conditions. The company assumes no obligation to update any forward-looking
statements or information except as required by law.
|
 PAGE AGENDA • Introduction & Org Overview • JH Manufacturing Advantage • Capacity Update • JH Supply Chain Advantage • Freight & Procurement Update 4 |
 PAGE CENTRAL OPERATIONS ORGANIZATION Raw Materials to Customer Integration: – Procurement – Production/Capacity Planning – Outbound Freight – Distribution Management (VMI) – Customer Operations – Supply Chain Strategy 5 Supply Chain Central Operations Key Shared Manufacturing Capabilities: – Long-Term Capacity Planning – Greenfield Plant Design – Reliability Engineering – Process Control – Post-Autoclave Engineering – Core Engineering Development Centralized Manufacturing |
 JH
MANUFACTURING |
 PAGE JH MANUFACTURING OVERVIEW JH manufacturing: Major lever in our competitive advantage 7 Proprietary technology delivers unit cost & ROCE advantage Innovation in process capability enables product leadership Unique throughput advantage in our Hatscheck manufacturing Engineered scale creates labor and capital advantage Flexible manufacturing achieves low unit cost through market cycles Process capability to deliver innovative product differentiation Innovation approach delivers speed to market advantage Network flexibility creates delivered cost advantage |
 PAGE MANUFACTURING PROCESSES PROCESS TECHNOLOGY SEGMENTS MANUFACTURING APPROACH 8 Pre-Autoclave Post-Autoclave Manufacturing Process Continuous Process Raw Material Conversion Key Process Objectives Material handling Coatings application Long Continuous runs Raw material yield Optimize coating yield Inventory Model Make-to-Inventory Mix of Make-to-Inventory & Make-to-Order |
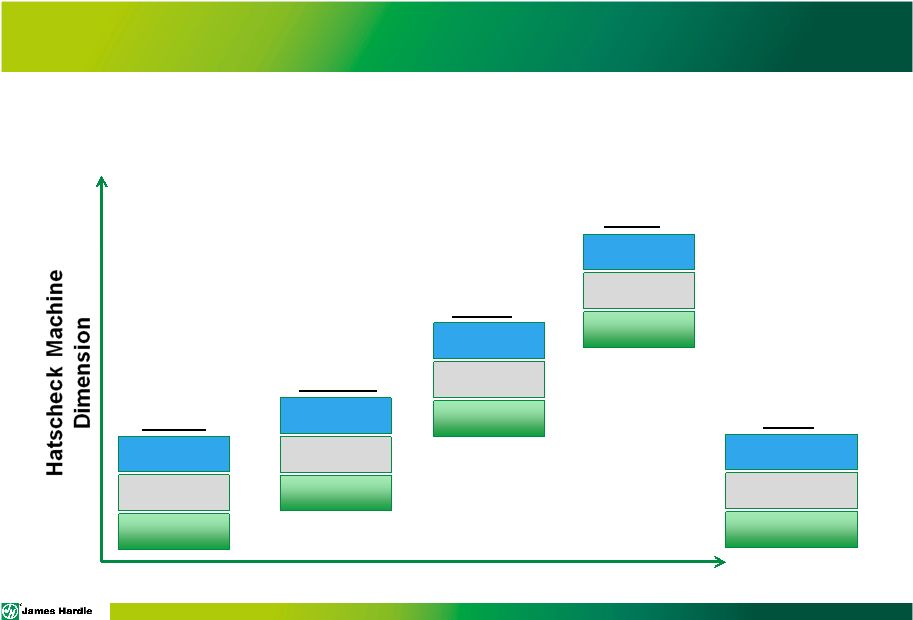 PAGE JH MANUFACTURING SCALE EVOLUTION A culture of engineering step-change has yielded a tremendous increase in manufacturing scale 9 Equipment Automation 4’x4-tub Manual Manual Fontana 4’x5-tub Auto Manual Plant City 5’x6-tub Auto Auto Tacoma 5’x9-tub Auto+ Auto Pulaski Tub Config Finishing Interleaver Labels |
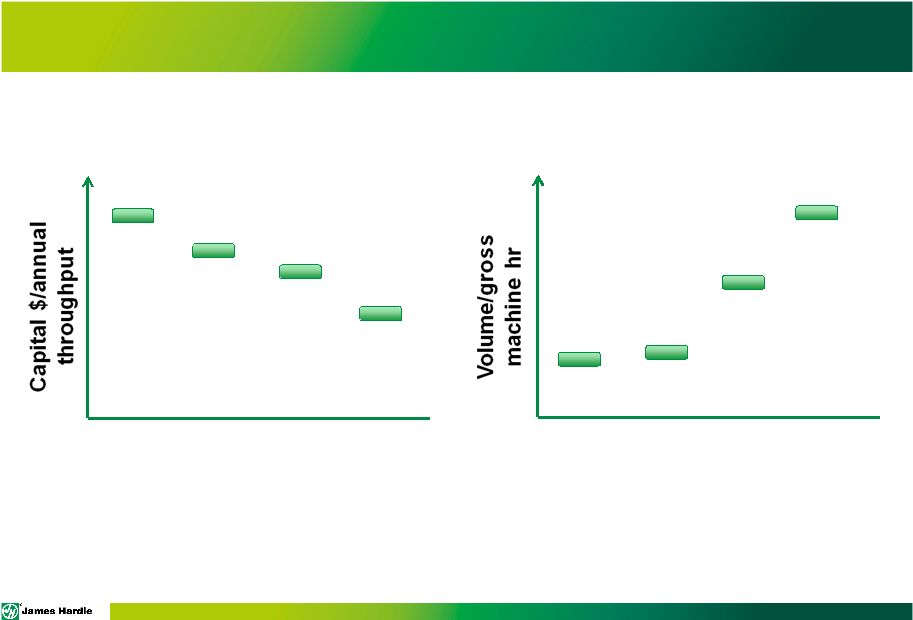 PAGE SCALE AS A COMPETITIVE ADVANTAGE Manufacturing scale creates a significant competitive advantage 10 Fontana Plant City Tacoma Pulaski Fontana Plant City Tacoma Pulaski Capital Efficiency Unmatched by Competitors Machine Size & Automation Yields High Labor Efficiency |
 PAGE JH MANUFACTURING ADVANTAGE Internally developed process capability enables product differentiation 11 Product thickness and density control HardieTrim ® and Artisan product lines Fit-to-purpose manufacturing processing HardieZone ® Engineered for Climate Post-processing engineering HardieShingle ® Coatings application expertise ColorPlus ® Technology |
 PAGE MANUFACTURING ADVANTAGE SUMMARY • Step change engineering focus has delivered a substantial manufacturing scale advantage • Constant investment in manufacturing process capabilities enable our product differentiation • Flexibility in manufacturing & capacity model allow for cost advantage through market cycles 12 |
 JH
MANUFACTURING CAPACITY |
 PAGE JH CAPACITY PHILOSOPHY CORE CONCEPTS OF OUR MANUFACTURING CAPACITY PHILOSOPHY: 14 Enable 35/90 by ensuring market supply ahead of demand Invest in capacity that maximizes value creation Commission new capacity to optimize network costs |
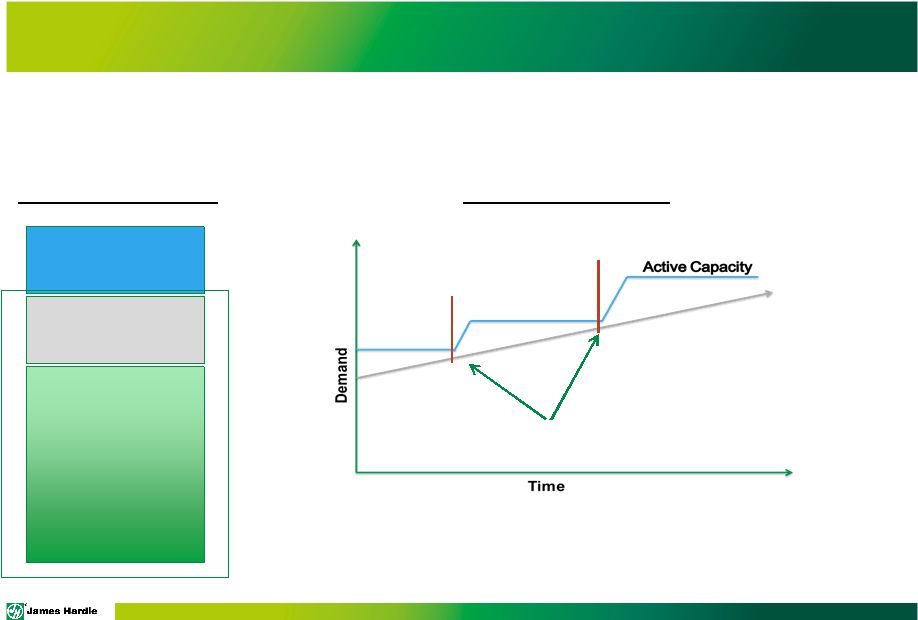
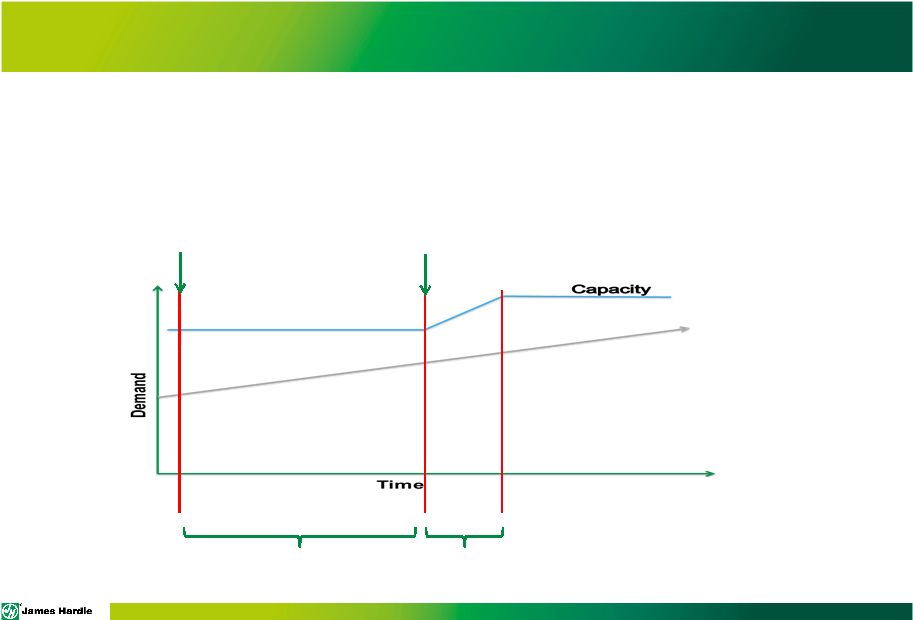 PAGE ENSURING MARKET SUPPLY LONG-TERM CAPACITY PLANNING Our trigger to invest in new capacity is designed to buffer demand uncertainty over our design/construction/commission period 15 85% utilization threshold hit Decision Point Construction Commission Demand |
 PAGE JH CAPACITY TYPES As a result, we manage several different types of capacity: 16 Active 30-day “flex” lead-time Not Commissioned Idled & New 90-day start-up lead- time 18-24 month construction lead-time Capacity Category Time to Mobilize Network Examples Summerville Next Greenfield Cleburne SM3 Plant City SM4 Peru SM1 & SM2 Pulaski SM1 & SM2 Tacoma SM1 Used in our Short- Term Capacity Management Process |
 PAGE SHORT-TERM CAPACITY MANAGEMENT APPROACH IN OUR SHORT-TERM CAPACITY PLANNING, ACTIVE & NOT COMMISSIONED CAPACITY ENABLES A HIGH UTILIZATION TARGET 17 Active Not Commissioned Idled & New Capacity Category Utilization Triggers Targeting high network utilization optimizes total network cost while guaranteeing supply Quick ramp-ups enable a high (95%) network utilization threshold Decision Point Decision Point |
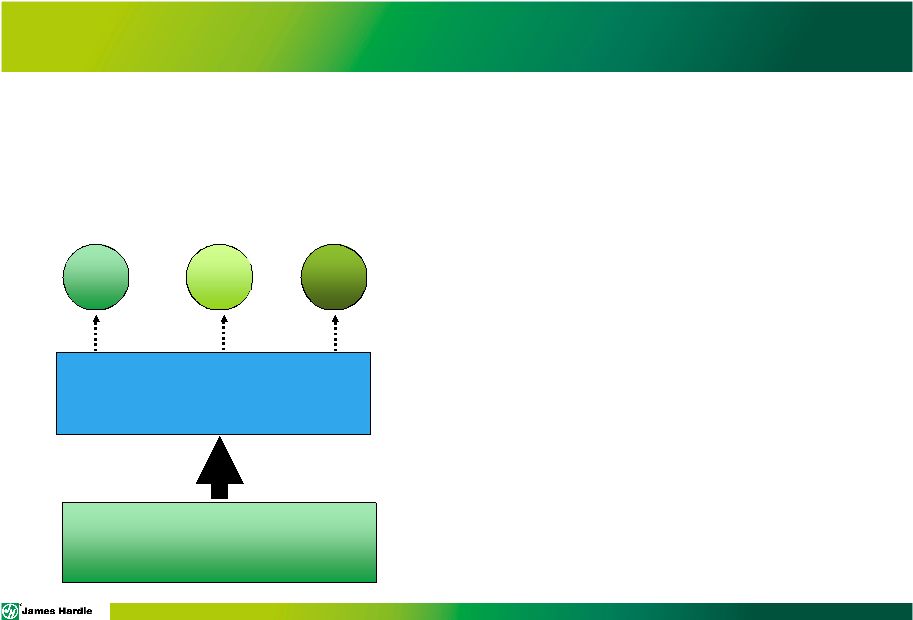
 PAGE HOW WE MEASURE UTILIZATION OUR UTILIZATION METRIC CONSIDERS THE ACTIVE CAPACITY BUCKET ONLY 18 Active Not Commissioned Idled & New Capacity Category Available manufacturing included in our current network utilization calculation Manufacturing capacity that is not yet capable of producing product is NOT included in our network utilization calculation |
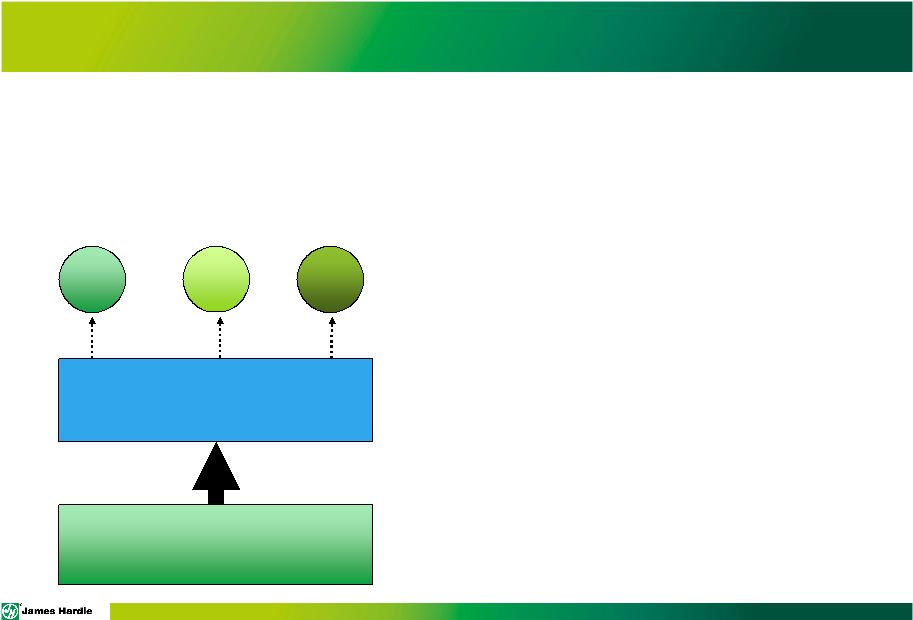
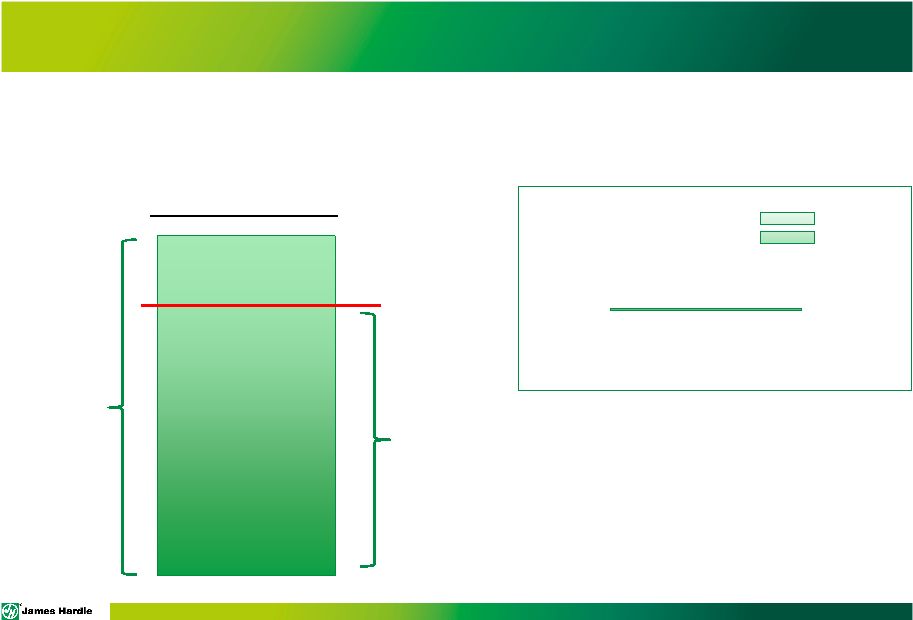 PAGE HOW WE CALCULATE UTILIZATION OUR UTILIZATION METRIC IS CALCULATED BASED ON GROSS HOURS OF OUR “ACTIVE” CAPACITY 19 Active Capacity Category Current % utilization 100% of available machine hours Consumed gross hours JH Utilization Consumed gross hours 100% of available machine hours |
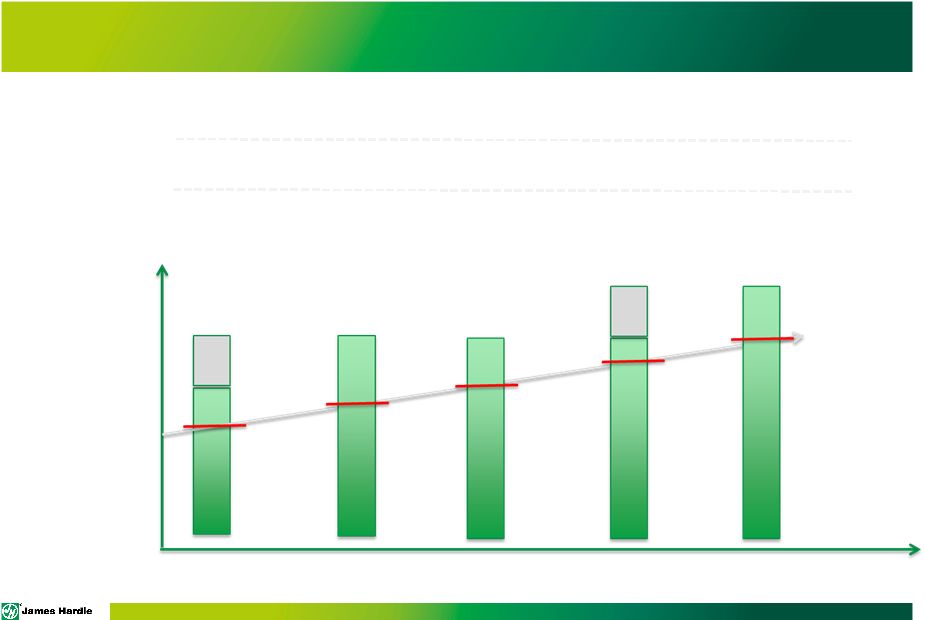 PAGE EXAMPLE CAPACITY ADD SEQUENCE 20 No Active Utilization New Capacity Build Triggered Line Commissioned 88% No Yes 95%/78% Yes – year 3 No 84% No No 93% Yes 95%/84% Yes – year 6 Yes – year 5 Year 0 Year 1 Year 2 Year 3 Year 4 |
 PAGE OUTLOOK ON NEW CAPACITY TIMING Based on the this logic, our current outlook for capacity start-ups is: 21 Actual start-up dates are highly sensitive to: market growth, JH PDG performance, & product-specific capability requirements MANUFACTURING CAPACITY EXPECTED COMMISSIONING PLANT CITY SM4 FY17 – FY18 CLEBURNE SM3 FY18 – FY19 SUMMERVILLE SM1 FY19 – FY21 TACOMA SM2 FY19 – FY22 |
 PAGE HEADWINDS TO CAPITAL EFFICIENCY SEVERAL FACTORS ARE DRIVING UP THE COST TO CONSTRUCT NEW CAPACITY 22 Increasing regulatory requirements in air & water Manufacturing processes to continue differentiation Inflationary pressure in install & engineering labor We have recently begun several initiatives to off-set these costs |
 PAGE CAPITAL EFFICIENCY EXAMPLE: GREENFIELD CAPACITY INITIATIVE We have recently resourced a team to off-set these cost headwinds 23 Greenfield Capacity Initiative Value Engineering Product Selection Process Selection |
 PAGE MANUFACTURING ADVANTAGE SUMMARY • We are committed to ensuring product supply and will continue to invest ahead of demand • Our short-term capacity management program targets high active utilization • We are resourcing programs to maintain our capital efficiency advantage 24 |
 JH
SUPPLY CHAIN ADVANTAGE |
 PAGE JH SUPPLY CHAIN OVERVIEW 26 Procurement Network Planning Outbound Freight Channel Management Production Scheduling Customer Experience A fully integrated value chain that begins with customer value creation… ...and has capabilities that create a substantial competitive advantage: • Highly integrated customer/channel relationships • To-the-piece order flow, manufacturing and delivery capability • Automated production scheduling that leverages manufacturing scale • Flexible network model providing redundancy and optimal landed cost |
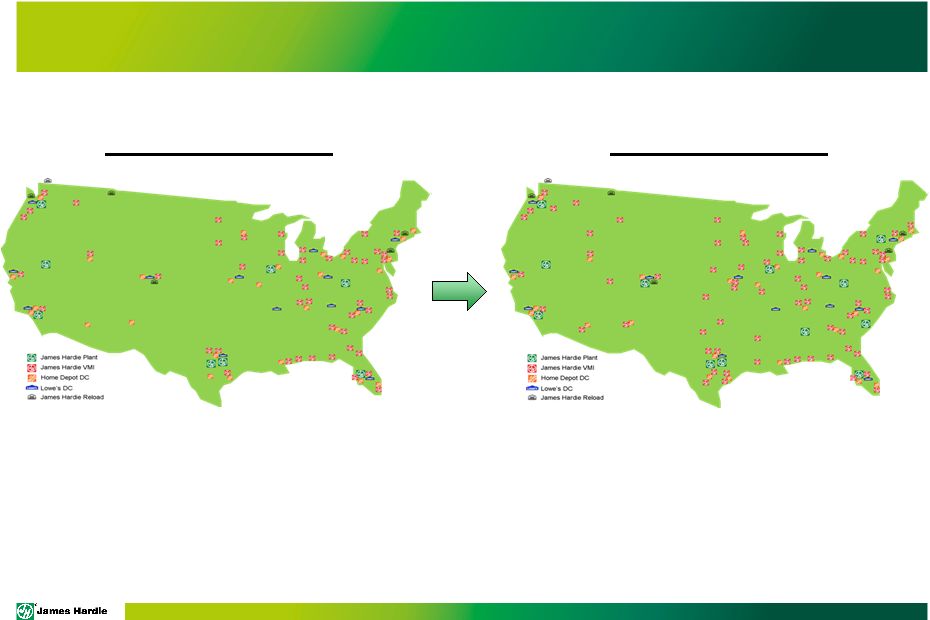 PAGE JH SUPPLY CHAIN SCALE ADVANTAGE 27 JH Network – Today JH Network – 35/90 *Specific locations subject to change |
  PAGE Enable access to differentiated products
across all customer segments
JH SUPPLY CHAIN OBJECTIVES
28 James Hardie Custom Builder Production Builder R&R Contractor Leverage JH manufacturing and freight scale and capability advantage Minimize “total supply chain cost” through
the entire channel JH SUPPLY CHAIN CREATES CUSTOMER VALUE WHILE OPTIMIZING TOTAL VALUE CHAIN COSTS Aligned Channel |
 PAGE Enable access – The entire ColorPlus ® product range at an unmatched lead time SUPPLY CHAIN ADVANTAGE: JOBPACK EXAMPLE 29 Aligned Channel James Hardie Custom Builder Production Builder R&R Contractor Optimize JH manufacturing and freight - automated order flow and truck routing that significantly minimize the “less-than-full” pallet/truck penalty Minimize “total supply chain cost” removes the
need for channel inventory on “the tail”
JOBPACKS: TO-THE-PIECE COLORPLUS ® HOUSE PACKS DELIVERED VIA LTL FREIGHT IN 8 DAYS |
 PAGE JH SUPPLY CHAIN – CAPABILITY ADVANTAGE (HardieLink ® ) Automated Order Taking Software (JDA) Sequential low cost tendering for delivery (APO) Optimization Planning Software builds & aggregates large production runs (APO) System
Generates VMI Replenishments Trucks (JDA) TMS Software
combines job packs
and VMI replenishments to optimize truck weight and multi-stop routing HIGHLY AUTOMATED, INTEGRATED SYSTEMS Enable Customer Integration Leverage & Exploit Manufacturing Scale Optimize Delivered Cost with Freight/Sourcing 30 |
 OPTIMIZING SUPPLY CHAIN
COSTS |
 PAGE JH TRANSPORTATION: OUR APPROACH TO FREIGHT CORE CONCEPTS OF OUR APPROACH TO FREIGHT: 32 We optimize much of our network around freight We manage to detailed performance metrics on controllable cost drivers Freight is a commodity – the spot market is an advantage for us |
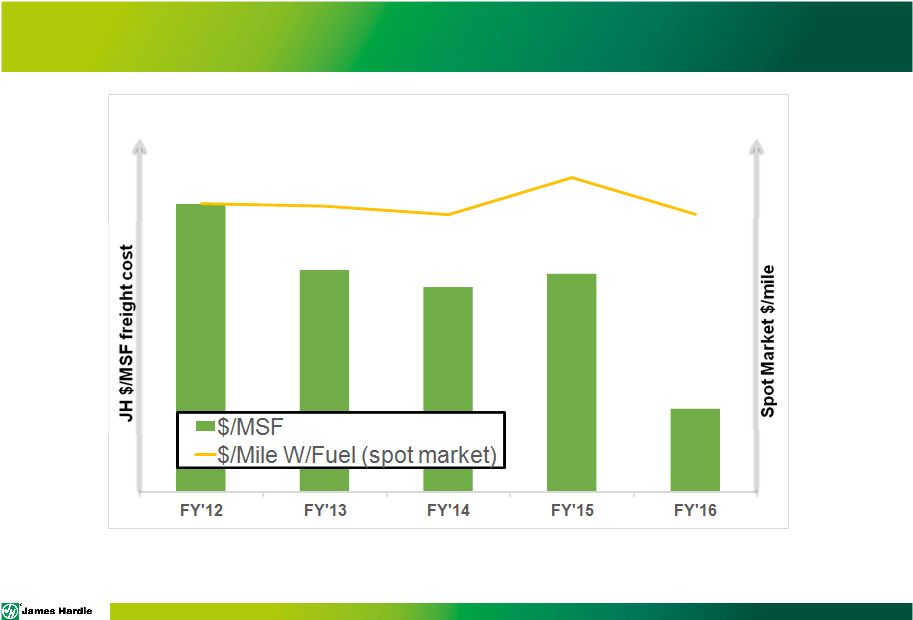 PAGE JH FREIGHT COST VS THE MARKET (FY12 – CURRENT) 33 Source: DAT Rateview (Spot market $/Mile W/Fuel) |
 PAGE FY12 – FY16 PERFORMANCE IMPROVEMENT LEVERS 34 Truckload Utilization Result Achieved 5.5% increase How Optimized replenishment to VMI sites Order parameters that maximize value for the entire value chain Targeted “above market” lane program Carrier Sourcing: Truckload Purchasing Network Design: Mode & Routing Optimiziation >25% savings vs. published contract rates2 1 Source: DAT Rateview 2 Source: DAT Rateview: Jul ’14 – Jul ’15 Leverage JH internal brokerage Backhaul programs with aligned channel partners 14% reduction in average truckload haul1 Automated job pack order consolidation and routing 150% increase in rail mode utilization Controllable Area |
 PAGE FREIGHT SUMMARY AND OUTLOOK • JH will continue YOY improvement in controllable areas • In FY16 we are benefitting from a favorable operating environment in both supply/demand and fuel costs • While the current operating environment is soft, our future state thinking on freight is impacted by the following realities: • Regulatory changes that reduce driver capacity • Demographic shifts, resulting in fewer drivers in workforce • Uncertain economic climate which limits capacity investments 35 |
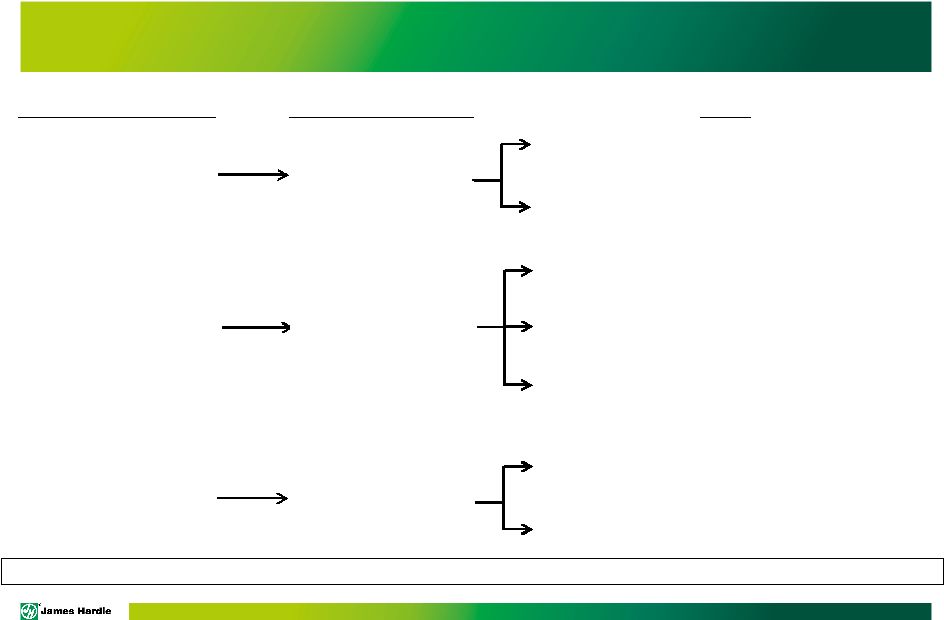
 PAGE PROCUREMENT APPROACH WE HAVE TWO PRIMARY OBJECTIVES FOR OUR PROCUREMENT PROCESSES 36 Ensure long-term supply Optimize pricing power on scale & JH value proposition Strategic partnerships in select commodity categories Management capability to offset supply risk R&D capability to create alternative sourcing options Industry analysis to quantify JH value as a customer Leverage spot markets to increase pricing pressure Strategic vertical integration to key commodity categories |
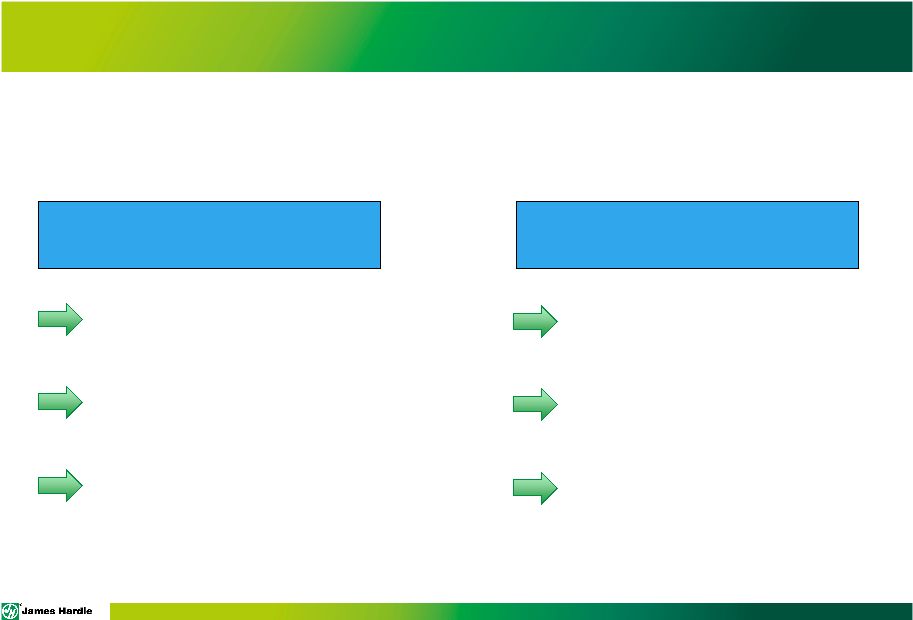
  PAGE CEMENT: UNDERSTANDING OUR VALUE AS A CUSTOMER Supply/demand dynamics are driving increased pricing in all regions 37 Ready Mix Producer James Hardie Low Sales SG&A Requirement Consistent, Predictable Demand 365-Day Buying Finishing Efficiency Formulation Quantifying the value of our of our business and leveraging in supply agreements Leveraging our R&D capability to minimize a “formulation penalty” |
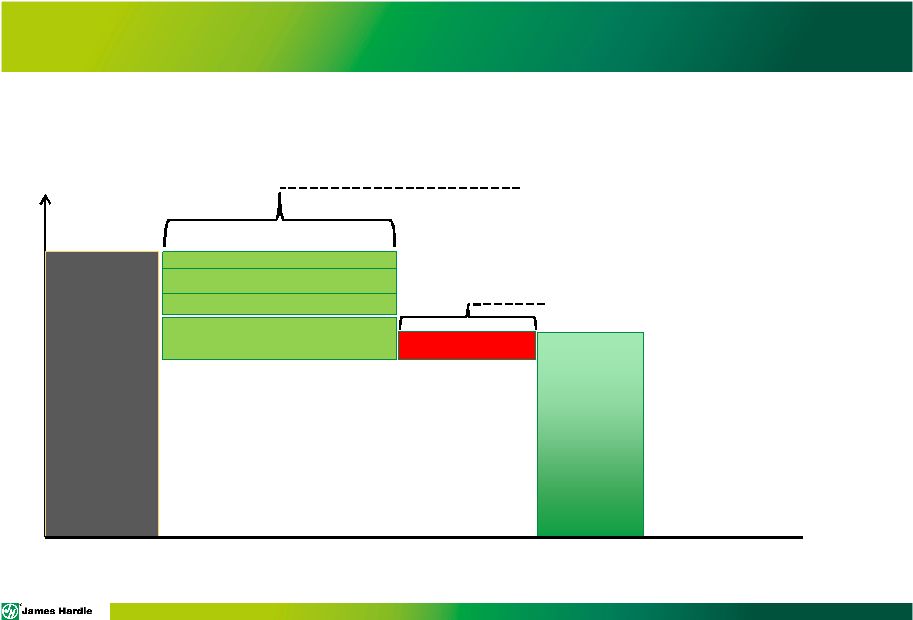
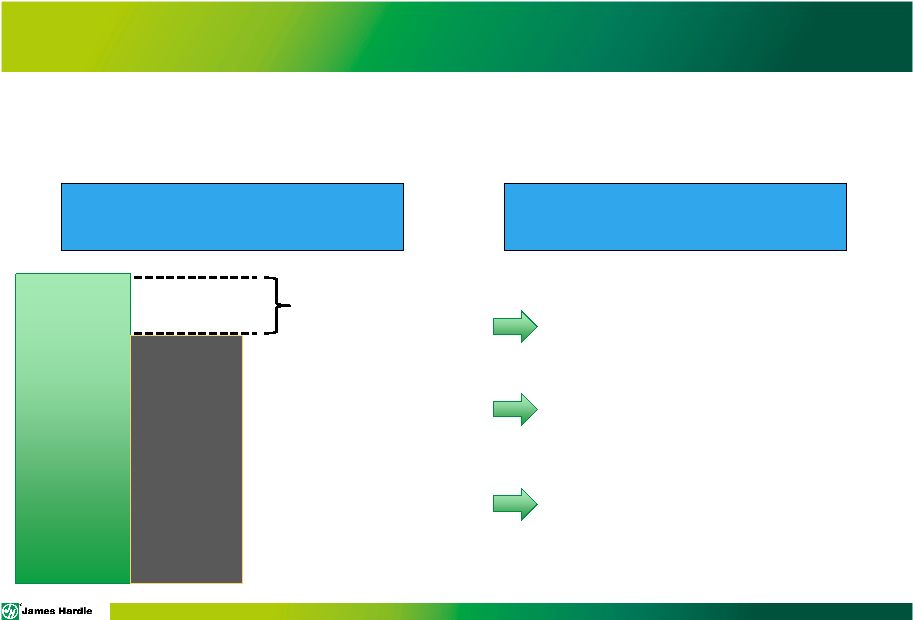 PAGE PULP: COMPETITIVE PRESSURE & SUPPLY CHAIN EFFICIENCIES Our long-term pulp supply is secured through contracts with strategic partners. Within those agreements, we are focused on cost optimization 38 JH Total Pulp Required Minimum Contract Volumes Spot Market Development Increasing Competition Total Supply Chain Costs Rail-direct shipments remove the need for transloading Improved planning removing JH and supplier warehouse operations Formulation optimizing to minimize supplier production cost |
 PAGE SUPPLY CHAIN SUMMARY • Supply Chain is a strategic area focused on value creation for our customers • We have substantial operating capabilities that enable optimized delivered cost through the entire value chain • We continue to be focus on elevating our controllable performance to market through all market conditions 39 |
 PAGE QUESTIONS 40 |